Three Flow Features behind the Flow Control Authority of DBD Plasma Actuator: Result of High-Fidelity Simulations and the Related Experiments


Department of Information and Computer Technology, Tokyo University of Science, 6-3-1 Niijuku, Katsushika-ku, Tokyo 125-8585, Japan
Appl. Sci. 2018, 8(4), 546; https://doi.org/10.3390/app8040546
Submission received: 16 January 2018
/
Revised: 24 March 2018
/
Accepted: 27 March 2018
/
Published: 2 April 2018
(This article belongs to the Special Issue Active Flow Control Technologies for Energy and Propulsive Systems)
Abstract
:Both computational and experimental studies are conducted for understanding of the flow separation control mechanism of a DBD (dielectric barrier discharge) plasma actuator. Low speed flows over an airfoil are considered. A DBD plasma actuator is attached near the leading edge of an airfoil and the mechanism of flow control of this small device is discussed. The DBD plasma actuator, especially in burst mode, is shown to be very effective for controlling flow separation at Reynolds number of 6.3 × 10⁴, when applied to the flows at an angle of attack higher than the stall. The analysis reveals that the flow structure includes three remarkable features that provide good authority for flow separation control with the appropriate actuator parameters. With proper setting of the actuator parameters to enhance the effective flow features for the application, good flow control can be achieved. Based on the analysis, guidelines for the effective use of DBD plasma actuators are proposed. A DBD plasma actuator is also applied to the flows under cruise conditions. With the DBD plasma actuator attached, a simple airfoil turns out to show higher lift-to-drag ratio than a well-designed airfoil.
1. Introduction
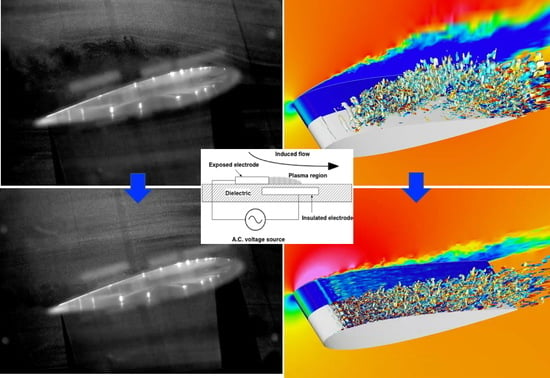
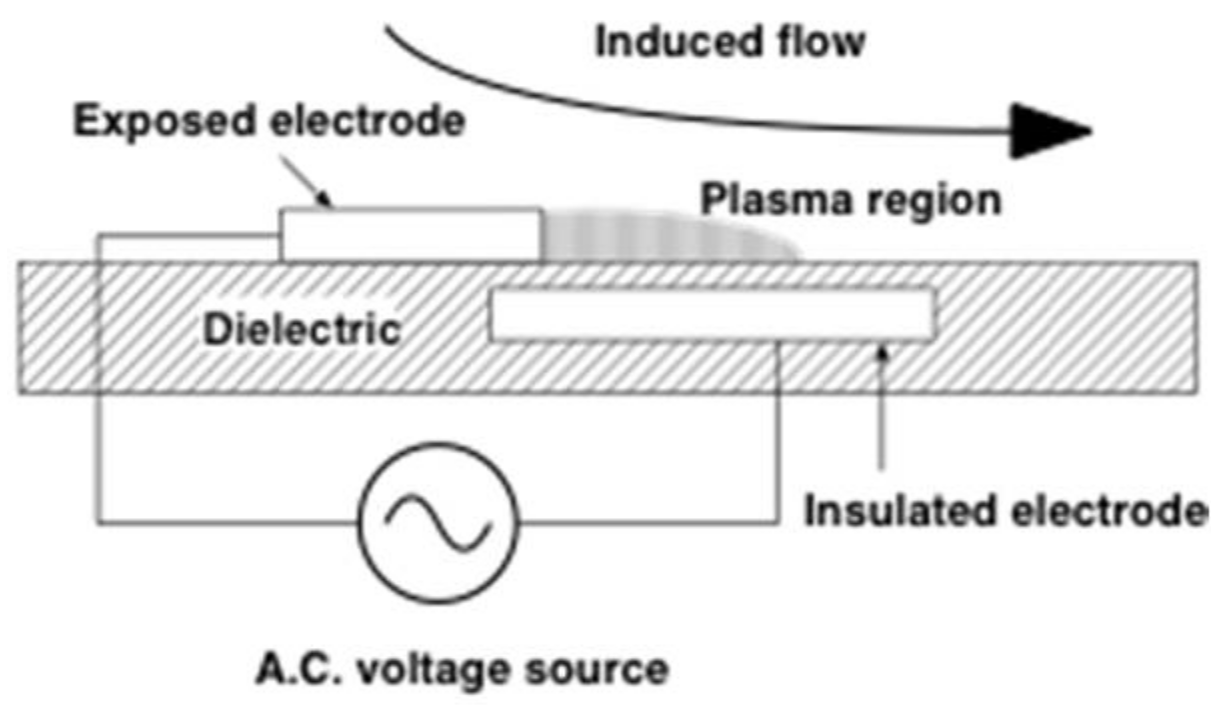
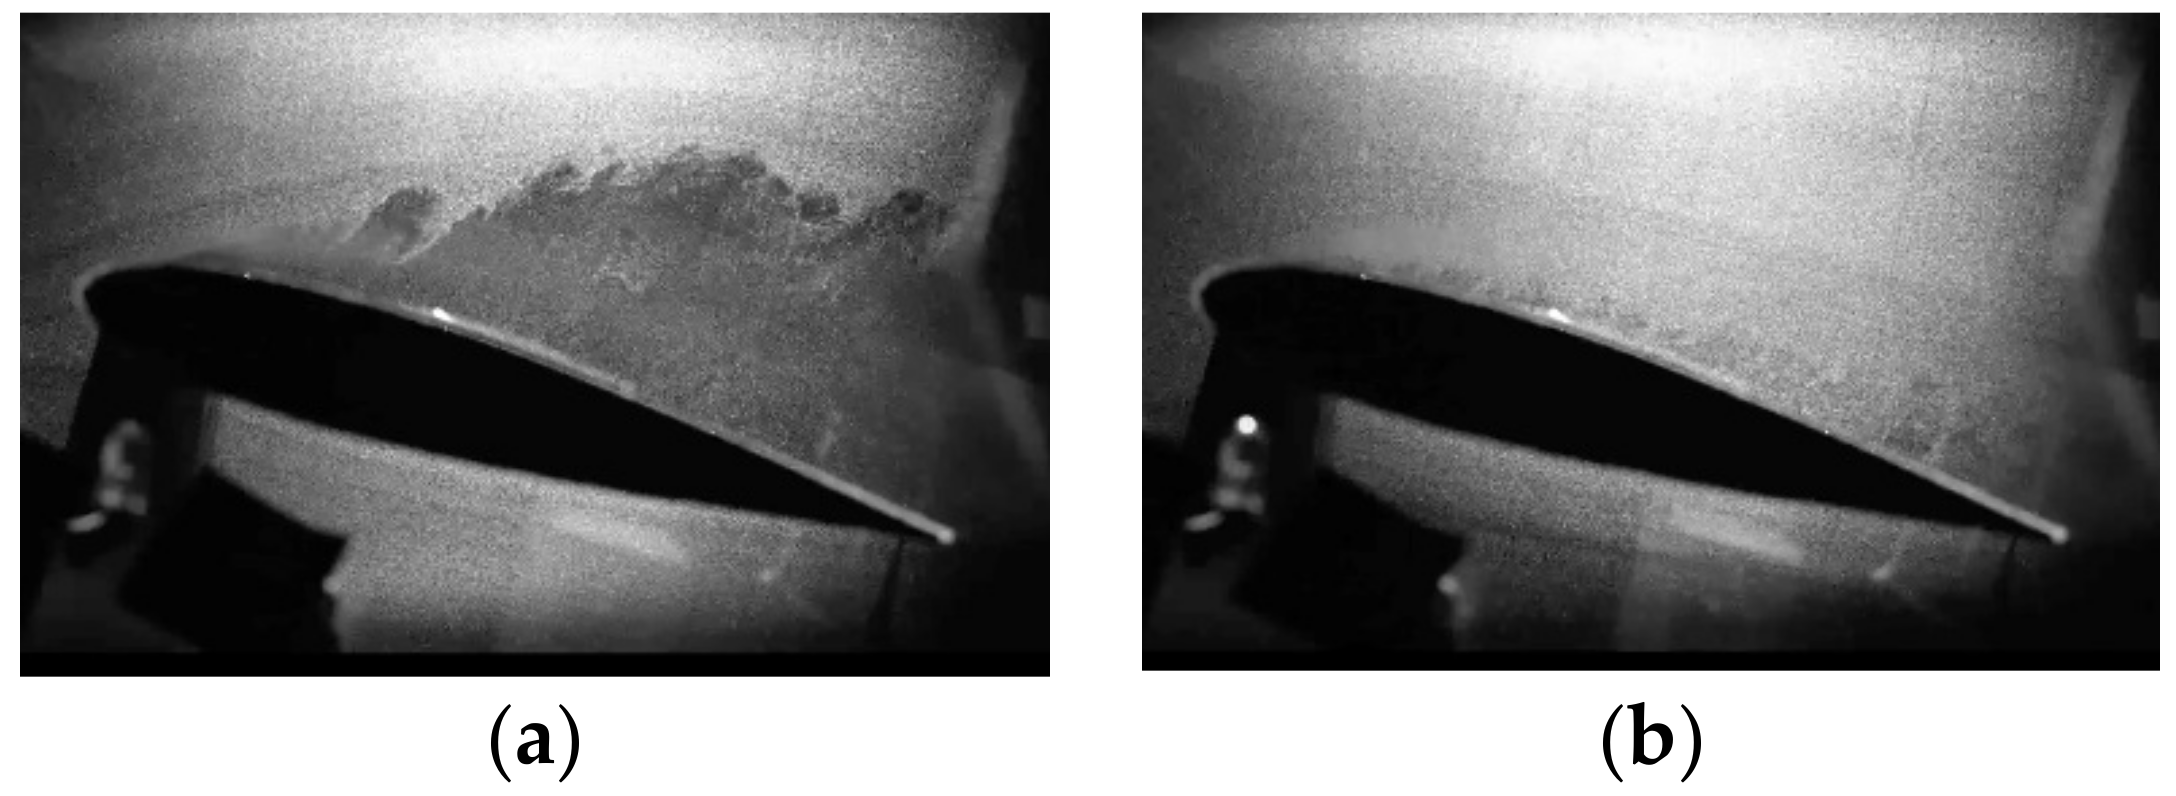
Flow separation is a common phenomenon in many industrial applications, including transportation vehicles and rotating machinery. Flow separation control has been an interesting topic in fluid dynamic study for many years, since flow separation leads to remarkable drag increase and/or lift changes with strong flow unsteadiness. As flow separation is a critical phenomenon for aircraft, flow separation control over airfoils is an important application. Among many compact devices that were recently developed, DBD plasma actuators are recently developed and have been shown to be very effective for flow separation control over airfoils [1,2,3,4]. A DBD plasma actuator comprises two thin electrodes with a dielectric sandwiched between them (Figure 1) and is easily attached to an airfoil surface. The plasma actuator induces a weak jet-like flow (with a maximum speed of a few meters per second in general) in a small region near the airfoil surface as a result of ion motion in the plasma due to dielectric barrier discharge phenomenon induced by the high alternating current (AC) voltage applied on the electrodes. Both the experimental and computational analysis showed that this device is very effective for flow separation control at the Reynolds numbers less than 105 [5,6,7,8,9,10,11]. Figure 2 shows an example. “DBD-PA OFF” means that no voltage is applied to the DBD plasma actuator, and “DBD-PA ON” means that a high voltage is applied. The pictures in Figure 2 were taken in a low speed wind tunnel experiment with an NACA0015 airfoil with the chord length of 0.1 m in a freestream velocity of 10.0 m/s. The Reynolds number was 6.3 × 10⁴. The two pictures in Figure 2 show that the DBD plasma actuator changes fully separated flows at the leading edge of the airfoil to almost fully attached flows. There are several benefits of DBD plasma actuators compared to mechanical devices for flow control. DBD plasma actuators are simple and thin, can be added to the existing body, have a quick response, require a low input energy, and have sufficient flexibility to be used in different flow situations.
One interesting features of DBD plasma actuators is the use of the so-called “burst mode”. A time sequence of the input voltage for the burst mode is schematically presented in Figure 3. Here, the sinusoidal line plot corresponds to the base frequency of the high AC (alternating current) voltage in the continuous mode. is the frequency of the duty cycle of the applied voltage and called burst frequency. T (s) is the period of one duty cycle and Ton (s) is the period during which the voltage is applied. The ratio, Ton/T is called the burst ratio denoted BR. The base frequency signals are switched on and off by the base high-frequency signals. Thus, a high voltage is only applied during the limited period as a duty cycle. Previous studies showed that better control authority is achieved with less energy consumption in many of the flow and geometry conditions when the burst mode is used [10,12,13,14]. The non-dimensional burst wave frequency. is used as a reference parameter in the literature, where is the burst frequency, c is the chord length and is the freestream velocity. Many previous studies showed that F+ = 1.0 is effective [12,15], while some of the recent experimental and computational studies showed that F+ values between 2 and 20 are also effective [8,13,14,16].
Previous studies on DBD plasma actuators can be classified into four topics: (1) research on low-temperature plasma dynamics and analysis of the induced flows by the phenomenon of dielectric barrier discharge; (2) analysis of the induced velocity and efforts to maximize it; (3) determining optimum parameters for good flow control; and (4) industrial applications. Several studies have focused on Topics (1) and (2), since strong induced velocities essentially lead to better flow control. We have focused on Topic (3), because we believe that understanding of the reason that burst mode works better than continuous mode for the same applied voltage would lead to finding the key features of the DBD plasma actuator.
Computational Fluid Dynamics (CFD) has become an important tool for scientific and engineering studies not only in the academic world but also in the industry [17,18]. Until recently, there was a clear boundary between: (1) practical CFD studies for engineering problems with turbulence modeling; and (2) basic CFD studies on turbulence in structures with simple geometries until recently. Progress in CFD methods and supercomputer performance in the last 20–30 years is now removing this boundary. Analysis of detailed flow structures using high-fidelity numerical simulations is now contributing strongly to clarifying the fluid physics of practical problems. This is also true for studies on the flow control mechanism for DBD plasma actuators [14,19,20].
In this study, flow structures induced by the DBD plasma actuator and the control strategies are discussed. The results involving the simulations and wind tunnel experiments of low-speed flows over airfoils with a DBD plasma actuator attached near the leading edge are examined. It is concluded that the effectiveness of the DBD plasma actuator for flow control comes from the three features that exist in the induced flows. By a proper setting of the actuator parameter, some of the flow features can be enhanced and become dominant in the flows. Therefore, the parameters should be optimized for specific applications to achieve effective flow control. Based on the analysis, guidelines for the effective use of the DBD plasma actuator are proposed. The DBD plasma actuator is also applied to the flows at cruise condition and the aerodynamic performance of a simple airfoil with a DBD plasma actuator is compared with that of a well-designed airfoil.
This manuscript reviews the research activities of the author’s group with regard to DBD plasma actuators for low-speed flows over airfoils and draws some conclusions. Based on these extensive studies, previously unreported insights are also presented.
2. Problem Setting
Low-speed flows over two-dimensional airfoils are considered. An NACA0015 airfoil is mainly used, but also used are NACA0006 and NACA0012 airfoils. Ishii airfoil, which is believed to show high aerodynamic performance at the Reynolds numbers of the order 104, are also used. A DBD plasma actuator is attached two-dimensionally in the spanwise direction near the leading edge, as shown in Figure 4.
3. Experimental Approach
Most of the experiments in this manuscript were conducted using the small induction wind tunnel at the Institute of Space and Astronautical Science, Japan Aerospace Exploration Agency (JAXA) unless otherwise noted. The test section of this wind tunnel is 100 mm in width, 400 mm in height and 700 mm in length. The turbulence intensity in the center is identified to be approximately 0.08% at flow speed of 6.6 m/s. All the airfoils used in this wind tunnel experiment have a chord length of 100 mm. More details of the experiments and the facility have been previously reported [13]. Reynolds numbers based on the chord length is 63,000, corresponding to the freestream velocity of 10 m/s. Additional experiments were conducted to evaluate the scaling effect (higher speeds and/or a larger model scale) using the large wind tunnel owned by a private company [19].
The DBD plasma actuator attached to the airfoil consists of two copper electrodes (Cu-35C tape; 3M Japan Ltd.) (Tokyo, Japan) with two polyimide dielectric layers (Teraoka Seisakusho, 650S, and material thickness 50 µm) (Tokyo, Japan) between them. Electrodes of 70 µm in thickness and two polyimide dielectric layers of 80 µm in thickness are used. The width of the exposed electrode is 2 mm and the width of the insulated electrode is 6 mm. The upper and lower dielectrics are 30 and 25 mm in width, respectively. The overlap between the exposed electrode and the insulated electrode is 1 mm. The rear edge of the exposed electrode is located at 5.0% of the chord from the leading edge.
4. Computational Approach
4.1. Basic Equations
Three-dimensional compressible Navier–Stokes equations written in the generalized coordinate system are employed as the governing equations in the computational study, as shown in Equations (1)–(3). The body force terms added to the momentum and energy equations (Equations (2) and (3), respectively) represent the effect of the induced flows by the DBD plasma actuator.
Here, xi and t are the non-dimensional position vector and time, respectively. ρ, P, e, and τij are the non-dimensional forms of the density, pressure, energy per unit volume, and stress tensor, respectively. δij represents Kronecker delta. Re, and Pr denote the freestream Reynolds number, Mach number, and Prandtl number, respectively. The subscript ∞ denotes the quantity under the freestream condition. Si in the last term of the right-hand side in Equations (2) and (3) can be expressed as Si = qcEi, where qc is the electric charge and Ei is the electric field vector. Details of this body force are described in the next section.
4.2. Modeling of the Body Force Induced by the Plasma Actuator
Several body force models have been proposed for the plasma actuator in the past, such as those in Refs. [21,22,23,24]. Among them, we adopted the Suzen and Huang model [23,24]. As described above, the body force terms introduced for the plasma actuator are evaluated by the computation of the electric charge density qc and the distribution of the electric field vector Ei. The Suzen and Huang model provides these variables as the solutions of the following two equations.
where is the relative permittivity of the medium, φ is the scalar potential and is the Debye length. is set to be 2.7, considering the material for the polyimide dielectric layers used in the experiment. is set to be 0.001 as is given by the Suzen and Huang model. These equations are solved with the proper boundary conditions. More details about the Suzen and Huang model can be found in Refs. [23,24] and the formulation in this study can be found in Ref. [25].
The unsteady feature of the body force in Equations (2) and (3) is modeled as follows:
where is the non-dimensional base frequency of the input AC voltage and defined as . Here, is the base frequency. is the spatial body force distributions obtained from the Suzen and Huang model above with the solution of Equations (4) and (5). Unsteady change of the body force based on the base frequency is modeled by the sinusoidal term in Equation (6). The body force generated by the plasma actuator is assumed to be a push–push type in one cycle and the square of the sine function is simply applied as shown in Equation (6) [26,27].
The magnitude of the body force has a parameter Dc for the scaling of electrical forces to inertial forces in the freestream. Here, Dc is defined as follows:
The subscript ref denotes the reference value. In this equation, qref and Eref are set as the maximum values of qc and E obtained by the Suzen and Huang model in each simulation. Therefore, change of the Dc value may be considered as a change of the input voltage. As shown in Equation (7), Dc represent the ratio of the electromagnetic force to the freestream dynamic pressure. As the maximum value of qc could not be determined, we needed to examine the dependency of the maximum induced velocity on Dc relative to the model scale and the freestream velocity scale used in the simulations of the present study. Aono et al. conducted simulations of the induced velocity fields in a quiescent field under the model scale and the freestream velocity (as a result, Reynolds number of 6.3 × 10⁴) used here [28]. Good agreement with the experiment was obtained for the distribution of the induced velocity profiles when the maximum induced velocity is adjusted to be the same value as that in the experiment. Pereira et al. showed that plasma-induced body forces under quiescent air conditions should remain unchanged for the external flows up to 100 m/s or so [29]. From the studies by Aono et al. [28] and Pereira et al. [29], we concluded that adjusting the maximum induced velocity under the quiescent air would result in the agreement of the velocity profiles and would lead to the proper value of Dc that properly scales the electrical forces to the inertial forces in the freestream. Therefore, the value of Dc is decided based on the result obtained in the quiescent air in this study. These results as well as the agreement of the Cp distributions to be presented below implied that the body force model used here is acceptable for the qualitative discussions in this study. The reliability of the Suzen and Huang model has therefore been confirmed [23,24]. In addition, Koizumi and Nishida conducted sophisticated discharge plasma simulations for the plasma actuator. They identified that their sophisticated model showed similar spatial-distribution and time-evolution of the induced body force distributions, and thus confirmed the reliability of the present model [30]. It should be noted that the Dc value for the same ratio of the maximum induced velocity and the freestream velocity depends on the Reynolds number, as is expected from Equation (7).
4.3. Numerical Method
Implicit Large Eddy Simulation (iLES) is the method used in this study. A high-resolution sixth-order compact difference scheme with tenth-order compact filtering is used [31]. As the sixth-order compact differencing scheme has been shown to have 50–100 times higher spatial resolution than conventional second-order schemes, this approach saves on the numbers of computational grids. As a result, this saves computer time and memory [32]. Such a scheme was necessary even with the world’s leading-edge supercomputer because even one specific case requires considerable time for computation. In this iLES method, tenth-order filtering plays a role as an alternative to the sub-grid model. For time integration, lower-upper symmetric and alternating-directional implicit symmetric Gauss-Seidel (ADI-SGS) [33] methods are used. To ensure time accuracy, a backward second-order difference formula is used for time integration, and 3–5 sub-iterations are adopted. Details of the numerical algorithms have been previously reported [26]. Freestream Mach numbers in the numerical simulations are set to be 0.1 or 0.2 for computational efficiency, but it only models low-speed flows assuming that the phenomena are essentially the same. The computer program used in this study is our original in-house computer code named LANS3D (originally developed by Fujii and Obayashi in 1984 and modified by Fujii et al. at Institute of Space and Astronautical Science, Sagamihara, Japan) that has been used for many applications and is well validated. Recent applications for the flows over airfoils at similar Reynolds numbers have been reported [34,35]. The code is modified in consideration of the source (body force) terms in Equations (2) and (3).
Computational grids are carefully prepared to be appropriate for iLES simulations at this range of the Reynolds numbers. Namely, the grid sizes based on the wall unit, which were calculated for the attached flow over the NACA0015 airfoil, are Δξ ≈ 8 (in the streamwise direction), Δη ≈ 9 (in the spanwise direction) and Δζ ≈ 1 (in the wall-normal direction). Our previous study using the same compact differencing and filtering schemes showed that the grid resolutions to resolve near-wall turbulence are Δξ ≈ 36 in the streamwise direction, Δη ≈ 15 in the spanwise direction, and Δζ ≈ 1 in the wall-normal direction. Therefore, the grid spacing near the airfoil surface has a sufficient spatial resolution to resolve near-wall turbulence. A grid-independence study was also conducted [36].
We employed an overset zonal method [37] to enhance the spatial grid resolution in the region around the plasma actuator. There are two zonal grids for the flow simulations: one for the overall airfoil region (zone 1) and the other for the actuator region (zone 2). The latter grid with much fine spatial resolution is overlapped onto the former grid. The body force terms are computed in advance using the grid with ultra-fine spatial resolution. Then, the result is mapped onto the fine grid region (zone 2) in the flow simulations. The span length of the simulation is 20%. The total number of grid points is approximately 20 million.
5. Results
In the following discussions, there are both computational and experimental results. The results presented in the figures are computational ones unless “Experiment” appears in the figure caption.
5.1. Use of Burst Waves: Observations in Our Early Study
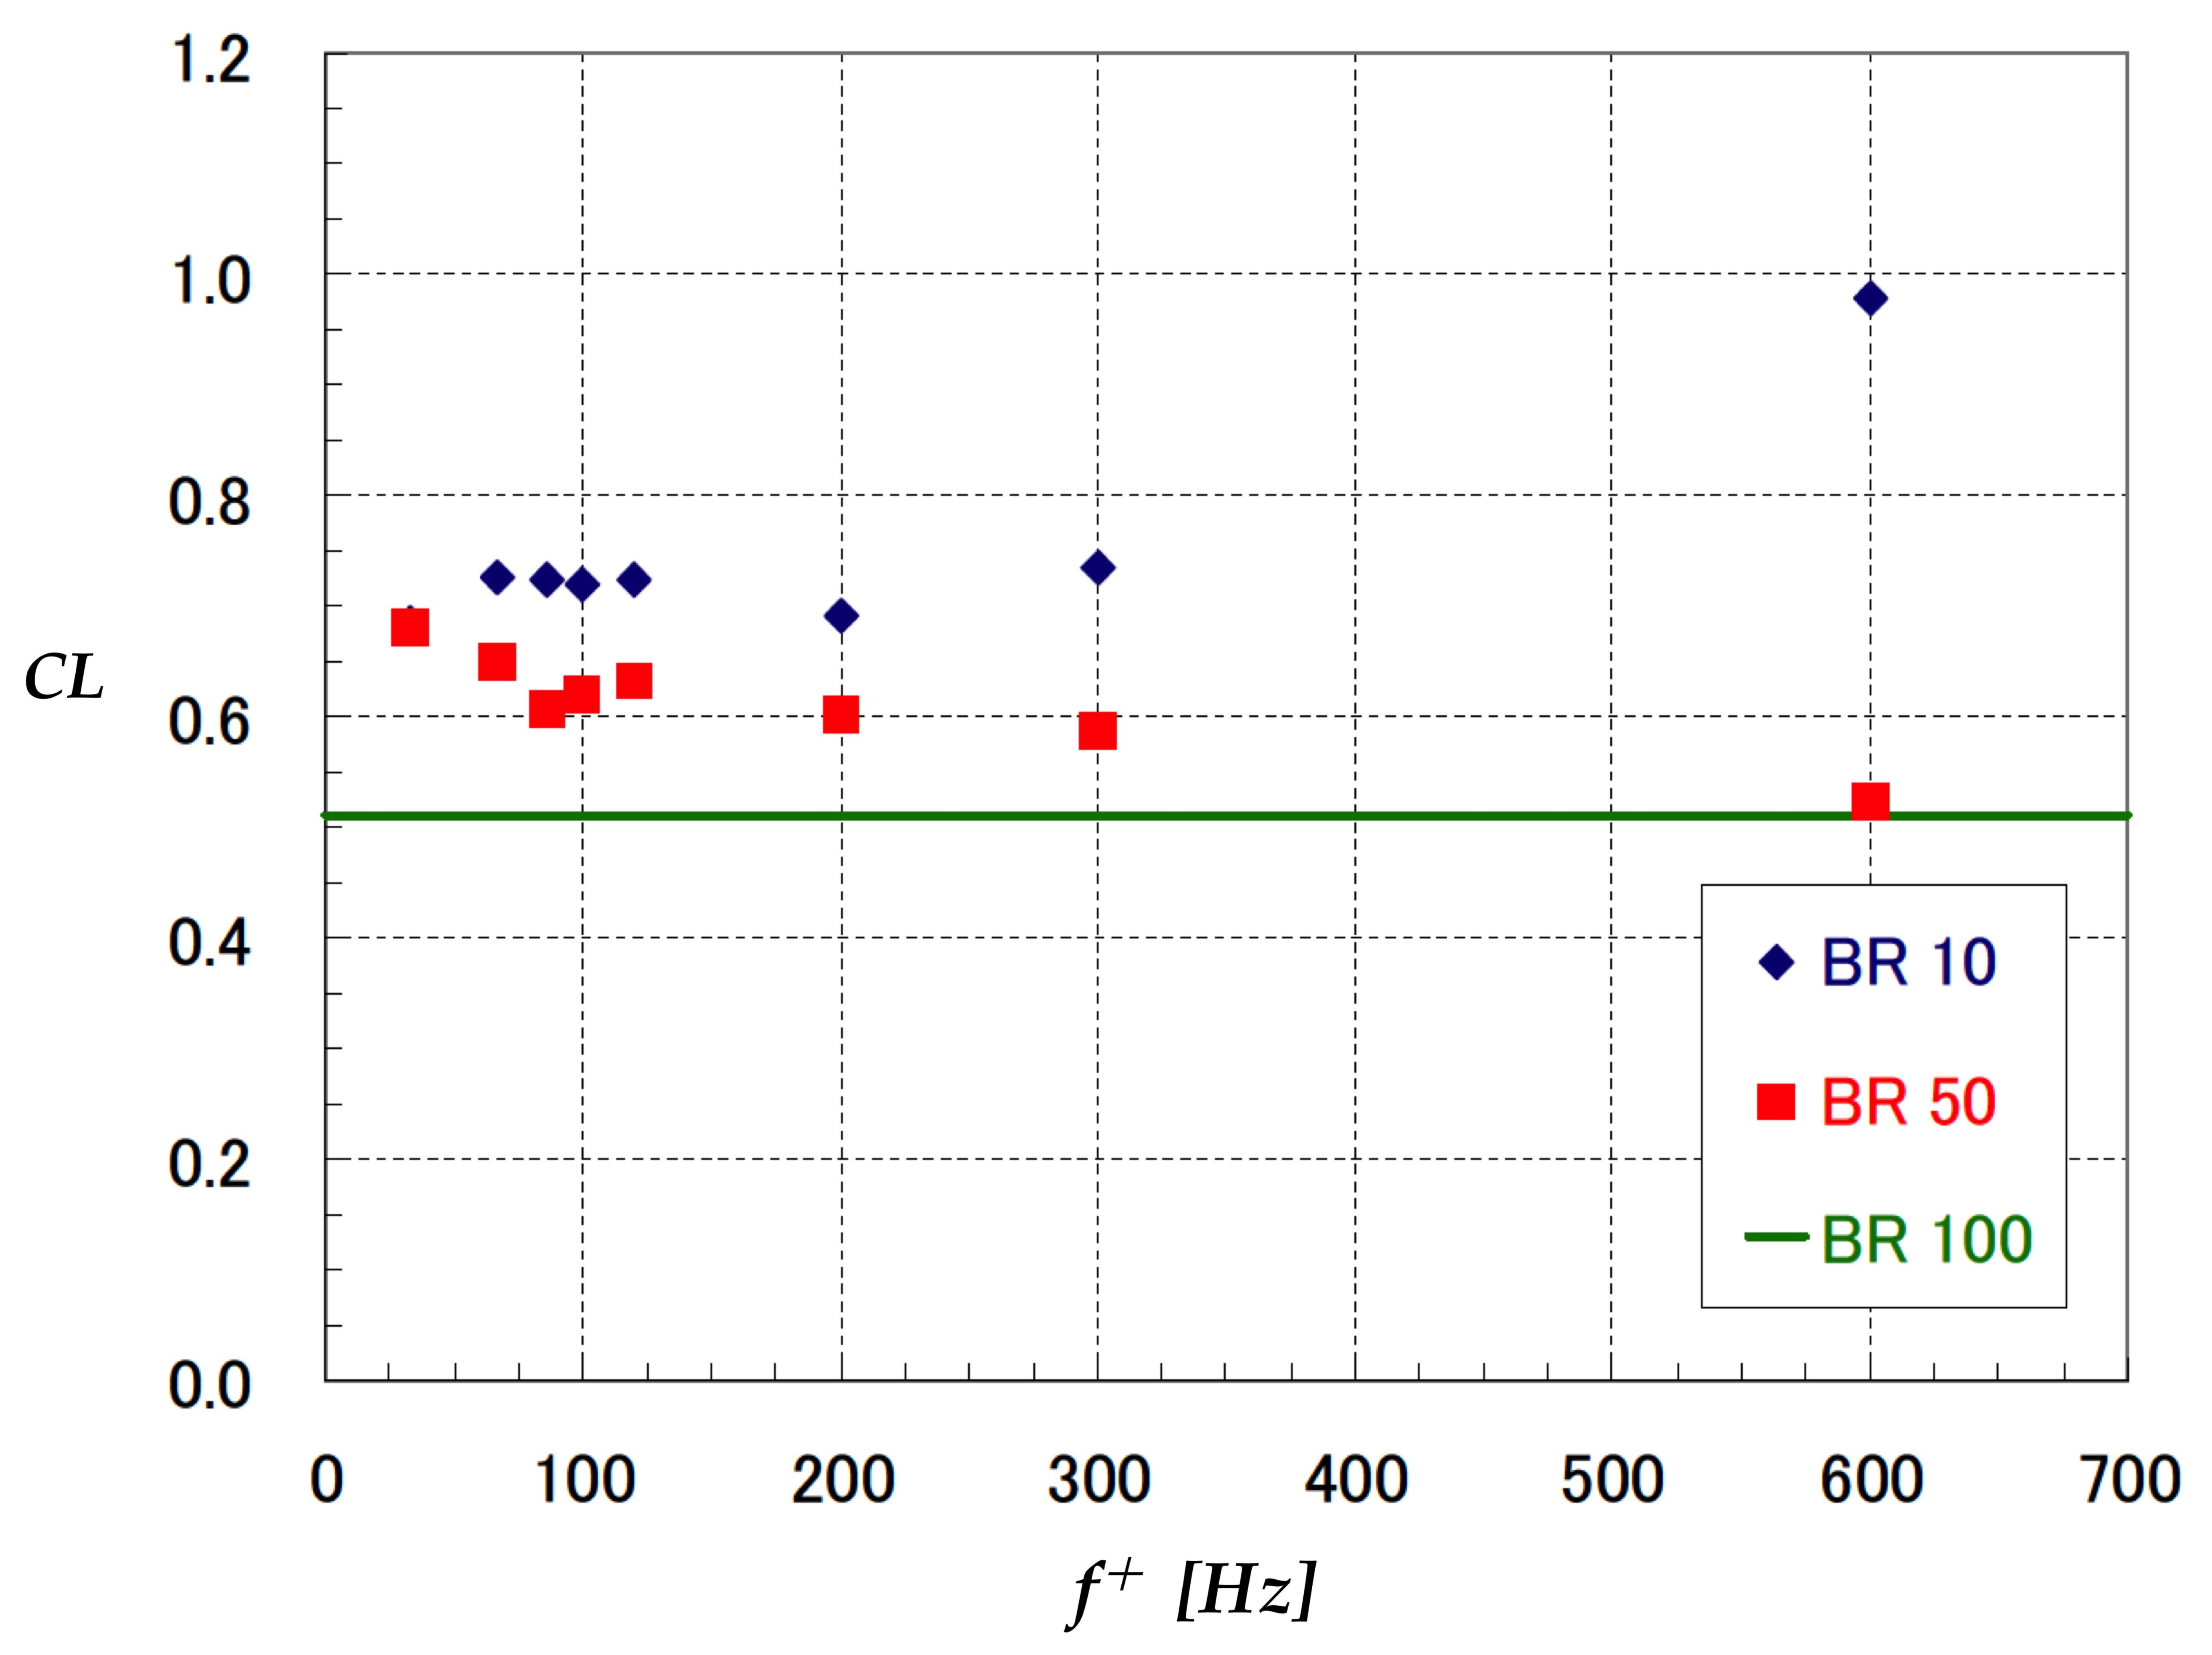
As described in Section 1, burst waves are effective for better control of flow separations. Figure 5 shows the experimental result showing the effect of burst frequencies over the lift coefficients at the angle of attack of 12°, which is just above the stall angle. Here, L is the lift of the airfoil and c is the chord length of the airfoil representing the length scale. BR is the percentage burst ratio and BR = 100% corresponds to the continuous mode of the applied voltage. Although not shown here, the CL value without the DBD plasma actuator was about 0.55. This indicates that continuous mode (BR = 100) did not increase CL value and was considered to not effectively change large-scale leading-edge separation. Burst mode actuation is in general more effective than continuous mode actuation. A frequency of f+ = 600 Hz (corresponding to the non-dimensional burst frequency, F+ = 6.0) with a burst ratio (BR) of 10% is very effective. In the literature, it had been shown that F+ =1.0 (f+ = 100 Hz in this experiment) was very effective for achieving a high CL [12,16] although the effectiveness of a much higher F+ was not confirmed. For the future discussion in this manuscript, please note that the applied voltage in this experiment was 4.0 kV (Vpp), which is low compared to many other experiments for the DBD plasma actuator. This sensitive low voltage was intentionally chosen so that we could find the effect of the burst frequency and other plasma actuator parameters on the aerodynamic coefficients. With higher voltages being applied, the difference in CL values between BR = 50% and BR = 10% became smaller and the effect of the burst frequencies decreased. At any rate, the experimental results posed two questions: Why did the burst mode show better flow control authority? Why did F+ = 6.0 realize higher CL compared to F+ = 1.0 in this experiment?
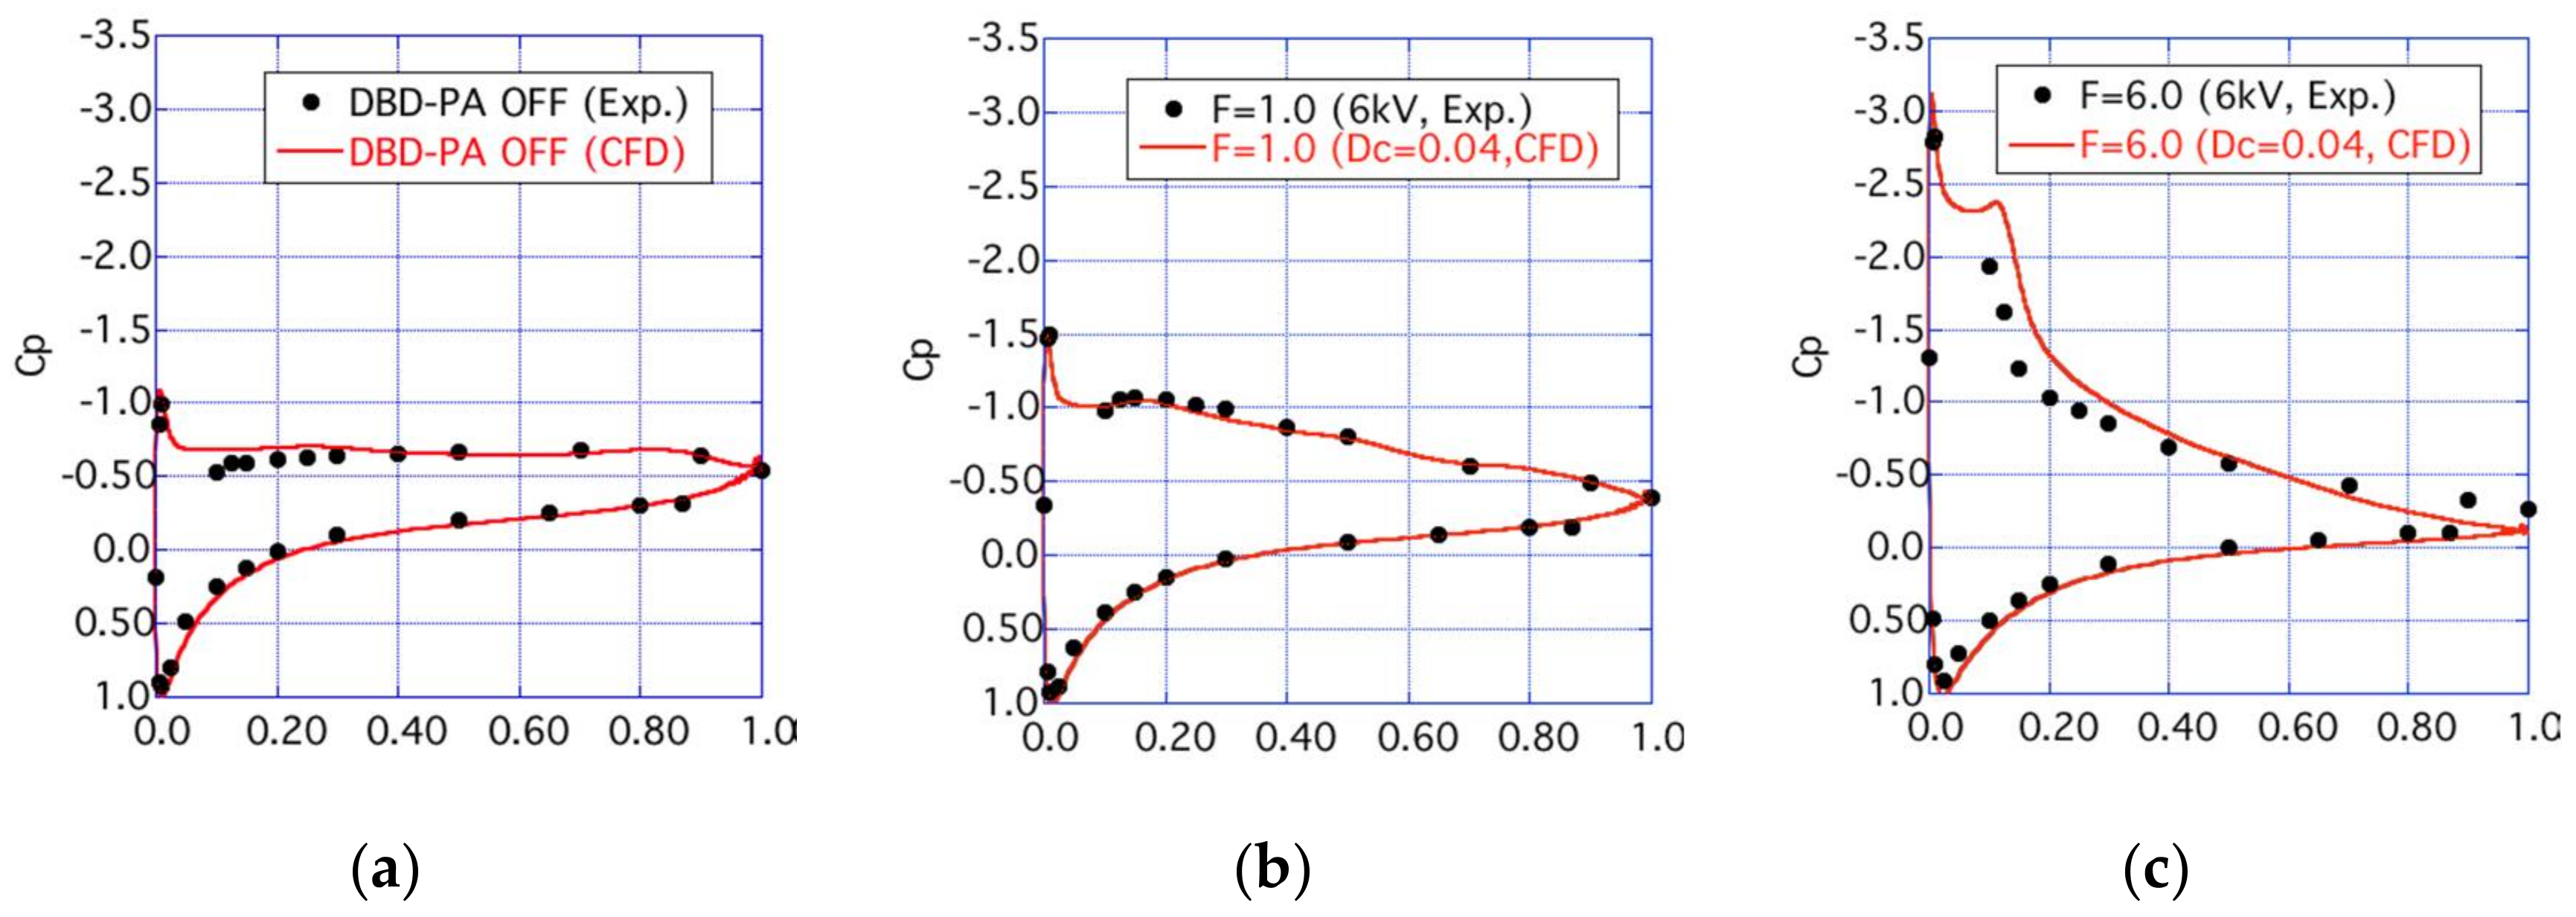
As the angle of attack is just above the stall angle and the applied voltage is very low for the case shown in Figure 5, the results in the experiment were very sensitive to a small change in the flow and environmental conditions. Therefore, 14°, which is a few degrees above the stall angle, was selected for the main case for the discussion below. Experiments were also conducted at this angle of attack with higher voltages (5.0 kV–6.0 kV (Vpp)) [38]. Figure 6 shows plots of surface distributions over an NACA0015 airfoil under three different DBD plasma actuator conditions: (a) DBD-PA OFF (plasma actuator not used); (b) F+ = 1.0; and (c) F+ = 6.0. The burst ratio was set to be 10 (10% duty cycle) for all the cases. Flows are unsteady, so the plotted CFD data are based on the time and span-averaged values. The computational results were obtained through the present extensive study. The experimental result was taken from Ref. [39]. The simulation results in all the three plots show good agreement with the corresponding experiment. Without the DBD plasma actuator, there are flat Cp distributions over the upper surface of the airfoil (shown in Figure 6a), which indicates that flow separation occurs at very near the leading-edge. With the DBD plasma actuator on, negative pressure is produced over the upper surface of the airfoil and the lift coefficient is somewhat recovered. Better flow control with higher burst frequencies is also confirmed in this CFD analysis since the leading-edge suction peak is well recovered in Case (c) with F+ = 6.0. At angles of attack below the stall angle, laminar flow separation occurs near the leading edge of the airfoil when without the DBD plasma actuator. A turbulent transition makes the separated flow to attach to the airfoil surface at this Reynolds number. The small separation region that occurs as a result is called the “laminar separation bubble”. Such phenomenon seems to have occurred at a higher angle of attack as well in Case (c). Table 1 shows the aerodynamic coefficients for all the three cases in Figure 6. As expected from Figure 6b,c, F+ = 6.0 produces a higher CL than F+ = 1.0, which is consistent with the result of the experiment shown in Figure 5. Here, it should be noted that higher L/D is obtained and the suction peak is also recovered for F+ = 1.0 when Dc is increased (namely, when a higher voltage is applied). Then, the result becomes close to that for F+ = 6.0.
5.2. Use of Burst Waves: Observation from the Later Stage of Study (2011–2017)
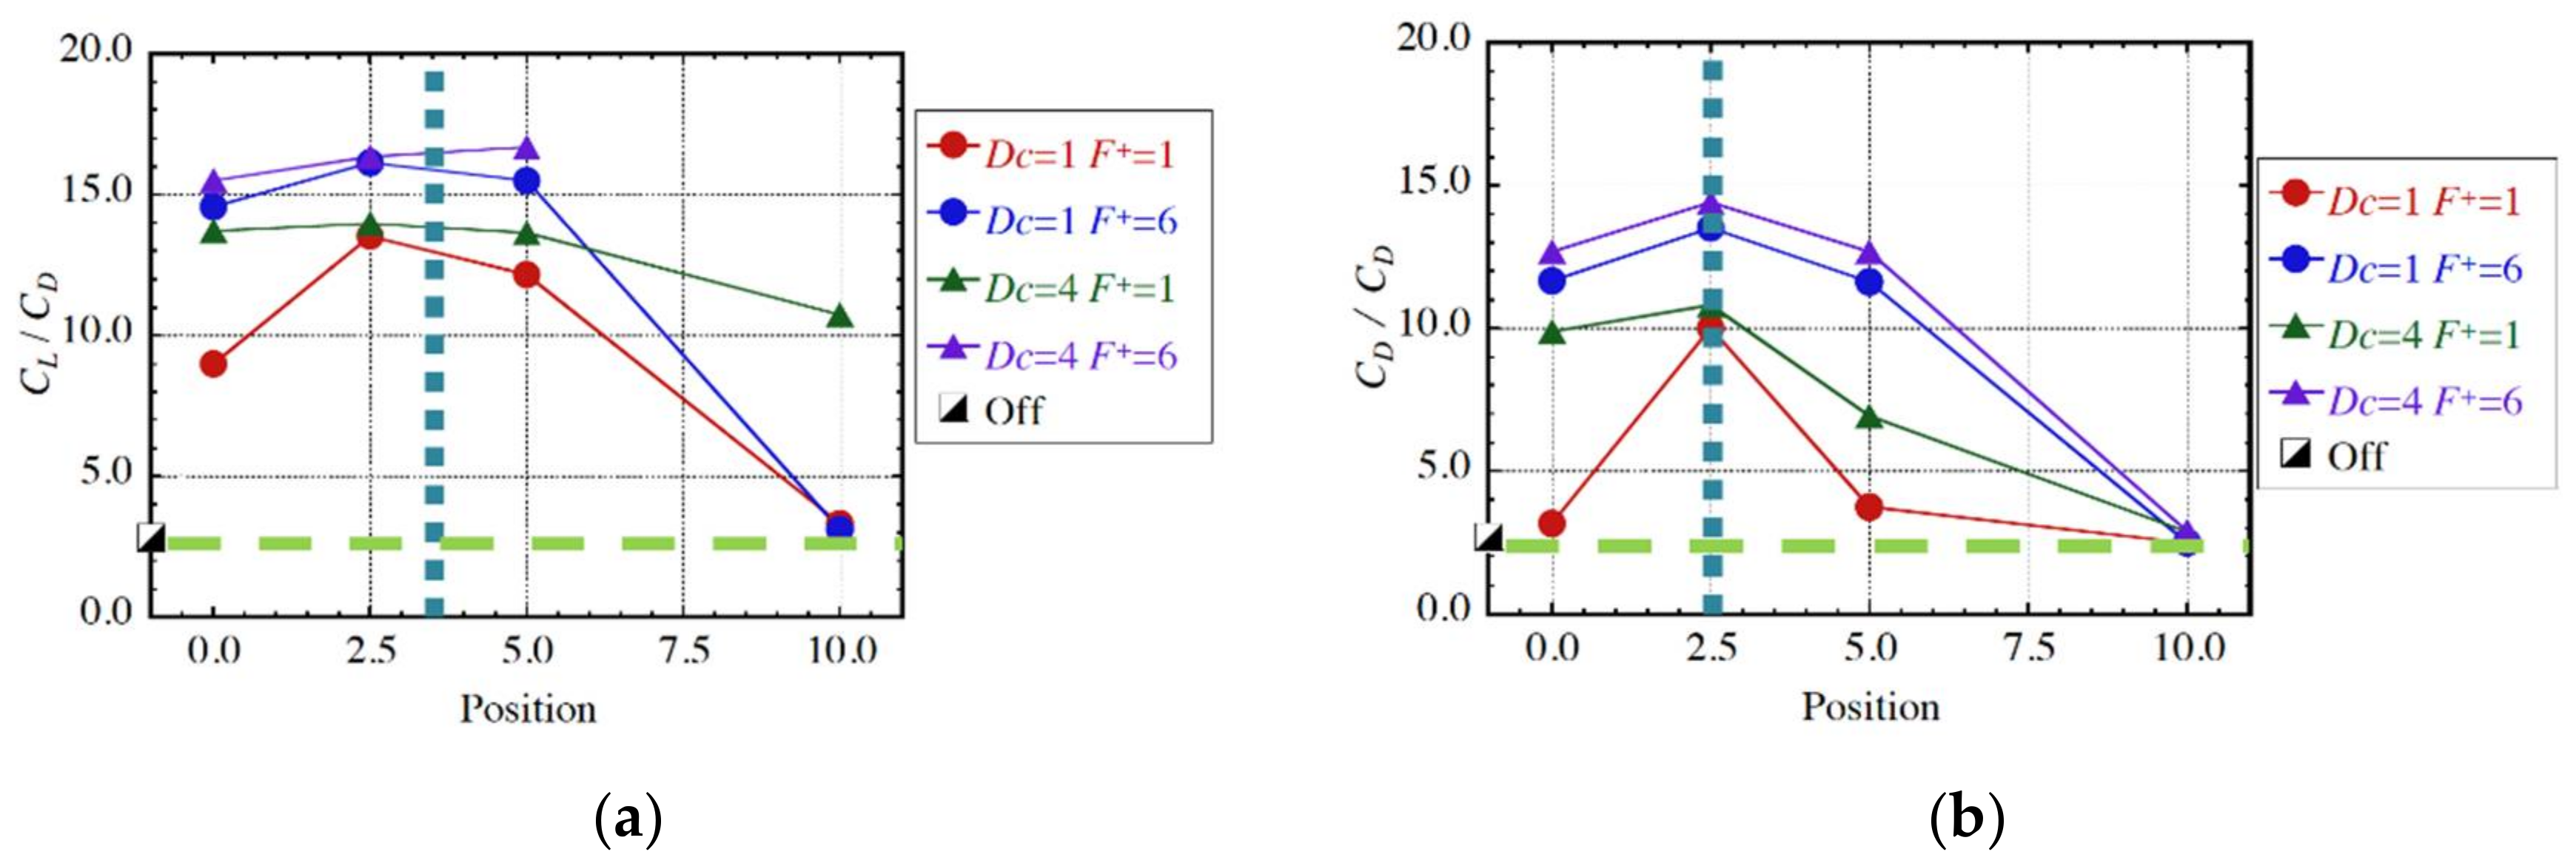
From the results thus far, the two questions raised earlier have not yet been answered. The first was why the use of burst waves improved flow control authority, while the second was why F+ = 6.0 showed a better flow control than F+ = 1.0 in both our experiments and simulations. Numbers of iLES simulations were conducted under the project of application software development of the K supercomputer in Japan [40,41,42,43,44]. Simulations with different parameters (airfoil geometry, angle of attack, Reynolds number, Dc, F+, etc.) identified the solutions to these questions. Other extensive studies have been conducted in the experiments similarly [39]. Much information was obtained by this activity. Some of the results are presented here among them. More results can be found in the references above. Figure 7 shows the effect of the actuator position [45]. Thick vertical dotted lines are the separation points when without the DBD plasma actuator. As has been pointed out in the past, a DBD plasma actuator achieves the best L/D when it is located near the separation points. This is also true for other angles of attack, other airfoils and other DBD plasma actuator parameters.
Next, we discuss the answers to the two questions above. Figure 8 illustrates how aerodynamic performance (L/D) is influenced by the chordwise growth of the turbulent energy. Each symbol in this figure corresponds to one simulation. We first drew the TKE (turbulent kinetic energy) contour map over the entire flow field over the airfoil. At each chorwise station from the leading edge, the maximum value of TKE is searched in the lateral direction. Thus, we obtain the chordwise distribution of the maximum value of TKE for each chordwise location (TKE_max). The chordwise distribution of TKE_max has a peak and Gaussian-like profile near the peak. The half-width of the first peak of TKE_max profile is computed as a reference value of the rapidity of the TKE growth (or turbulent energy promotion) as it is considered to have strong relation with the smoothness of the turbulent transition. Each point in this figure corresponds to the L/D versus the rapidity of the TKE growth thus computed for each case. Details on the method used for computing the rapidity of the TKE growth have been discussed [40]. There are obviously three groups in this figure. One group at the bottom right shows a slow growth of turbulence, resulting in a low CL/CD (same as L/D). They fail to achieve good flow separation control. The other group at the top left has a rapid growth of turbulence, resulting in a high L/D. They are successful in flow separation control. These results indicate that the promotion of the TKE energy, namely, the promotion of laminar–turbulent transition is one important mechanism for the separated flow control by the DBD plasma actuator. There is an interesting third group located in the top left region. They are successful for flow separation control and achieve high L/D even though the growth of turbulence is slow. This suggests that another mechanism may exist for the flow separation control authority of the DBD plasma actuator. Note that analysis of the instantaneous flow for this group shows a two-dimensional spanwise vortex remaining near the airfoil surface up to the middle-to-rear part of the airfoil, where a transition occurs. This phenomenon ensures a high L/D.
5.3. Three Important Flow Features and the Guidelines from the Observations
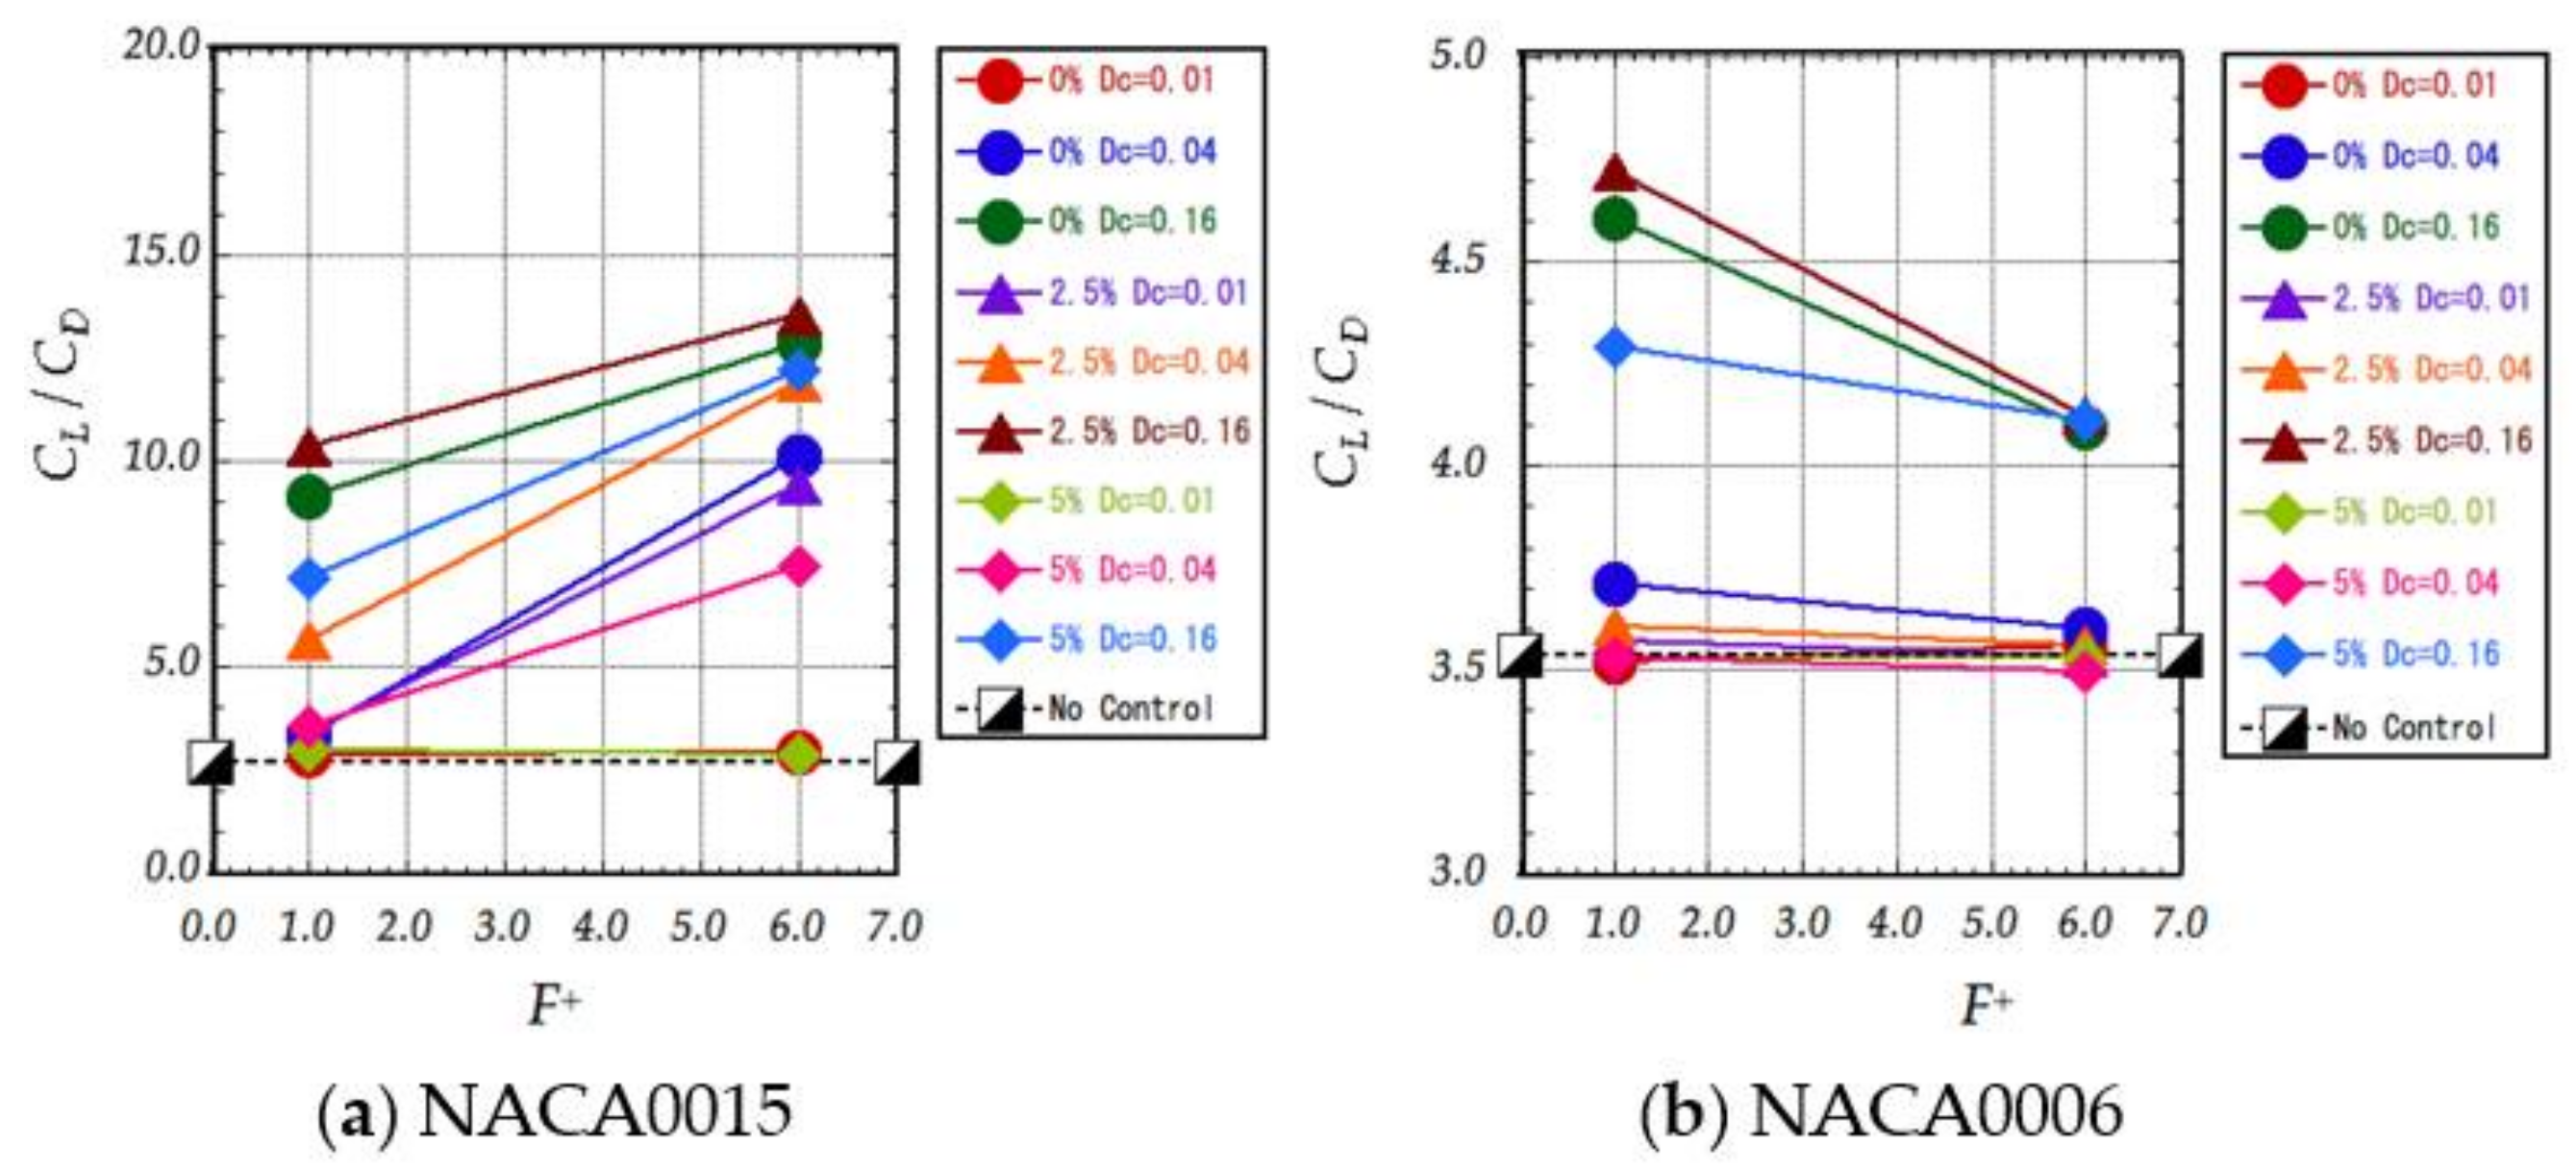
Another interesting feature that may be related to the existence of the third group is shown in Figure 9a,b, where the L/D dependence on the burst frequency F+ is plotted for NACA0015 and NACA0006 airfoils, respectively. The figures show that a higher frequency (F+ = 6.0) is more effective for achieving a higher L/D for the NACA0015 (a thick airfoil) as has already been described, while a lower frequency (F+ = 1.0) is more effective for the NACA0006 (a thin airfoil) independent of any actuator locations and values of Dc. There thus occurs another question: Why does a low burst frequency (F+ = 1.0) work better for a thin airfoil such as NACA0006, while a high frequency such as F+ = 6.0 works better for a thick airfoil such as NACA0015? It should be noted that the values of Dc in Figure 9a,b are much smaller than those in Figure 7. Although the Reynolds number was same, the Dc values in our early simulations shown in Figure 7 were determined based on the longer chord and lower freestream velocity, which are different from those in the experiment described here. As a result, the Dc values became large and the region of the DBD plasma actuator was small (relative to the model scale). We confirmed, however, that same conclusion was also obtained for the smaller Dc values.
An analysis of the instantaneous flow fields, phase-averaged flow fields, frequency spectrum, and linear stability of the separated shear layer was performed. Such effort led to identifying a few different representative flow features [39,46]. As has been described, the turbulent transition turned out to be one of the most important factors for the flow separation control at this Reynolds number. To further confirm this estimation and find appropriate burst parameters for better flow control, the linear unstable modes in the separation shear layer profile and the spatial growth rates were investigated [40,47]. The most unstable frequency was approximately St = 15 in the separated shear layer flow structure when the DBD plasma actuator was off. Here, St is the non-dimensional frequency defined by the chord length and the freestream velocity. The most unstable frequency was approximately St = 35. when the DBD plasma actuator was turned on. The DBD plasma actuator in the burst mode creates two-dimensional spanwise vortices at the beginning and at the end of every bursting. They merge together and a stronger two-dimensional vortex with the same frequency as F+ is eventually appears. This implies that the vortices created initially for the case of F+ = 6.0 have a Strouhal number similar to the unstable frequency St = 15. Higher-frequency components are also created, so low input frequencies such as F+ = 1.0 would have similar frequencies as harmonics, but the higher input frequency F+ = 6.0 has much higher power spectrum density components at the most unstable frequency than F+ = 1.0. This might be why actuation is more effective for F+ around 6.0 than for F+ around 1.0 at this angle of attack. A similar analysis was conducted for the flow separation control by the synthetic jets [47,48]. Here, strength of the induced flows is not too important, but the frequencies of the disturbance introduced by the DBD plasma actuator are important.
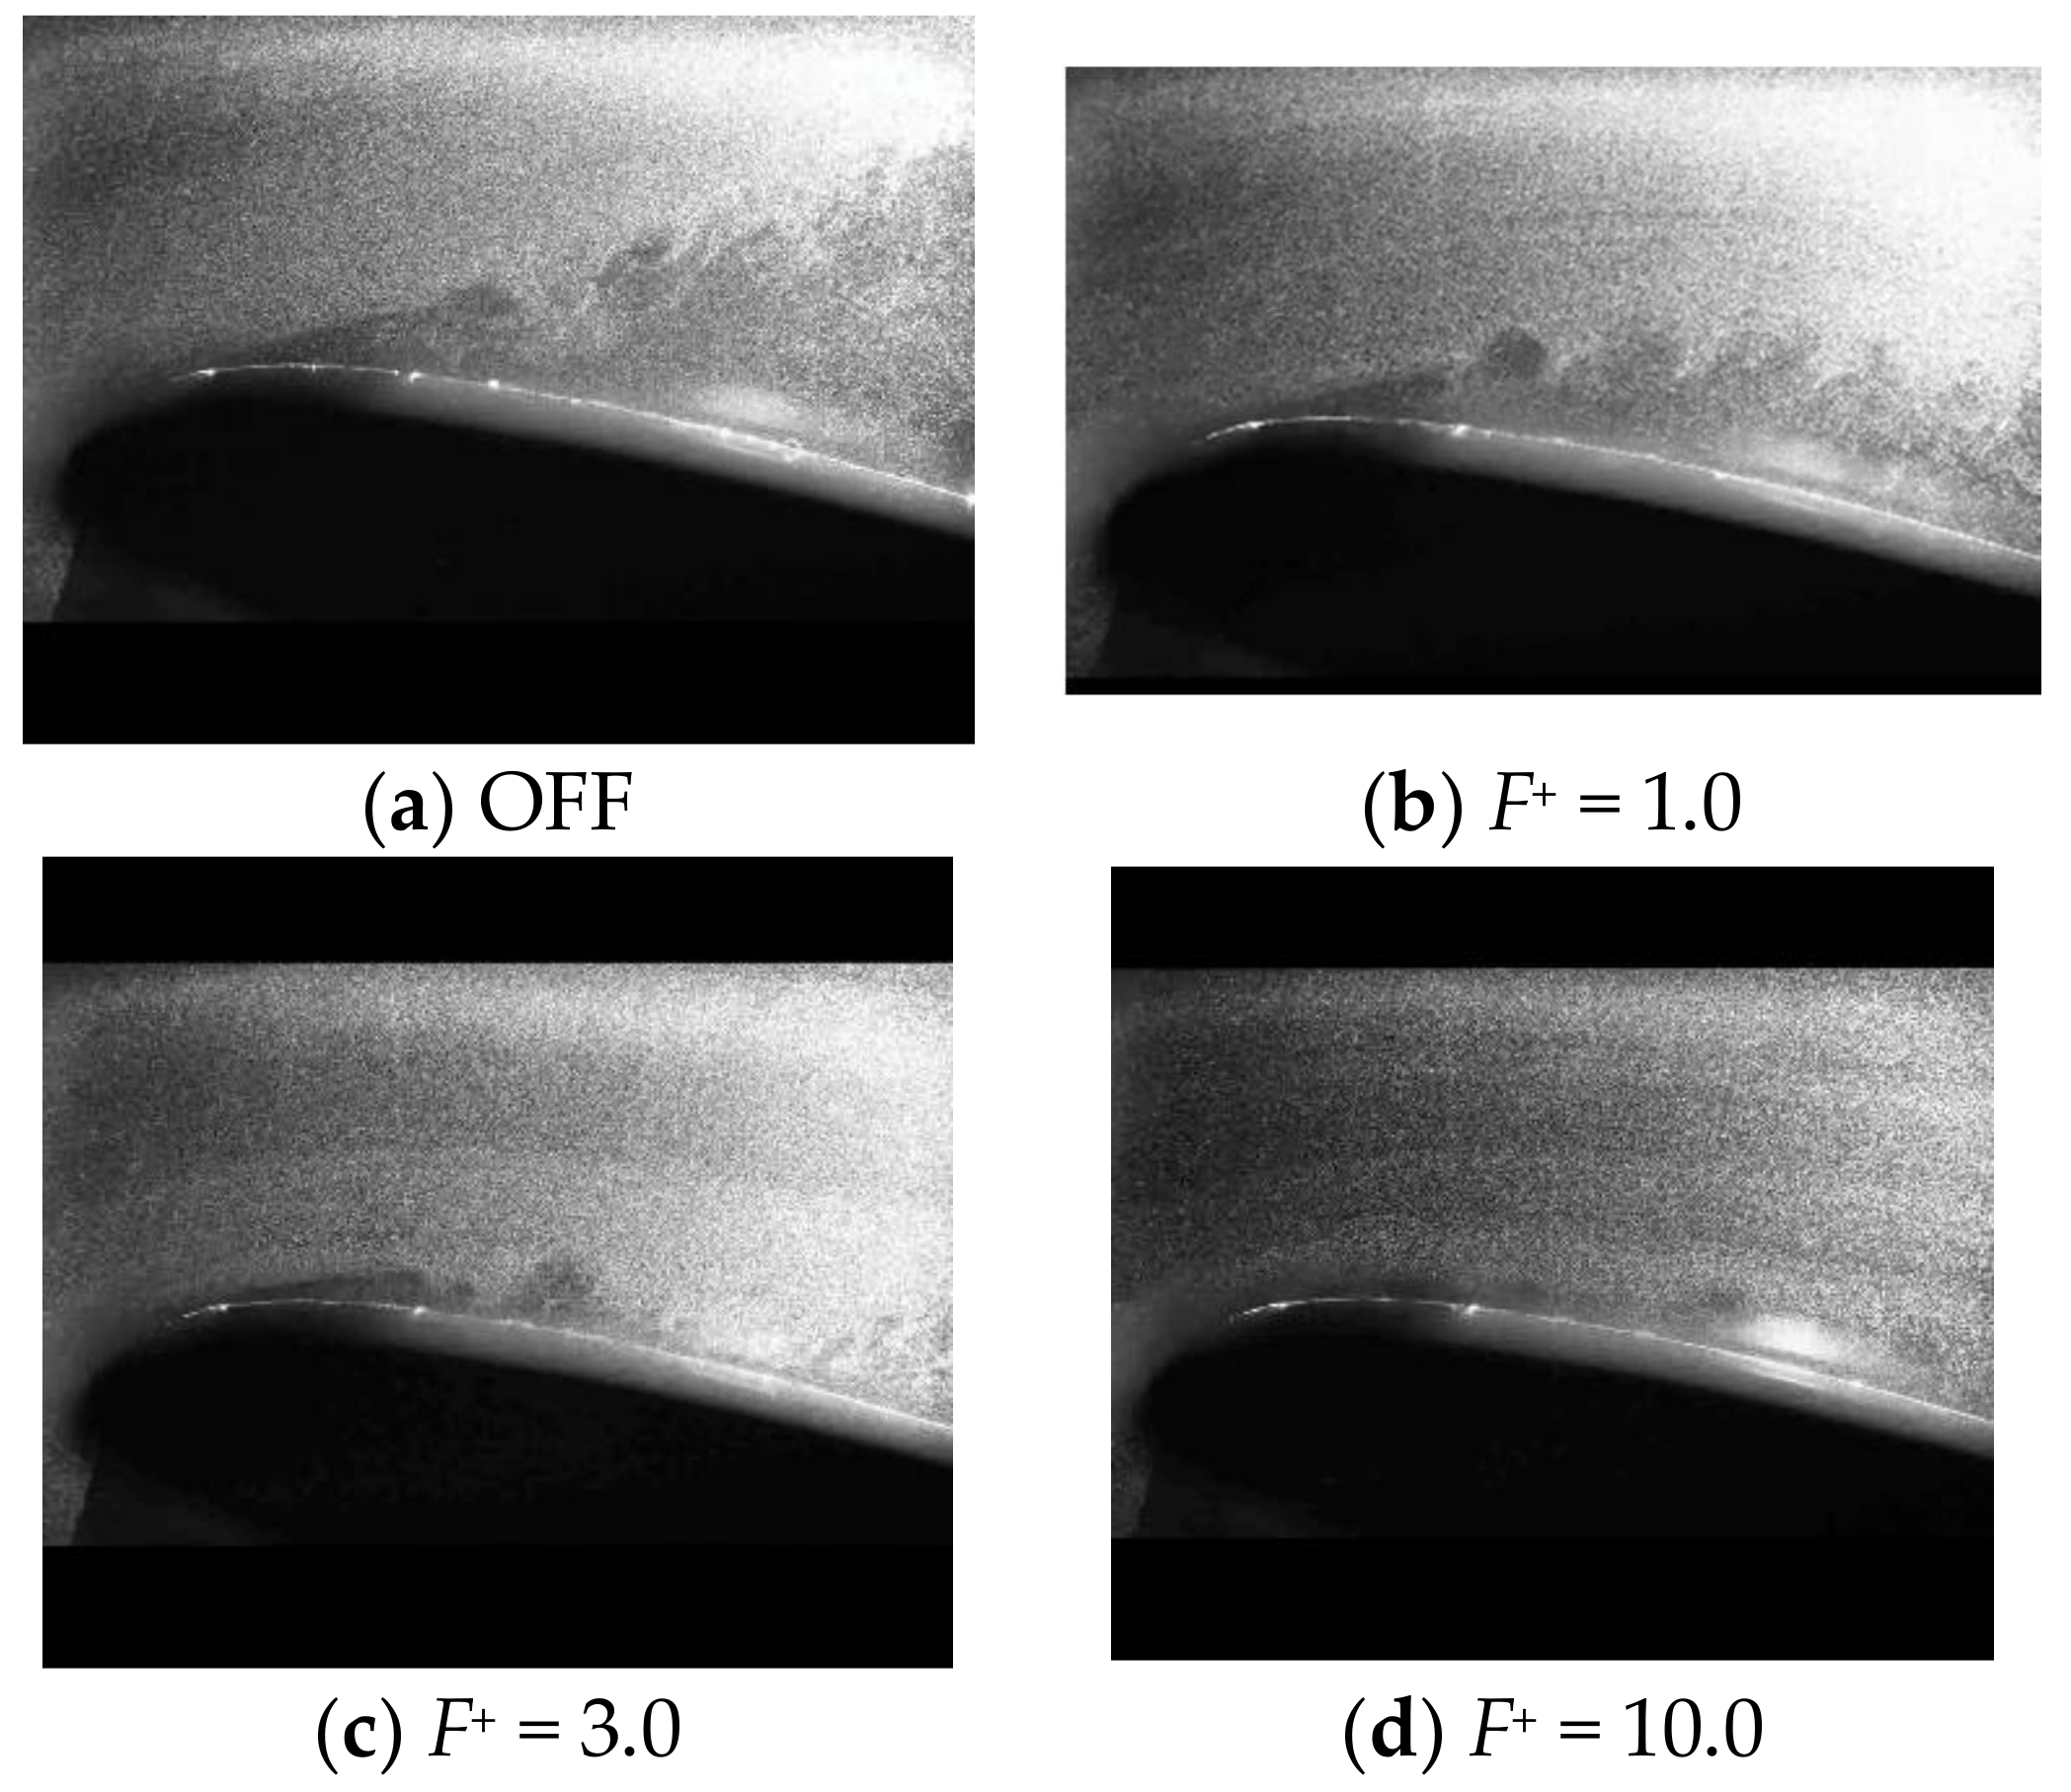
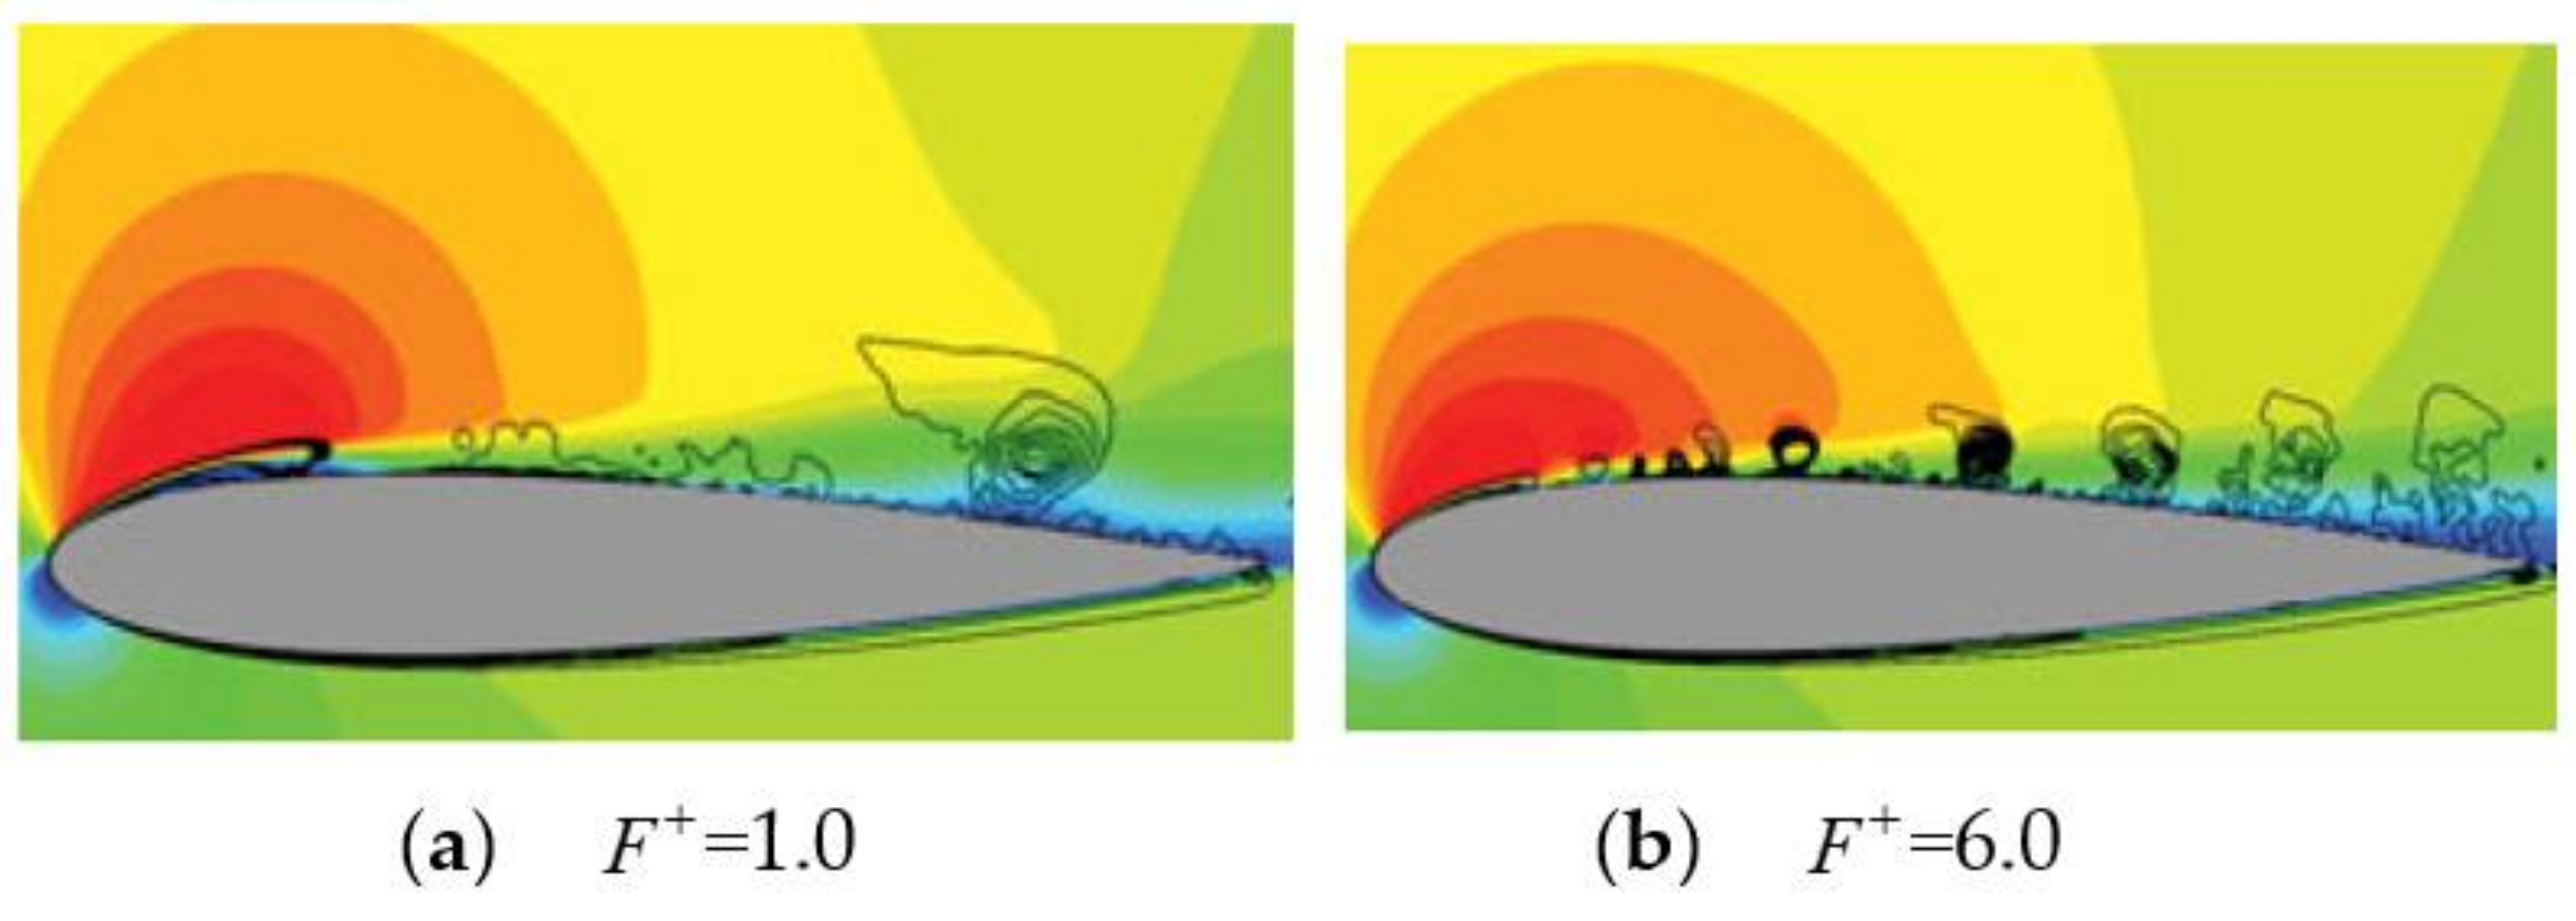
A two-dimensional vortex created by the burst mode actuation described above is another important feature that plays an important role in the flow separation control. Such flow structures were found in the time sequence of the flow fields obtained through the phase and spanwise averaging of the simulation data. They were also experimentally observed. Figure 10a–d shows an instantaneous snapshot of the PIV particle images in several cases [38]. Figure 11a,b shows two image shots of the computed flow fields obtained with the ensemble and moving average [27,40]. A sequence of vortices is observed, and the number of these vortices corresponds to the burst frequency F+. These vortices are important because they promote large-scale momentum exchange, which contributes to better control of separated flows and increase the authority of the plasma actuator.
A small disturbance related to the unstable mode of the shear layer would effectively work when the shear layer stays sufficiently close to the airfoil surface. This occurs for the thick airfoil at an angle of attack just above the stall angle because thick airfoils have large radius of curvature at the leading edge. When the airfoil is thin, a separated shear layer is located far away from the surface as the radius of curvature at the leading edge is small. Small flow disturbances may not be sufficient to induce a separated shear layer coming closer to the airfoil surface. Basically, a smaller F+ creates stronger and larger vortices. Therefore, actuation with F+ = 1.0 creates larger and stronger two-dimensional vortices. These strong vortices might be capable of inducing the separated shear layer to move closer to the airfoil surface. This might be why F+ = 1.0 work better for the NACA0006 airfoil, and F+ = 6.0 works better for the NACA0015 airfoil. Similarly, when the angles of attack are much higher than the stall angle, the shear layer separated from the leading edge stays further away from the airfoil surface. Therefore, F+ = 1.0 also works well. In summary, these vortices would work efficiently especially when a separated shear layer stays away from an airfoil surface.
The two flow features above depend on the parameters of the burst mode. On the other hand, the actuator-induced streamwise momentum always exists. It depends on the input voltage, base frequency and others. Thus, jet-like flows introduced by the plasma actuator near the airfoil surface are another important flow feature. The induced momentum becomes largest in the continuous mode and becomes smaller for lower burst ratios.
All three of the flow features described above always exist in the flow field induced by a DBD plasma actuator. By a proper choice of the actuator parameters such as the voltage, base frequency, burst frequency, and burst ratio, some of the flow features can be enhanced and become dominant in the flows. By optimizing the parameters for the flow and geometry conditions to be applied, good control of flow separation can be achieved. Therefore, a plasma actuator works more efficiently than other flow control devices.
The strategy for choosing the good parameters for the DBD plasma actuator can now be determined based on the discussion above. It is more effective to use a high frequency considering the instability of the separation shear layer when the separation is weak, or the shear layer stays near the airfoil surface. We can control the flow separation with a low input voltage. It is more effective to use a frequency that is low enough to create strong and large two-dimensional spanwise vortices. Needless to say, it is always more effective to increase the input voltage which induces stronger jet-like flows. The DBD plasma actuator works better than other flow control systems since all the three flow features work together. With the parameter selections optimized for the application and the flow conditions, some of these effective features become dominant, which expands the applicability of the DBD plasma actuator for flow separation control.
5.4. Additional Issues
A few issues are raised below from the extensive CFD and experimental studies. Firstly, it is found that the DBD plasma actuator, particularly in the burst mode, promotes a transition to turbulent flows and a laminar separation bubble near the leading edge becomes small due to the early reattachment. The time-averaged boundary layer profile shows that the boundary layer after the reattachment is essentially turbulent [40]. However, the attached turbulent boundary layer maintains a periodicity corresponding to the frequency of the burst mode as described above. The author’s understanding from the analysis of the time history is that the role of the DBD plasma actuator is not to attach separated flows but to move the separated shear layer closer to the surface and prevent flow separation by maintaining two-dimensional vortex structure near the airfoil surface. This type of flows can also be observed in the flows at angles of attack slightly lower than the stall without a DBD plasma actuator. The flow structure is also somewhat similar to what is observed in the laminar separation and laminar reattachment flows over an airfoil at lower Reynolds numbers [35].
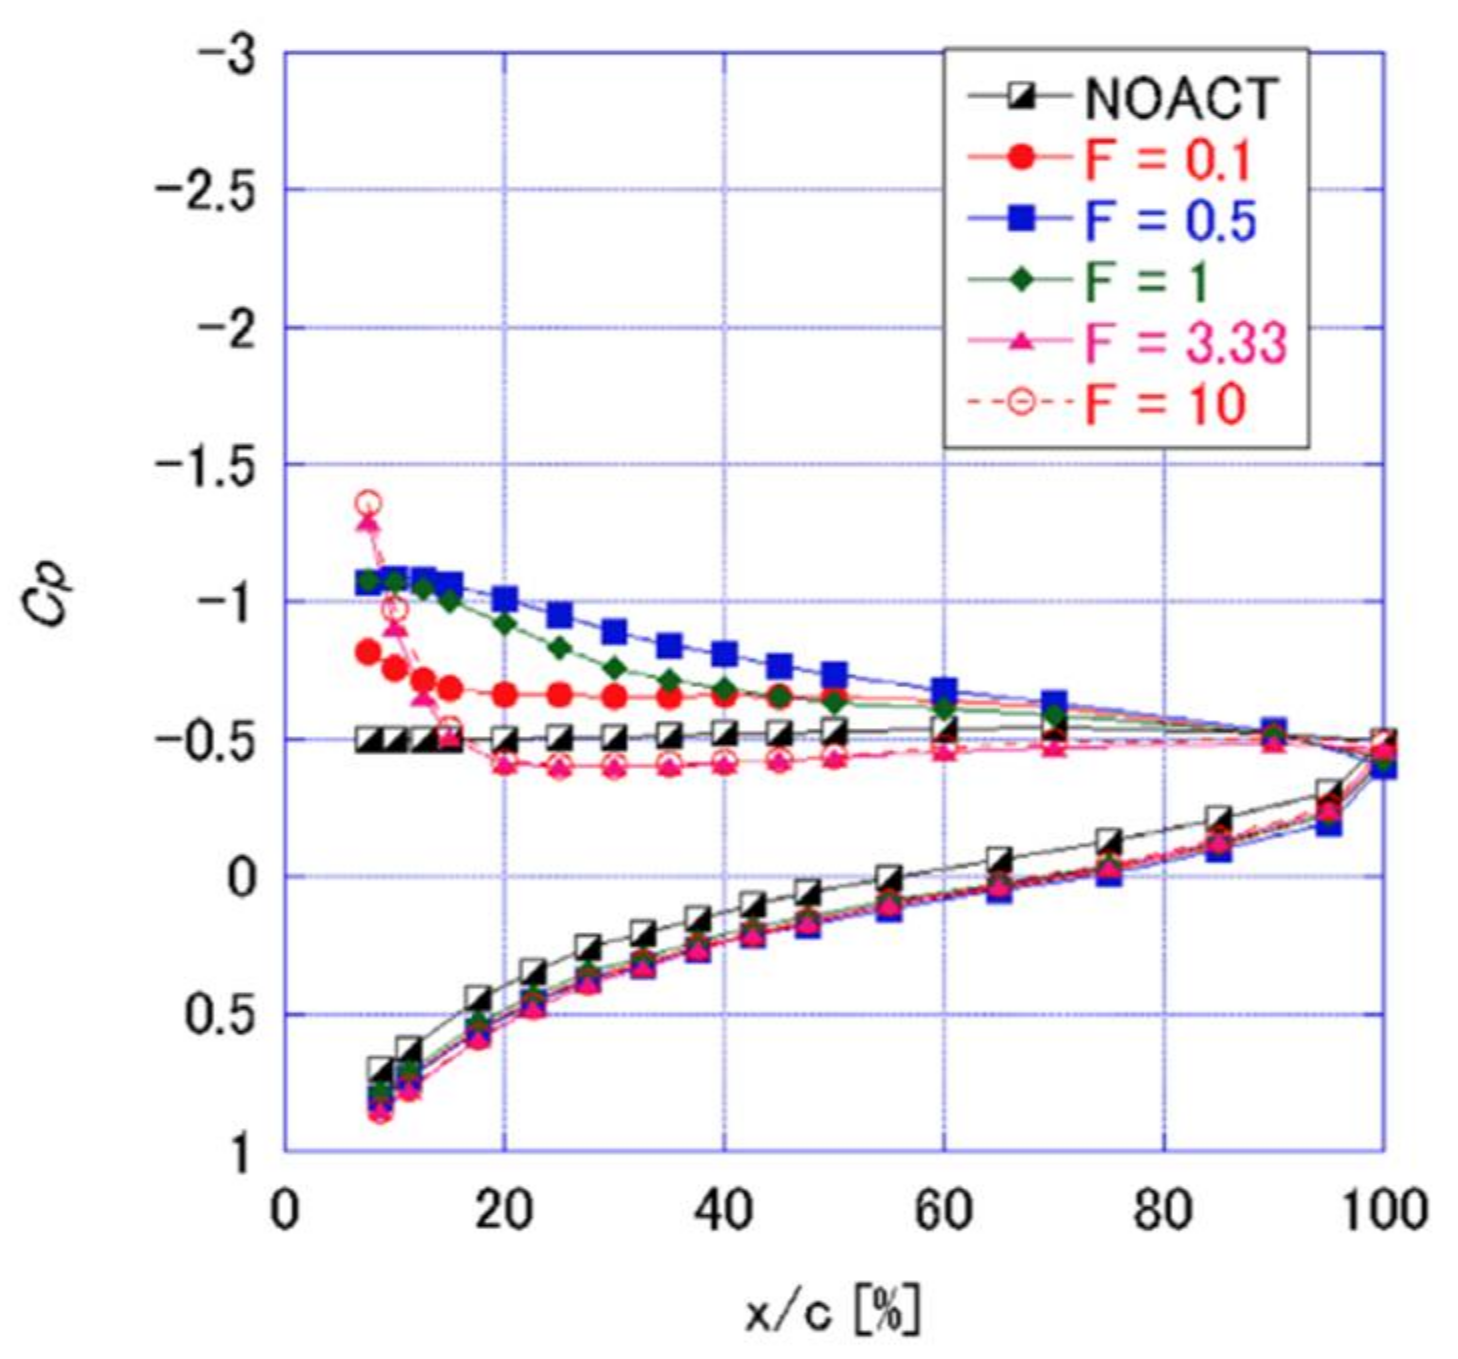
When we discuss the flow control authority of the plasma actuator, we have to define what is “good authority”. The definition may be different for different people and for different applications. For example, the lift coefficient CL shows a similar trend to that for L/D (lift to drag ratio, where D is drag) in many cases. Among them, there are cases where values become large. One example may be the case of F+ = 1.0 in Table 1. A similar result may be found in the case at higher Reynolds numbers, as shown in Figure 12. The experiment was carried out with an airfoil chord length of 0.2 m (two times longer than the experiment discussed above) and a freestream velocity of 60 m/s (six times higher than the experiment discussed above) in the wind tunnel owned by a private company. In some cases, negative Cp distributions over the upper surface were obtained and the lift was somewhat recovered, as observed in the plots in Figure 12. However, suction peak near the leading edge is not recovered and flow control is not satisfactory. The flow for this type of Cp distributions tends to show a relatively high CD. There are relatively large two-dimensional spanwise vortices (which maintain a negative pressure there) aligned over the upper surface as in Figure 10b. The flow structure in these cases also tend to have strong flow unsteadiness. This type of use is acceptable if the objective in using DBD plasma actuators is simply to increase the lift. However, it is not acceptable if the objective is to keep aircraft flying at more than the stall angle of attack.
Flow structures at this Reynolds number commonly include laminar separation near the leading edge, a transition to turbulence, and reattachment. A so-called laminar separation bubble is created. We may evaluate the flow control authority of the plasma actuator by the early reattachment of the laminar separation bubble, or the size reduction of this laminar separation bubble. However, early reattachment does not necessarily mean a high lift or high L/D. Thus, it is important to clarify what the purpose of using the DBD plasma actuator is, and to define a flow control authority consistent with that objective.
Another issue determined in this study is the relation between the leading edge and trailing edge Cp values and the lift, drag and L/D. Our data mining result showed strong relation between the L/D and the Cp value at the trailing edge [49]. Sometimes, data acquisition for a certain region over the airfoil becomes difficult, as the dielectric of the DBD plasma actuator covers the airfoil surface. We may be able to estimate the aerodynamic performance by simply measuring the Cp at the trailing edge.
It should be noted that the flow control authority of DBD plasma actuators depends on the combination of the velocity and the model scale even at the same Reynolds number. The control performance should be discussed for the velocity and model scale specified. Even under the conditions of the same Reynolds number, the control authority of the DBD plasma actuator is different in the case the velocity scale (induced flows relative to the freestream velocity) and the model scale (the size of the plasma actuator relative to the size of the airfoil) are different.
5.5. Functions of Plasma Actuator at Cruise Condition
Thus far, we have only discussed the flow control authority of the DBD plasma actuator to avoid large-scale flow separation over an airfoil. This may be useful for avoiding aircraft stall. However, such a flow condition rarely occurs and therefore applications may be limited from the viewpoint of aeronautical engineering. We may need to show that a higher L/D would be obtained at cruise conditions. In this section, we show how the DBD plasma actuator works at the cruise condition and show another benefit of the DBD plasma actuator at a Reynolds number of the order 104 to 105 with the CFD analysis. The numerical approach is the same as above except for the angles of attack. The aerodynamic performance of an NACA0015 airfoil with a DBD plasma actuator is compared to that for the Ishii airfoil which is a high-performance airfoil at this Reynolds number range and is commonly used for model airplanes. Details of the analysis have been previously published [50] and only the key issues are described in this section.
The Reynolds number is set to be 63,000. The lift to drag ratios for both the NACA0015 (without a DBD plasma actuator) and the Ishii airfoil are computed in advance and the angle of attack that achieves a maximum L/D is selected to be the flow condition for each airfoil. The angles of attack was 6° for the NACA0015 and 4° for the Ishii airfoil, respectively. Under these conditions, the flow is almost attached except in the region of the laminar separation bubble over the upper surface of the airfoils. The computed aerodynamic coefficients are presented in Figure 13a–c. Figure 13a shows that the NACA0015 airfoil, when it has the DBD plasma actuator, successfully achieves a higher L/D than that for the Ishii airfoil. Although the difference is only a few percent, there are several additional benefits. Firstly, the thickness of the Ishii airfoil is 7.1% of the chord length and that of the NACA0015 airfoil is 15.0%. We could use much thicker airfoil, which would greatly alleviate structural restrictions. Secondly, we might be able to have a high L/D for a wide angle-of-attack range with optimized choice for the parameters of the plasma actuator. In addition, we might obtain a still higher L/D by finding a suitable angle of attack where the L/D attain the maxim value with the DBD plasma actuator. Thus far, we have only tried the angle of attack when the L/D attains the maximum value without the DBD plasma actuator.
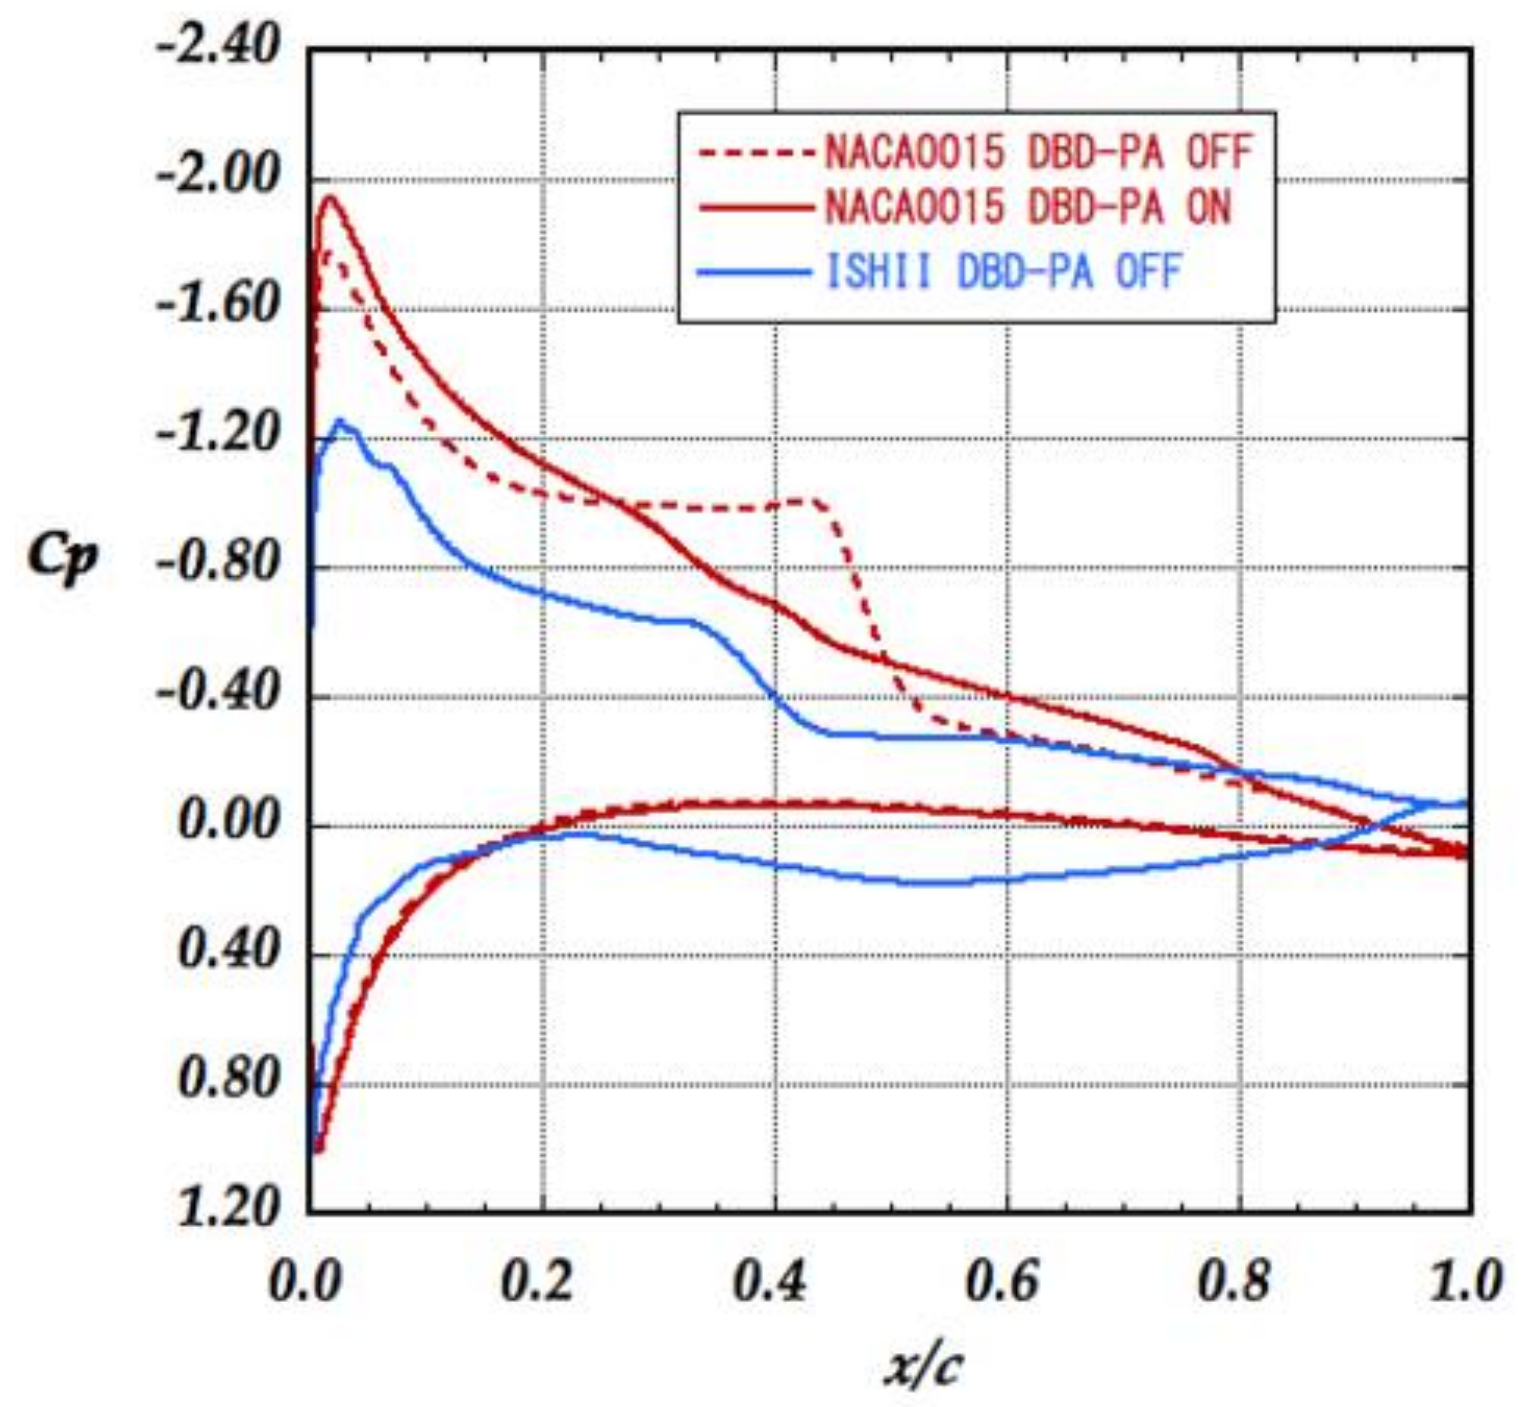
Figure 13b,c shows the lift and drag coefficients. From these graphs, a high L/D was achieved mainly by the drag reduction rather than by lift increase. Reduction of pressure drag is the main reason. To find out why this occurred, the skin friction coefficients over the upper surface are plotted in Figure 14. The chordwise pressure coefficient (Cp) distributions over the airfoil surfaces are also plotted in Figure 15. A recirculating region due to a laminar separation bubble is located further forward for the Ishii airfoil compared to that for the NACA0015 airfoil without the DBD plasma actuator. The NACA0015 airfoil without a DBD plasma actuator has a separation bubble up to almost 50% of the chord, which increases the pressure drag. With a DBD plasma actuator “ON”, this region becomes very small and moves forward. The reattachment point become almost the same as that for the Ishii airfoil. By moving the low-pressure region inside the separation bubble forward, the pressure drag is remarkably reduced.
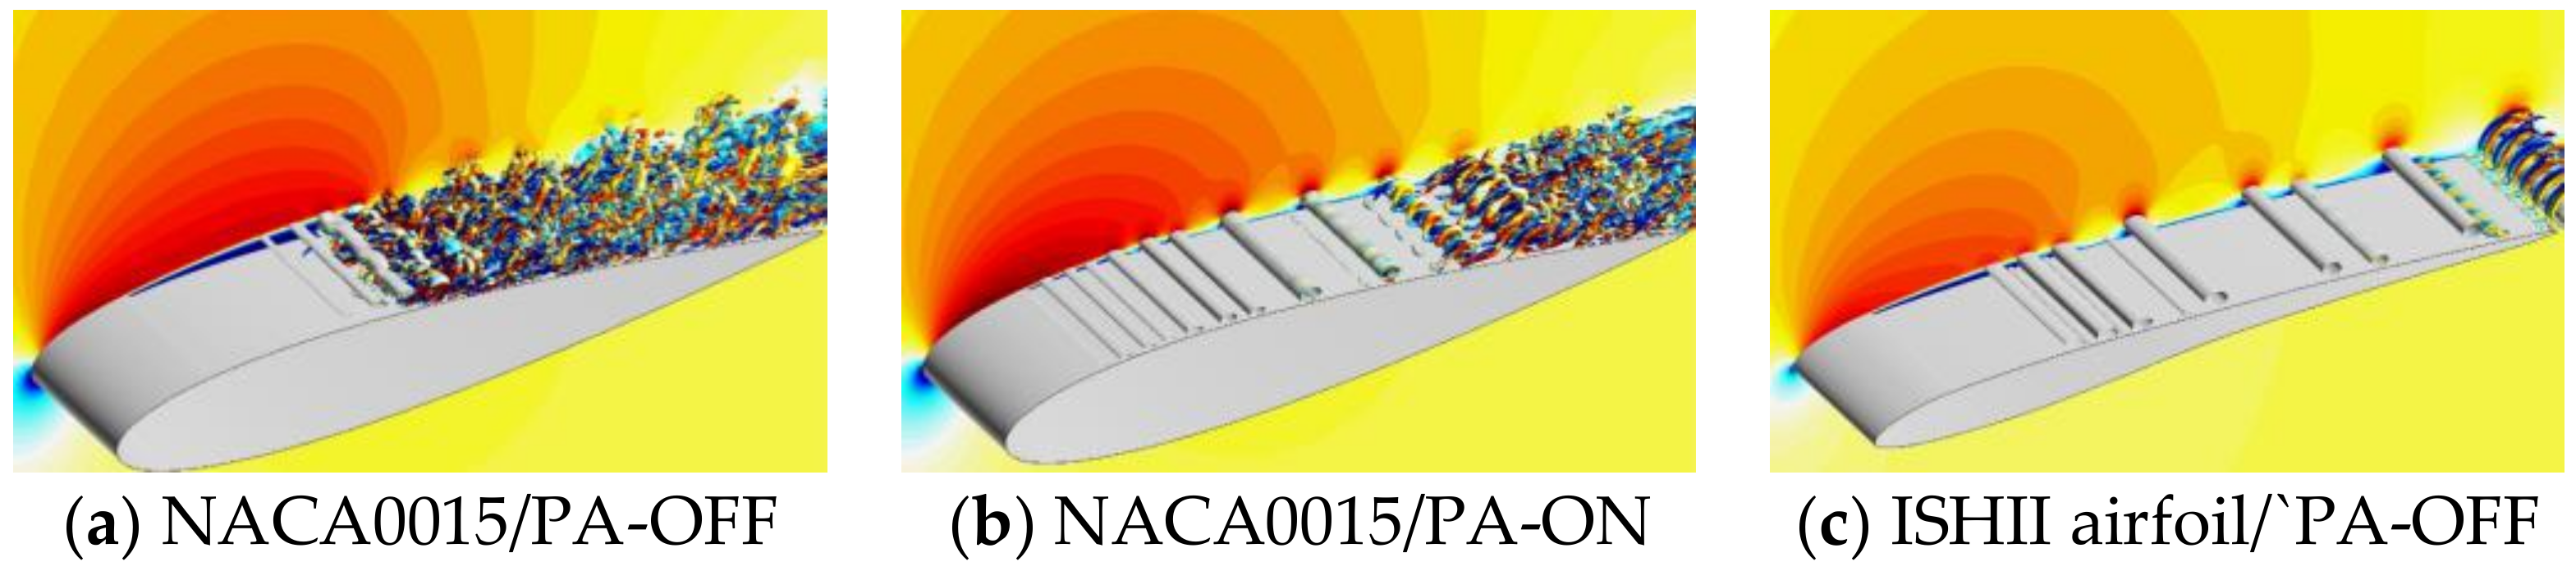
The pressure distributions for an Ishii airfoil plotted in Figure 15 shows a pressure plateau region in the forward part of the airfoil, which corresponds to a laminar separation bubble. Typically, reattachment occurs via a laminar-to-turbulent transition. However, the flow stays laminar even after the reattachment in this case. Figure 16 shows the power spectrum density of the chordwise velocity fluctuations. The power spectra are measured at several points in the chordwise direction along the line of the maximum turbulent-kinetic-energy (TKE) in the chordwise direction. The horizontal axis represents the Strouhal number and the vertical axis represents the power spectrum density. In this analysis, data are ensemble and spanwise averaged, and the power spectra are non-dimensionalized as the power spectrum density, . The spectrum for the DBD plasma actuator off case has a peak around St = 10 at x/c = 0.4, which may correspond to the most unstable mode of the linear stability. From x/c = 0.4 to 1.0, a −5/3 power decay can be clearly observed, and the flow is considered to be turbulent. This result is consistent with the pressure distributions in Figure 14 and Figure 15. On the other hand, −5/3 power decay is not observed for the Ishii airfoil almost up to the trailing edge. It seems that flow stays laminar even after the reattachment. The NACA0015 airfoil, with the DBD plasma actuator on, the location of the power decay moves toward the trailing edge and occurs somewhere between x/c = 0.8 and x/c = 1.0 (Figure 16b). The DBD plasma actuator seems to establish similar flow structures as that for the Ishii airfoil in Figure 16c. It is interesting to note that the DBD plasma actuator in this case delays the transition. At high angles of attack, the DBD plasma actuator promotes a laminar to turbulent transition to avoid flow separations. Even though the parameter settings are very similar, the DBD plasma actuator works very differently than it does at high angles of attack. Figure 17a–c shows instantaneous snap shots of the flow field. As explained for Figure 16, a two-dimensional vortex structure remains up to the rear part of the airfoil surface and the transition seems to be delayed when the DBD plasma actuator is turned on (Figure 17b). This flow structure is very similar to that for the third group plotted in Figure 8. The transition point moves upstream at a certain instance. Then, the DBD plasma actuator pushes it back toward the trailing edge by sweeping out the disturbances and the two-dimensional vortex structure induced by the actuator becomes dominant over the upper surface of the airfoil. Next, transition point moves back to forward again. This phenomenon repeats periodically, as shown in the video animation in the Supplementary Material.
We still have not identified some of the flow features and we need more studies to understand in what case the DBD plasma actuator promotes the transition and in what case it delays the transition. However, this small electric device is very effective for many types of flow control applications.
6. Conclusions
The research activities of the author’s group for the flow control authority of the DBD plasma actuator are summarized and reviewed. The mechanism of flow control by the DBD plasma actuator is discussed based on a series of computations and experiments for low-speed flows over airfoils with these devices attached near the leading edge. The DBD plasma actuator is shown to be very effective for controlling flow separation at a Reynolds number of 6.3 × 10⁴ when it is applied to flows at angles of attack above the stall angle. The mechanism of flow structures induced by the DBD plasma actuator, particularly in burst mode, and different control strategies based on the observation are discussed. Analysis of the phase-average flow structures reveals that there are remarkable structures in the flows near the airfoil surface, which characterize the actuator-oriented flows to reduce flow separation. The study identifies three flow features related to the induced flows for the flow separation control, and these are why the DBD plasma actuator works better than other similar devices. It is shown that some of the flow features can be enhanced and become dominant in the flows by a proper setting of the actuator parameters. Therefore, the parameters should be optimized for specific applications to achieve effective flow control. Based on the analysis, guidelines for the effective use of the DBD plasma actuator are proposed.
The DBD plasma actuator is also applied to the flows at cruise condition. The lift-to-drag ratio for a simple airfoil, when the DBD plasma actuator is applied, turns out to be better than that for a well-designed high-performance airfoil. Improvement of the lift-to-drag ratio is achieved not by an increase in lift but by a decrease in pressure drag. In this application, the DBD plasma actuator delays the transition, and flows over an NACA0015 airfoil become similar to the flows over a well-designed Ishii airfoil. The plasma actuator is shown to be a very effective flow control device when applied to airfoil flows both at high angles of attack and at cruise angles of attack.
Fluid dynamics is very difficult because of its strong nonlinear nature. A small change in the flow may totally change the global flow structures such as the stall phenomenon. This type of nonlinearity is considered to be a disadvantage but could be considered to be a benefit as well. If we know the underlying flow mechanisms and find the way to enhance some of the important features, we may be able to control overall flow structures with a very small energy input localized in time and space. DBD plasma actuators may be useful devices for such input, although there remains much to understand for achieving better control of flows.
Supplementary Materials
The following are available online at https://www.mdpi.com/2076-3417/8/4/546/s1, Video S1: Movie animation of Figure 17b (iso-surfaces representing the second invariant of the velocity gradient tensor colored with the chordwise vorticity).
Acknowledgments
The computational results presented in this manuscript were mainly obtained under the support of the Strategic Programs for Innovative Research (SPIRE) of the High-Performance Computing Initiative (HPCI) in Japan. The supercomputer “K” at the Advanced Institute of Computational Science (AICS), Riken, and the Fujitsu FX10 at the Information Technology Center of the University of Tokyo were mainly used for the simulations. The members of this program (Taku Nonomura, Hikaru Aono, Makoto Sato and Aiko Yakeno at JAXA/ISAS from 2011 to 2015) are the contributors to the computational study. The research, especially the experiments, was supported in part by the JSPS Grant-in-Aid for Scientific Research No. 24246141 (2012–2014) and No. 15H02324 (2015–2017). Contributions by former students of the author’s laboratory (Kengo Asada, Satoshi Sekimoto, and Yoshiaki Abe) as well as students in the laboratory are also acknowledged.
Conflicts of Interest
The author declares that the grant, scholarship and/or funding mentioned in the Acknowledgments Section do not lead to any conflict of interest. Additionally, the author declares that there is no conflict of interest regarding the publication of this manuscript.
References
- Post, M.L.; Corke, T.C. Separation Control on HIgh Angle of Attack Airfoil Using Plasma Actuators. AIAA J. 2004, 42, 2177–2184. [Google Scholar] [CrossRef]
- Roth, J.R.; Dai, X. Optimization of the Aerodynamic Plasma Actuator as an Electrohydrodynamic (EHD) Electrical Device. In Proceedings of the AIAA-2006-1203, 44th AIAA Aerospace Sciences Meeting and Exhibit, Reno, NV, USA, 9–12 January 2006. [Google Scholar]
- Corke, T.C.; Post, M.L.; Orlov, D.M. SDBD plasma enhanced aerodynamics: Concepts, optimization and applications. Prog. Aerosp. Sci. 2007, 43, 193–217. [Google Scholar] [CrossRef]
- Enloe, C.L.; McLaughlin, T.E.; Van Dyken, R.D.; Kachnew, K.D.; Jumper, E.J.; Corke, T.C. Mechanisms and Responses of a Single Dielectric Barrier Plasma Actuator: Plasma Morphology. AIAA J. 2004, 42, 589–594. [Google Scholar] [CrossRef]
- Visbal, M.R.; Gaitonde, D.V.; Roy, S. Control of transitional and turbulent flows using plasma-based actuators. In Proceedings of the AIAA-2006-3230, 25th Aerodynamic Measurement Technology and Ground Testing Conference, San Francisco, CA, USA, 5–8 June 2006. [Google Scholar]
- Greenblatt, D.; Goksel, B.; Rechenberg, I.; Schule, C.Y.; Romann, D.; Paschereit, C.O. Dielectric Barrier Discharge Flow Control at Very Low Flight Reynolds Numbers. AIAA J. 2008, 46, 1528–1541. [Google Scholar] [CrossRef]
- Greenblatt, D.; Schneider, T.; Schule, C.Y. Mechanism of flow separation control using plasma actuation. Phys. Fluids 2012, 24, 077102. [Google Scholar] [CrossRef]
- Asada, K.; Fujii, K. Computational Study of Separation Control Mechanism with the Imaginary Body Force added to the Flows over an Airfoil. In Proceedings of the 10th International Conference on Fluid Control, Measurements, and Visualization, Moscow, Russia, 17–21 August 2009. [Google Scholar]
- Rizzetta, D.P.; Visbal, M.R. Numerical investigation of plasma-based control for low-Reynolds-number airfoil flows. AIAA J. 2011, 49, 411–425. [Google Scholar] [CrossRef]
- Kaneda, I.; Sekimoto, S.; Nonomura, T.; Asada, K.; Oyama, A.; Fujii, K. An effective three-dimensional layout of actuation body force for separation control. Int. J. Aerosp. Eng. 2012, 2012, 786960. [Google Scholar] [CrossRef]
- Benard, N.; Joliboris, J.; Moreau, E. Lift and drag performances of an axisymmetric airfoil controlled by plasma actuator. J. Electrost. 2009, 67, 133–139. [Google Scholar] [CrossRef]
- Corke, T.C.; Post, M.L.; Orlov, D.M. Single dielectric barrier discharge plasma enhanced aerodynamics: Physics, modeling and applications. Exp. Fluids 2009, 46, 1–26. [Google Scholar] [CrossRef]
- Asada, K.; Ninomiya, Y.; Oyama, A.; Fujii, K. Airfoil Flow Experiment on the Duty Cycle of DBD Plasma Actuator. In Proceedings of the 47th AIAA Aerospace Sciences Meeting including the New Horizons Forum and Aerospace Exposition, Orlando, FL, USA, 5–8 January 2009. [Google Scholar]
- Fujii, K. High-performance computing based exploration of flow control with micro devices. Philos. Trans. A R. Soc. 2014, 372, 1471–2962. [Google Scholar] [CrossRef] [PubMed]
- Sidorenko, A.A.; Zanin, B.Y.; Postnikov, B.V.; Budovsky, A.D.; Starikovskii, A.Y.; Roupassov, D.V.; Zavialov, I.N.; Malmuth, N.D.; Smereczniak, P.; Silkey, J.S. Pulsed discharge actuators for rectangular wings separation control. In Proceedings of the 45th AIAA Aerospace Sciences Meeting and Exhibit, Reno, NV, USA, 8–11 January 2007. [Google Scholar]
- Goksel, B.; Greenblatt, D.; Rechenberg, I.; Nayeri, C.N.; Paschereit, C.O. Steady and Unsteady Plasma Wall Jets for Separation and Circulation Control. In Proceedings of the 3rd AIAA Flow Control Conference, Fluid Dynamics and Co-Located Conferences, San Francisco, CA, USA, 5–8 June 2006. [Google Scholar]
- Shang, J.S. Progress and future prospects of CFD in aerospace wind tunnel and beyond. In Proceedings of the 4th Joint Fluids Summer Engineering Conference, Honolulu, HI, USA, 6–10 July 2003. [Google Scholar]
- Fujii, K. Progress and future prospects of CFD in aerospace wind tunnel and beyond. Prog. Aerosp. Sci. 2005, 41, 455–470. [Google Scholar] [CrossRef]
- Sekimoto, S.; Anyoji, M.; Miyakawa, Y.; Shimomura, S.; Matsuno, T.; Nonomura, T.; Ito, S.; Nishida, H.; Fujii, K. Experimental study of separation control over a wide range of reynolds numbers using dielectric barrier discharge plasma actuator on airfoil. In Proceedings of the ASME 2017 Fluids Engineering Division Summer Meeting, Waikoloa, HI, USA, 30 July–3 August 2017. [Google Scholar]
- Shang, J.S.; Huang, P.G. Surface plasma actuators modeling for Flow control. Prog. Aerosp. Sci. 2014, 67, 29–50. [Google Scholar] [CrossRef]
- Kotsonis, M.; Ghaemi, S.; Veldhuis, L.; Scarano, F. Measurement of the body force field of plasma actuators. J. Phys. D Appl. Phys. 2011, 44, 045204. [Google Scholar] [CrossRef]
- Kriegseis, J.; Schwartz, C.; Tropea, C.; Grundmann, S. Power consumption, discharge capacitance and light emission as measures for thrust production of dielectric barrier discharge plasma actuators. J. Phys. D Appl. Phys. 2013, 46, 055202. [Google Scholar] [CrossRef]
- Suzen, Y.B.; Huang, P.G.; Jacob, J.D.; Ashpis, D.E. Numerical Simulations of Plasma Based Flow Control Applications. In Proceedings of the 35th Fluid Dynamics Conference and Exhibit, Toronto, ON, Canada, 6–9 June 2005. [Google Scholar]
- Suzen, Y.B.; Huang, P.G. Simulations of flow separation control using plasma actuators. In Proceedings of the 44th AIAA Aerospace Sciences Meeting and Exhibit, Reno, NV, USA, 9–12 January 2006. [Google Scholar]
- Tsubakino, D.; Fujii, K. Effective Layout of Plasma Actuators for a Flow Separation Control on a Wing. In Proceedings of the 45th AIAA Aerospace Sciences Meeting and Exhibit, Reno, NV, USA, 8–11 January 2007. [Google Scholar]
- Asada, K.; Fujii, K. Computational analysis of unsteady flow-field induced by plasma actuator in burst mode. In Proceedings of the AIAA 5th Flow Control Conference, Chicago, IL, USA, 28 June–1 July 2010. [Google Scholar]
- Asada, K.; Nonomura, T.; Aono, H.; Sato, M.; Okada, K.; Fujii, K. LES of transient flows controlled by DBD plasma actuator over a stalled airfoil. Int. J. Comput. Fluid Dyn. 2015, 29, 215–229. [Google Scholar] [CrossRef]
- Aono, H.; Sekimoto, S.; Sato, M.; Yakeno, A.; Fujii, K. Computational and experimental analysis of flow structures induced by a plasma actuator with burst modulations in quiescent air. Bull. JSME Mech. Eng. 2015, 2, 1–16. [Google Scholar] [CrossRef]
- Pereira, R.; Ragni, D.; Kotsonis, M. Effect of external flow velocity on momentum transfer of dielectric barrier discharge plasma actuators. J. Appl. Phys. 2014, 116, 103301. [Google Scholar] [CrossRef]
- Koizumi, T.; Nishida, H. Coupling of discharged plasma and induced flows by the DBD plasma actuators. In Proceedings of the Annual Meeting of JSASS, Tokyo, Japan, 18–19 April 2013. (In Japanese). [Google Scholar]
- Lele, S.K. Compact finite difference schemes with spectral-like resolution. J. Comput. Phys. 1992, 103, 16–42. [Google Scholar] [CrossRef]
- Fujii, K. CFD Contributions to High-Speed Shock-Related Problems: Examples Today and New Features Tomorrow. Shock Waves 2008, 18, 145–154. [Google Scholar] [CrossRef]
- Fujii, K. Efficiency Improvement of Unified Implicit Relaxation/Time Integration Algorithms. AIAA J. 1999, 37, 125–128. [Google Scholar] [CrossRef]
- Kojima, R.; Nonomura, T.; Oyama, A.; Fujii, K. Large-eddy simulation of low-Reynolds-number flow over thick and thin NACA airfoils. J. Aircr. 2013, 50, 187–196. [Google Scholar] [CrossRef]
- Lee, D.; Kawai, S.; Nonomura, T.; Anyoji, M.; Aono, H.; Oyama, A.; Asai, K.; Fujii, K. Mechanisms of surface pressure distribution within a laminar separation bubble at different Reynolds numbers. Phys. Fluids 2015, 27, 023602. [Google Scholar] [CrossRef]
- Nonomura, T.; Aono, H.; Sato, M.; Yakeno, A.; Okada, K.; Abe, Y.; Fujii, K. Control mechanism of plasma actuator for separated flow around NACA0015 at Reynolds number 63,000—Separation bubble related mechanisms. In Proceedings of the 51st AIAA Aerospace Sciences Meeting including the New Horizons Forum and Aerospace Exposition, Grapevine, TX, USA, 7–10 January 2013. [Google Scholar]
- Fujii, K. Unified Zonal Method Based on the Fortified Solution Algorithm. J. Comput. Phys. 1995, 118, 92–108. [Google Scholar] [CrossRef]
- Sekimoto, S.; Nonomura, T.; Fujii, K. Burst-Mode Frequency Effects of Dielectric Barrier Discharge Plasma Actuator for Separation Control. AIAA J. 2017, 55, 1385–1392. [Google Scholar] [CrossRef]
- Sekimoto, S. Flow Control Mechanism of a DBD Plasma Actuator for Airfoils in Low Speed Free-Stream. Ph.D. Thesis, Department of Aeronautics and Astronautics, University of Tokyo, Tokyo, Japan, March 2015. [Google Scholar]
- Sato, M.; Aono, H.; Yakeno, A.; Nonomura, T.; Fujii, K.; Okada, K.; Asada, K. Multifactorial Effects of Operating Conditions of Dielectric-Barrier-Discharge Plasma Actuator on Laminar-Separated-Flow Control. AIAA J. 2015, 53, 2544–2559. [Google Scholar] [CrossRef]
- Sato, M.; Nonomura, T.; Okada, K.; Asada, K.; Aono, H.; Yakeno, A.; Abe, Y.; Fujii, K. Mechanisms for laminar separated-flow control using dielectric-barrier-discharge plasma actuator at low Reynolds number. Phys. Fluids 2015, 27, 117101. [Google Scholar] [CrossRef]
- Yakeno, A.; Kawai, S.; Nonomura, T.; Fujii, K. Wall-Turbulence Structure with Pressure Gradient around 2D Hump. Prog. Turbul. 2016, 6, 167–170. [Google Scholar]
- Yakeno, A.; Abe, Y.; Kawai, S.; Nonomura, T.; Fujii, K. Separation control based on turbulence transition around a two-dimensional hump at different Reynolds numbers. Int. J. Heat Fluid Flow 2016, 55, 52–64. [Google Scholar] [CrossRef]
- Aono, H.; Kawai, S.; Nonomura, T.; Sato, M.; Fujii, K.; Okada, K. Plasma-Actuator Burst-Mode Frequency Effects on Leading-Edge Flow-Separation Control at Reynolds Number 2.6 × 10⁵. AIAA J. 2017, 55, 3789–3806. [Google Scholar] [CrossRef]
- Sato, M.; Okada, K.; Nonomura, T.; Aono, H.; Yakeno, A.; Asada, K.; Abe, Y.; Fujii, K. Massive parametric study by LES on separated-flow control around airfoil using DBD plasma actuator at Reynolds number 63,000. In Proceedings of the 43rd Fluid Dynamics Conference, San Diego, CA, USA, 24–27 June 2013. [Google Scholar]
- Fujii, K. Advances in Computation, Modeling and Control of Transitional and Turbulent Flows; Sengupta, T., Lele, S.K., Davidson, P.A., Eds.; World Scientific: Singapore, Singapore, 2015. [Google Scholar]
- Abe, Y.; Okada, K.; Nonomura, T.; Fujii, K. The effects of actuation frequency on the separation control over an airfoil using a synthetic jet. Prog. Flight Phys. 2015, 7, 147–168. [Google Scholar]
- Abe, Y. Mechanism of Separated-Flow Control over an Airfoil with Synthetic Jet Devices in Low-Reynolds-Number Regime. Ph.D. Thesis, Department of Aeronautics and Astronautics, University of Tokyo, Tokyo, Japan, March 2016. [Google Scholar]
- Asada, K.; Sekimoto, S.; Tatsukawa, T.; Shimizu, T.; Yabu, M.; Fujii, K. Data Mining of Experimental Data on Separation Control of the Flows Over NACA0015 and Ishii Airfoils Using Dielectric Barrier Discharge Plasma Actuator. In Proceedings of the ASME 2017 Fluids Engineering Division Summer Meeting, Waikoloa, HI, USA, 30 July–3 August 2017. [Google Scholar]
- Asano, K.; Sato, M.; Nonomura, T.; Oyama, A.; Fujii, K. Control of Airfoil Flow at Cruise Condition by DBD Plasma Actuator-Sophisticated Airfoil vs. Simple Airfoil with Flow Control. In Proceedings of the 8th AIAA Flow Control Conference, Washington, DC, USA, 13–17 June 2016. [Google Scholar]
Figure 1.
DBD (dielectric barrier discharge) plasma actuator.

Figure 2.
Flow control with the DBD plasma actuator (Experiment): (a) DBD-PA (dielectric barrier discharge plasma actuator) OFF; and (b) DBD-PA ON with burst mode.
Figure 2.
Flow control with the DBD plasma actuator (Experiment): (a) DBD-PA (dielectric barrier discharge plasma actuator) OFF; and (b) DBD-PA ON with burst mode.

Figure 3.
Schematic picture of frequencies for the burst mode.
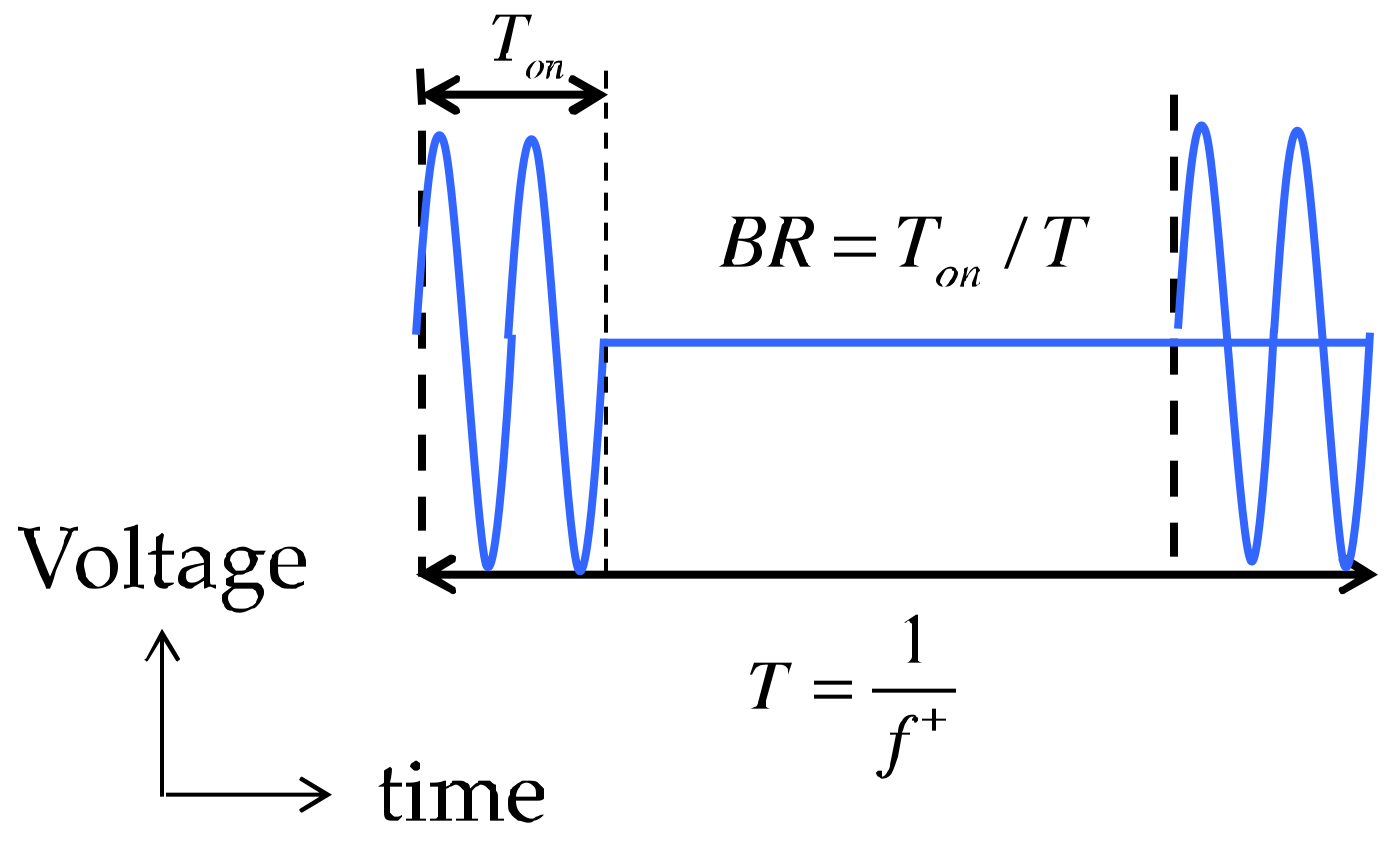
Figure 4.
Airfoil model with the DBD plasma actuator in the wind tunnel.

Figure 5.
Burst frequency effect over the lift coefficients CL (Experiment): NACA0015, α = 12°, Re = 6.3 × 10⁴, Vpp = 4.0 kV. Reproduced with permission from [13], AIAA, 2009.
Figure 5.
Burst frequency effect over the lift coefficients CL (Experiment): NACA0015, α = 12°, Re = 6.3 × 10⁴, Vpp = 4.0 kV. Reproduced with permission from [13], AIAA, 2009.

Figure 6.
Chordwise Cp distributions for NACA0015, α = 14°, BR = 10%, and Re = 6.3 × 10⁴ (Experiment): (a) DBD-PA OFF; (b) DBD-PA ON: F+ = 1.0; and (c) DBD-PA ON: F+ = 6.0.
Figure 6.
Chordwise Cp distributions for NACA0015, α = 14°, BR = 10%, and Re = 6.3 × 10⁴ (Experiment): (a) DBD-PA OFF; (b) DBD-PA ON: F+ = 1.0; and (c) DBD-PA ON: F+ = 6.0.

Figure 7.
Effect of DBD plasma actuator position for NACA0015, α = 14°, BR = 10%, and Re = 6.3 × 10⁴ [45]: (a) α = 12°; and (b) α = 14°.
Figure 7.
Effect of DBD plasma actuator position for NACA0015, α = 14°, BR = 10%, and Re = 6.3 × 10⁴ [45]: (a) α = 12°; and (b) α = 14°.

Figure 8.
Aerodynamic performance versus rapidity of turbulent energy promotion in the chordwise direction: α = 12°, Re = 6.3 × 10⁴ [14].
Figure 8.
Aerodynamic performance versus rapidity of turbulent energy promotion in the chordwise direction: α = 12°, Re = 6.3 × 10⁴ [14].
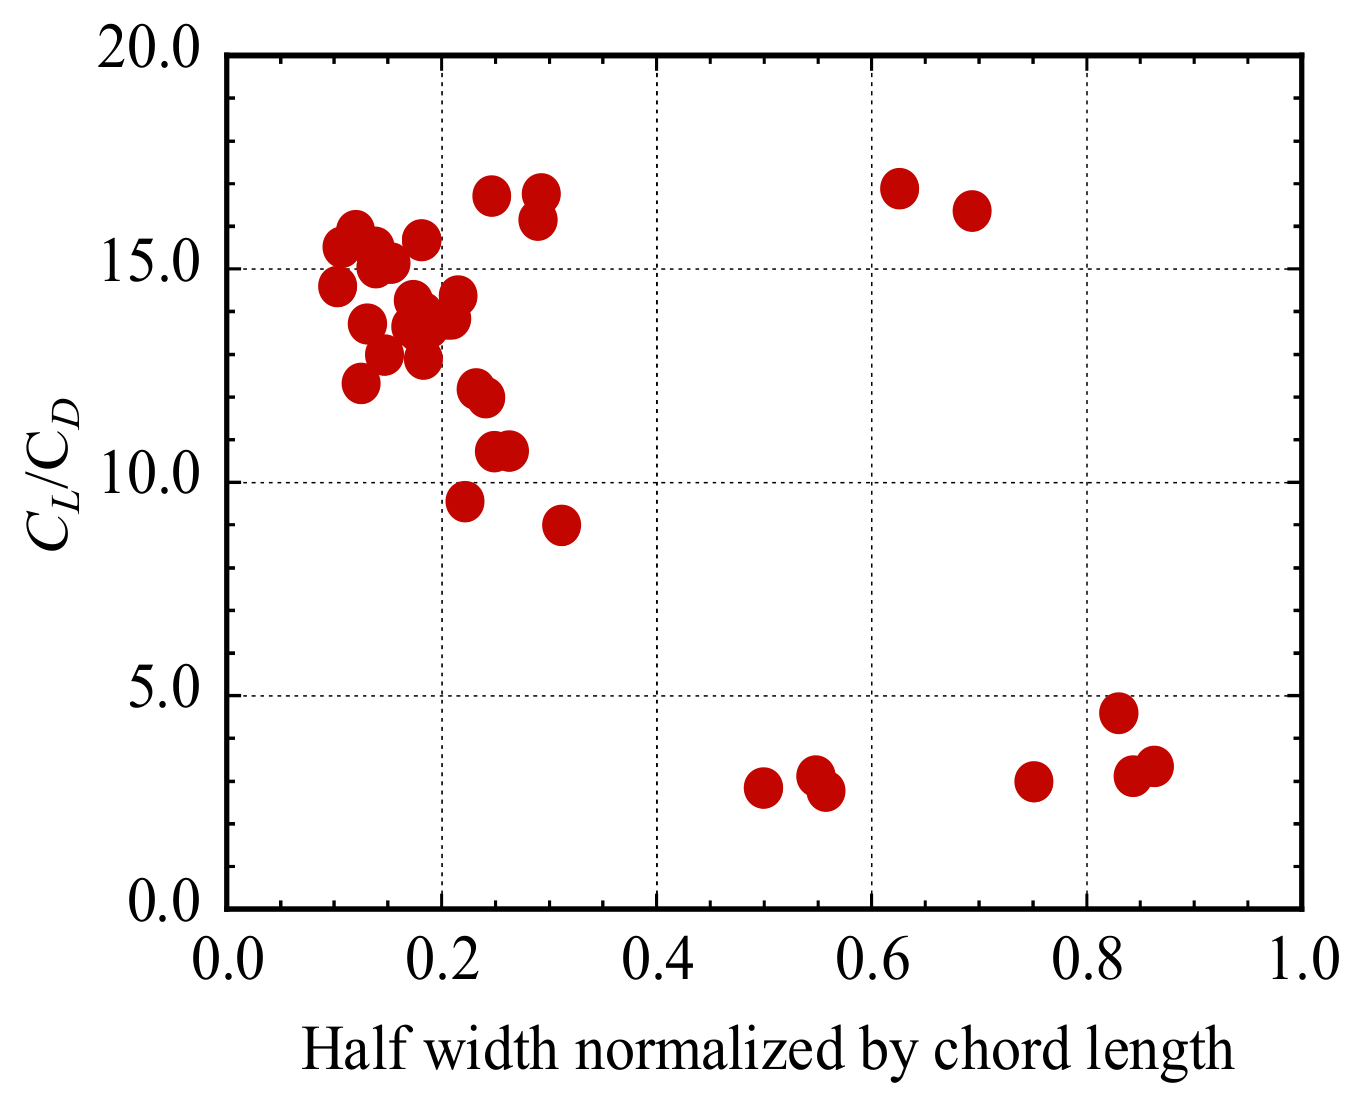
Figure 9.
Aerodynamic performance versus Burst frequency: α = 12°, BR = 10%, Re = 6.3 × 10⁴.

Figure 10.
Instantaneous PIV particle images [39] (Experiment). NACA0015, α =12°, BR = 10%, Re = 6.3 × 10⁴.
Figure 10.
Instantaneous PIV particle images [39] (Experiment). NACA0015, α =12°, BR = 10%, Re = 6.3 × 10⁴.

Figure 11.
Ensemble-averaged flow fields. Black contour lines are second invariant of the velocity gradient tensors Q-criterion [27]: NACA0015, α = 12°, BR = 10%, Dc = 1.0, Re = 6.3 × 10⁴.
Figure 11.
Ensemble-averaged flow fields. Black contour lines are second invariant of the velocity gradient tensors Q-criterion [27]: NACA0015, α = 12°, BR = 10%, Dc = 1.0, Re = 6.3 × 10⁴.

Figure 12.
Chordwise Cp distributions (Experiment): NACA0015, α = 22.0°, Re = 7.6 × 10⁵, BR = 10%. DBD plasma actuator is located at 5% of the chord, Vpp = 9 kV.
Figure 12.
Chordwise Cp distributions (Experiment): NACA0015, α = 22.0°, Re = 7.6 × 10⁵, BR = 10%. DBD plasma actuator is located at 5% of the chord, Vpp = 9 kV.

Figure 13.
Aerodynamic Coefficients of NACA0015 with and without DBD plasma actuator compared with Ishii airfoil. NACA0015 (α = 6°), Ishii airfoil (α = 4°), Re = 6.3 × 10⁴, F+ = 6.0, Dc = 0.05, BR = 10%.
Figure 13.
Aerodynamic Coefficients of NACA0015 with and without DBD plasma actuator compared with Ishii airfoil. NACA0015 (α = 6°), Ishii airfoil (α = 4°), Re = 6.3 × 10⁴, F+ = 6.0, Dc = 0.05, BR = 10%.
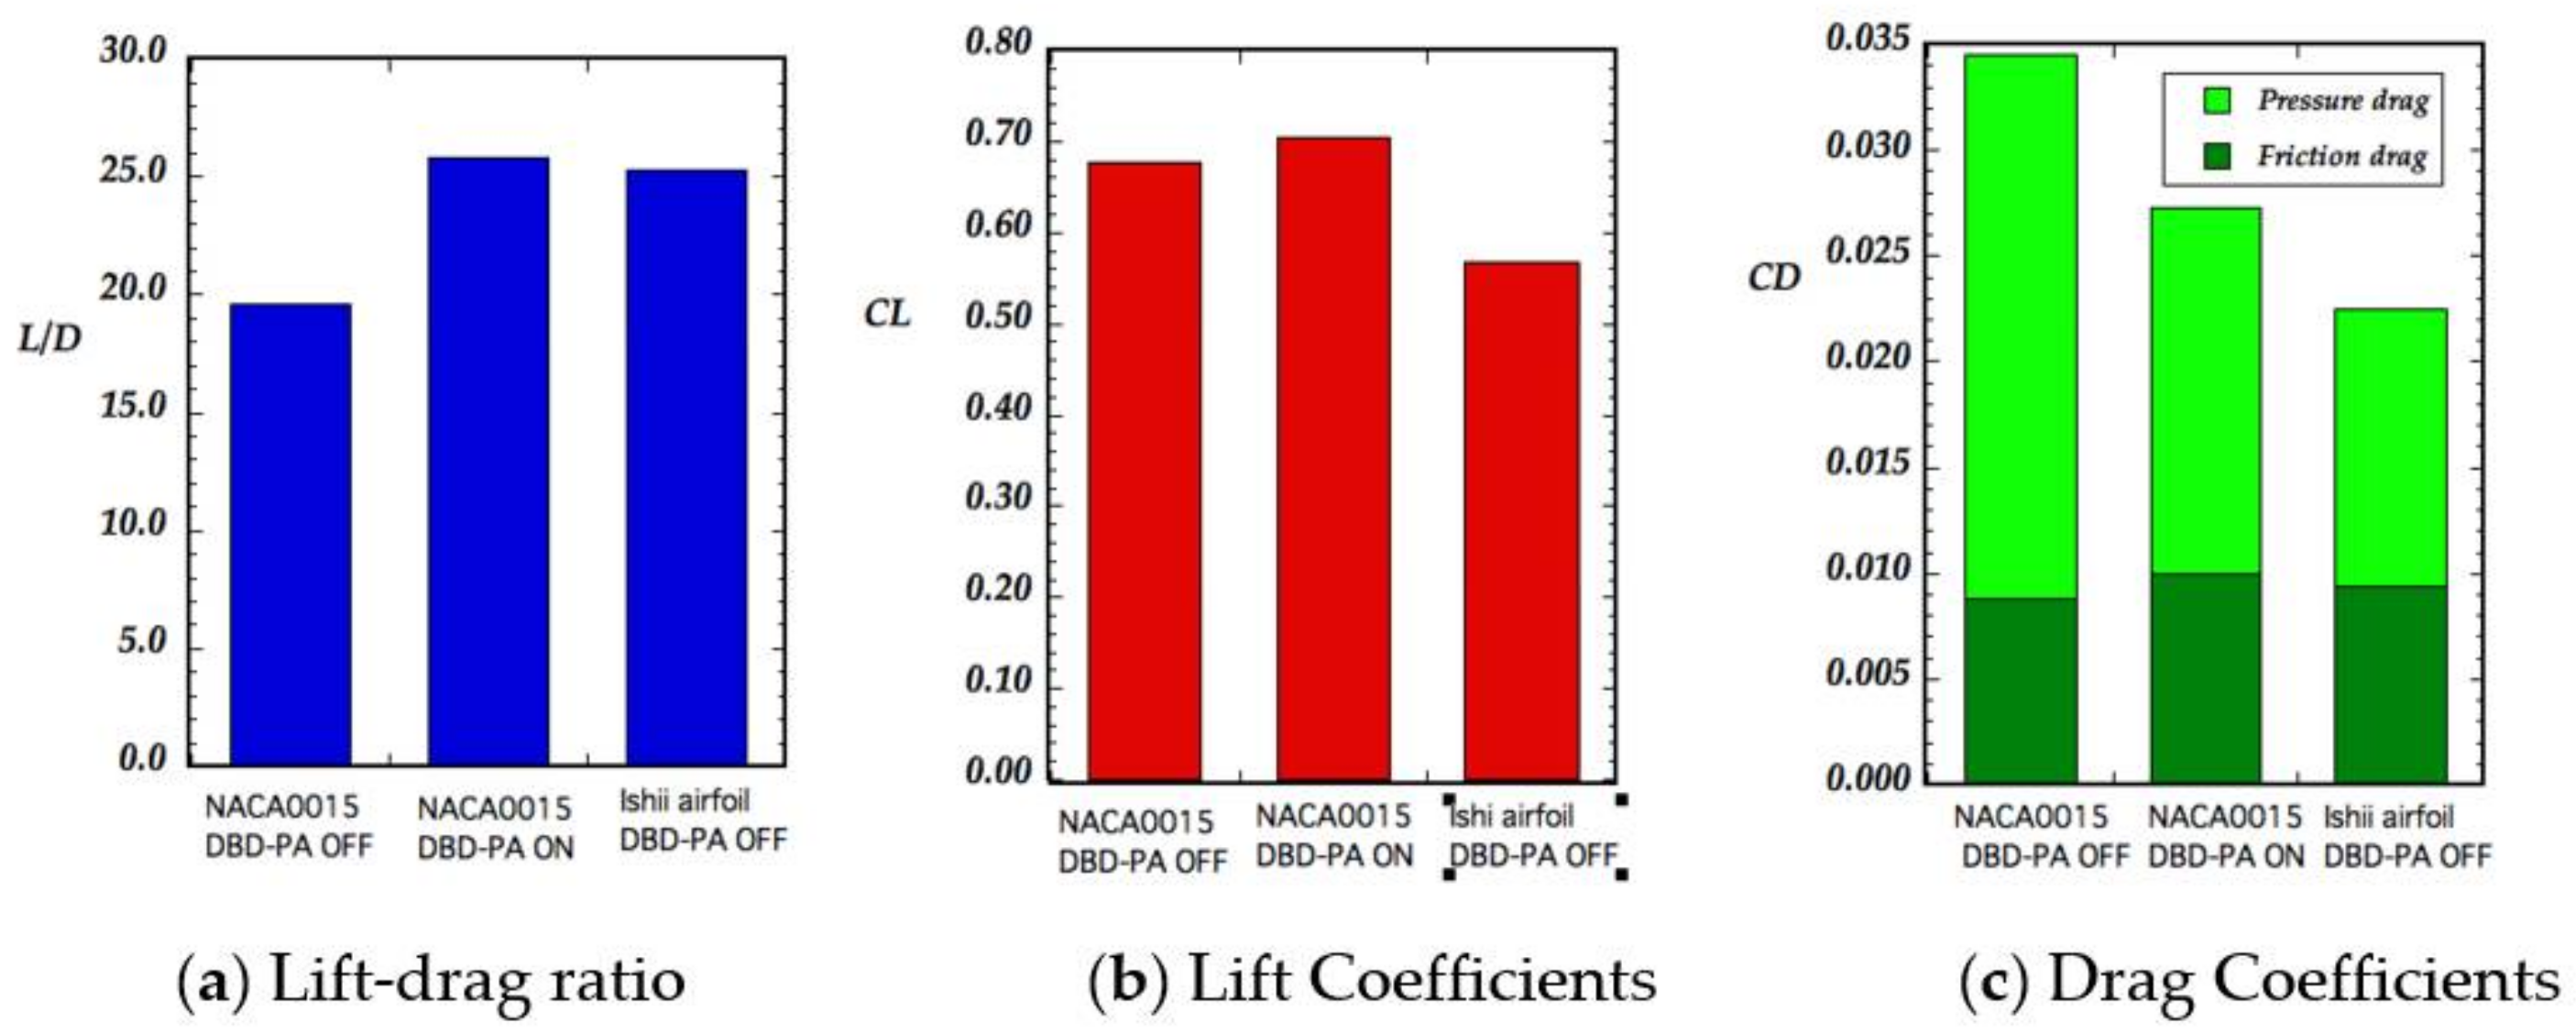
Figure 14.
Chordwise skin friction coefficient distributions over the upper surface of the airfoils: NACA0015 (α = 6°), Ishii airfoil (α = 4°), Re = 6.3 × 10⁴, F+ = 6.0, Dc = 0.05, BR = 10%.
Figure 14.
Chordwise skin friction coefficient distributions over the upper surface of the airfoils: NACA0015 (α = 6°), Ishii airfoil (α = 4°), Re = 6.3 × 10⁴, F+ = 6.0, Dc = 0.05, BR = 10%.
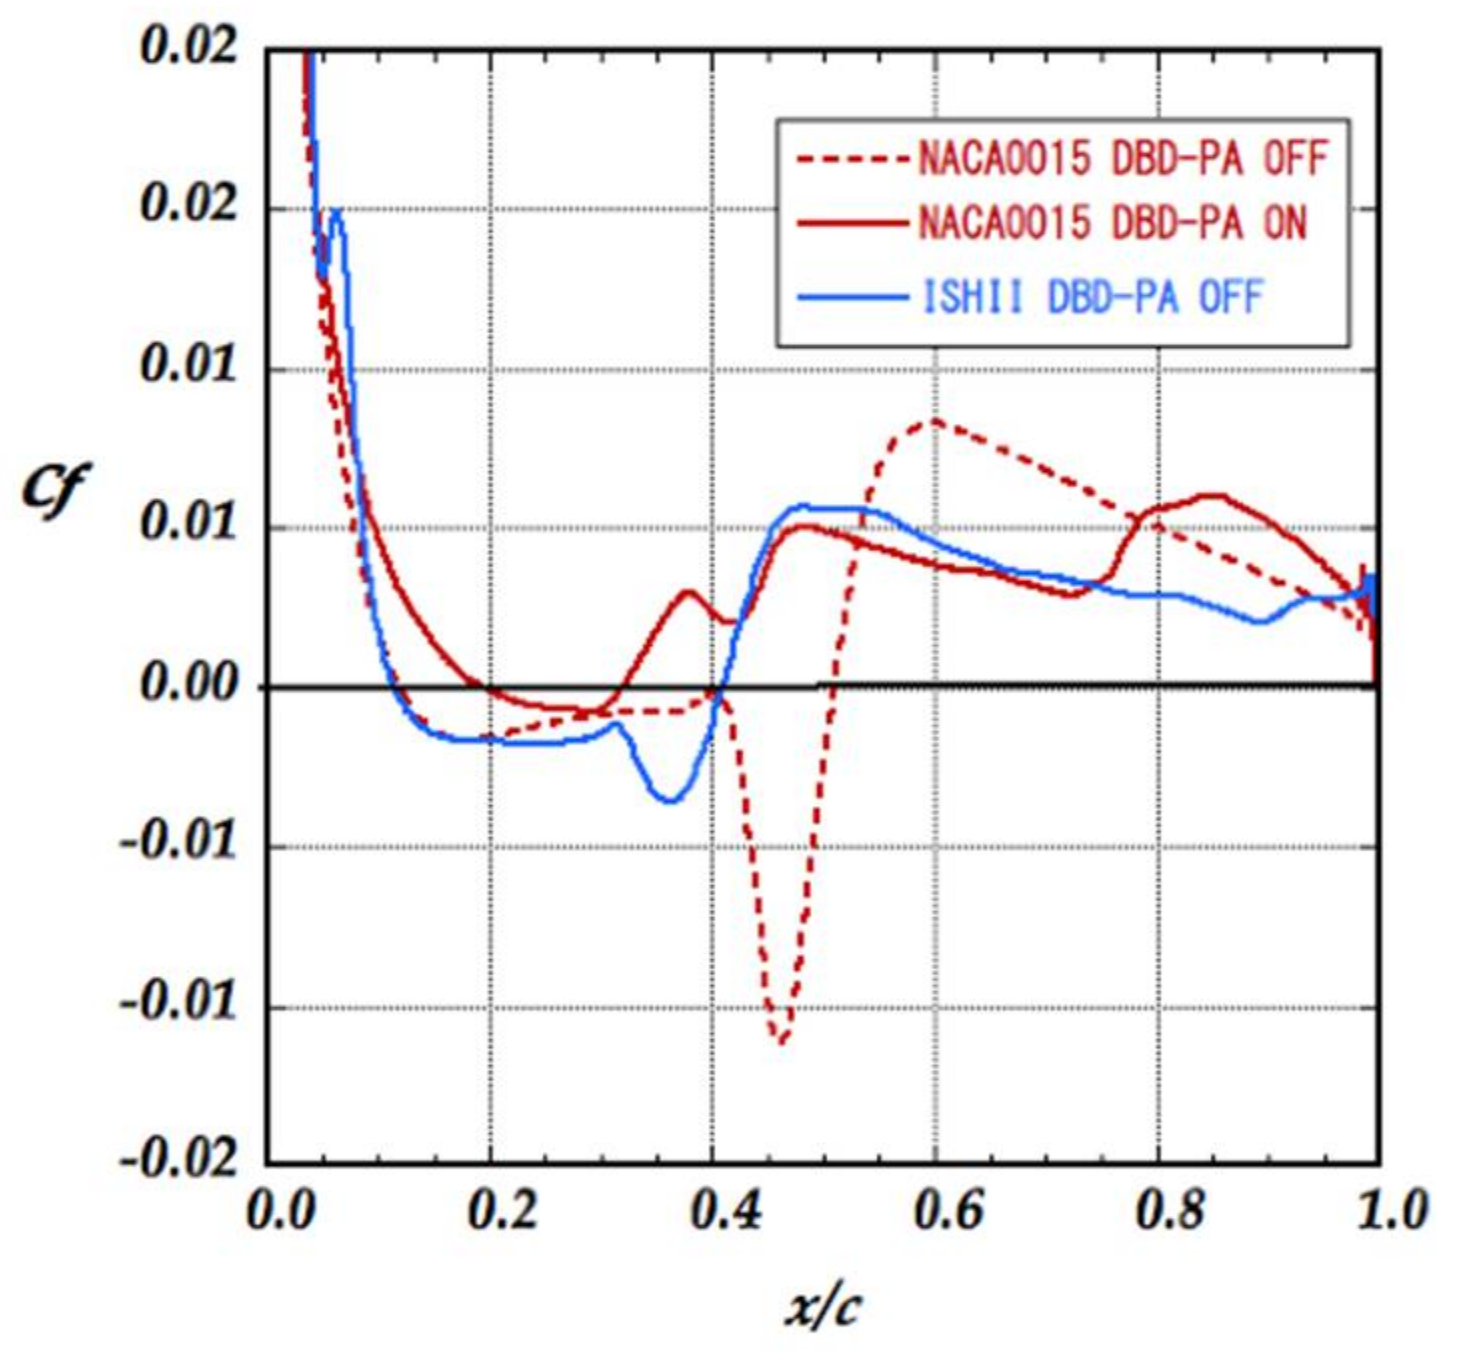
Figure 15.
Chordwise pressure coefficient distributions over the airfoil surface: NACA0015 (α = 6°), Ishii airfoil (α = 4°), Re = 6.3 × 10⁴, F+ = 6.0, Dc = 0.05, BR = 10%.
Figure 15.
Chordwise pressure coefficient distributions over the airfoil surface: NACA0015 (α = 6°), Ishii airfoil (α = 4°), Re = 6.3 × 10⁴, F+ = 6.0, Dc = 0.05, BR = 10%.

Figure 16.
Power spectrum density of the chordwise velocity fluctuation at several locations [50] NACA0015 (α = 6°), Ishii airfoil (α = 4°), F+ = 6.0, BR = 10%, Dc = 0.05, Re = 6.3 × 10⁴.
Figure 16.
Power spectrum density of the chordwise velocity fluctuation at several locations [50] NACA0015 (α = 6°), Ishii airfoil (α = 4°), F+ = 6.0, BR = 10%, Dc = 0.05, Re = 6.3 × 10⁴.
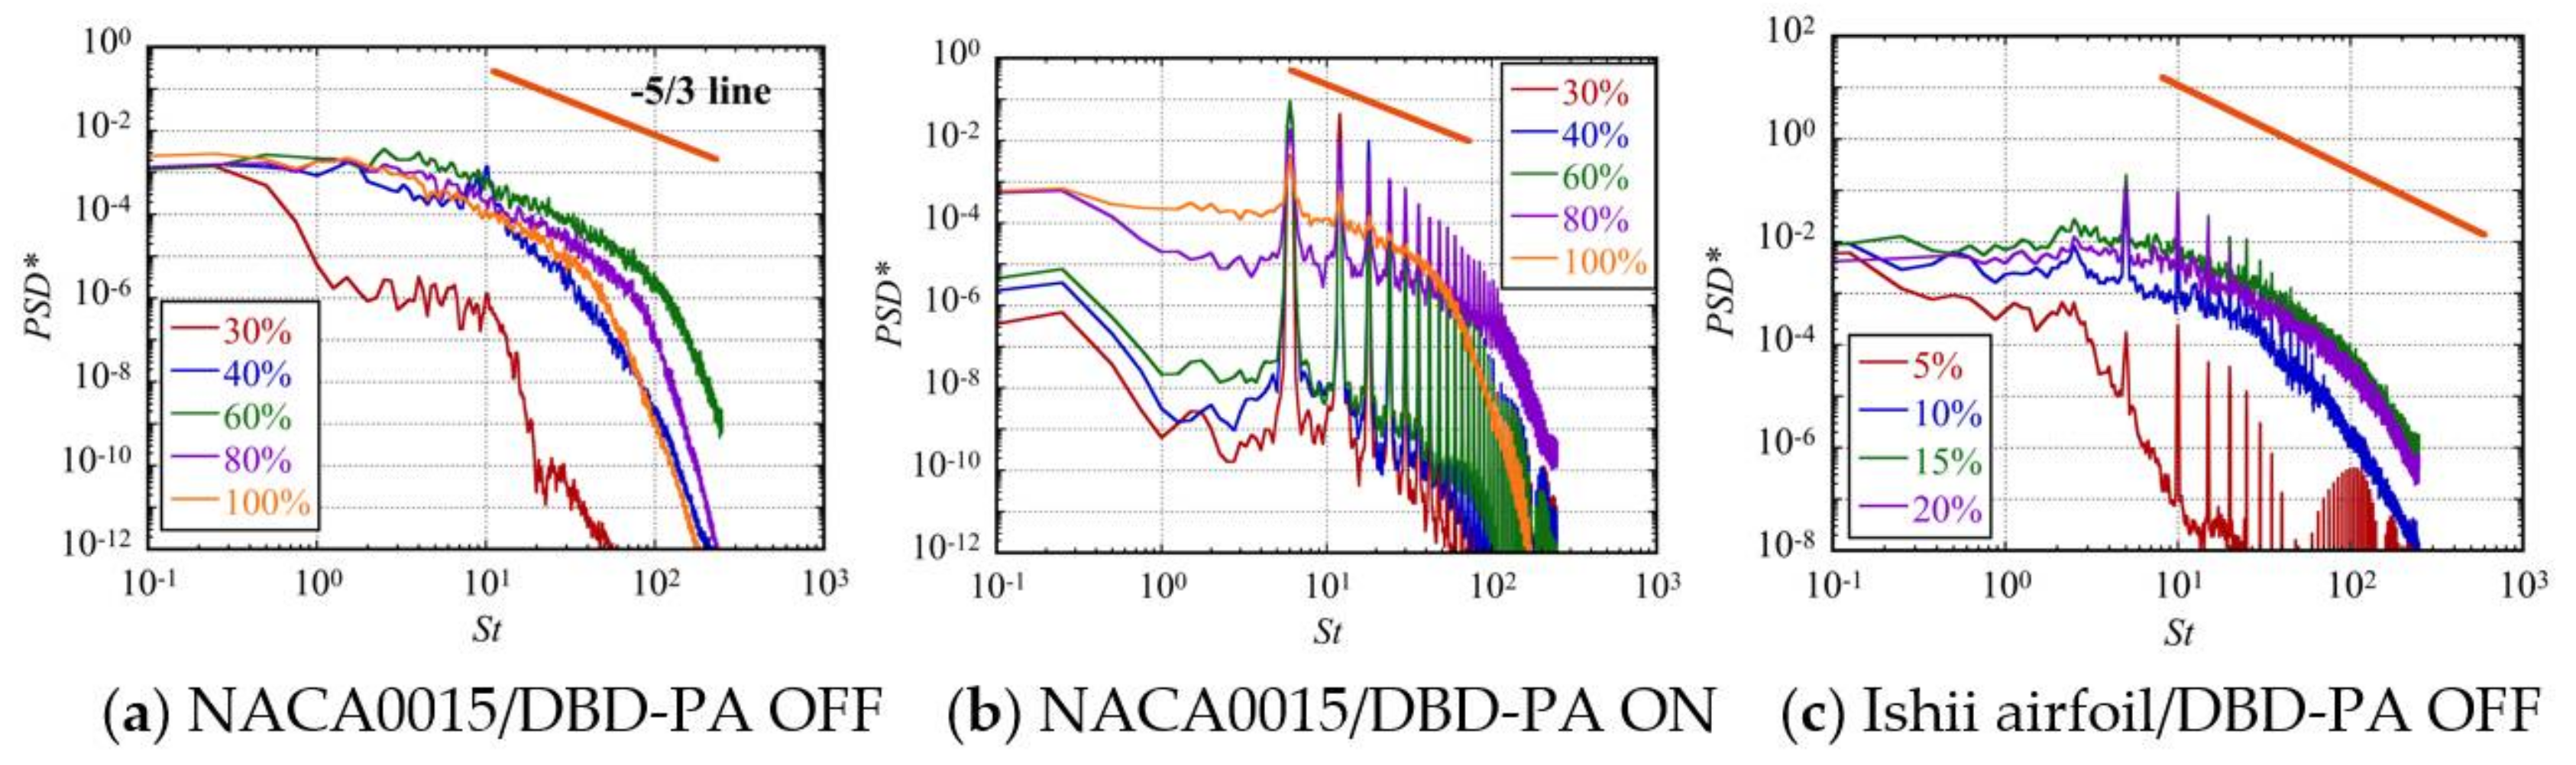
Figure 17.
Instantaneous snap shot of the flow structures (iso-surfaces representing the second invariant of the velocity gradient tensor colored with the chordwise vorticity) NACA0015 (α = 6°), Ishii airfoil (α = 4°), Re = 6.3 × 10⁴, F+ = 6.0, Dc = 0.05, BR = 10.
Figure 17.
Instantaneous snap shot of the flow structures (iso-surfaces representing the second invariant of the velocity gradient tensor colored with the chordwise vorticity) NACA0015 (α = 6°), Ishii airfoil (α = 4°), Re = 6.3 × 10⁴, F+ = 6.0, Dc = 0.05, BR = 10.

Table 1.
Aerodynamic Coefficients (CFD): α = 14°, BR = 10%, Dc = 1.0, Re = 6.3 × 10⁴.
| Burst Frequency | CL | CD | L/D (Lift-to-Drag Ratio) |
|---|---|---|---|
| off | 0.54923 | 0.20287 | 2.7073 |
| F+ = 1 | 0.76022 | 0.21408 | 3.5511 |
| F+ = 6 | 1.0145 | 0.13665 | 7.4241 |
© 2018 by the author. Licensee MDPI, Basel, Switzerland. This article is an open access article distributed under the terms and conditions of the Creative Commons Attribution (CC BY) license (http://creativecommons.org/licenses/by/4.0/).
Share and Cite
MDPI and ACS Style
Fujii, K. Three Flow Features behind the Flow Control Authority of DBD Plasma Actuator: Result of High-Fidelity Simulations and the Related Experiments. Appl. Sci. 2018, 8, 546. https://doi.org/10.3390/app8040546
AMA Style
Fujii K. Three Flow Features behind the Flow Control Authority of DBD Plasma Actuator: Result of High-Fidelity Simulations and the Related Experiments. Applied Sciences. 2018; 8(4):546. https://doi.org/10.3390/app8040546
Chicago/Turabian StyleFujii, Kozo. 2018. "Three Flow Features behind the Flow Control Authority of DBD Plasma Actuator: Result of High-Fidelity Simulations and the Related Experiments" Applied Sciences 8, no. 4: 546. https://doi.org/10.3390/app8040546
Note that from the first issue of 2016, this journal uses article numbers instead of page numbers. See further details here.