A Bayesian Network Based Adaptability Design of Product Structures for Function Evolution


Abstract
:Featured Application
Abstract
1. Introduction
- (1)
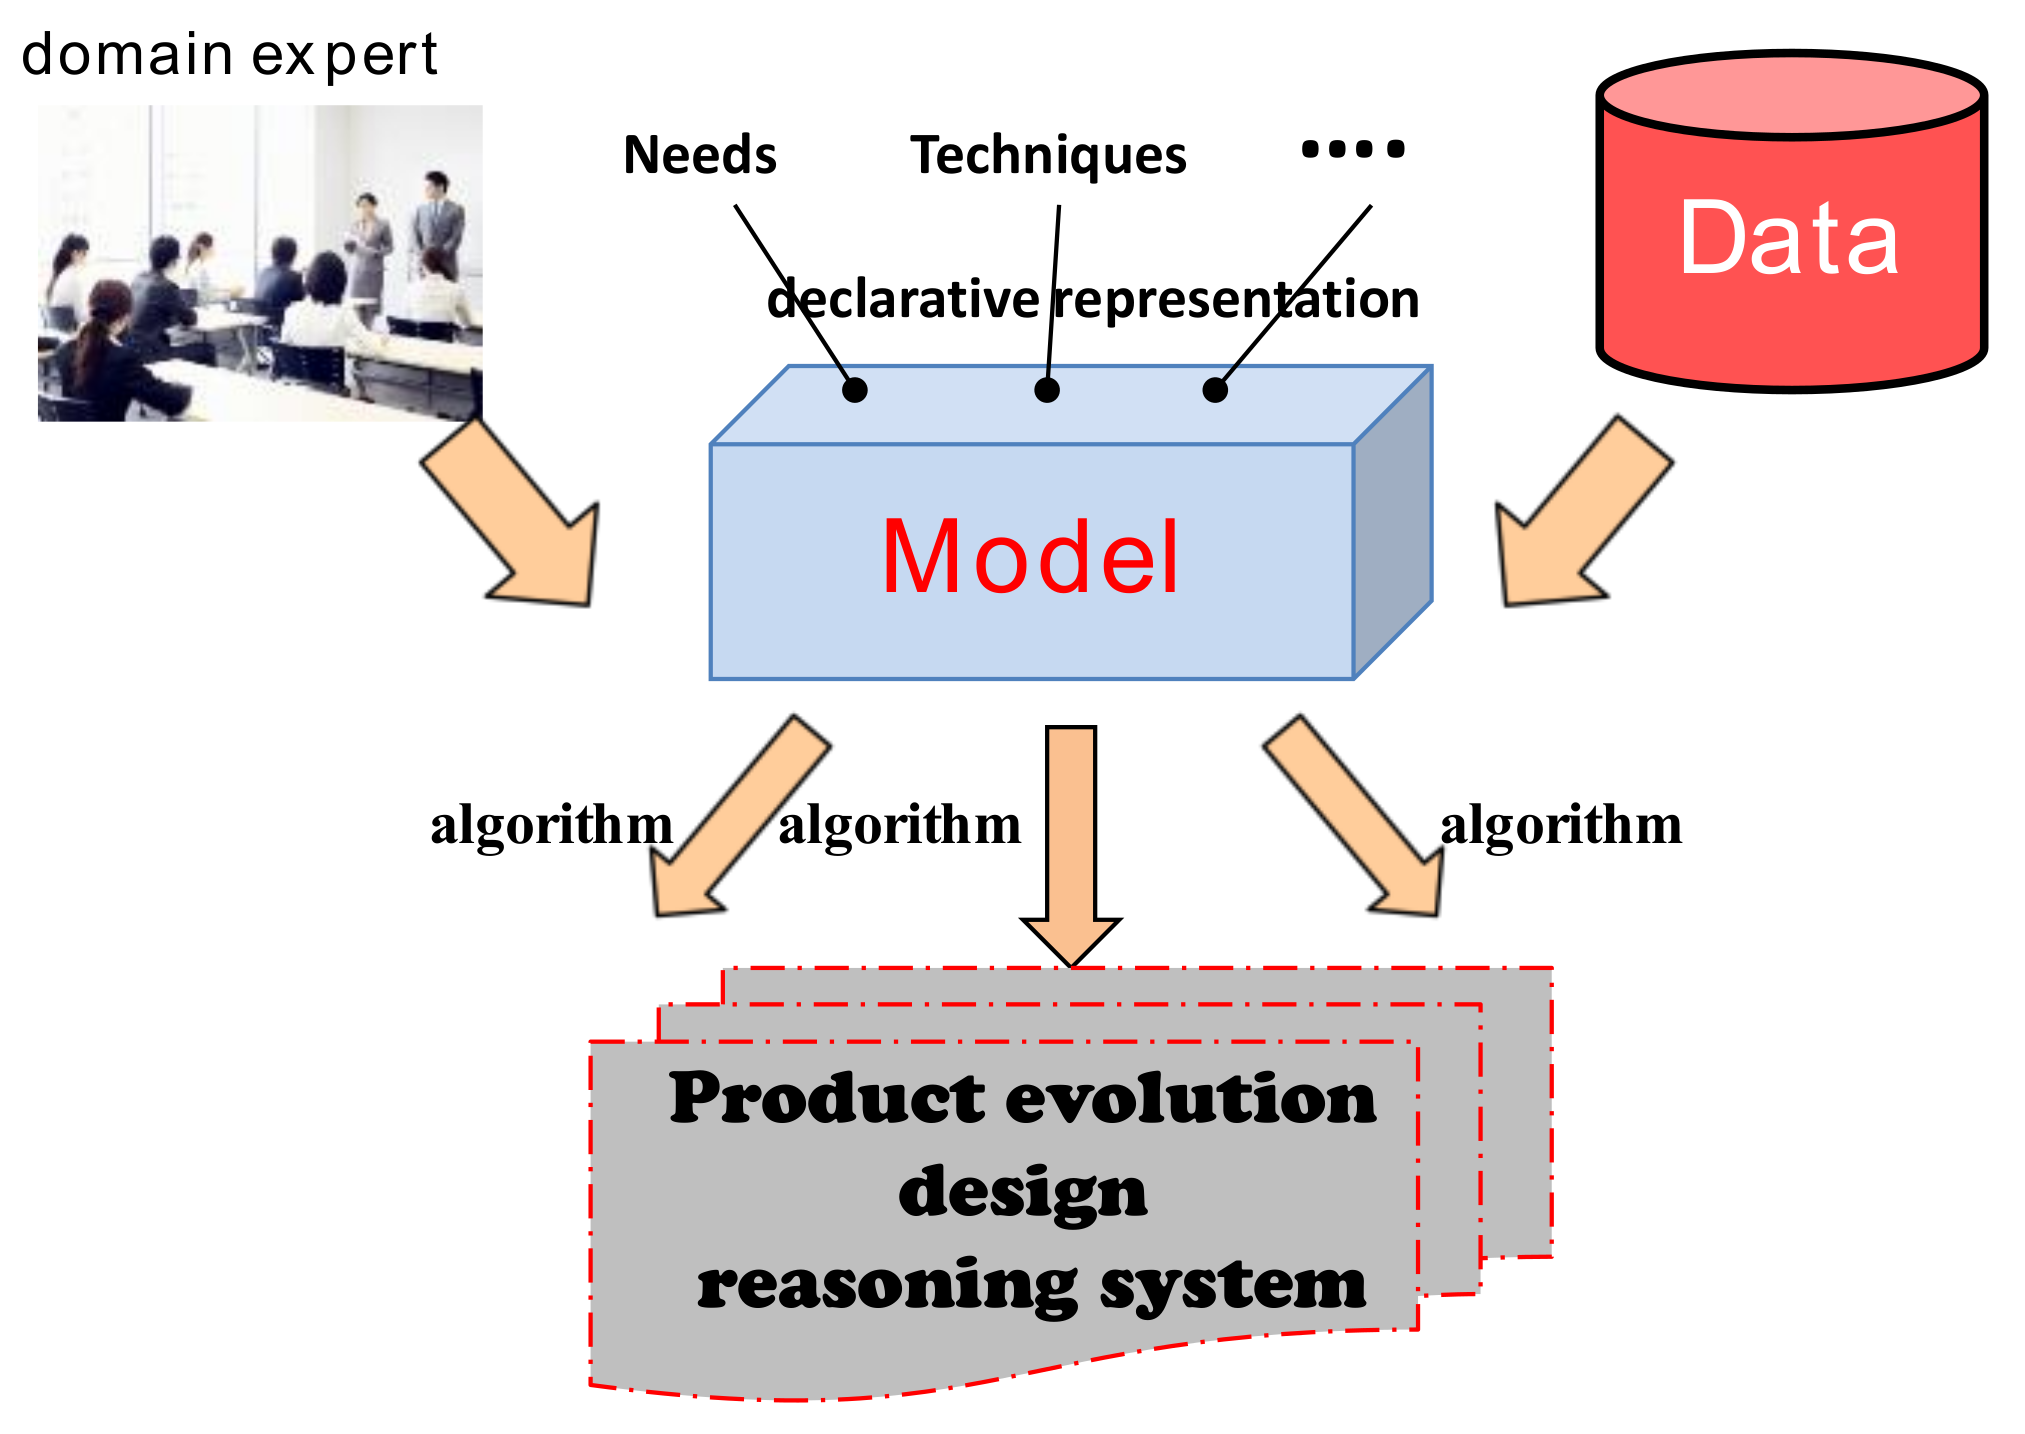
- We propose a Bayesian network based model for product dynamic design reasoning. It has the advantage of crossing the barrier of traditional product design methods and empirical experience. This model allows for us to represent all of the relevant factors and their dependency relationships in a probabilistic way so that a variety of inferences can be conducted to guide the design process.
- (2)
- We develop a product dynamic design scheme using data analysis and reasoning. Since product design is not only related to changes in customer demands, but also other factors in the implementation process with direct or indirect relationships, it is difficult to analyze the complex rules that are hidden in the product design process. Our method provides a quantitative way to learn these design rules.
- (3)
- We establish a probabilistic product dynamic design model to model the uncertainty that is involved in market demand and the structural diversity of products.
- (4)
- We obtain product dynamic evolution law through Bayesian network model based reasoning, which provides the theoretical basis for product evolution (dynamic) design.
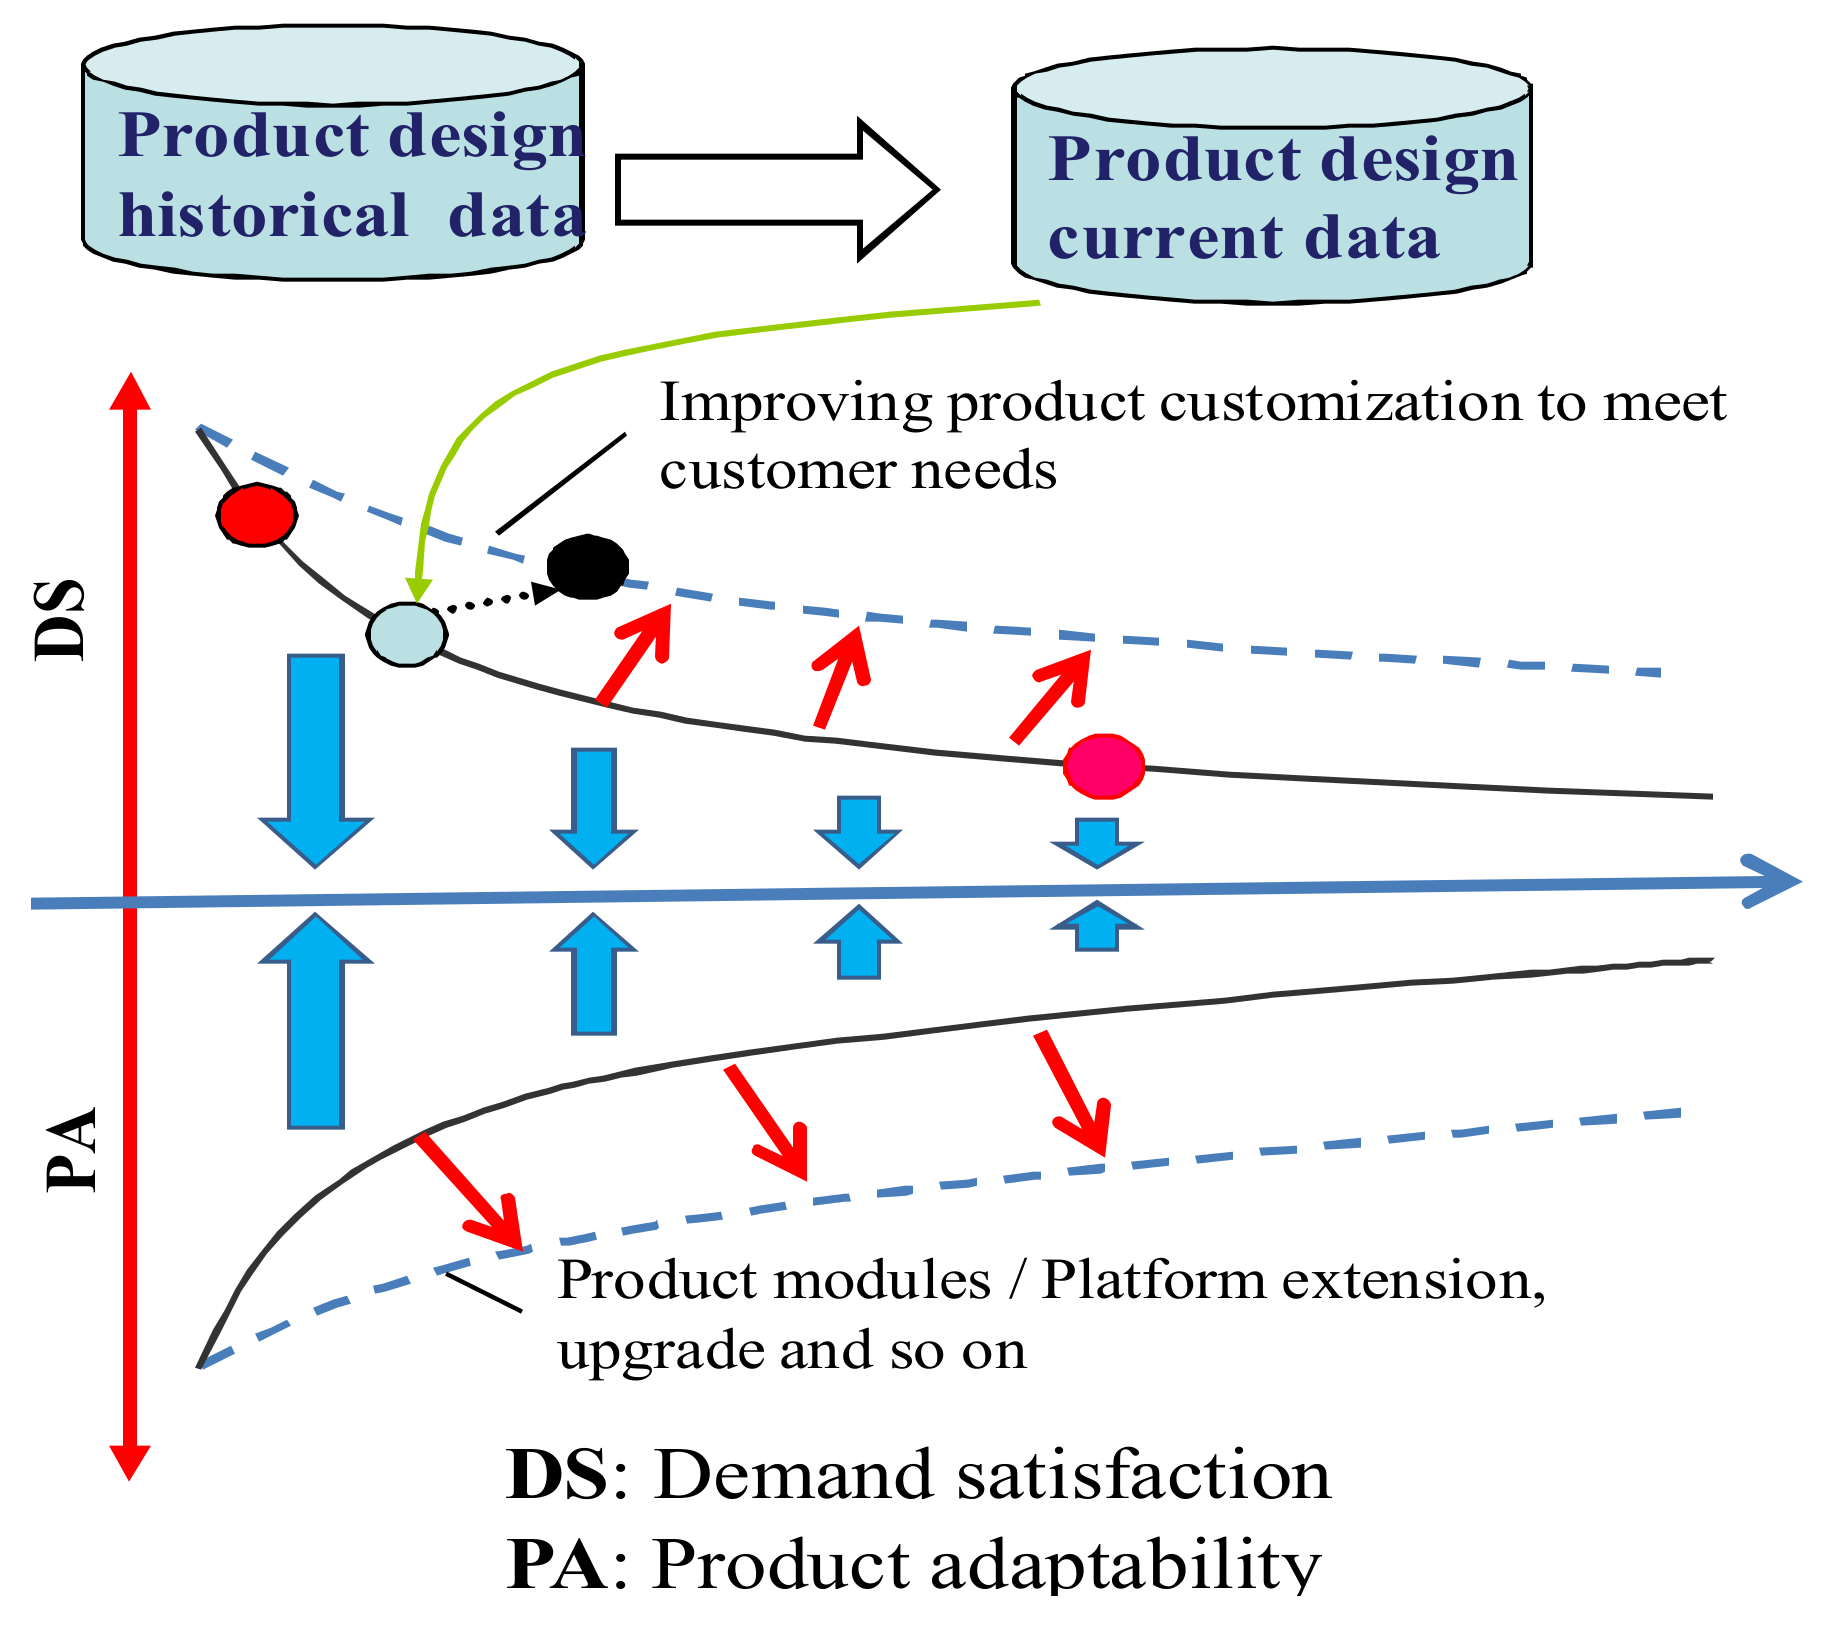
2. Function Evolution in PF Design
2.1. Data Driven PF Dynamic Design
2.2. Evolution Design Analysis for PF
3. Data-Driven Dynamic Design Model for Product Structure
3.1. Probablistic Reasoning and Analysis Based on Bayesian Network
- ➢
- the conditional independence and dependency among the attributes is intuitivein the Bayesian Network; and,
- ➢
- the Bayesian Network depicts the joint probability distributions of events in a more succinct form. Therefore, the occurrence probability of a given event can be derived rapidly according to the structure of the network and the probability table.
3.2. Dynamic Design Model Based on Bayesian Network
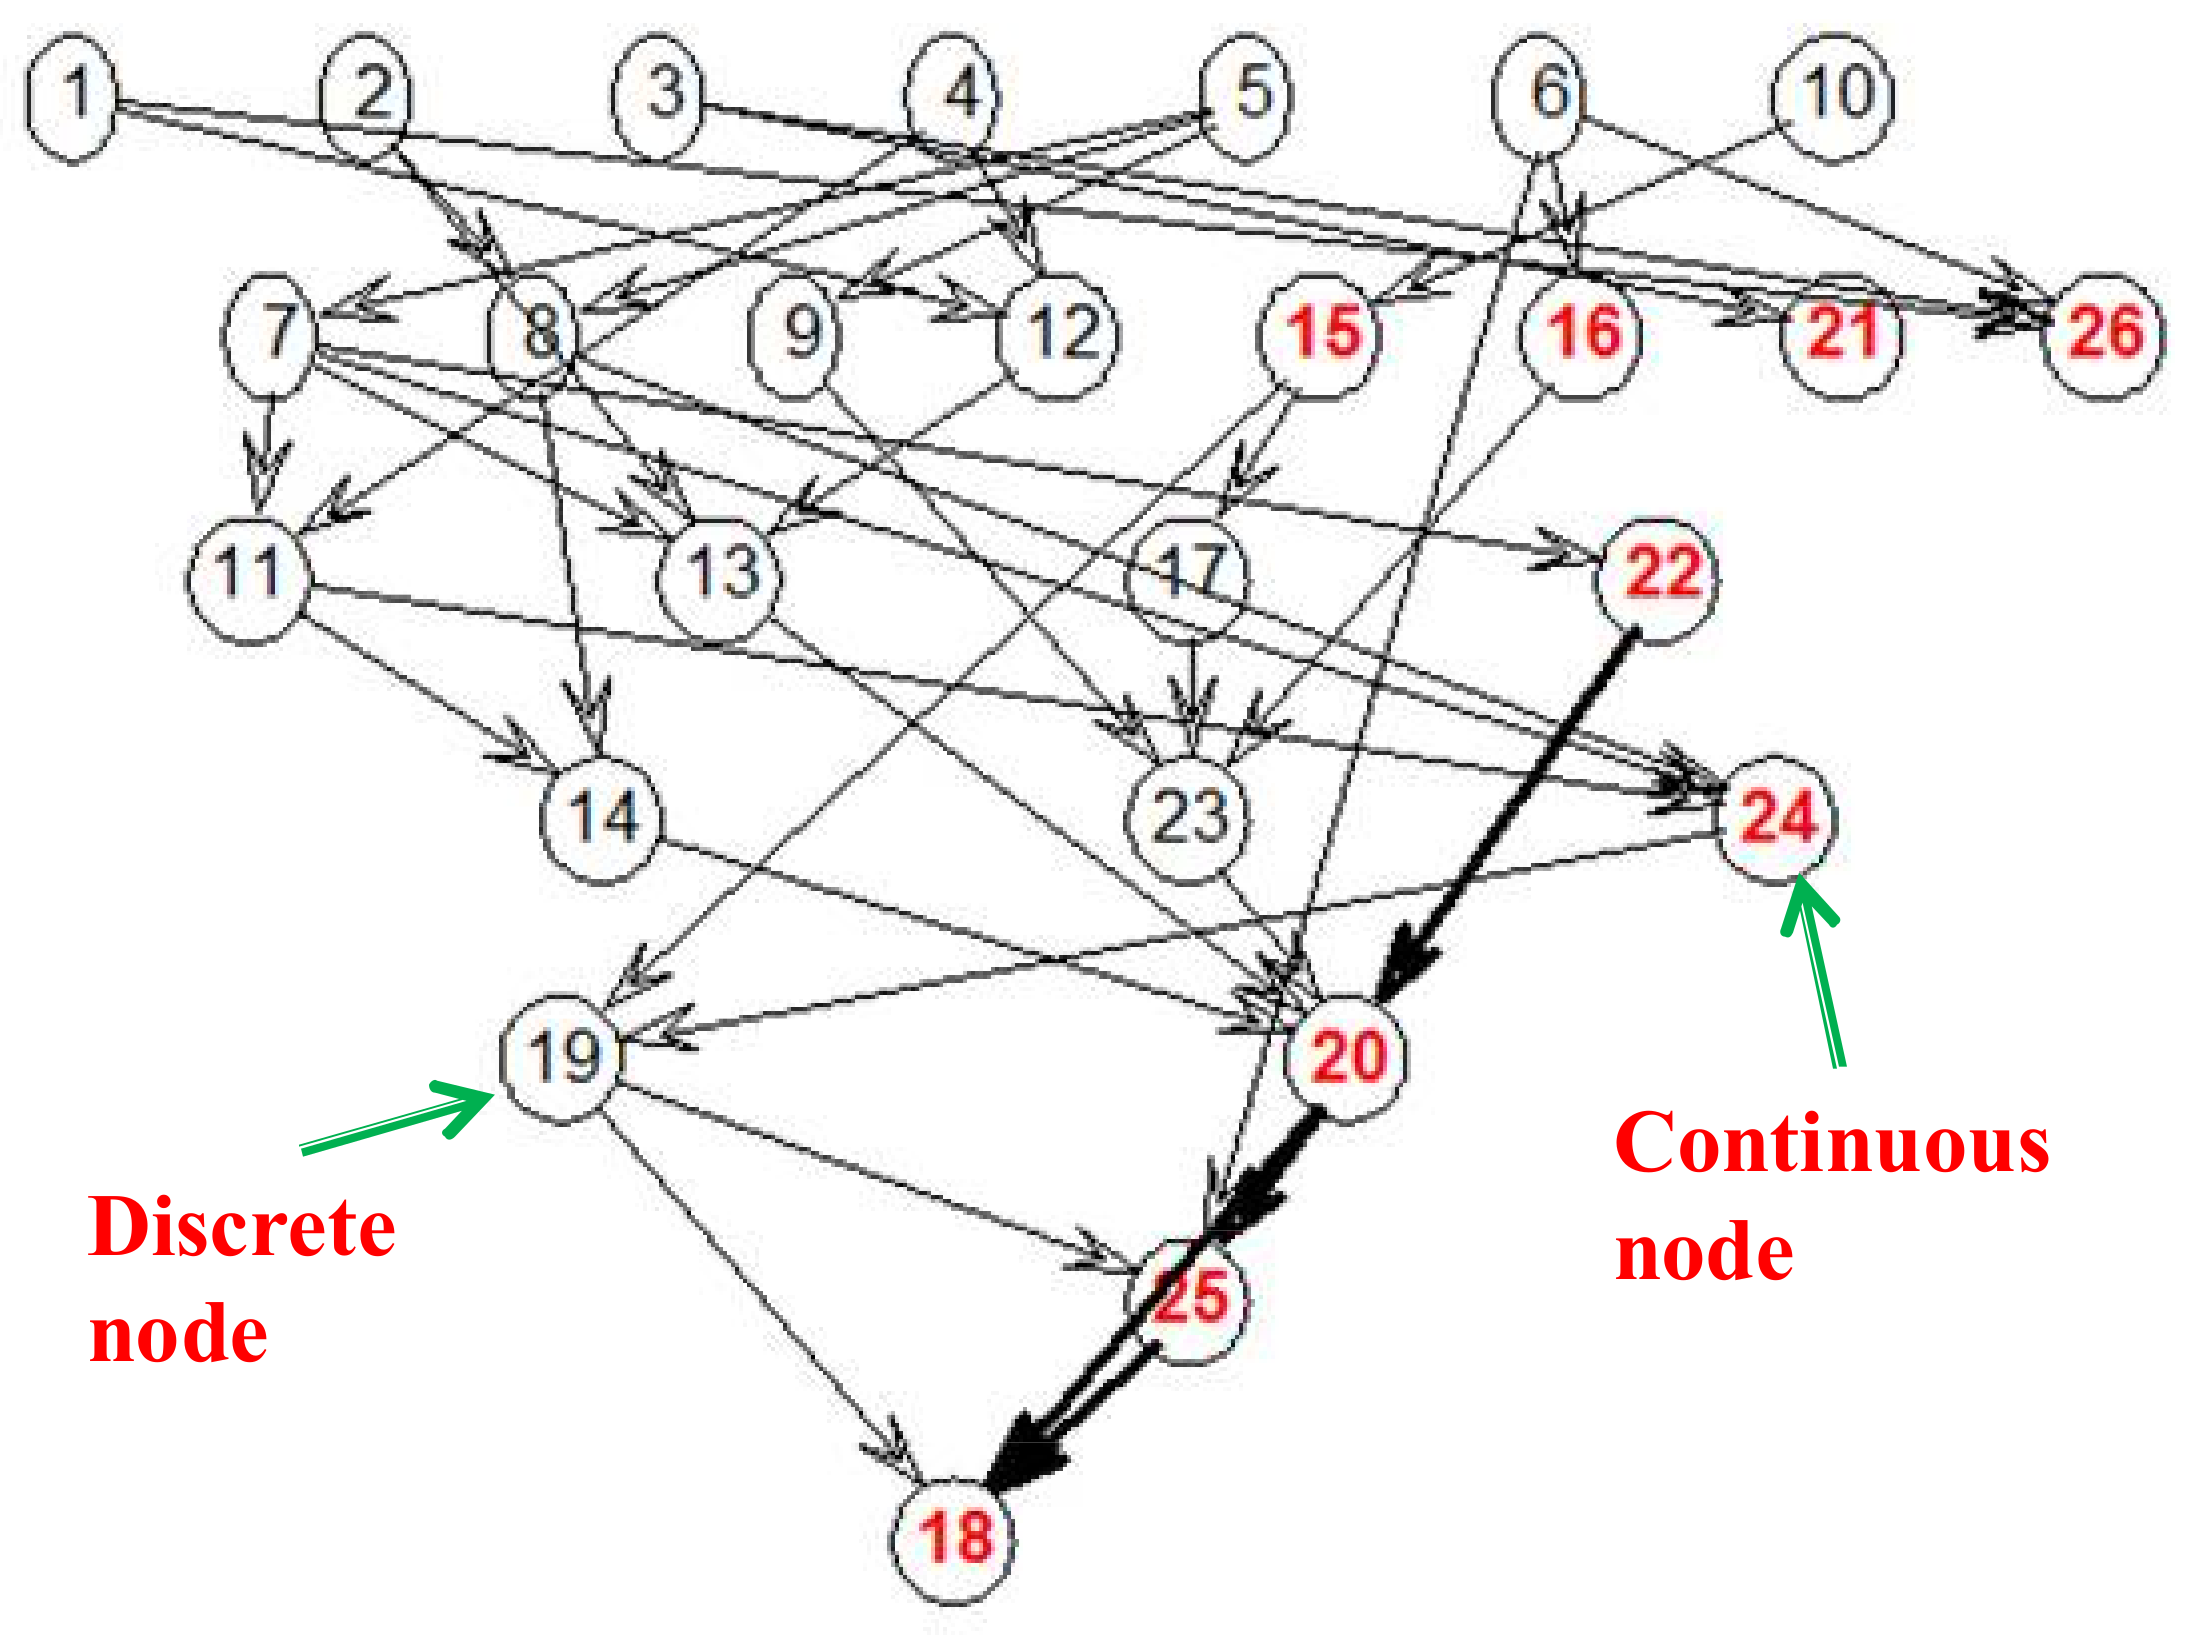
3.2.1. Structure of the Network Model
3.2.2. Parameters Learning of the Bayesian Network
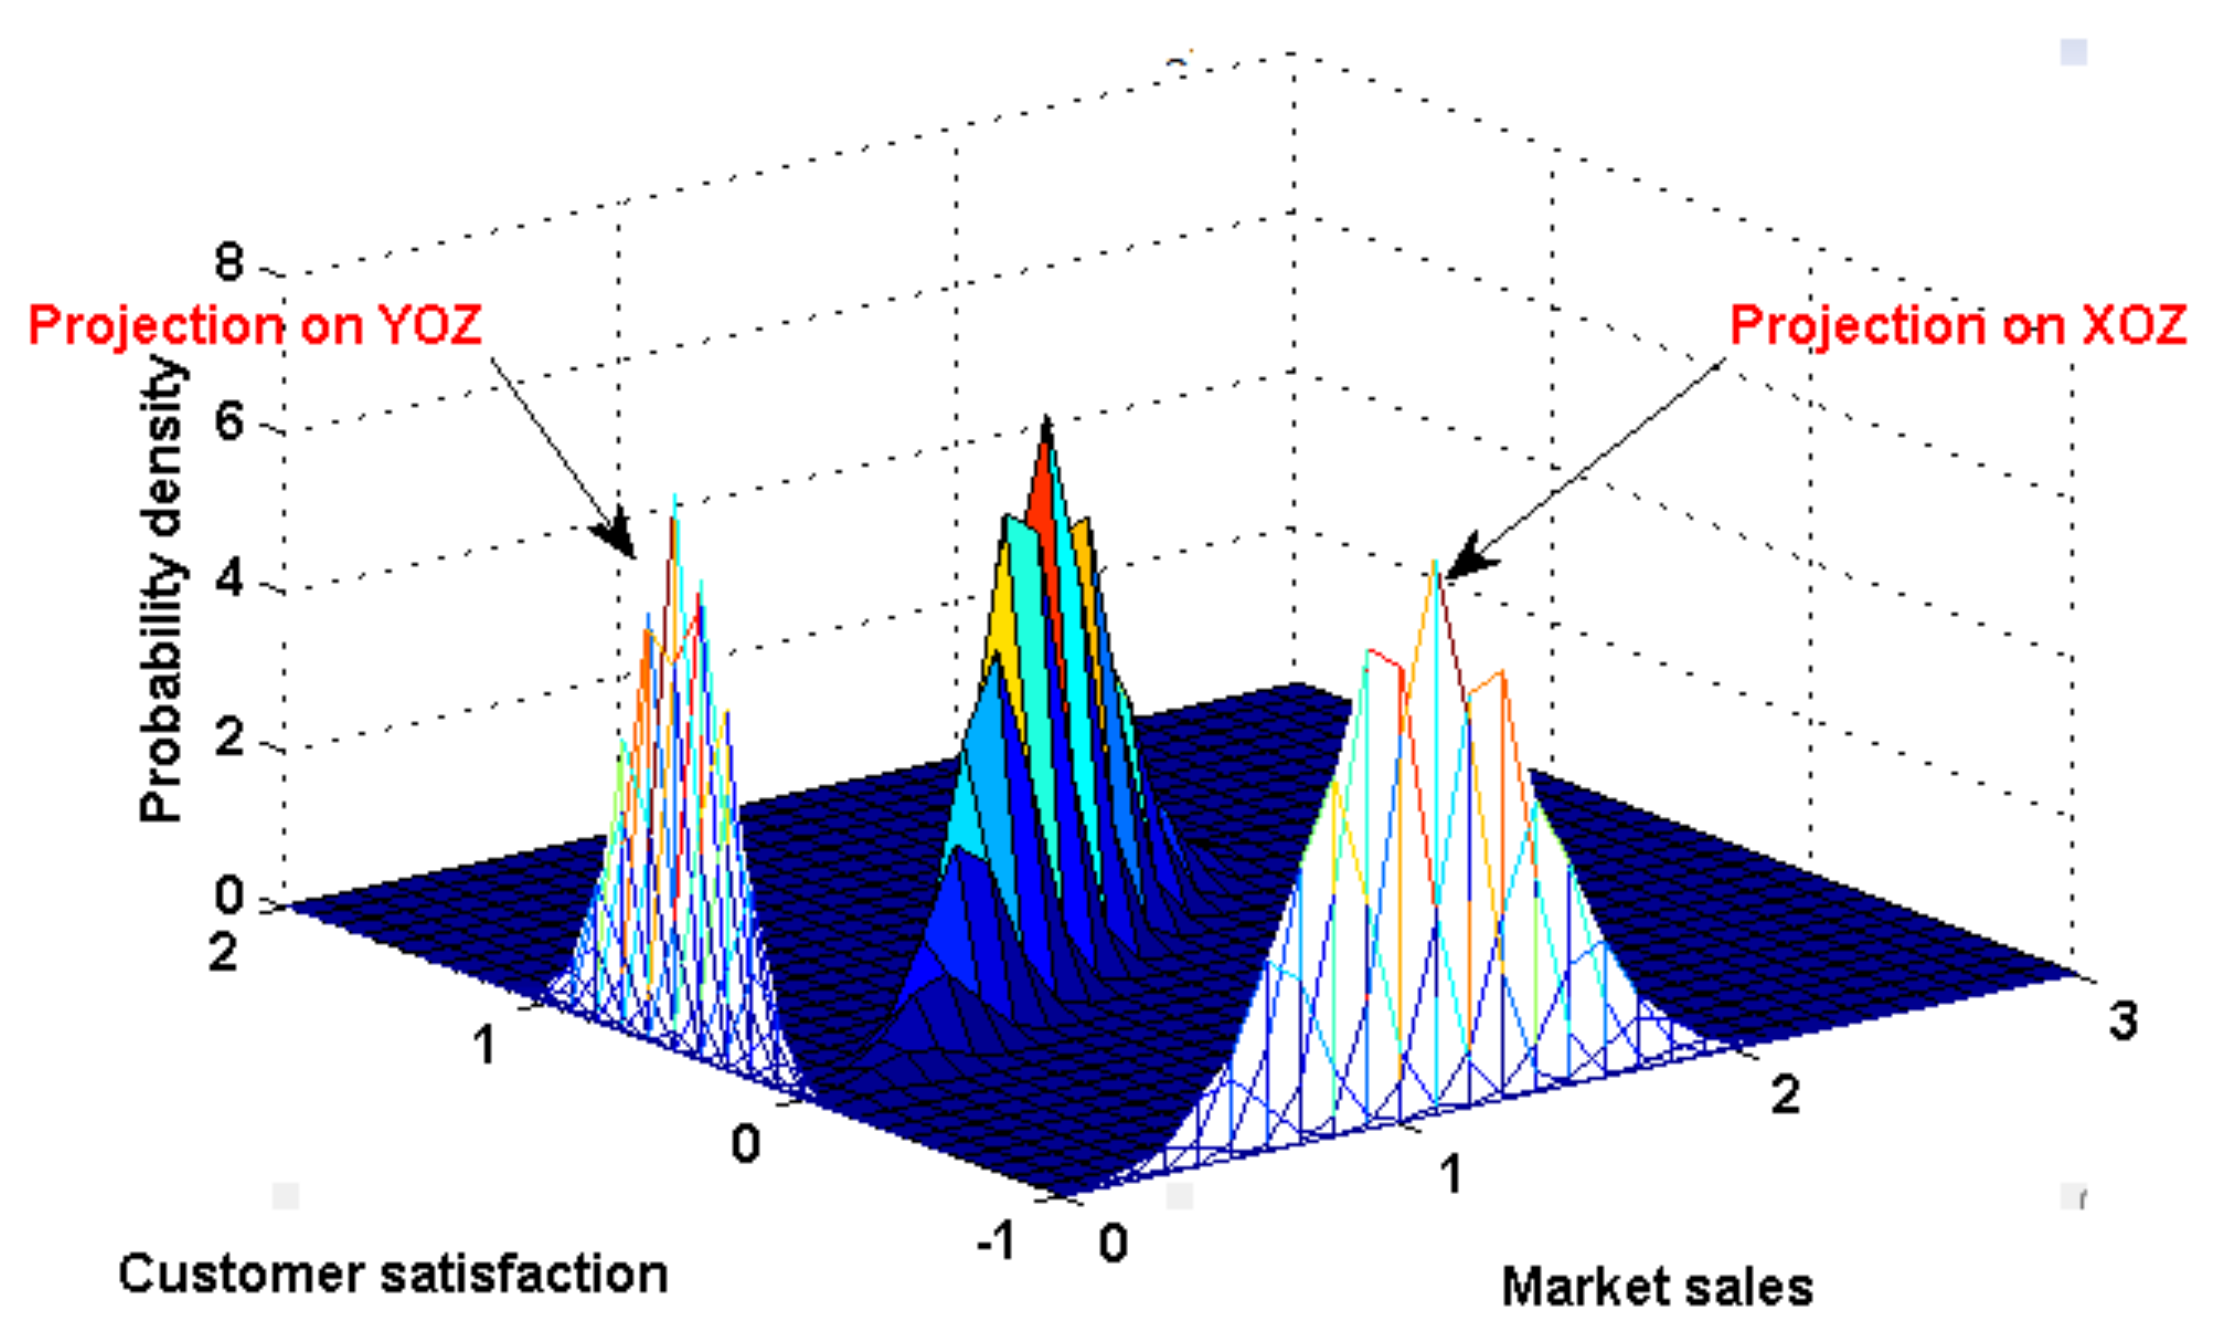
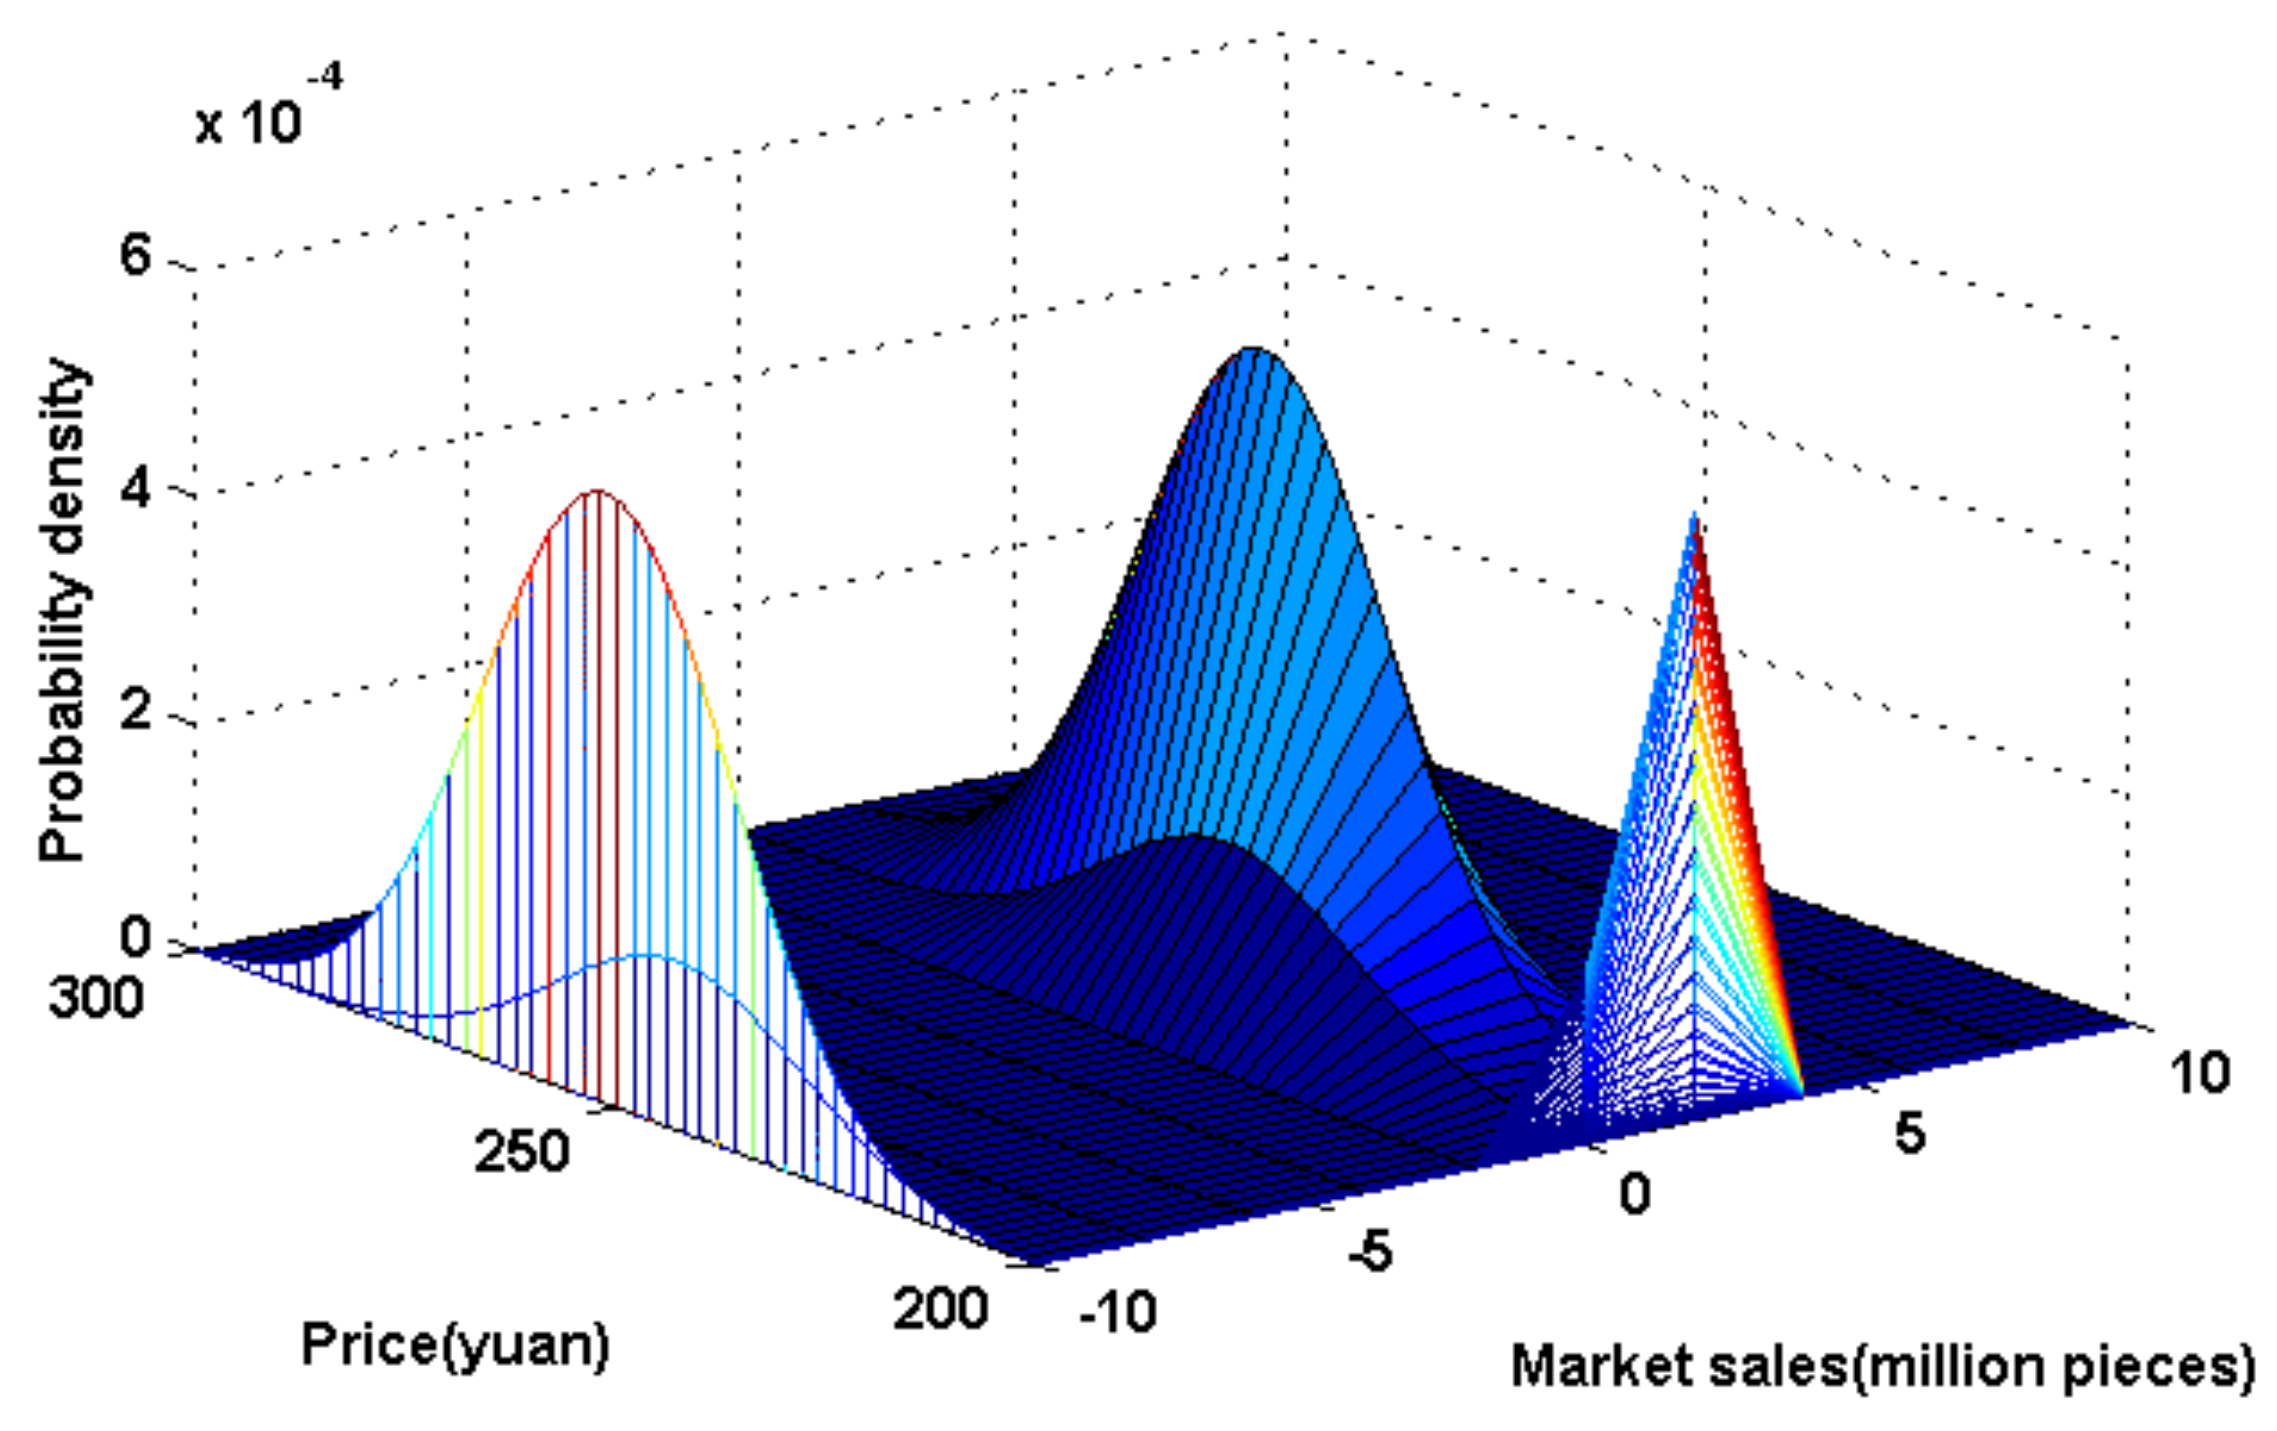
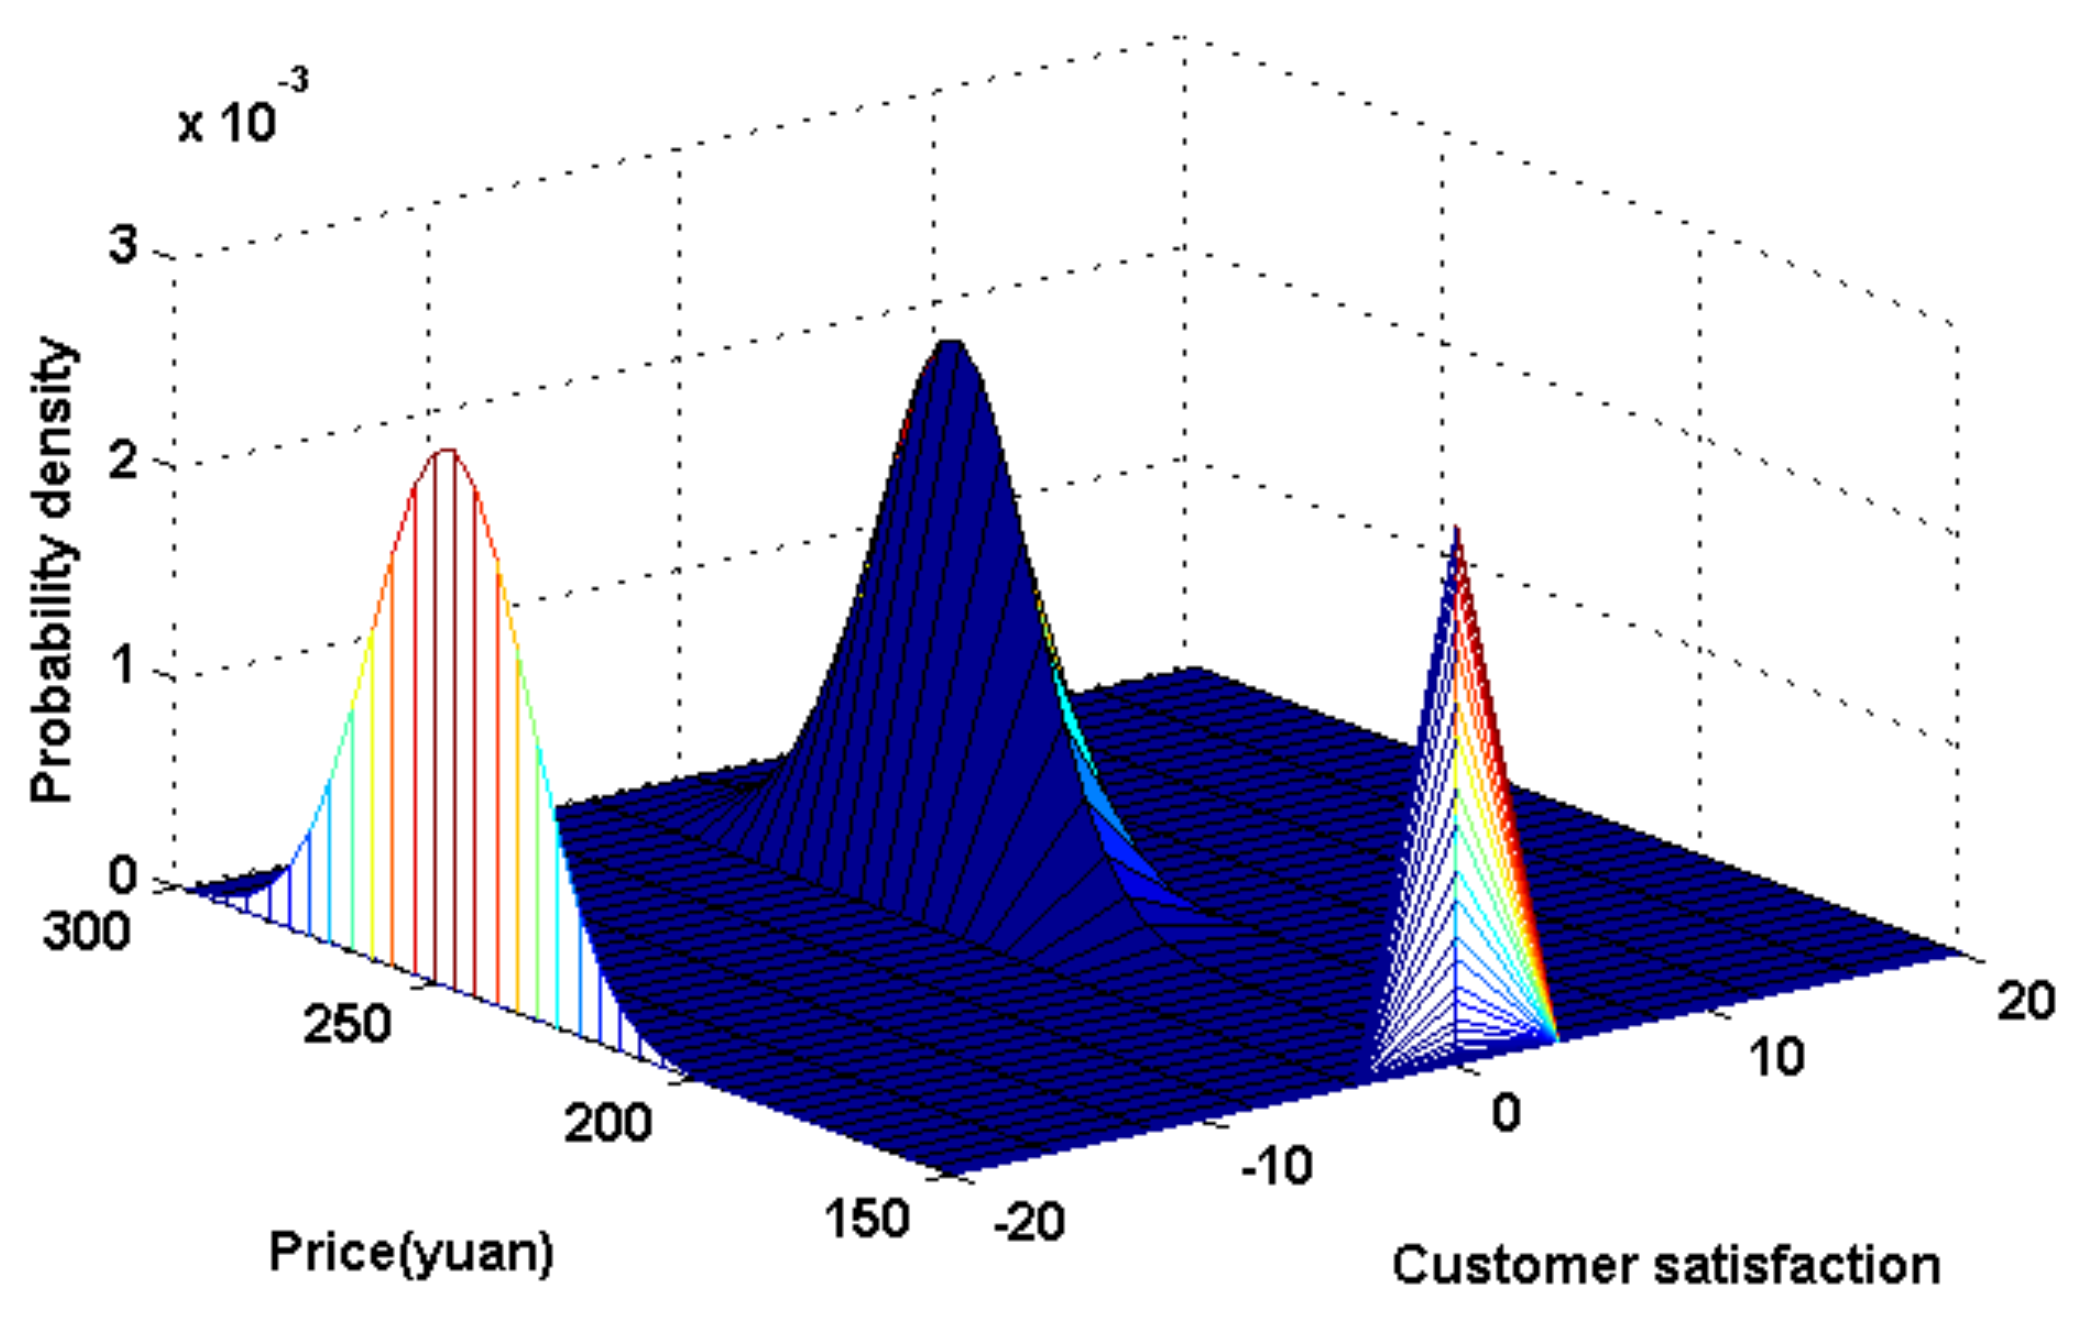
3.3. Reasoning Analysisbetween Functional and Structural
4. Case Study
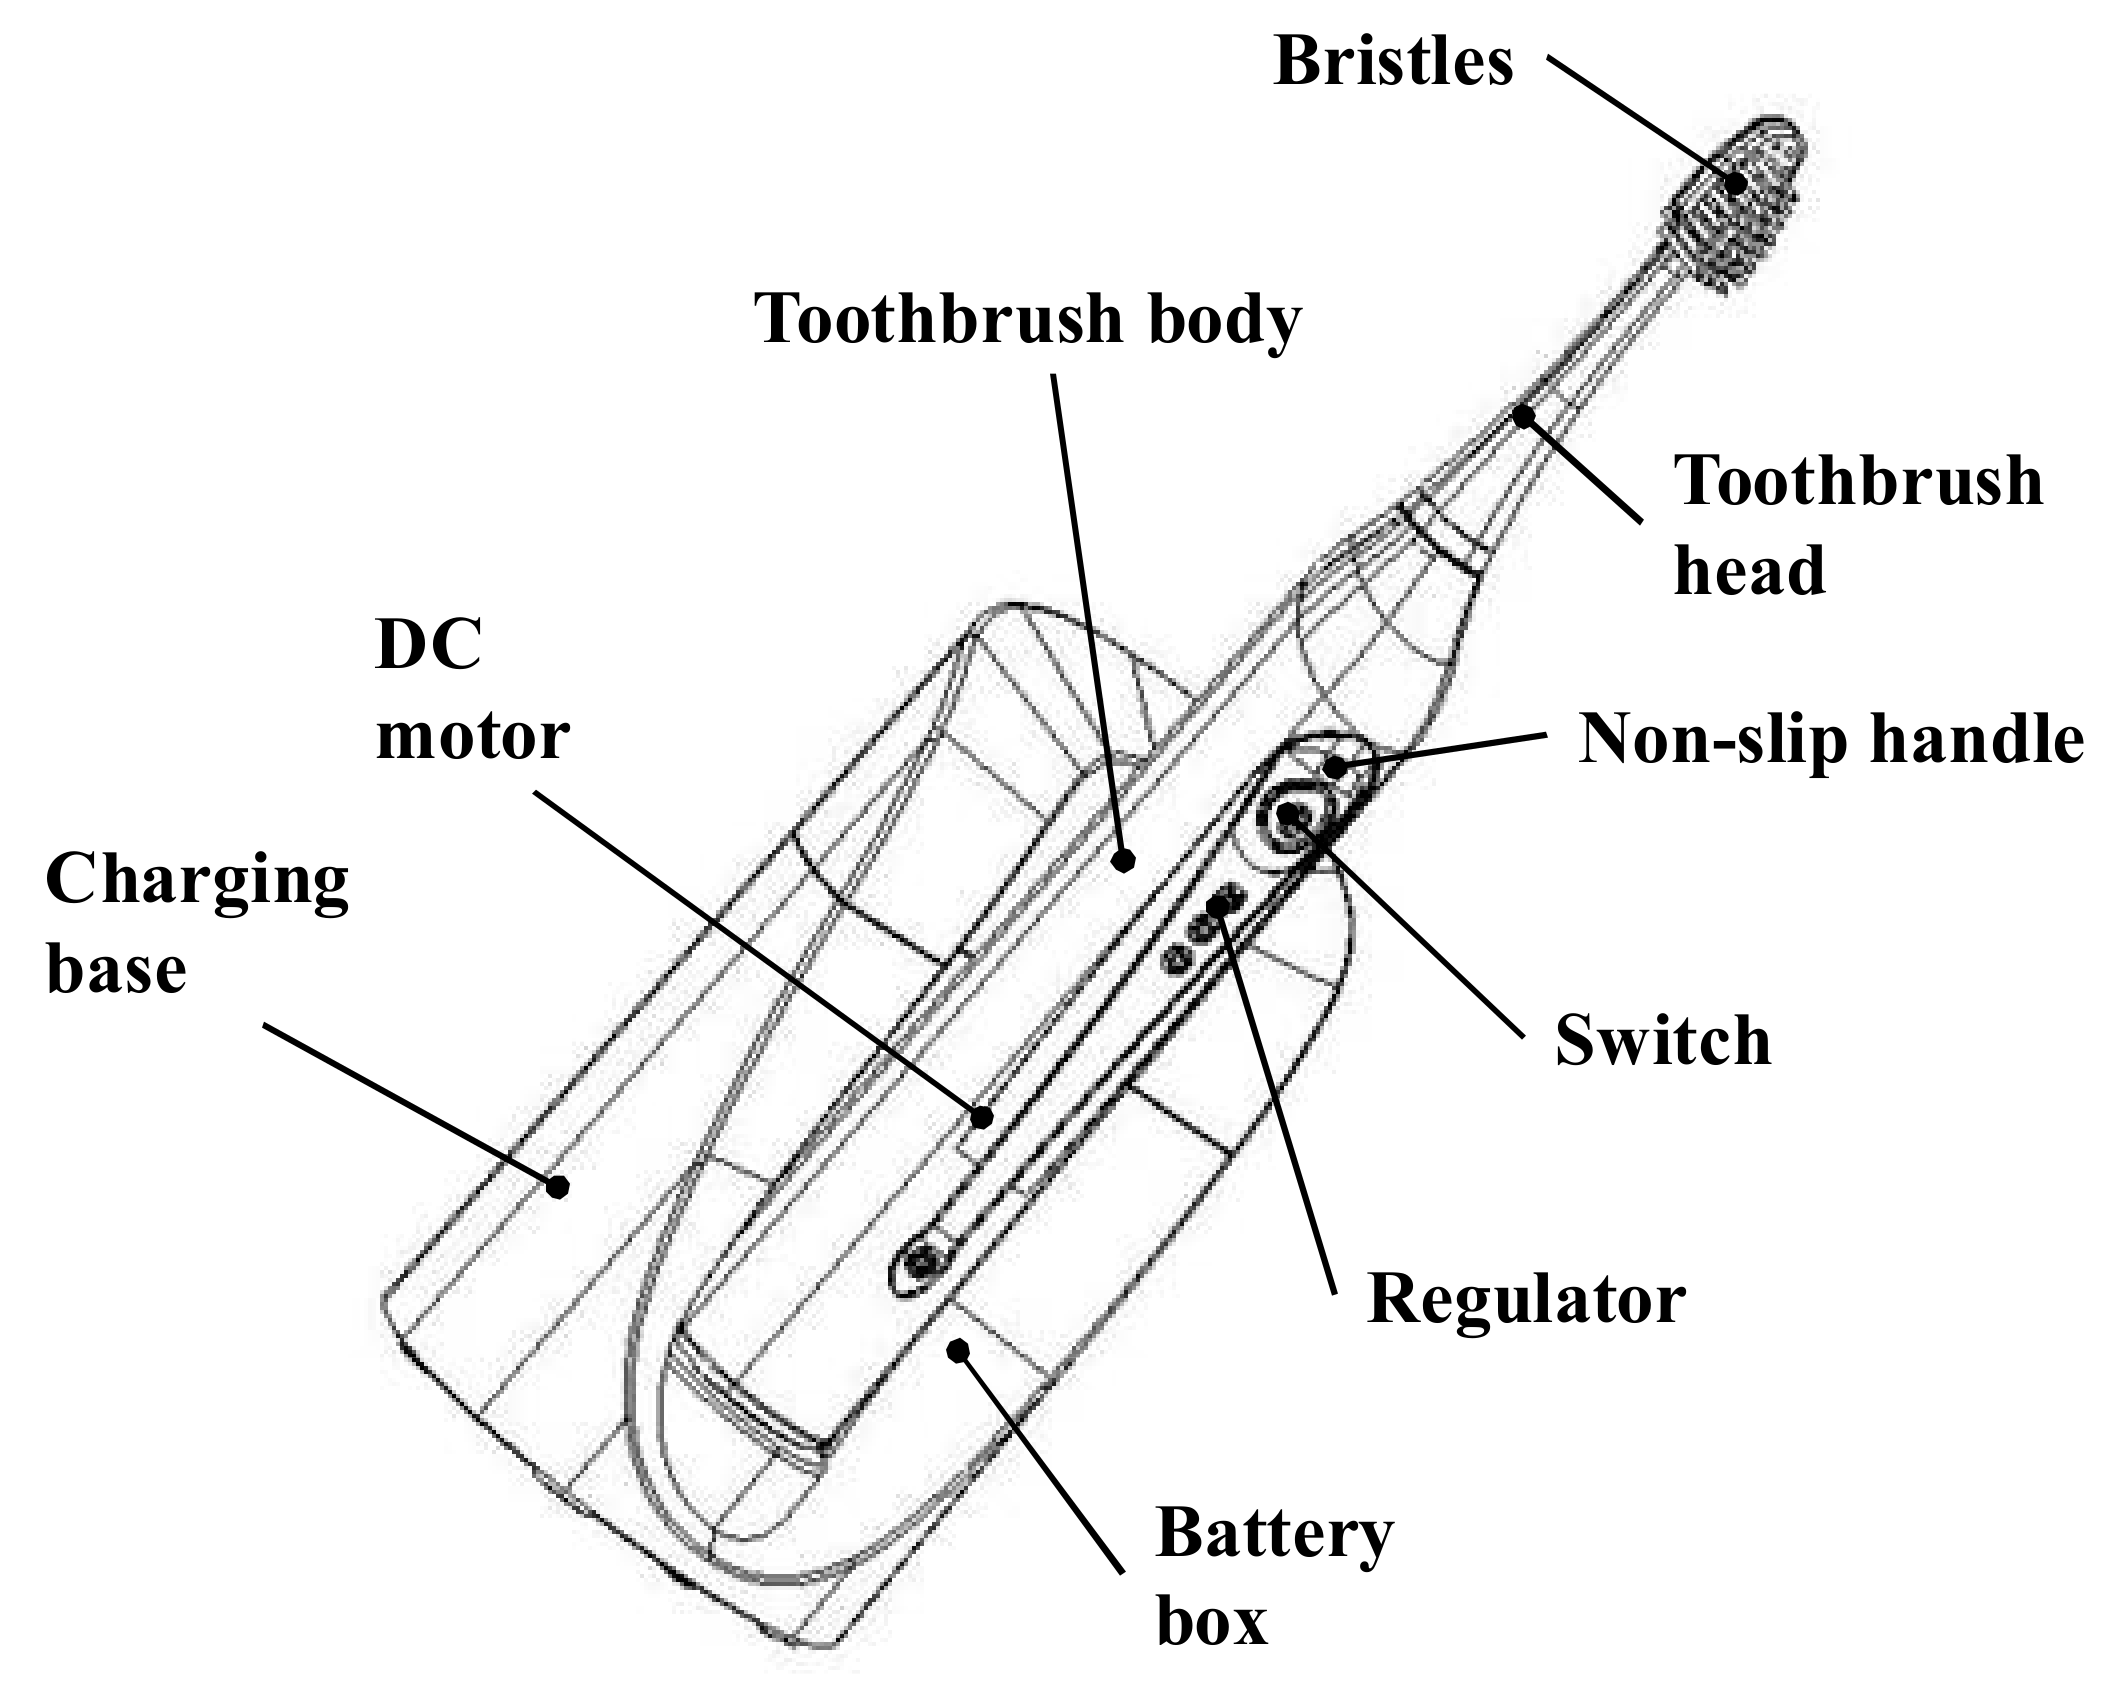
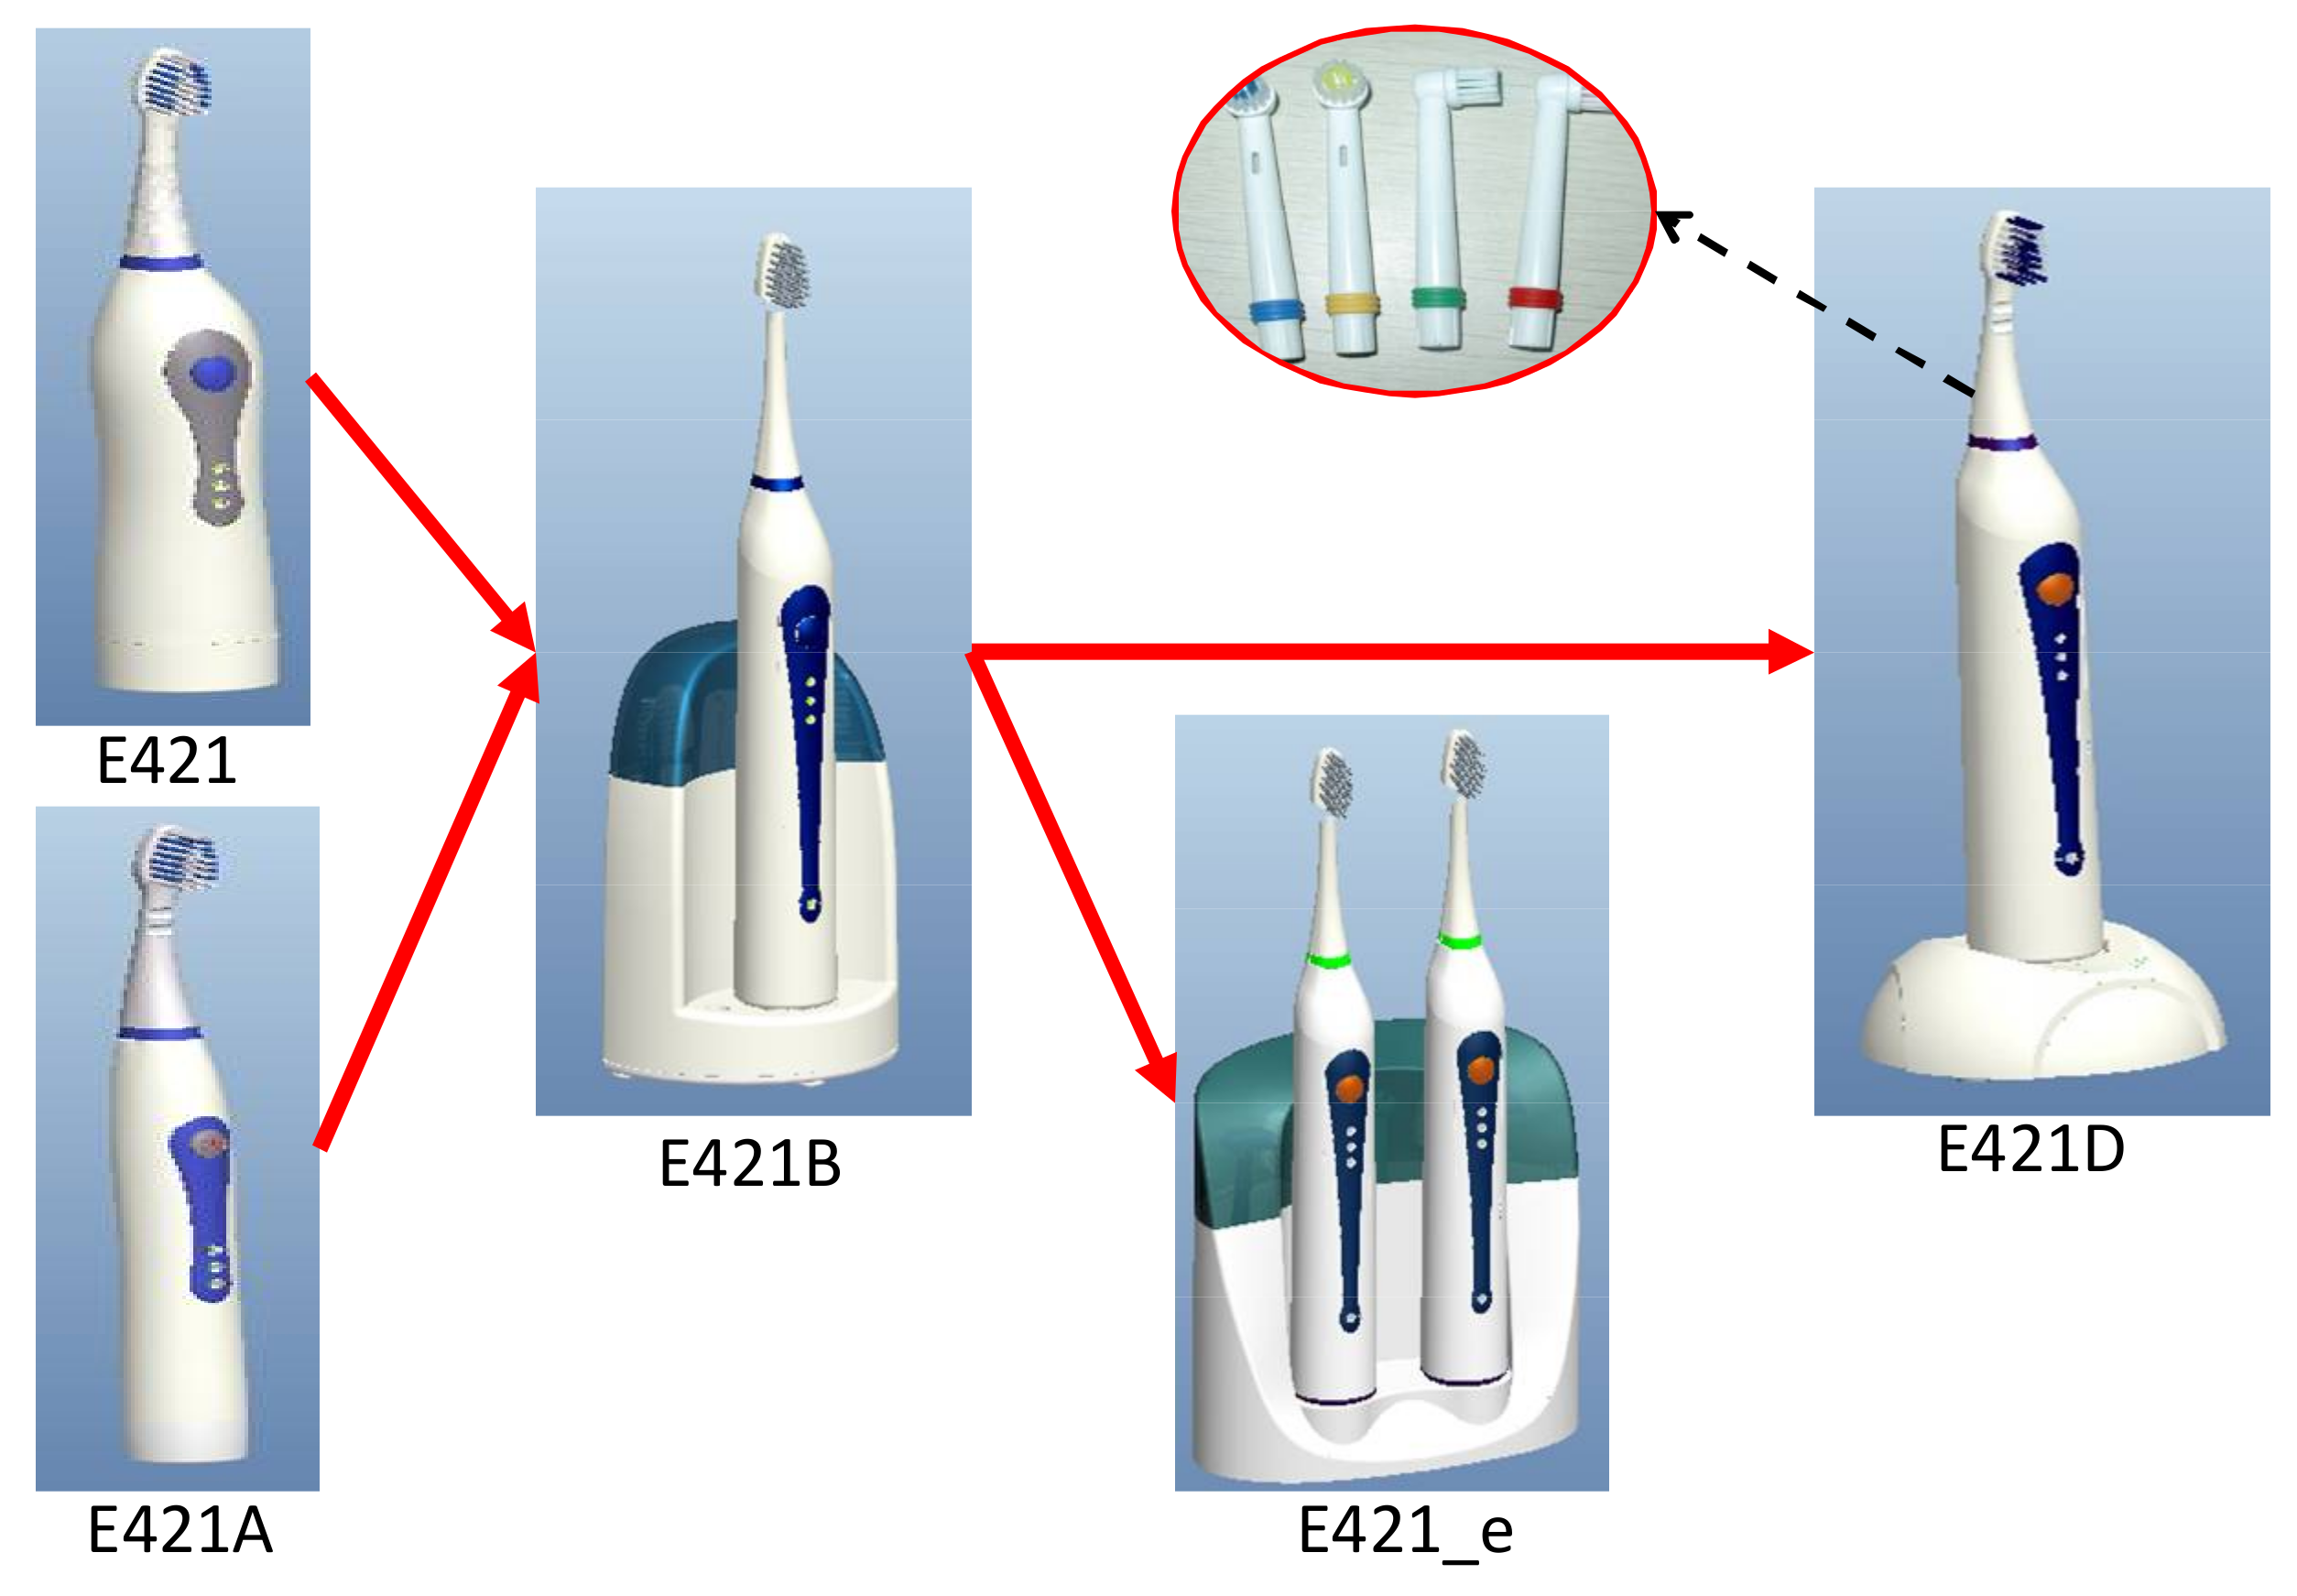
4.1. Evolution Model of Electric Toothbrush Based on Bayesian Network
4.2. Validation of Evolution Design Rule for Electricaltoothbrushes
5. Conclusions
Acknowledgments
Author Contributions
Conflicts of Interest
References
- Hu, G.Z.; Xu, X.J.; Xiao, S.N.; Yang, G.W.; Pu, F. Product data model for performance-driven design. Chin. J. Mech. Eng. 2017, 30, 1112–1122. [Google Scholar] [CrossRef]
- Ma, J.; Kim, H.M. Product family architecture design with predictive, data-driven product family design method. Res. Eng. Des. 2015, 27, 1–17. [Google Scholar] [CrossRef]
- Chien, C.F.; Kerh, R.; Lin, K.Y.; Yu, P.I. Data-driven innovation to capture user-experience product design: An empirical study for notebook visual aesthetics design. Comput. Ind. Eng. 2016, 99, 162–173. [Google Scholar] [CrossRef]
- Blessing, L.T.M.; Chakrabarti, A. DRM, a Design Research Methodology; Springer: London, UK, 2009. [Google Scholar]
- Ravasi, D.; Stigliani, I. Product design: A review and research agenda for management studies. Int. J. Manag. Rev. 2012, 14, 464–488. [Google Scholar] [CrossRef]
- Kulatunga, A.K.; Karunatilake, N.; Weerasinghe, N.; Ihalawatta, R.K. Sustainable manufacturing based decision support model for product design and development process. Procedia CIRP 2015, 26, 87–92. [Google Scholar] [CrossRef]
- Rezapour, S.; Hassani, A.; Farahani, R.Z. Concurrent design of product family and supply chain network considering quality and price. Transp. Res. Part E Logist. Transp. Rev. 2015, 81, 18–35. [Google Scholar] [CrossRef]
- Baud-Lavigne, B.; Agard, B.; Penz, B. Simultaneous product family and supply chain design: An optimization approach. Int. J. Prod. Econ. 2016, 174, 111–118. [Google Scholar] [CrossRef]
- Algeddawy, T.; Elmaraghy, H. Reactive design methodology for product family platforms, modularity and parts integration. CIRP J. Manuf. Sci. Technol. 2013, 6, 34–43. [Google Scholar] [CrossRef]
- Giovannini, A.; Aubry, A.; Panetto, H.; Haouzi, H.E.; Junior, O.C.; Pierrel, L. Knowledge representation, retrieval and reuse for product family design: An anti-logicist approach. Comput. Ind. Eng. 2016, 101, 391–402. [Google Scholar] [CrossRef]
- Agard, B.; Penz, B. A simulated annealing method based on a clustering approach to determine bills of materials for a large product family. Int. J. Prod. Econ. 2009, 117, 389–401. [Google Scholar] [CrossRef]
- Jiao, J.R.; Simpson, T.W.; Siddique, Z. Product family design and platform-based product development: A state-of-the-art review. J. Intell. Manuf. 2007, 18, 5–29. [Google Scholar] [CrossRef]
- Zhang, M.; Zhao, X.; Qi, Y. The effects of organizational flatness, coordination, and product modularity on mass customization capability. Int. J. Prod. Econ. 2014, 158, 145–155. [Google Scholar] [CrossRef]
- Guthrie, R. Program design, coding, and testing. Encycl. Inf. Syst. 2003, 3, 529–543. [Google Scholar]
- Alsawalqah, H.I.; Kang, S.; Lee, J. A method to optimize the scope of a software product platform based on end-user features. J. Syst. Softw. 2014, 98, 79–106. [Google Scholar] [CrossRef]
- Schuh, G.; Rudolf, S.; Vogels, T. Performance measurement of modular product platforms. Procedia CIRP 2014, 17, 266–271. [Google Scholar] [CrossRef]
- Wiltschnig, S.; Bo, T.C.; Ball, L.J. Collaborative problem–solution co-evolution in creative design. Des. Stud. 2013, 34, 515–542. [Google Scholar] [CrossRef]
- Bryan, A.; Ko, J.; Hu, S.J.; Koren, Y. Co-evolution of product families and assembly systems. CIRP Ann. Manuf. Technol. 2008, 56, 41–44. [Google Scholar] [CrossRef]
- Smith, S.; Smith, G.; Shen, Y.T. Redesign for product innovation. Des. Stud. 2012, 33, 160–184. [Google Scholar] [CrossRef]
- Negendahl, K. Building performance simulation in the early design stage: An introduction to integrated dynamic models. Autom. Constr. 2015, 54, 39–53. [Google Scholar] [CrossRef]
- Gries, M. Methods for evaluating and covering the design space during early design development. Integr. VLSI J. 2004, 38, 131–183. [Google Scholar] [CrossRef]
- Hou, L.; Wang, H.L.; Liu, Y.Y. Research on product platform innovation and evolution based on lifecycle. Key Eng. Mater. 2010, 431, 82–85. [Google Scholar] [CrossRef]
- Meyer, M.H.; Tertzakian, P.; Utterback, J.M. Metrics for managing research and development in the context of the product family. Manag. Sci. 1997, 43, 88–111. [Google Scholar] [CrossRef]
- Wang, H.L.; Hou, L.; Li, M.; Wang, S.F. Research on the product platform life cycle and its management strategies. Appl. Mech. Mater. 2010, 37, 1105–1109. [Google Scholar] [CrossRef]
- Eisenbart, B.; Gericke, K.; Blessing, L.T.M.; Mcaloone, T.C. A dsm-based framework for integrated function modelling: Concept, application and evaluation. Res. Eng. Des. 2017, 28, 25–51. [Google Scholar] [CrossRef]
- Ramsaier, M.; Holder, K.; Zech, A.; Stetter, R.; Rudolph, S.; Till, M. Digital Representation of Product Functions in Multicopter Design. In Proceedings of the 21st International Conference on Engineering Design (ICED 17) Vol. 1: Resource Sensitive Design, Design Research Applications and Case Studies, Vancouver, BC, Canada, 21–25 August 2017. [Google Scholar]
- Tucker, C.S.; Kim, H.M. Data-driven decision tree classification for product portfolio design optimization. J. Comput. Inf. Sci. Eng. 2009, 9, 790–792. [Google Scholar] [CrossRef]
- Hosseini, S.; Barker, K. Modeling infrastructure resilience using bayesian networks: A case study of inland waterway ports. Comput. Ind. Eng. 2016, 93, 252–266. [Google Scholar] [CrossRef]
- Hosseini, S.; Khaled, A.A.; Sarder, M.D. A general framework for assessing system resilience using bayesian networks: A case study of sulfuric acid manufacturer. J. Manuf. Syst. 2016, 41, 211–227. [Google Scholar] [CrossRef]
- Hosseini, S.; Barker, K. A bayesian network model for resilience-based supplier selection. Int. J. Prod. Econ. 2016, 180, 68–87. [Google Scholar] [CrossRef]
- Pearl, J. Fusion, propagation, and structuring in belief networks. Artif. Intell. 1986, 29, 241–288. [Google Scholar] [CrossRef]
- Garbolino, P.; Taroni, F. Evaluation of scientific evidence using bayesian networks. Forensic Sci. Int. 2002, 125, 149–155. [Google Scholar] [CrossRef]


| Brush Head Type (N1) | Bristle Type (N2) | Bristle Quality (N3) | Tongue Scraper (N4) | Switch Type (N5) | Power Type (N6) | Vibration Frequency (Once/min) (N7) |
| general:1 interdental:2 special effects:3 | hard:1 soft:2 | poor:1 medium:2 good:3 | none:1 Incidental:2 | weak:1 strong:2 | dry battery:1 charger:2 | wide:1 standard:2 fixed point:3 |
| Vibration mode (N8) | Metal shield (N9) | Sleeve (N10) | Sports mode (N11) | Brushing mode (N12) | Timing function (N13) | Anti-skid (N14) |
| normal:1 eccentric:2 | none:1 Incidental:2 | none:1 Incidental:2 | lateral:1 longitudinal:2 | manual:1 electric:2 | none:1 Incidental:2 | no:1 yes:2 |
| Weight (g)(N15) | Power cord length/cm (N16) | Shape length/mm (N17) | Market sales/Million pieces (N18) | Cleaning capacity (N19) | Customer satisfaction (N20) | Service life/month (N21) |
| Continuous variable | Continuous variable | 240:1 250:2 255:3 260:4 | Continuous variable | weak:1 strong:2 | Continuous variable (0, 1) | Continuous variable |
| Duration (N22) | Convenience (N23) | Cleaning time/min (N24) | Price/yuan (N25) | Cost/yuan (N26) | - | - |
| Continuous variable | inconvenient:1 convenient:2 easy:3 | Continuous variable | Continuous variable | Continuous variable | - | - |
| Node | N3 | N17 | N20 | N25 | N26 | |
|---|---|---|---|---|---|---|
| Probability | P(X = 1) | 0.3016 | 0.1686 | 0.3076 | 0.4855 | 0.4513 |
| P(X = 2) | 0.3492 | 0.3087 | 0.3683 | 0.5145 | 0.5487 | |
| P(X = 3) | 0.3492 | 0.3373 | 0.3241 | - | - | |
| P(X = 4) | - | 0.1854 | - | - | - | |
| Evolutionary Process | Customer Needs/Drive Elements |
|---|---|
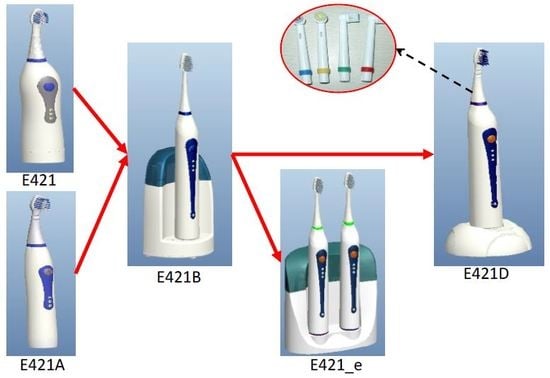
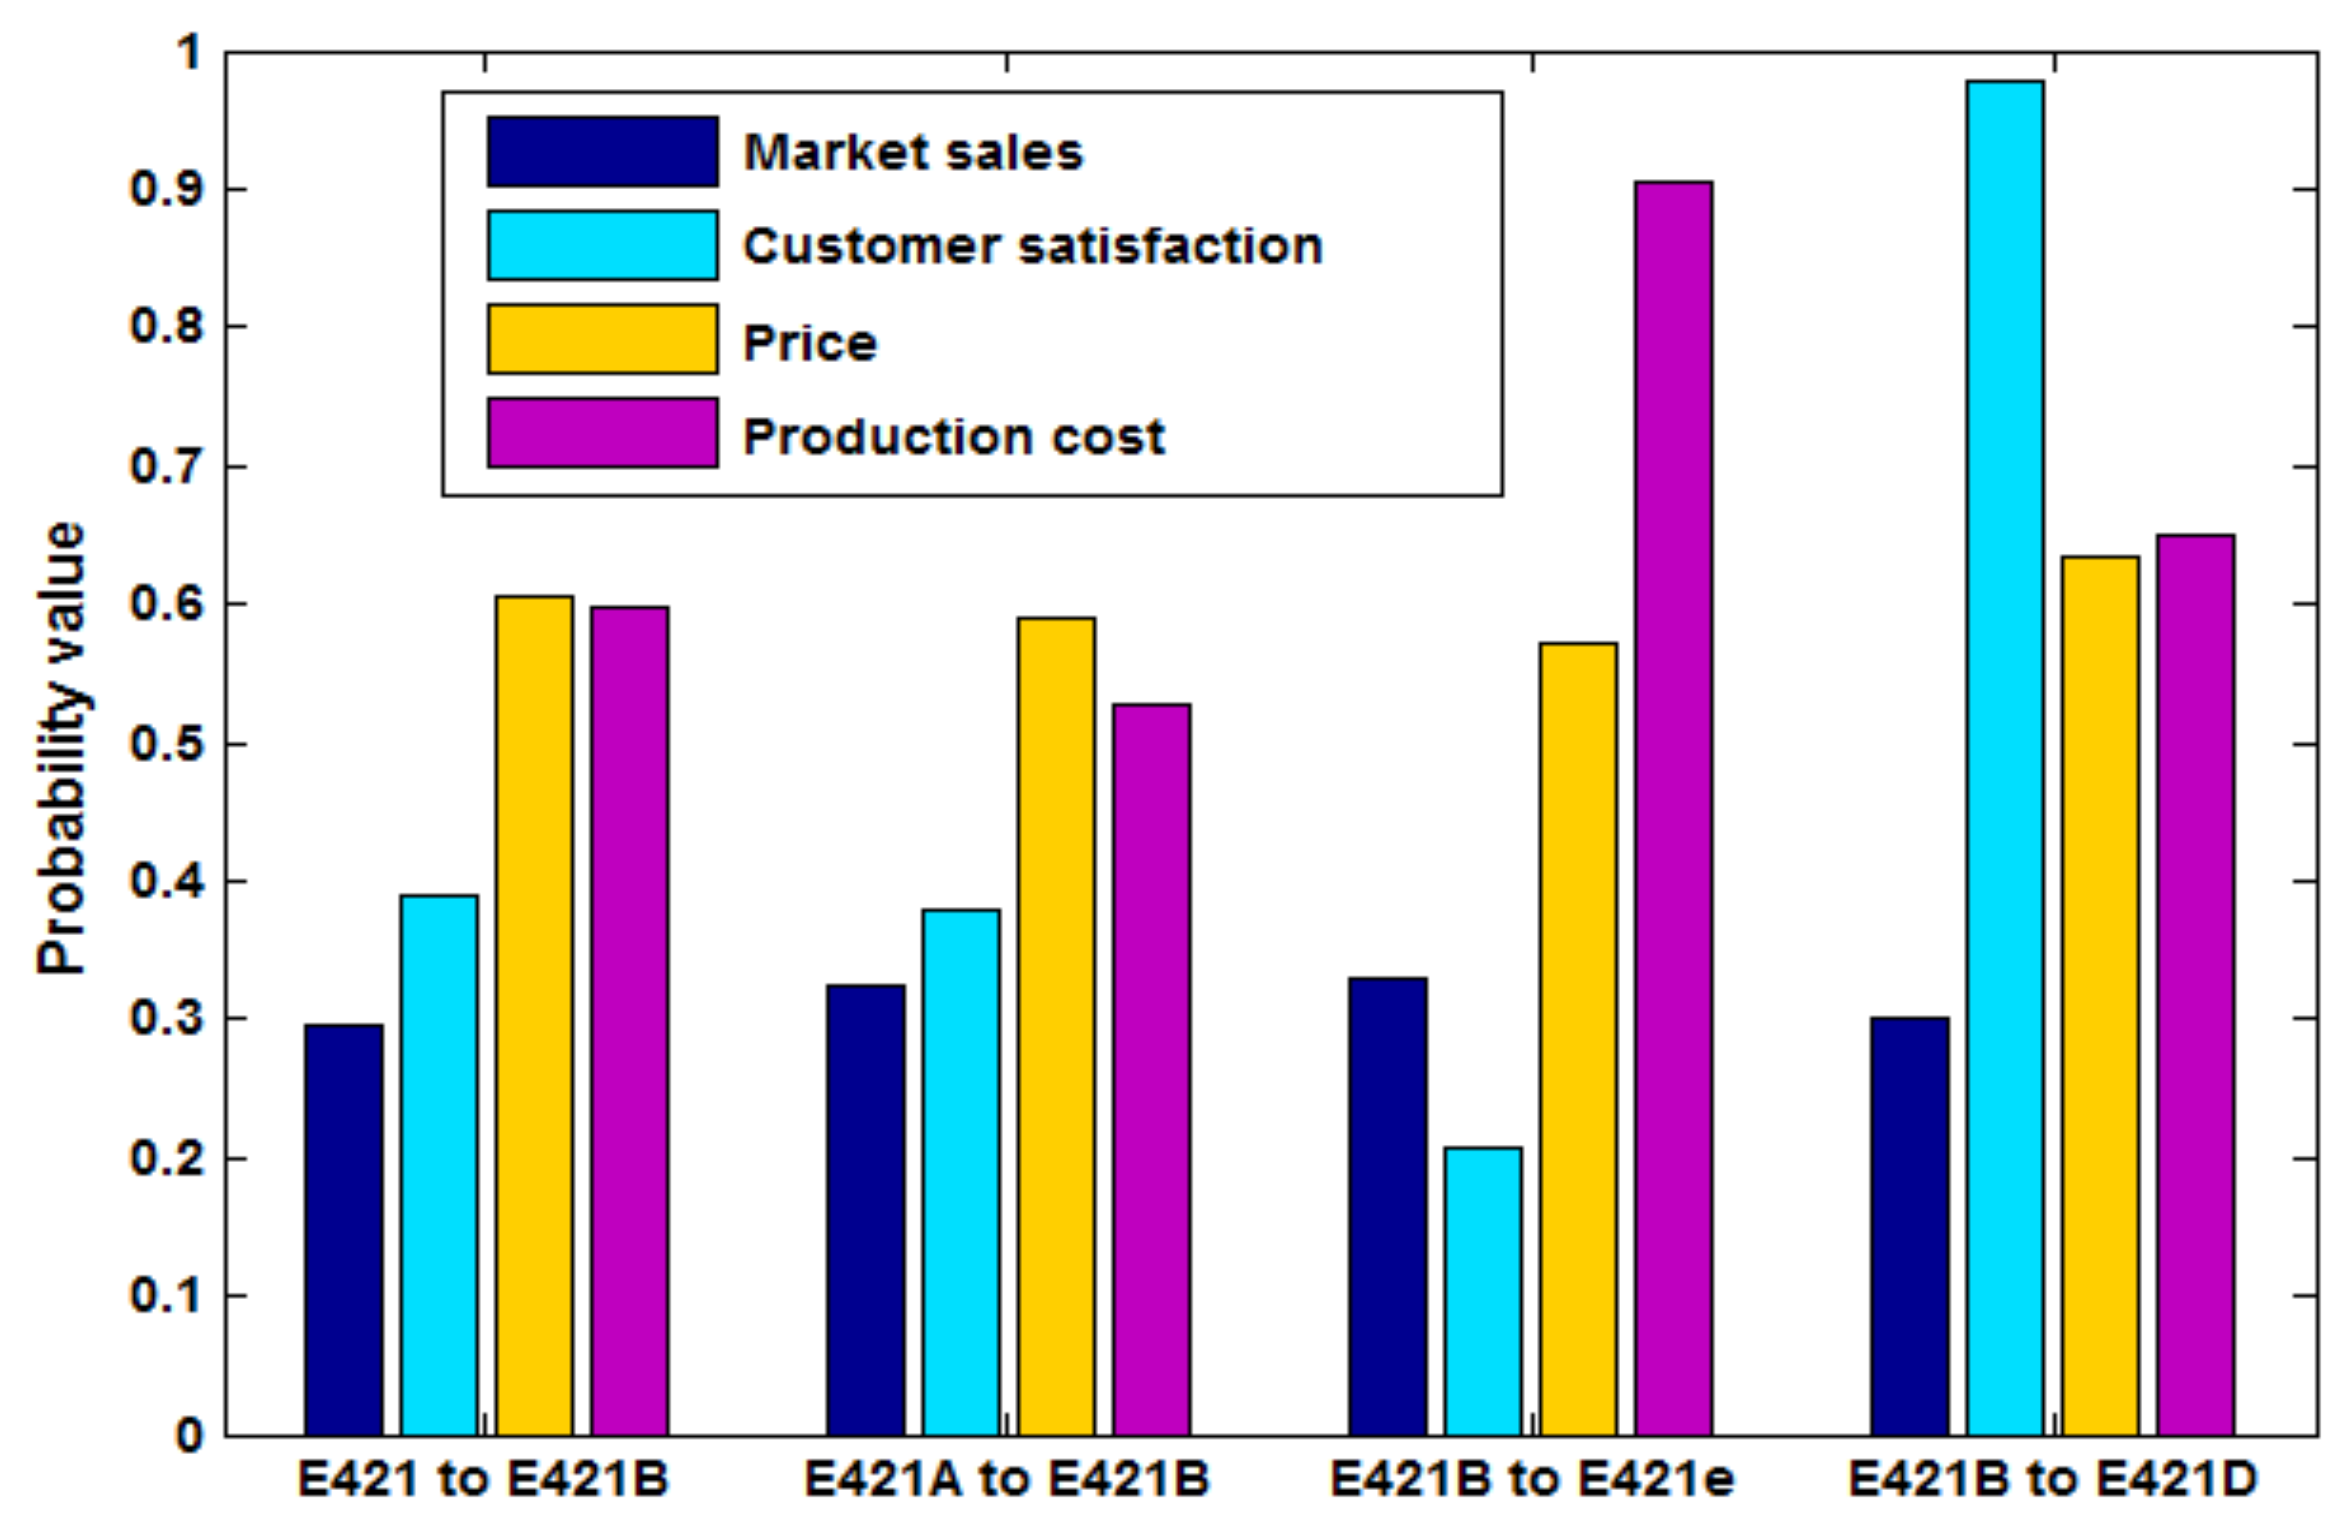
| E421→E421B | N2:1→2; N3:1→2; N6:1→2; N9:1→2; N21: lengthen |
| E421A→E421B | N5:1→2; N6:1→2; N13:1→2; N15: lighter; N24: shorter |
| E421B→E421e | N2:1→2; N3:1→3; N10:1→2; N14:1→2; N23:2→3 |
| E421B→E421D | N7:1→2; N13:1→2; N19:1→2; N22: lengthen; N23:2→3; N24: shorter |
| Proofs | N1 | N2 | N3 | N4 | N5 | N6 | N7 |
| E421 | 2 | 1 | 1 | 1 | 2 | 1 | 3 |
| E420A | 2 | 1 | 2 | 1 | 1 | 1 | 2 |
| E421B | 3 | 2 | 3 | 2 | 1 | 2 | 1 |
| Demands | - | - | - | - | 1 | 2 | 2 |
| Proofs | N8 | N9 | N10 | N11 | N12 | N13 | N14 |
| E421 | 1 | 1 | 1 | 1 | 1 | 1 | 1 |
| E420A | 1 | 1 | 1 | 1 | 1 | 1 | 1 |
| E421B | 1 | 2 | 2 | 2 | 2 | 1 | 2 |
| Demands | - | - | - | - | 2 | 2 | - |
| Proofs | N15 | N16 | N17 | N18 | N19 | N20 | N21 |
| E421 | 2 | 1 | 4 | 1 | 1 | 2 | 1 |
| E420A | 1 | 2 | 3 | 2 | 1 | 2 | 1 |
| E421B | 1 | 2 | 1 | 3 | 1 | 3 | 2 |
| Demands | - | - | - | - | 2 | 3 | 3 |
| Proofs | N22 | N23 | N24 | N25 | N26 | ||
| E421 | 1 | 1 | 1 | 2 | 2 | - | - |
| E420A | 1 | 2 | 2 | 1 | 1 | - | - |
| E421B | 1 | 2 | 2 | 2 | 2 | - | - |
| Demands | 2 | 3 | 3 | - | - | - | - |
| Design Data | N1 | N2 | N3 | N4 | N5 | N6 | N7 |
| P(X = 1) | 0.1781 | 0.2123 | 0.3612 | 0.4375 | 1 | 0 | 0 |
| P(X = 2) | 0.3215 | 0.7877 | 0.1474 | 0.5625 | 0 | 1 | 1 |
| P(X = 3) | 0.5004 | - | 0.4914 | - | - | - | 0 |
| P(X = 4) | - | - | - | - | - | - | - |
| E421D | 3 | 2 | 3 | 2 | 1 | 2 | 2 |
| Design data | N8 | N9 | N10 | N11 | N12 | N13 | N14 |
| P(X = 1) | 0.2062 | 0.4231 | 0.3326 | 0.2378 | 0 | 0 | 0.4721 |
| P(X = 2) | 0.7938 | 0.5769 | 0.6674 | 0.7622 | 1 | 1 | 0.5279 |
| P(X = 3) | - | - | - | - | - | - | - |
| P(X = 4) | - | - | - | - | - | - | - |
| E421D | 2 | 2 | 2 | 2 | 2 | 2 | 2 |
| Design data | N15 | N16 | N17 | N18 | N19 | N20 | N21 |
| P(X = 1) | 1 | 0.4067 | 0.5046 | 0.246 | 0 | 0 | 0 |
| P(X = 2) | 0 | 0.5933 | 0.1585 | 0.2245 | 1 | 0 | 0 |
| P(X = 3) | - | - | 0.2783 | 0.5295 | - | 1 | 1 |
| P(X = 4) | - | - | 0.0586 | - | - | - | - |
| E421D | 1 | 2 | 1 | 3 | 2 | 3 | 3 |
| Design data | N22 | N23 | N24 | N25 | N26 | ||
| P(X = 1) | 0 | 0 | 0 | 0.3128 | 0.2594 | - | - |
| P(X = 2) | 1 | 0 | 0 | 0.6872 | 0.7406 | - | |
| P(X = 3) | 0 | 1 | 1 | - | - | - | - |
| P(X = 4) | - | - | - | - | - | - | - |
| E421D | 2 | 3 | 3 | 2 | 2 | - | - |
| Evolutionary Process | Node | P(X = 1) | P(X = 2) | P(X = 3) | P(X = 4) |
|---|---|---|---|---|---|
| E421→E421B | N12 | 0.3205 | 0.6795 | - | - |
| N18 | 0.2851 | 0.5204 | 0.1945 | - | |
| E421A→E421B | N11 | 0.203 | 0.797 | - | - |
| N12 | 0.336 | 0.664 | - | - | |
| N17 | 0.2219 | 0.5313 | 0.0221 | 0.2247 | |
| E421B→E421e | N8 | 0.2051 | 0.7949 | - | - |
| N15 | 0.6338 | 0.3662 | - | - | |
| E421B→E421D | N4 | 0.4375 | 0.5625 | - | - |
| N8 | 0.2062 | 0.7938 | - | - | |
| N11 | 0.2378 | 0.7622 | - | - | |
| N16 | 0.4067 | 0.5933 | - | - | |
| N17 | 0.5046 | 0.1585 | 0.2783 | 0.0586 | |
| N18 | 0.246 | 0.2245 | 0.5295 | - |
| Evolutionary Process | Drive Elements | Adaptive Design |
|---|---|---|
| E421→E421B | N2:1→2; N3:1→2; N6:1→2; N9:1→2; N21: lengthen | N12:1→2; N18:larger |
| E421A→E421B | N5:1→2; N6:1→2; N13:1→2; N15: lighter; N24: shorter | N11:1→2; N12:1→2; N17:3→2 |
| E421B→E421e | N2:1→2; N3:1→3; N10:1→2; N14:1→2; N23:2→3 | N8:1→2; N10:2→1; N15:1→2 |
| E421B→E421D | N7:1→2; N13:1→2; N19:1→2; N22: lengthen; N23:2→3; N24: shorter | N4:1→2; N8:1→2; N11:1→2; N16: lengthen; N17:2→1; N18: larger |
© 2018 by the authors. Licensee MDPI, Basel, Switzerland. This article is an open access article distributed under the terms and conditions of the Creative Commons Attribution (CC BY) license (http://creativecommons.org/licenses/by/4.0/).
Share and Cite
Li, S.; Wu, Y.; Xu, Y.; Hu, J.; Hu, J. A Bayesian Network Based Adaptability Design of Product Structures for Function Evolution. Appl. Sci. 2018, 8, 493. https://doi.org/10.3390/app8040493
Li S, Wu Y, Xu Y, Hu J, Hu J. A Bayesian Network Based Adaptability Design of Product Structures for Function Evolution. Applied Sciences. 2018; 8(4):493. https://doi.org/10.3390/app8040493
Chicago/Turabian StyleLi, Shaobo, Yongming Wu, Yanxia Xu, Jie Hu, and Jianjun Hu. 2018. "A Bayesian Network Based Adaptability Design of Product Structures for Function Evolution" Applied Sciences 8, no. 4: 493. https://doi.org/10.3390/app8040493