1. Introduction
Matrix-assisted laser desorption ionization mass spectrometry (MALDI MS) is a soft ionization method used to determine the molecular weight of an analyte. MALDI MS enables us to detect nonvolatile compounds, such as proteins and peptides, which are difficult to detect by other methods [
1]. Some organic acids—such as α-cyano-4-hydroxycinnamic acid (CHCA), sinapinic acid (SA), 2,5-dihydroxybenzoic acid (DHB), and 2,4,6-trihydroxyacetophenone (THAP)—are often used as the matrix. However, these organic matrices dissociate during the desorption/ionization process, thereby limiting the application of MALDI MS to low molecular weight compounds. In addition, the peak intensity of a protonated analyte is sometimes suppressed by an alkali metal ion adducted species. In order to overcome those drawbacks, several matrix-free techniques have been developed, including silicon nanowire (SiNW) [
2], desorption/ionization on silicon (DIOS) [
3,
4], and nanostructure-initiator mass spectrometry (NiMS) [
5]. The application of nanometer-sized particles—including Au [
6], Ag [
7], Pt [
8], and Si [
9]—instead of an organic matrix has also been proposed. In addition, the use of a co-matrix consisting of ammonium salt [
9], phosphoric acid [
10], serine [
11], saccharide [
12], and protein [
13] with conventional organic matrix molecules is considered an effective way to improve the mass spectra as well.
Generally, it is known that fatty acids are difficult to ionize by MALDI MS using conventional organic matrix molecules. In our previous research, we revealed that CdTe nanoparticles ionized fatty acids efficiently [
14]. Electrons ejected from CdTe nanoparticles by Auger recombination after photoexcitation interacted with fatty acids to ionize them into carboxylate anion (-RCOO
−) as RCOO
− was stabilized by resonance structures. In addition, CdTe nanoparticles were loaded on a zeolite surface to improve reproducibility of the peak intensity, and the complex of CdTe and zeolite was applied to the quantitative analysis of stearic acid in human serum.
Because it is understood that electrons ejected from CdTe nanoparticles react with carboxyl groups in fatty acids, we assumed that other compounds containing carboxyl groups could be ionized as well. In this study, CdTe was used to ionize such compounds as glucuronic acid (Glu), salicylic acid (Sal), ibuprofen (Ibu), tyrosine (Tyr), and model peptides, the structures of which contain carboxyl groups. As electrons ejected from a semiconductor are necessary for the ionization, we assumed that another semiconductor (CuO) would be also applicable to the ionization of the above-mentioned compounds. The purposes of this paper are to apply CdTe or CuO nanoparticles to the ionization of those molecules and to clarify the possible desorption and ionization mechanisms after the photoexcitation.
3. Results and Discussion
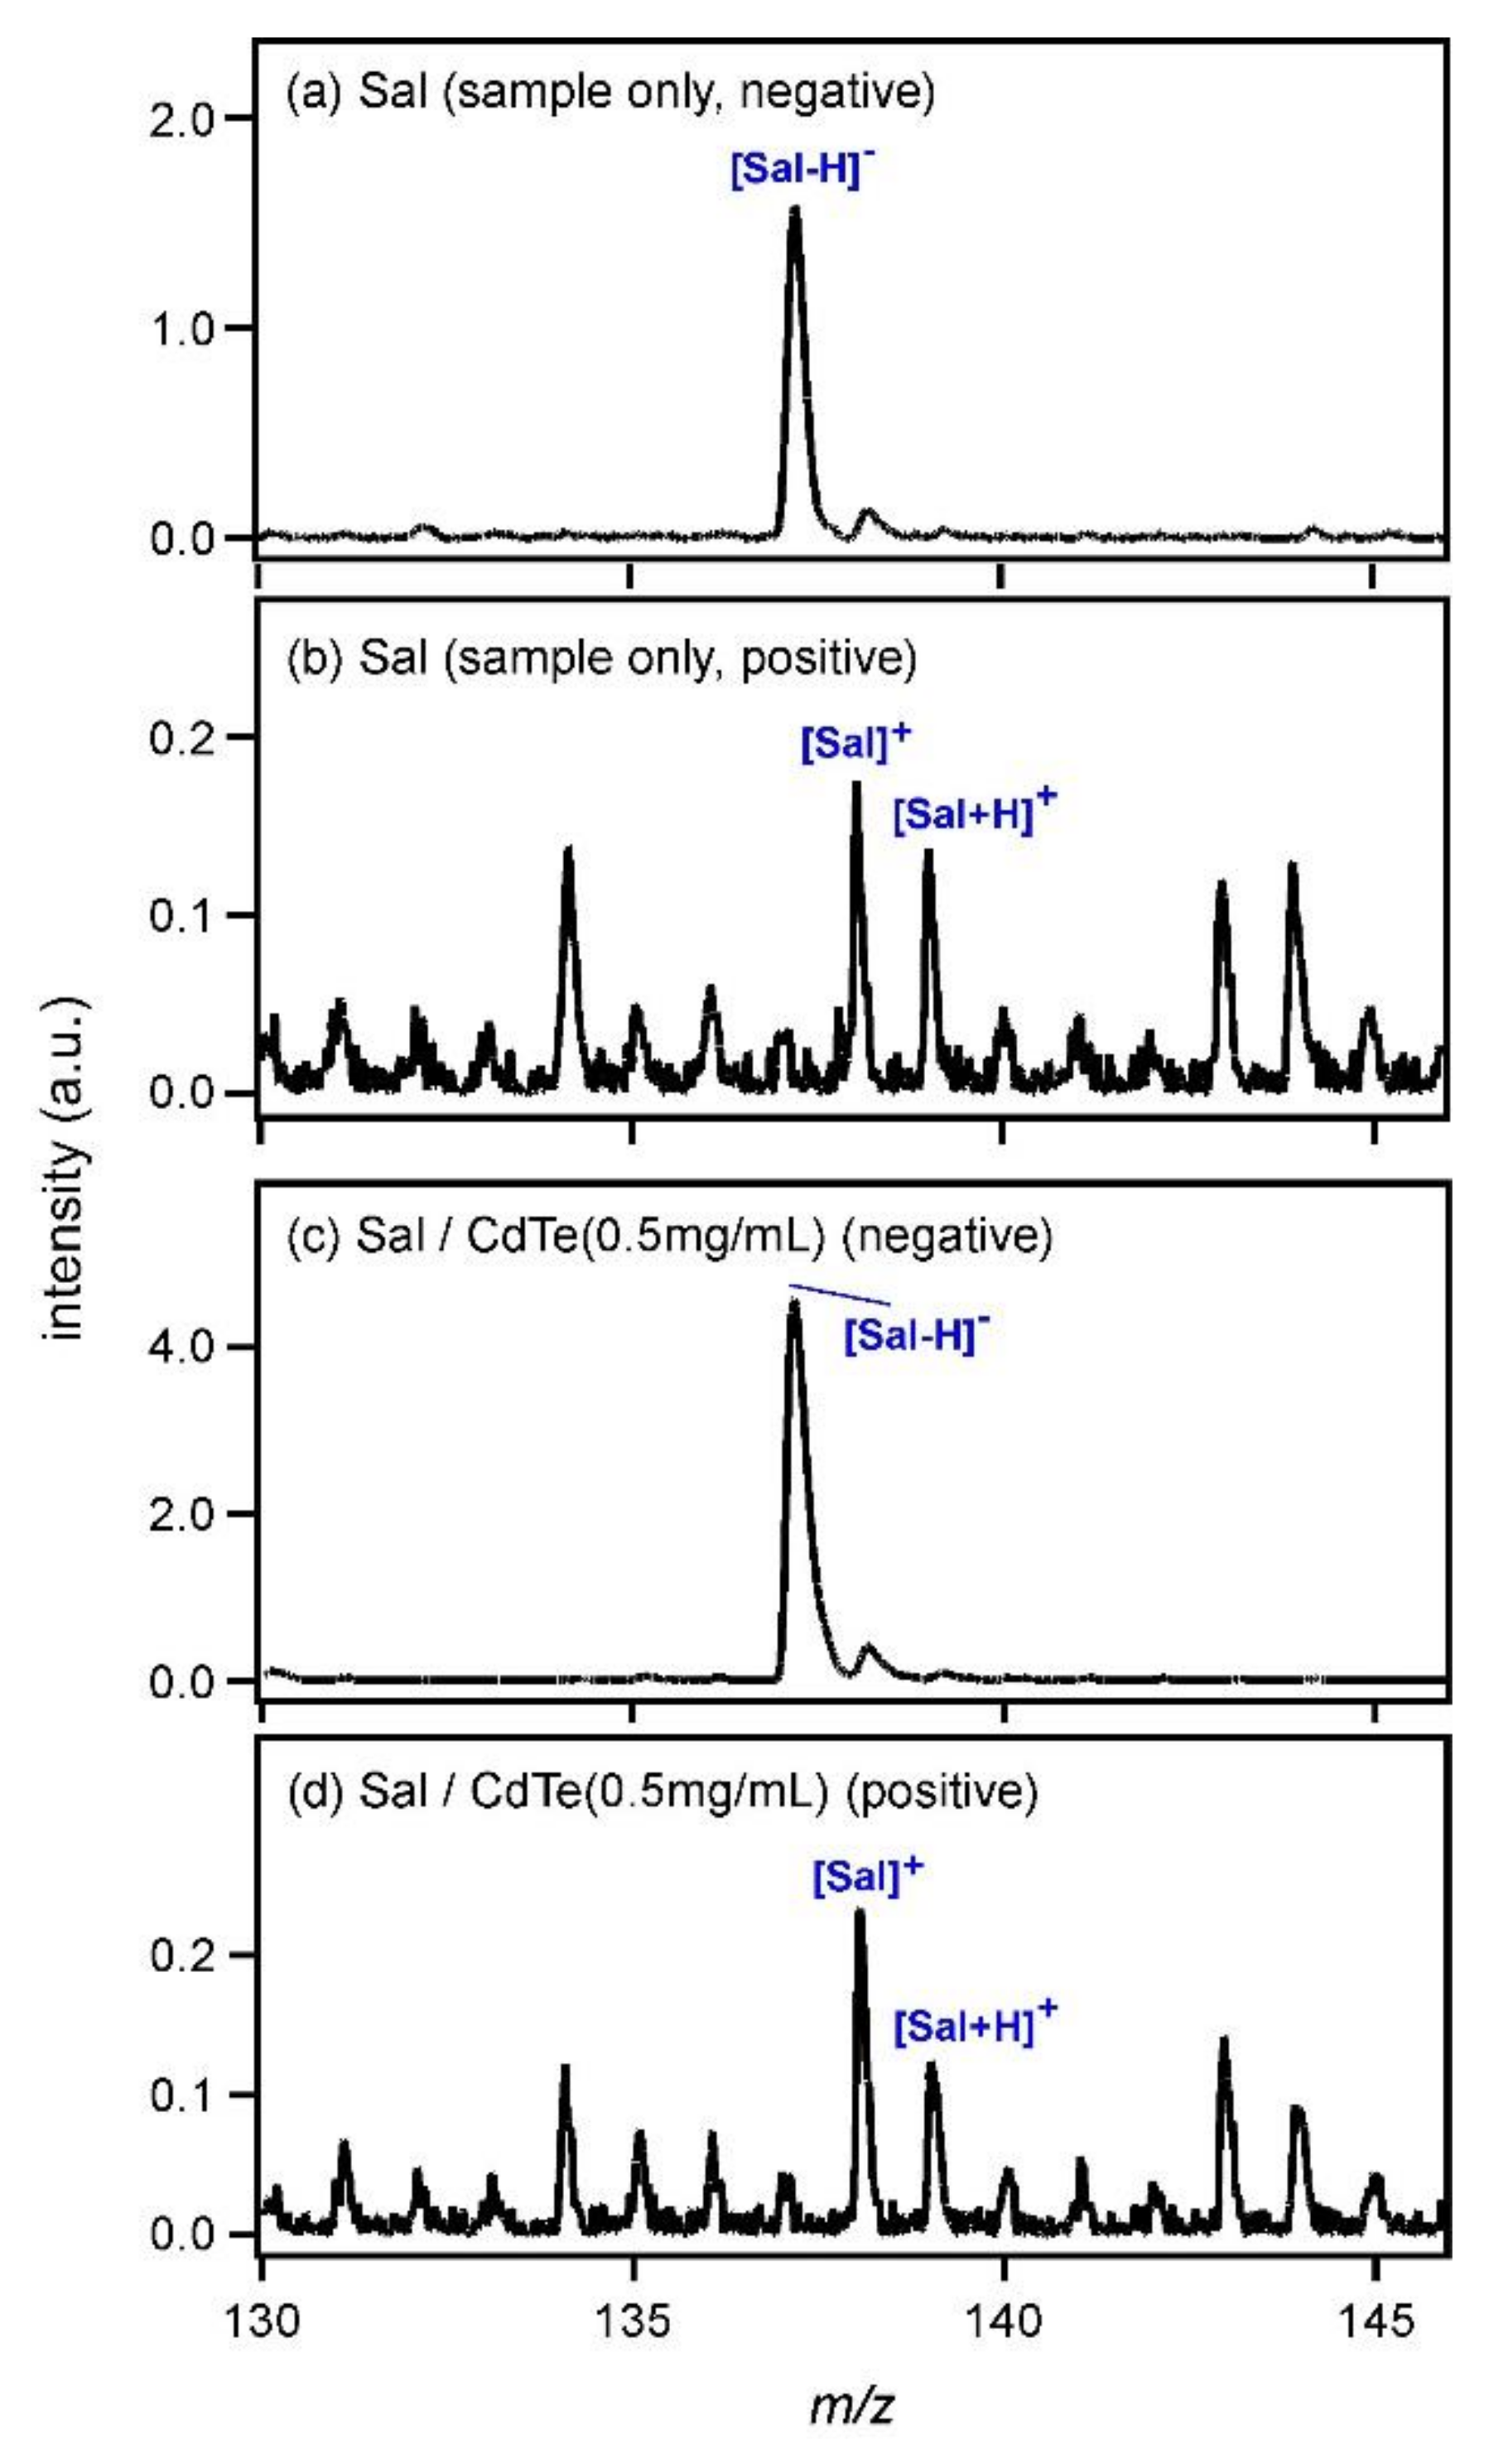
Figure 1a shows the laser desorption ionization (LDI) mass spectrum of Sal (sample only) in the negative ion region. The spectrum was obtained without use of any matrix. As Sal has an absorption coefficient at 337 nm, it was ionized to yield a deprotonated species, [Sal − H]
−, at
m/
z = 137 even in the absence of a matrix. The LDI mass spectrum of Sal in the positive ion region is shown in
Figure 1b. Although the S/N ratio was very low, peaks of radical cation species [Sal]
+ and protonated Sal ([Sal + H]
+) were observed at
m/
z = 138 and 139. [Sal + H]
+ and [Sal − H]
− were generated as a result of the dissociation of two Sal molecules in Sal crystals after the photoexcitation. As Sal is an acidic molecule, it could be easily deduced that proton adduction would be difficult and the peak intensity of [Sal + H]
+ would be low. For the generation of the radical cation species, [Sal]
+, the following reaction would be expected.
Protons generated during the production of [Sal−H]− species would attack Sal to remove an electron. Hydrogen radicals would terminate each other in the gas phase and a hydrogen molecule would be released. In addition, a reaction pathway using the hemolysis reaction would be also expected.
A proton-adducted species of Sal would be first generated by the adduction of a proton to one of the oxygen atoms in Sal, which would dissociate into two radical cation species using photon or heat energy.
Figure 1c shows the MALDI mass spectrum of Sal measured using CdTe nanoparticles (0.5 mg/mL) as the matrix. The peak intensity of [Sal−H]
− increased; it was almost 2.9-fold higher than that in
Figure 1a. In the positive ion region shown in
Figure 1d, on the other hand, the peak intensities of [Sal]
+ and [Sal + H]
+ were almost equal to those in
Figure 1b. This result clearly indicated that CdTe promoted the deprotonation of Sal. After the photoexcitation of CdTe, the following reaction would be expected.
Here, R represents the other groups of Sal. Electrons ejected from CdTe nanoparticles would react with the carboxyl groups of Sal and [Sal−H]− would be generated.
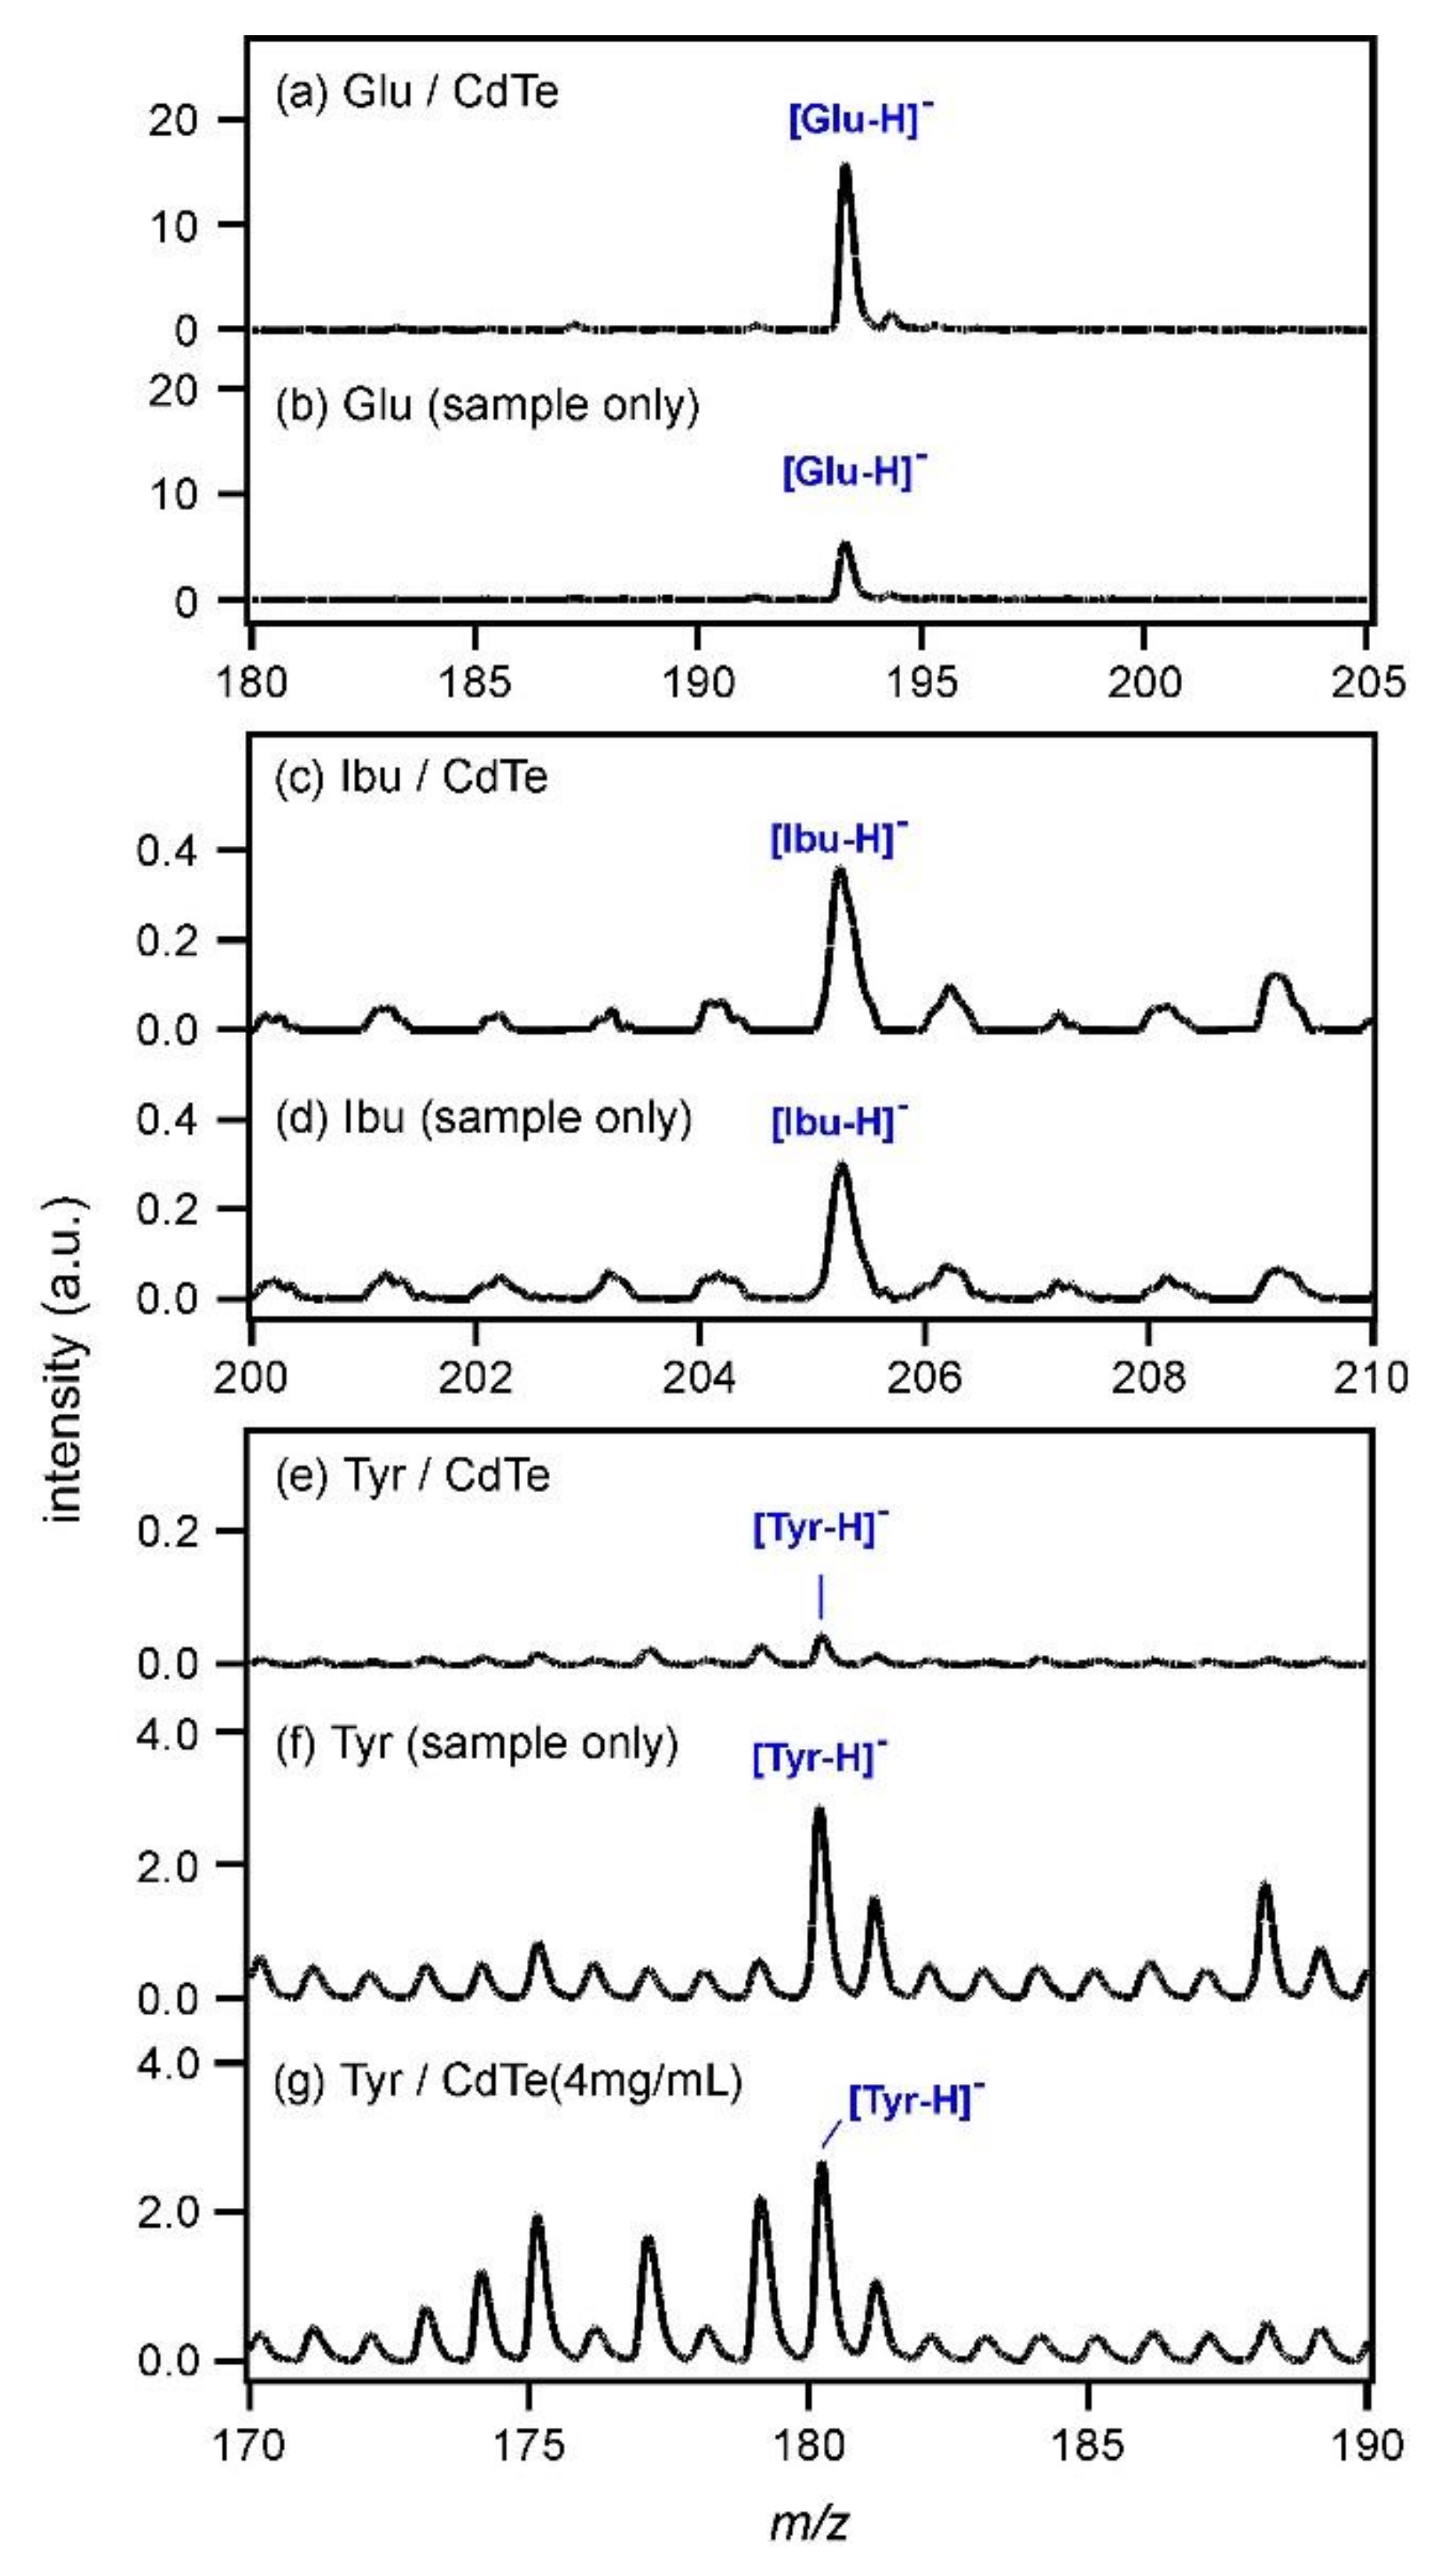
For other compounds containing carboxyl groups, MALDI MS was carried out using CdTe nanoparticles (0.5 mg/mL) as the matrix, and the obtained spectra in the negative ion mode are shown in
Figure 2. The peak intensity of Glu ([Glu−H]
−;
m/
z = 193.2) shown in
Figure 2a was increased compared with that obtained without CdTe (
Figure 2b). In addition, the peak intensity of Ibu ([Ibu−H]
−;
m/
z = 205.3) was slightly increased by using CdTe, as shown in
Figure 2c,d. However, that of Tyr ([Tyr−H]
−;
m/
z = 180.2) almost disappeared when the CdTe matrix was used (
Figure 2e,f). The pKa values were known as 2.9 for Sal, 3.2 for Glu, 4.5 for Ibu, and 2.2 for Tyr. As Tyr has the strongest acidity, the structure of the conjugate base must be the most stable among those four compounds. However, Tyr is an amino acid; it has an amino group as well as a carboxyl group. When a carboxylate anion was produced in a Tyr molecule according to Equation (3), it was expected that the amino group would catch a proton or an alkali metal cation to keep the molecular charge neutral. On the other hand, when Tyr crystals were photoexcited (
Figure 2f), the same amounts of [Tyr + H]
+ and [Tyr−H]
− ions were produced. Therefore, charge neutrality of the system was kept even after the photoexcitation and it was assumed that the buffer action of a Tyr molecule unlikely occurred, yielding a moderately intense peak (
Figure 2f). Therefore, the concentration of the CdTe matrix was changed to 4 mg/mL in order to increase the number of electrons that could react with Tyr, and MALDI MS of Tyr was re-examined. The result is shown in
Figure 2g. The peak intensity of [Tyr−H]
− was increased compared with that in
Figure 2e, although the intensities of the other peaks were also increased. Therefore, it might be possible to consider that the deprotonation of Tyr was promoted as a large number of electrons that could overcome neutralization were generated from CdTe nanoparticles at 4 mg/mL.
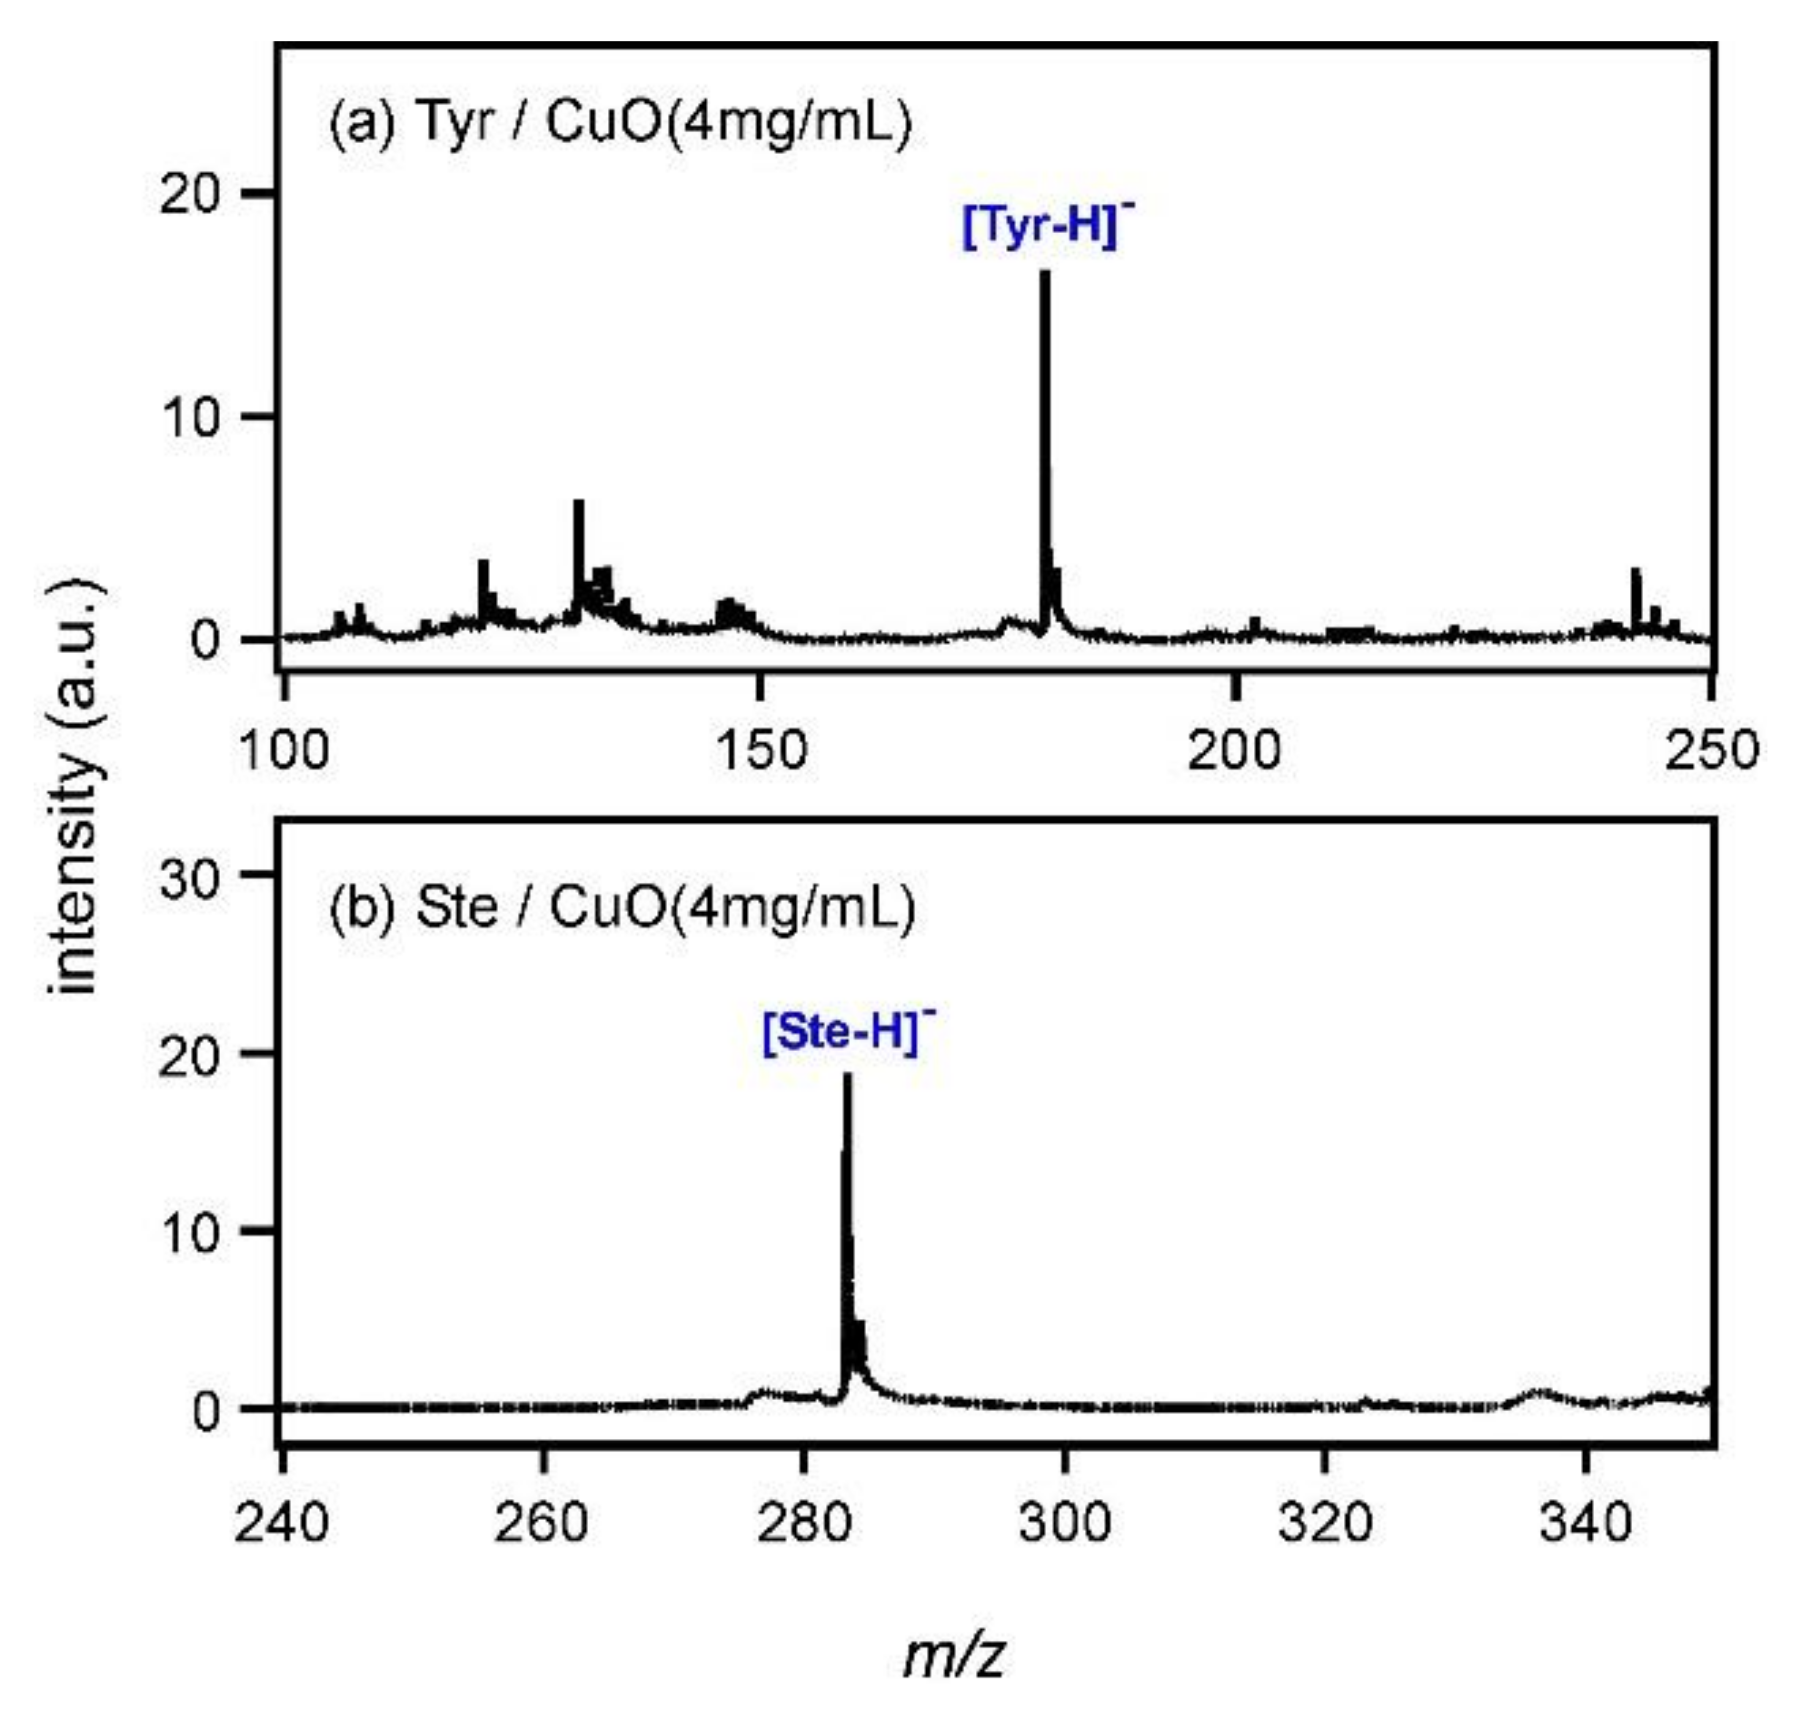
From the above results, it was clarified that CdTe nanoparticles were applicable to the ionization of compounds containing carboxyl groups. The mechanism of electron ejection from CdTe in the ionization of fatty acids was previously studied by us [
14]. An electron ejected by Auger recombination after the photoexcitation reacted with a carboxyl group in fatty acids, and the deprotonation reaction was promoted. Auger recombination is not unique to CdTe; this process occurs in other semiconductors as well. Therefore, another semiconductor nanoparticle, CuO, was used for the measurement of Tyr and stearic acid (Ste).
Figure 3a shows the mass spectrum of Tyr measured with CuO at the concentration of 4 mg/mL. The peak of [Tyr−H]
− was observed at
m/
z = 180. It was suggested that CuO had the same ability to deprotonate Tyr as CdTe by using an electron ejected after the photoexcitation. In addition, the peak intensity showed an almost 6.3-fold increase compared with that in
Figure 2g. To understand the peak intensity change, a comparison of the zeta potential values of CuO and CdTe particles might be useful. It has been reported that the zeta potential usually changes with pH and that of CuO is approximately 25 mV around pH 7 [
15,
16,
17] (sample preparation condition in this paper). CdTe nanoparticles used in this experiment were produced by laser ablation in water (without any stabilizer) and the CdTe nanoparticles easily aggregated in colloidal solution. Based on this fact, it was expected that the zeta potential of CdTe would be very small (approximately ±0 mV). Therefore, the CuO surface was more positive than CdTe and it was assumed that CuO would attract lone-pair electrons from the oxygen or nitrogen atom in Tyr. Tyr could exist very near CuO so that electrons ejected from CuO would react with Tyr effectively, leading to the high peak intensity of [Tyr−H]
−. Then, Ste was subjected to MALDI MS using CuO nanoparticles.
Figure 3b shows the mass spectrum of Ste; the peak of deprotonated Ste, [Ste−H]
−, was observed at
m/
z = 238. It was clarified that CuO had the ability to ionize fatty acids as well as CdTe. Measurements were also carried out for Ibu and Glu by using CuO, and spectra were shown in Figure A1 (
Supplementary Materials).
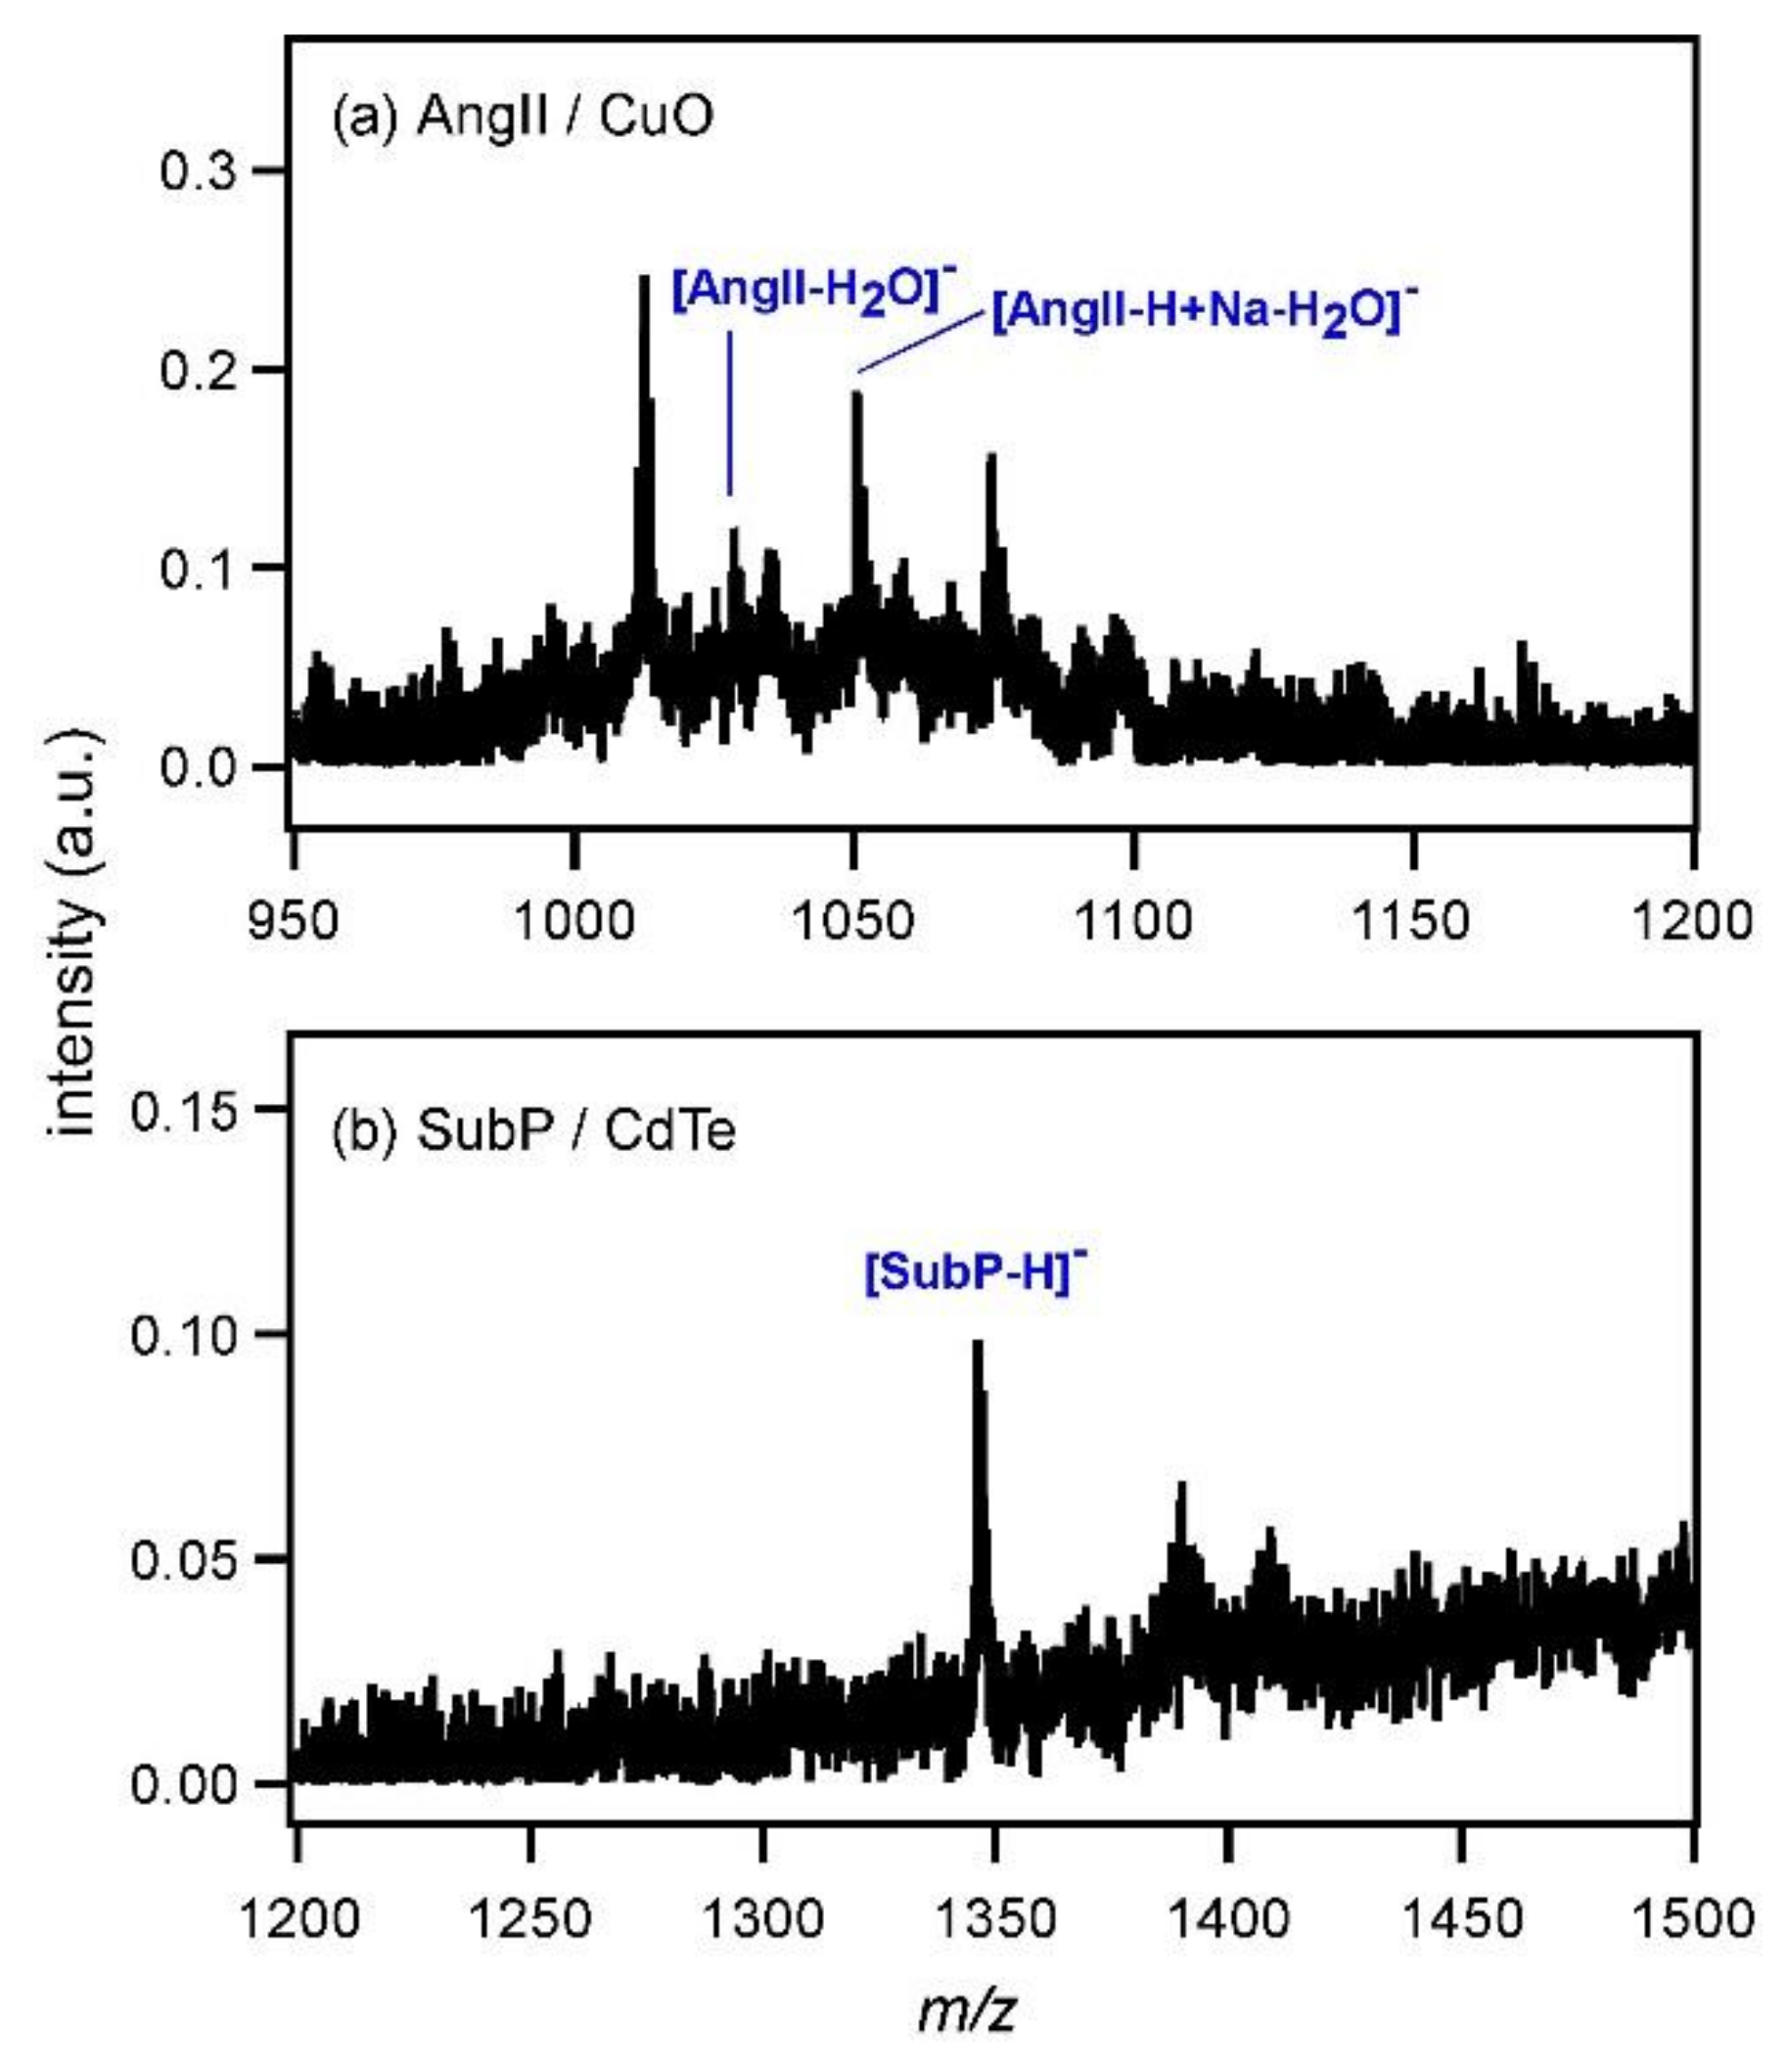
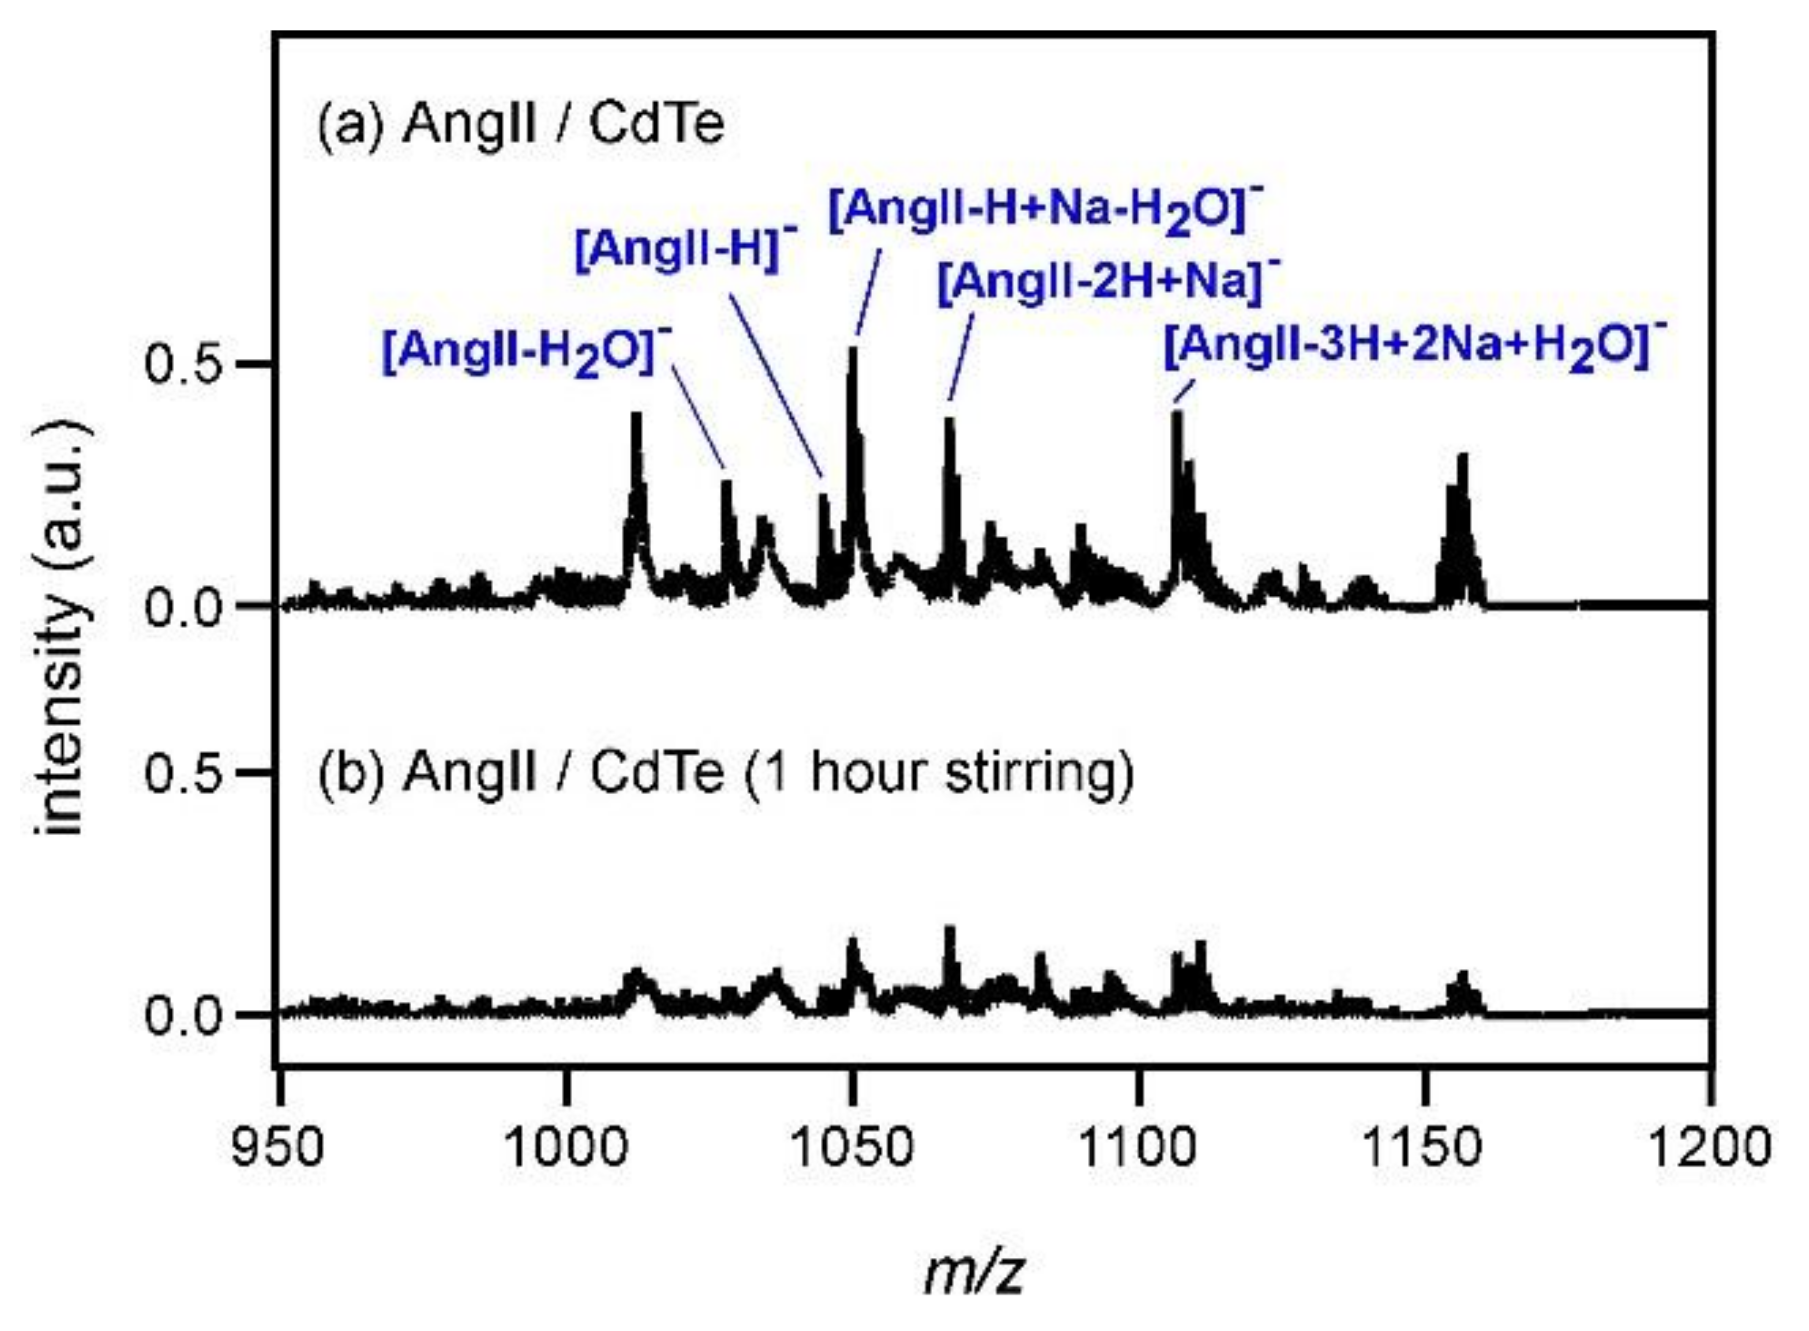
As the next step, the ionization of a rather high molecular weight compound, angiotensin II (AngII), was examined by using CdTe nanoparticles (4 mg/mL). The mass spectrum is shown in
Figure 4a. Although the peak intensity of deprotonated AngII ([AngII−H]
−) was very low and many peaks originating in other species were observed, it was understood that CdTe could be a matrix for peptides as well. As the molecular weight of AngII is higher than those of the other compounds used in
Figure 1,
Figure 2 and
Figure 3, the number of AngII molecules is smaller as the concentration is the same (1 mg/mL). To explain the results in
Figure 4, it was assumed that the distance between AngII and CdTe would be large, hindering efficient ionization. To confirm this assumption, AngII solution and CdTe dispersion were first mixed and then sonicated for 1 h to promote the mixing of those two compounds. The thus-obtained solution was subjected to MALDI MS and the spectrum is shown in
Figure 4b. Contrary to the above expectation, the peak of [AngII−H]
− could not be recognized clearly. Of course, it was possible that AngII was decomposed by the sonication. In fact, the intensities of the peaks around
m/
z = 220 and 863 became twofold higher after the sonication (not shown), although those of the other peaks below
m/
z = 1000 were almost unchanged. As another possibility, it was considered that AngII bound to CdTe strongly and the desorption of AngII to the gas phase was difficult. In a previous study of the interaction between CdS and hemoglobin, it was reported that electrostatic binding between those two molecules was induced [
18]. Tellurium belongs to the same group as sulfur (S) on the periodic table. Although AngII does not have S in its structure, it has many oxygen (O) atoms and O belongs to the same group as S as well. Therefore, it might be possible to expect that electrostatic binding between AngII and CdTe was induced. The spectral feature observed in
Figure 4 might also be explained by the HSAB (hard and soft acids and bases) theory. As CdTe is a semiconductor and charge density is expected to be approximately 0, CdTe is regarded as a soft acid. On the other hand, as AngII can easily polarize, AngII is regarded as a soft base. The soft acid CdTe and the soft base AngII attract each other and strong electrostatic binding between them is induced, making the desorption of AngII to the gas phase difficult.
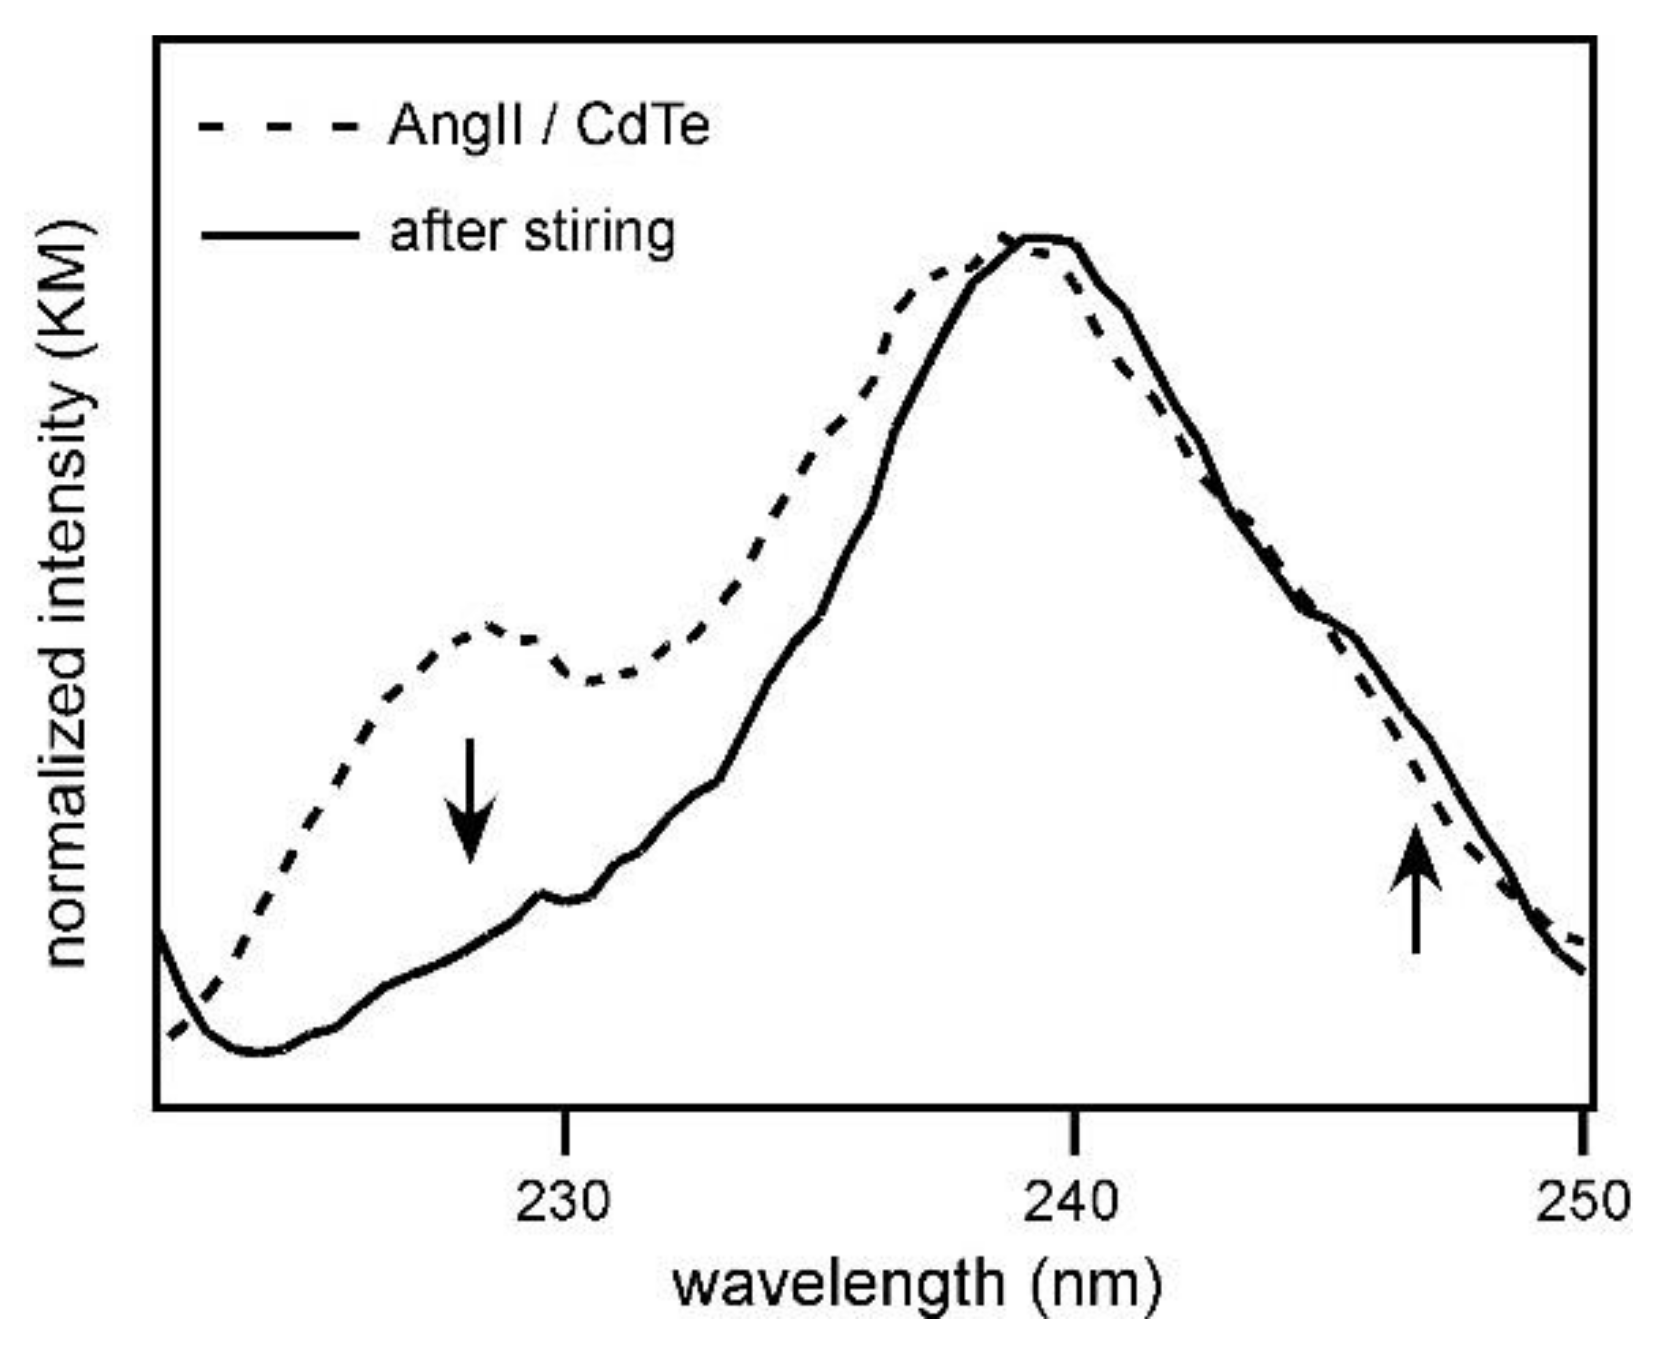
The above argument could be confirmed by measuring the diffuse reflectance spectra.
Figure 5 shows the diffuse reflectance spectra of the mixed crystals of AngII and CdTe made in the same manner as that for MALDI MS measurements. The spectra obtained before and after stirring for 1 h are shown in the spectral region from 220 to 255 nm, and this region corresponds to the absorption by CdTe nanoparticles. After stirring for 1 h, the band around 225 to 230 nm decreased and a shoulder band newly appeared around 245 nm. In addition, the wavelength of the main peak, around 240 nm, was red-shifted by the stirring. These spectral changes clearly showed that CdTe interacted strongly with AngII and the energy of the electronic state of CdTe was changed. Therefore, it was verified that the strong electrostatic binding between CdTe and AngII prevented efficient desorption, and the peak intensity of AngII-related species became low.
Figure 6a shows the mass spectrum of AngII measured with CuO (4 mg/mL). The peak intensity was very low and the deprotonated peak of AngII was not observed. In addition, another peptide, substance P (SubP), was subjected to MALDI MS using CdTe as the matrix (0.5 mg/mL) (
Figure 6b). The peak of [SubP−H]
− was observed at
m/
z = 1346; however, its intensity was also very low. When the concentration of CdTe was increased to 4 mg/mL, the peak of [SubP−H]
− disappeared (not shown). By increasing the amount of CdTe, strong electrostatic binding occurred between CdTe and all SubP molecules so that the desorption of SubP was not possible anymore. The molecular weight of inorganic MALDI matrix, such as metal or semiconductor particles, is often higher than that of organic MALDI matrix. Therefore, metal or semiconductor particles hardly desorb to the gas phase and no plume is produced after the photoexcitation. This aspect may be also unfavorable for the desorption of relatively heavy analytes, such as peptides.
