Geo-Proxy-Based Site Classification for Regional Zonation of Seismic Site Effects in South Korea


1
Geological Research Division, Korea Institute of Geoscience and Mineral Resources, Daejeon 305-350, Korea
2
Earthquake Research Center, Korea Institute of Geoscience and Mineral Resources, Daejeon 305-350, Korea
*
Author to whom correspondence should be addressed.
Appl. Sci. 2018, 8(2), 314; https://doi.org/10.3390/app8020314
Submission received: 24 January 2018
/
Revised: 5 February 2018
/
Accepted: 17 February 2018
/
Published: 24 February 2018
(This article belongs to the Special Issue Seismic Metamaterials)
Abstract
:Seismic site effects and topographic effects related to ground motion occur during an earthquake due to site-specific geotechnical or geological characteristics, including the geological or geographical structure and the characteristics of near-surface sub-soil layers. Site-specific site effects due to geological conditions have been confirmed in recent earthquake events. Earthquake-induced damage has mainly occurred at accumulated soft soil layers under basins or along coasts and rivers. An alternative method has recently been proposed for evaluating regional seismic site effects and amplification factors using digital elevation models (DEM). High-quality DEMs at high resolutions may be employed to resolve finer-scale variations in topographic gradients and consequently, correlated site response parameters. Because there are many regions in South Korea lacking borehole datasets, which are insufficient for site classification only using borehole datasets, a DEM-based proxy for seismic zonation can be effective. Thus, in this study, geo-proxy-based site classification was proposed based on empirical correlations with site response parameters and conducted for regional zonation of seismic site effects to identify the amplification of characteristics in the western metropolitan areas of South Korea, depending on the site-specific geo-spatial conditions.
1. Introduction
The near-surface seismic motion and earthquake-induced damage experienced during an earthquake can vary significantly, even for sites located at the same distance from the epicenter. This is due to the source effects and propagation path through the bedrock as well as the seismic response due to site-specific geotechnical dynamic characteristics, such as the shear wave velocity (VS) in the sub-soil layers. The site-specific site effects indicate the seismic ground motion expressed by the acceleration or velocity of each period (or frequency) [1] and directly affect the dynamic response characteristics of near-surface structures.
To predict the site-specific properties and seismic hazards caused by earthquakes, the site classification system has been proposed in almost all current seismic design standards. And to determine the ground motion in a more systematic way by considering site effects, the system is useful for seismic design and seismic performance assessment. This site classification system can be used not only for the engineering purpose of seismic design but also as a fundamental indicator for prompt response or an earthquake early warning framework to minimize seismic damage. In other words, as seismic site effects can occur in a significantly diverse manner depending on the regional geotechnical and geological conditions, it is necessary to improve and rationalize the geotechnical classification system that reflects regional geotechnical and topographical characteristics.
In particular, unlike overseas regions with major earthquakes, the Korean peninsula, which is part of a region that experiences medium- or small-scale earthquakes, has insufficient records of strong earthquake ground motion. Thus, related studies have been conducted to quantitatively assess the site effects through seismic response analysis that has used geotechnical dynamic properties, including the VS distribution, or derived a site-specific site classification system based on such assessment [2,3,4,5,6]. Nevertheless, there are a few studies on differential and efficient site-specific seismic response assessments and the site classification system derivation for a regional-scale level rather than a local site level. Such broad area information can be useful for promptly identifying geotechnical and geological characteristics at a site of interest. And the zonation information provides available engineering indicator information when simultaneous damages occur in a broad area near the epicenter, such as during the Gyeongju earthquake (ML 5.8, 2016) and Pohang earthquake (ML 5.4, 2017).
Recognition of the importance of ground-motion amplification from regolith has led to the development of systematic approaches to mapping seismic site conditions [7,8,9,10] as well as quantifying both amplitude- and frequency-dependent site amplification [11]. A now standardized approach for mapping seismic site conditions is measuring or mapping VS30. Real-time earthquake alert systems, such as the Prompt Assessment of Global Earthquakes for Response (PAGER) [12,13,14], seek to rapidly evaluate potential ground shaking in the source region and subsequently provide an estimate of the population exposure to potentially fatal levels of shaking in any region of the world. Consequently, knowledge of local seismic site conditions is an important factor in estimating the ground motion amplification potential. Allen and Wald [15] also presented a method for mapping uniform global seismic site conditions, or the average shear velocity to VS30, from the Shuttle Radar Topography Mission (SRTM), a 30 arcsec (approximately 1 km resolution at the equator) digital elevation model [16].
In many seismically active regions of the world, information about surficial geology and shear wave velocity (VS) either does not exist, varies dramatically in quality, varies spatially, or is not easily accessible. Such maps are available for only a few regions, predominantly for seismically active urban areas of the world. Wald et al. [15] compared topographically based maps with existing VS30 site-condition maps, currently used for ShakeMap and other applications, that are based primarily on geological maps. These analyses are then repeated for VS30 data aggregated in stable continental regions. The topographic slope can be used as a reliable proxy for VS30 in the absence of geologically and geotechnically based site-condition maps through correlations between VS30 measurements and topographic gradients [17].
In South Korea, borehole datasets, which include spatial information, geotechnical layer information and standard penetration test (SPT) information, were evenly distributed on a two-dimensional coordinate plan. In order to estimate the site-specific site effects, empirical correlations among geotechnical layers, SPT-N value and VS have been proposed using the borehole datasets in partial metropolitan areas based on appropriate statistical regressions. Accordingly, a seismic zonation map with site response parameters, according to the Korean seismic codes, was developed by considering correlations between the spatially interpolated borehole information [18]. The site effects, resulting in the amplification of earthquake ground motion, are strongly influenced not only by the subsurface soil conditions and structure but also by the surface topography. Yet, over the last several decades, most studies of site-specific seismic responses in South Korea have focused primarily on the seismic amplification associated with geological and soil conditions. Thus, site classification with a digital elevation models (DEM)-based or a geographic coverage datasets-based proxy should be established based on empirical correlations with site response parameters to evaluate regional-scale seismic zonation and to develop an earthquake alert system.
In this study, to identify the amplification characteristics in South Korea, depending on the geo-spatial condition (elevation, slope, etc.), the dual framework for a site classification system with site response parameters and geo-proxies was proposed (Figure 1). First, borehole datasets, DEM and a geographic coverage map were constructed as the geotechnical database (DB). Second, the geo-spatial grid information was estimated based on the optimized geostatistical interpolation method. In particular, the geostatistical optimization of the interpolation method and clustering estimation was developed as a computational framework to construct the appropriate seismic zonation using a geo-spatial DB, which was composed of multi-variable geo-data [18]. Accordingly, the typical geotechnical layer information, which was categorized into fill, alluvial soil and weathered layer, was constructed as a spatial distribution map separated into 100 m mesh areas. In addition, a DEM layer was constructed with the same mesh areas and coordinate system of the geotechnical layer.
Third, three site response parameters (depth to bedrock, VS30 and site period) were computed using the thickness of the geotechnical layer with a representative VS for each layer, based on the conventional criteria for seismic site classification. To establish the site classification criteria with correlations between site response parameters and geo-proxies, the authors first correlated VS30 with topographic elevation and slope data at each grid square in Seoul areas. Thus elevation- and slope-based site classification was determined using the constructed DEM in the Incheon area. Finally, the three-dimensional spatial distribution map and seismic zonation with administrative sub-units were visualized to validate the suitability of the site classification criteria and to provide a site-specific decision-making platform related by site-effect and induced seismic hazard. In this study, to verify the coincidence of dual criteria of seismic site classification considering local geotechnical conditions, geotechnical datasets in the Seoul area were selected as base information for developing the geo-proxy-based site classification and this was applied to the Incheon area for validation of the proposed criteria.
2. Site Classification System with Seismic Response Parameters
2.1. Seismic Response Parameters
A comprehensive geotechnical DB has been constructed and expanded by collecting existing borehole datasets for major metropolitan cities and areas of interest in South Korea. This DB was designed to be utilized by geotechnical earthquake engineering and to secure additional geotechnical layer data from geotechnical expert-based site surveys for regions lacking in borehole datasets. In addition, it was applied in combination with geotechnical dynamic properties, such as the VS of the target area, to derive and suggest site-specific seismic response information essential for establishing local strategies for a seismic mitigation plan. Figure 1 shows a schematic framework for constructing a geotechnical DB to derive site response parameter information of target regions, which have the potential for serious earthquake disasters. The site period (TG) was representatively considered as a parameter and spatial zoning information on site classification was presented.
This study first examined and established various geotechnical engineering parameters that can quantify the amplification characteristics of ground motion, which is the site-specific geotechnical response. The average VS up to 30 m (VS30) can be defined as a parameter that distinguishes the amplification degree of ground motion. Unlike VS30 that considers the quantitative geotechnical stiffness distribution of the target location, the depth to bedrock (H), which reflects geometric conditions based on geotechnical layer conditions and correlated stiffness, can be considered as a parameter. In addition, the site period (TG), which can be determined using the bedrock depth as well as the geotechnical stiffness variation up to the depth among the geometric conditions of the target site, is also defined as a site response parameter. The average shear wave velocity of the bedrock topsoil layers (VS,soil), which has recently emerged as a combined parameter according to the relative location of the bedrock depth, can be considered as a parameter of the site effects. Furthermore, considering that VS30 is an indicator that takes 30 m as the empirical depth, the average shear wave velocities with less depth (VS10, VS15 and VS20 or VSDs) can also be considered as site response parameters [4]. The examined site response parameters are the same variables but they can also be represented in other expressions or terms. In particular, TG can be expressed as the fundamental frequency that corresponds to the resonance frequency (f0) by using its inverse. The calculation equations for the site effect parameters can be summarized as follows. First, VS30, which is mainly applied in the current site classification system, can be calculated as shown in Equation (1). di and VSi represent the thickness and average VS of the i-th layer up to 30 m underground, respectively. In this case, the sum of di is 30 m.
In addition to the existing VS30, various site response parameters are examined and identified, including TG, VSDs (DS < 30 m) and VS,soil [4,6,18]. TG and VS,soil can be calculated by Equations (2) and (3), respectively. Di and VSi represent the thickness and shear wave velocity of the i-th layer distributed over the bedrock, respectively. In addition, the site period rises as the bedrock depth (H = ∑Di) increases.
2.2. Site Class Based on the Seismic Response Parameters in South Korea
The amplification of ground motion due to the site-specific seismic response varies significantly depending on the geotechnical characteristics of the target region. Such differences are presented as a site classification system for seismic design and performance assessment. The site classification system currently used in South Korea is based on the regional characteristics of the western part of the United States, which are very different from those of the Korean peninsula. Recently, related studies [2,3,19,20] have been conducted to improve and modify the site classification system for the appropriate local site response characteristics in South Korea.
The site geotechnical classification in South Korea (Ministry of Construction and Transportation) [21] directly used the 1997 NEHRP (National Earthquake Hazards Reduction Program) regulation and 1997 UBC (Uniform Building Code), which were enacted based on the site classification method according to VS30 proposed by Borcherdt [11], through a review of the 1989 Loma Prieta earthquake records [3]. This site classification method has also been empirically verified for the 1984 Northridge earthquake in the western part of the United States [22]. Table 1 summarizes the current site classification system for earthquake zones I (Z = 0.11) and II (Z = 0.07) in South Korea, which are localized for possible earthquakes with a 500-year return period. The site coefficients, Fa and Fv, are the relative ground motion ratios of the ground surface exposed to bedrock (bedrock outcrop) to the ground surface that is not exposed to bedrock but covered with soil. They can be determined using the response spectrum (RS) of each structure period (T) of the ground motion [2,3,23].
The seismic design regulations in the western part of the United States have been derived from a combined analysis of actual earthquake damage records and additional numerical analysis [2,3]. In the seismic design process in South Korea, the design ground motion from the quantitative application of the site effects can be overestimated or underestimated depending on the local geotechnical characteristics. Accordingly, a site classification system in which the classification criteria, classification steps and site coefficients are quantitatively improved, considering the geotechnical characteristics in South Korea, was developed. In particular, the developed site classification system presents the site period (TG), which is a comprehensive geotechnical earthquake engineering indicator, as an additional classification criterion.
Sun [2,4] and Sun and Kim [18,24] conducted seismic response analysis for various site conditions in South Korea, analyzed the results and recalculated domestic site coefficients to systematically reflect the site-specific seismic response characteristics in South Korea. In addition, their studies suggested various improvement measures for the domestic geotechnical classification system and the subdivision of the geotechnical classification. Furthermore, to confirm the possibility of site classification using only the geometrical conditions of the ground from a more intuitive and practical perspective, their studies suggested that the bedrock depth (H) and site period (TG) generally have a correlation of TG = 0.01H, when their units are not considered.
In particular, in this study, the site classification system (Table 1) of Sun [2], which is based on various site response parameters, was introduced as a technique that considers the geotechnical characteristics in South Korea. This classification system is used as a basis for developing an efficient empirical site classification system for broad areas in the Korean peninsula. As shown in Table 1, site classification can be performed using the site period and the short-term site coefficient (Fa) as well as the long-term site coefficient (Fv) can be determined accordingly. VSDS indicates the mean VS to a depth (Ds) shallower than 30 m and is equal to VS30 times Cs (i.e., VSDS = VS30 × Cs). Here, Cs is expressed by 0.214DS0.453 (i.e., Cs = 0.214Ds0.453) and synthetically, VS30 = VSDS/Cs = VSDS/(0.214DS0.453).
3. Development of Site Classification with Geo-Proxies Using Geotechnical Database in Seoul
3.1. Study Areas and Geotechnical Database
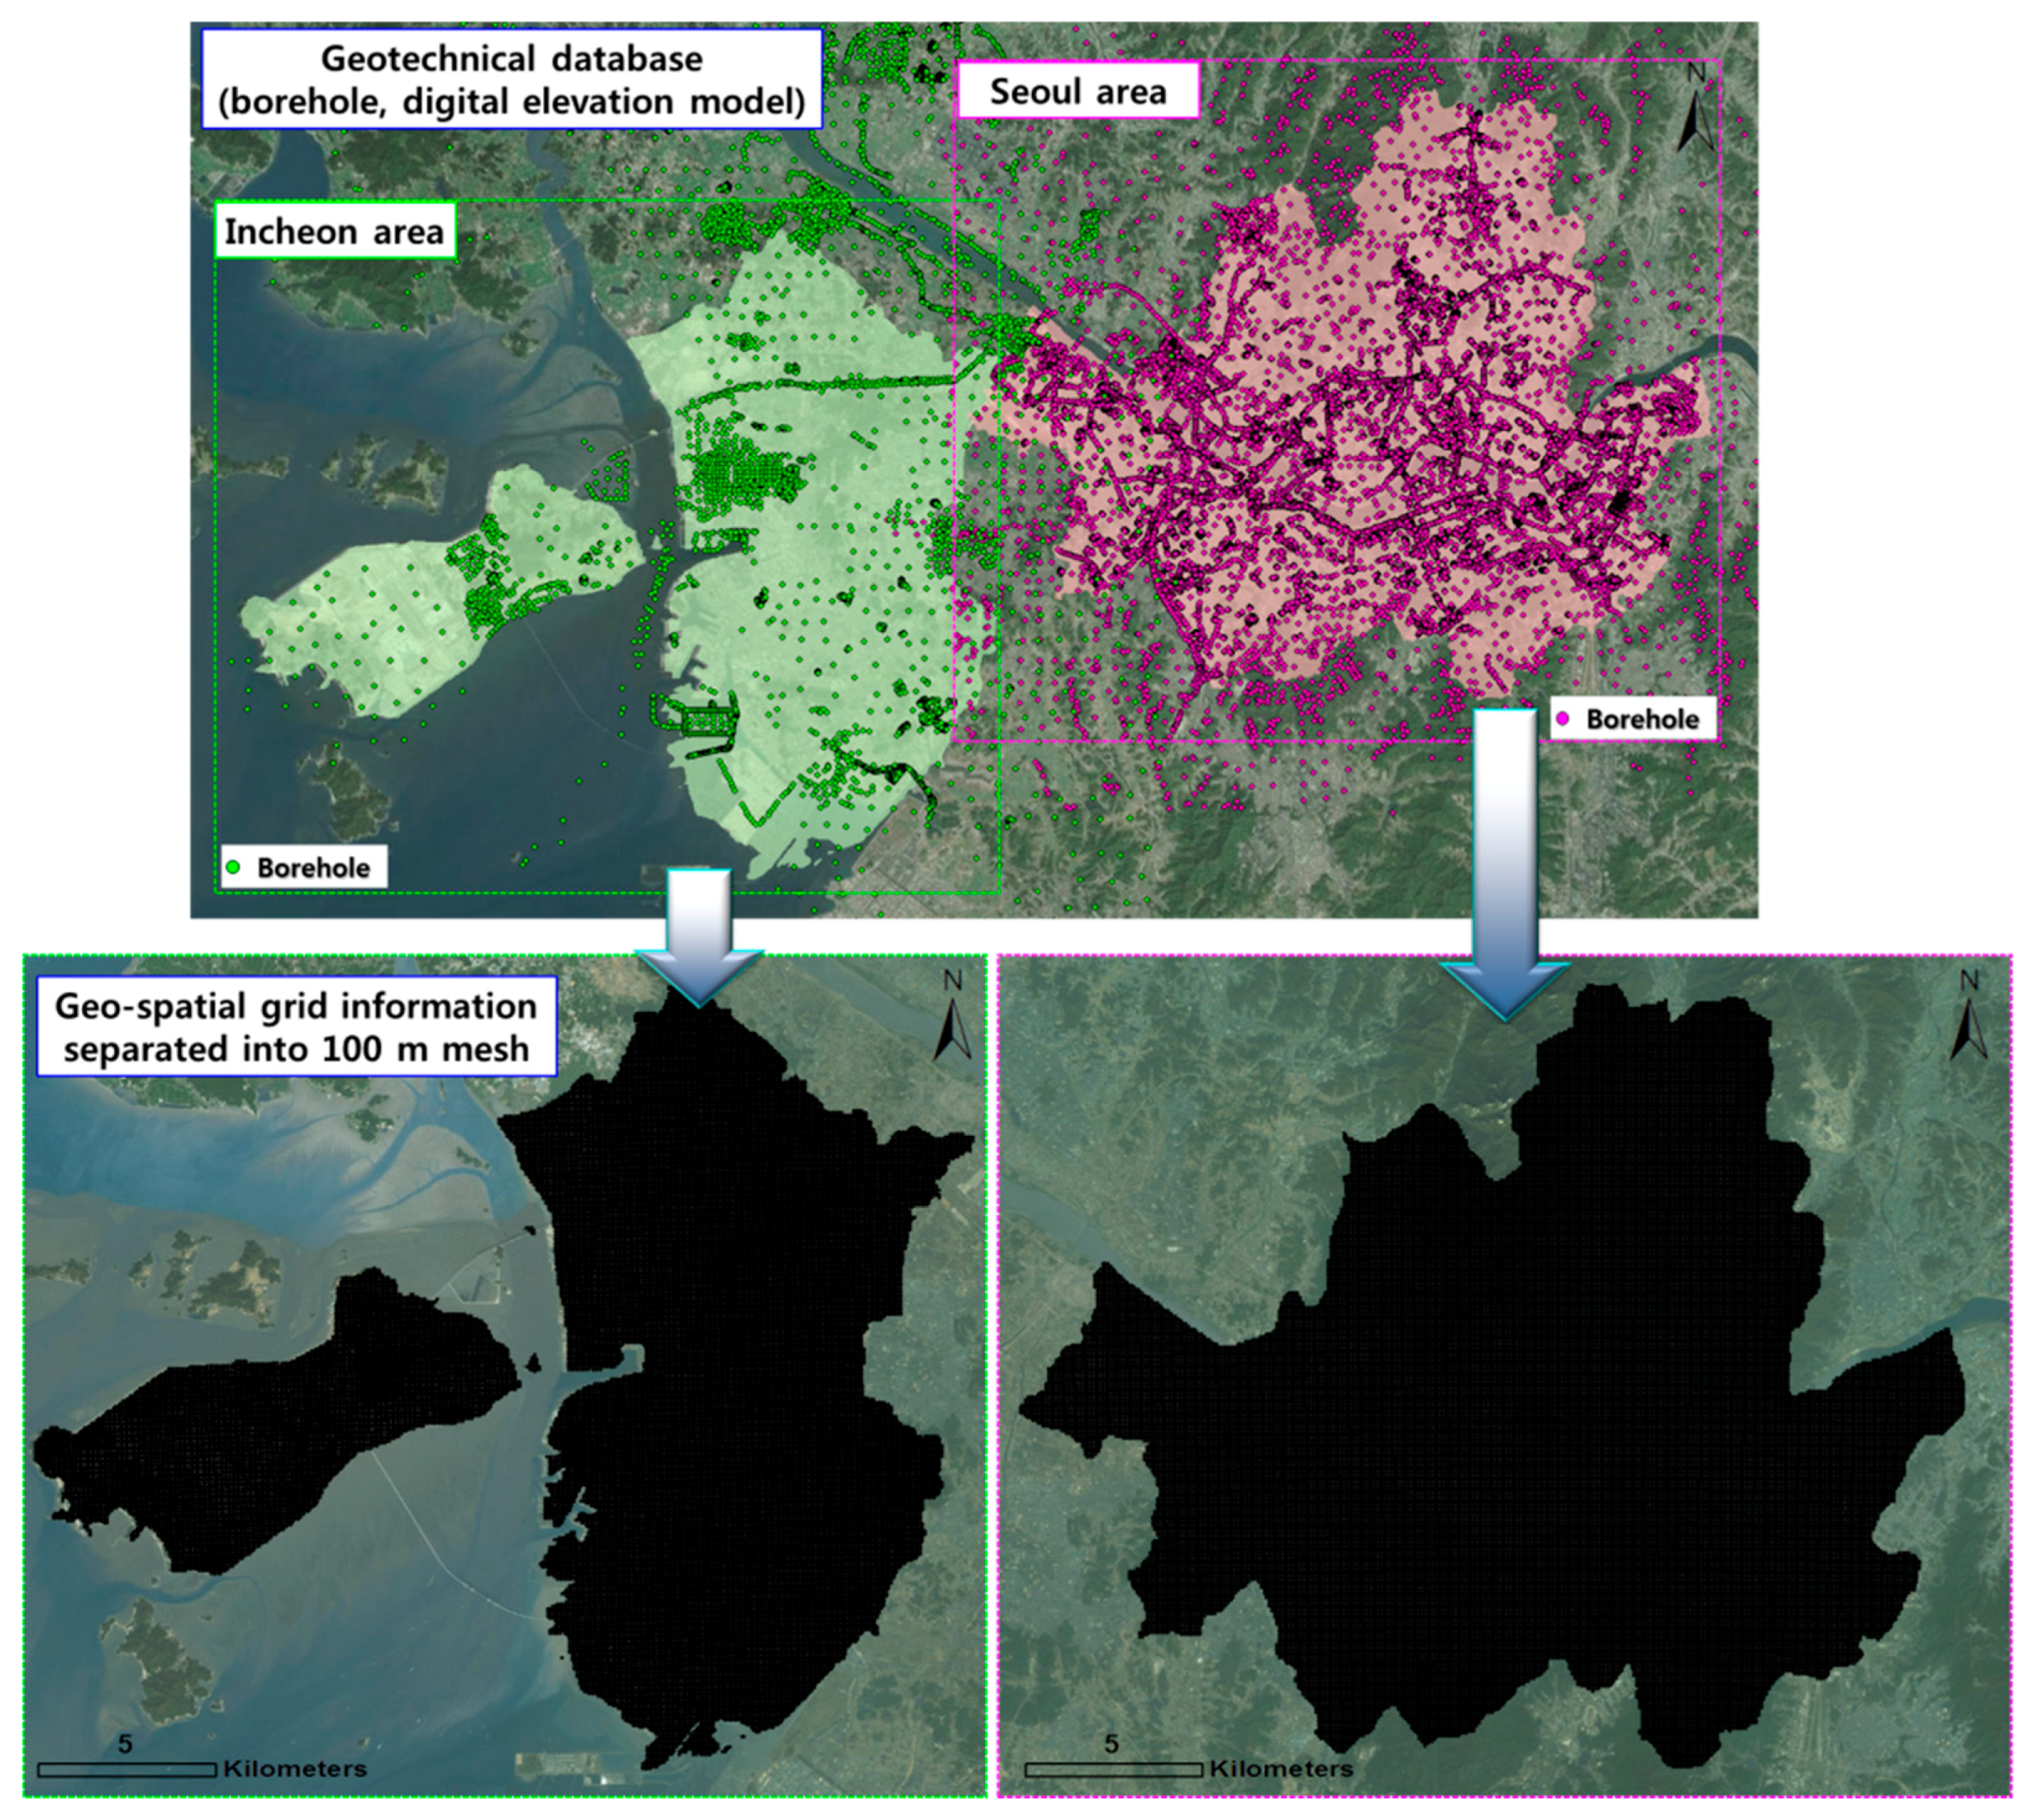
To establish an empirical relationship for presenting seismic response based on site-specific geotechnical characteristics (normalized as spatial grid information), reliable quantitative calculation of site effect parameters in the target region must first be performed. This study selected the western metropolitan areas (the Seoul and Incheon regions) in South Korea, where reliable geotechnical datasets (borehole) and land coverage information (satellite images and digital elevation models) were well distributed spatially and constructed as a geo-spatial DB (Figure 2). The Seoul and Incheon regions are the largest and second-largest cities in South Korea, respectively.
First, the borehole datasets and DEM in the Seoul area were applied as backbone datasets to develop the seismic zonation with seismic response parameters based on the validated classification system and to normalize the correlations between seismic response parameters and DEM for developing geo-proxy criteria. In the Seoul area, estimates of the spatial geotechnical layers across the extended area were collected from a total of approximately 22,300 existing borehole datasets and approximately 1700 surface geo-knowledge datasets. To estimate soil layers spatially, the optimized site-specific interpolation method [18] was applied to the Seoul area (53.0 km East–West, 39.0 km North–South). The Seoul area was separated into 100 m mesh areas, yielding 225,835 spatial grid squares (interpolation grid squares) including the extended area of the Seoul administrative area. Component mesh-unit data was created for each spatial grid square [25]. The subsurface soil layers identified from borehole data were classified into five categories: fill, alluvial soil, weathered soil, weathered rock and bedrock. In the river basin of the Seoul area, the alluvial soil is thicker (up to 70 m) and the depth to bedrock is deeper (up to approximately 85 m) than in the surrounding mountain areas (Table 2). Soil development in the river basin is mainly a result of fluvial landform processes. Such zones of thick soil and deep depth to bedrock are susceptible to ground motion amplification due to site effects during earthquakes.
For validation of the classification system based on the site response parameters and proposed geo-proxies, the Incheon area near Seoul was selected for cross-validation. The existing borehole datasets included in the geotechnical DB in the Incheon area were obtained from approximately 7500 boreholes and the additional geo-knowledge-based geotechnical layer data [26] were acquired from 340 boreholes. The extended area in Incheon is 41 km in the east–west direction and 34 km in the north–south direction. Similar to Seoul, in order to estimate soil layers spatially, the Incheon area was separated into 100 m mesh areas, yielding 189,320 spatial grid squares (interpolation grid squares) including the extended area. As shown in Table 2, plains with coasts and rivers as well as thick alluvial soil in some hills are developed in the study area and the maximum thickness is approximately 24 m. In addition, the weathered layer, which is developed by long-term weathering, is also found in the target area and has a thickness of up to 32 m. These map data can provide intuitive information for solving geotechnical engineering problems and making decisions.
Thirty-seven rock types are found in the Seoul area and their geological ages can be classified into Precambrian, unknown, Triassic, Jurassic, Cretaceous and Quaternary. Among them, distributive ratios decrease in the order of Jurassic Daebo granites, Precambrian banded gneiss from the Gyeonggi gneiss complex and Quaternary alluvium, which in total account for about 83.7% of the rock types in the area. In Seoul and nearby Incheon, 10 and 15 rock types, respectively, have developed, with the former being classified into Precambrian, Jurassic and Quaternary and the latter into Precambrian, Jurassic, Cretaceous and Quaternary. In Seoul, the distributive ratios decrease in the order of banded gneiss from the Gyeonggi gneiss complex, Daebo granites and alluvium, which account for 95.5% of the rocks in the area [27].
The DEMs were separated into 5 m mesh areas, which included the extended areas of the Seoul and Incheon administrative areas. In general, the regional geographic information system (GIS) or digital topographic map (DTM) for a specific city utilizes the Transverse Mercator (TM) coordinate system, which was transformed into the GRS 80-based world geodetic reference frame. And the ellipsoidal and the projected areas were calculated based on the Geocentric datum of Korea reference. To evaluate the correlations between site response parameters and geo-proxies at the same location, the topographic elevation and slope information at each geo-spatial grid square were extracted from DEM. Based on the geotechnical information calculated for these grid locations, various site effect parameters (H, VS30, VS,soil, TG and VSDS) and geo-proxies were rearranged or calculated.
3.2. Seismic Zonation Based on Site Response Parameters in Seoul
When only the borehole data within the administrative boundaries of the Seoul region are displayed on the terrain surface information using the geotechnical DB, the geo-spatial grid information, such as the geotechnical layer information, was constructed with the optimized geostatistical interpolation method (Figure 2). Seoul has a relatively large amount of data compared to other regions of interest, as well as a relatively even data distribution level. In this study, the spatial prediction of site response parameters and the spatial reliability assessment for various regions of interest in South Korea, other than Seoul, were performed based on the constructed geotechnical DB. In addition, various site response parameters were derived and a correlation analysis was performed for these parameters. It was found that Seoul generally exhibited higher correlation between parameters. Accordingly, Seoul was selected as the base region for deriving an effective evaluation technique for the site-specific site seismic response based on its data and spatial computation results and the geo-spatial grid information was secured and analyzed.
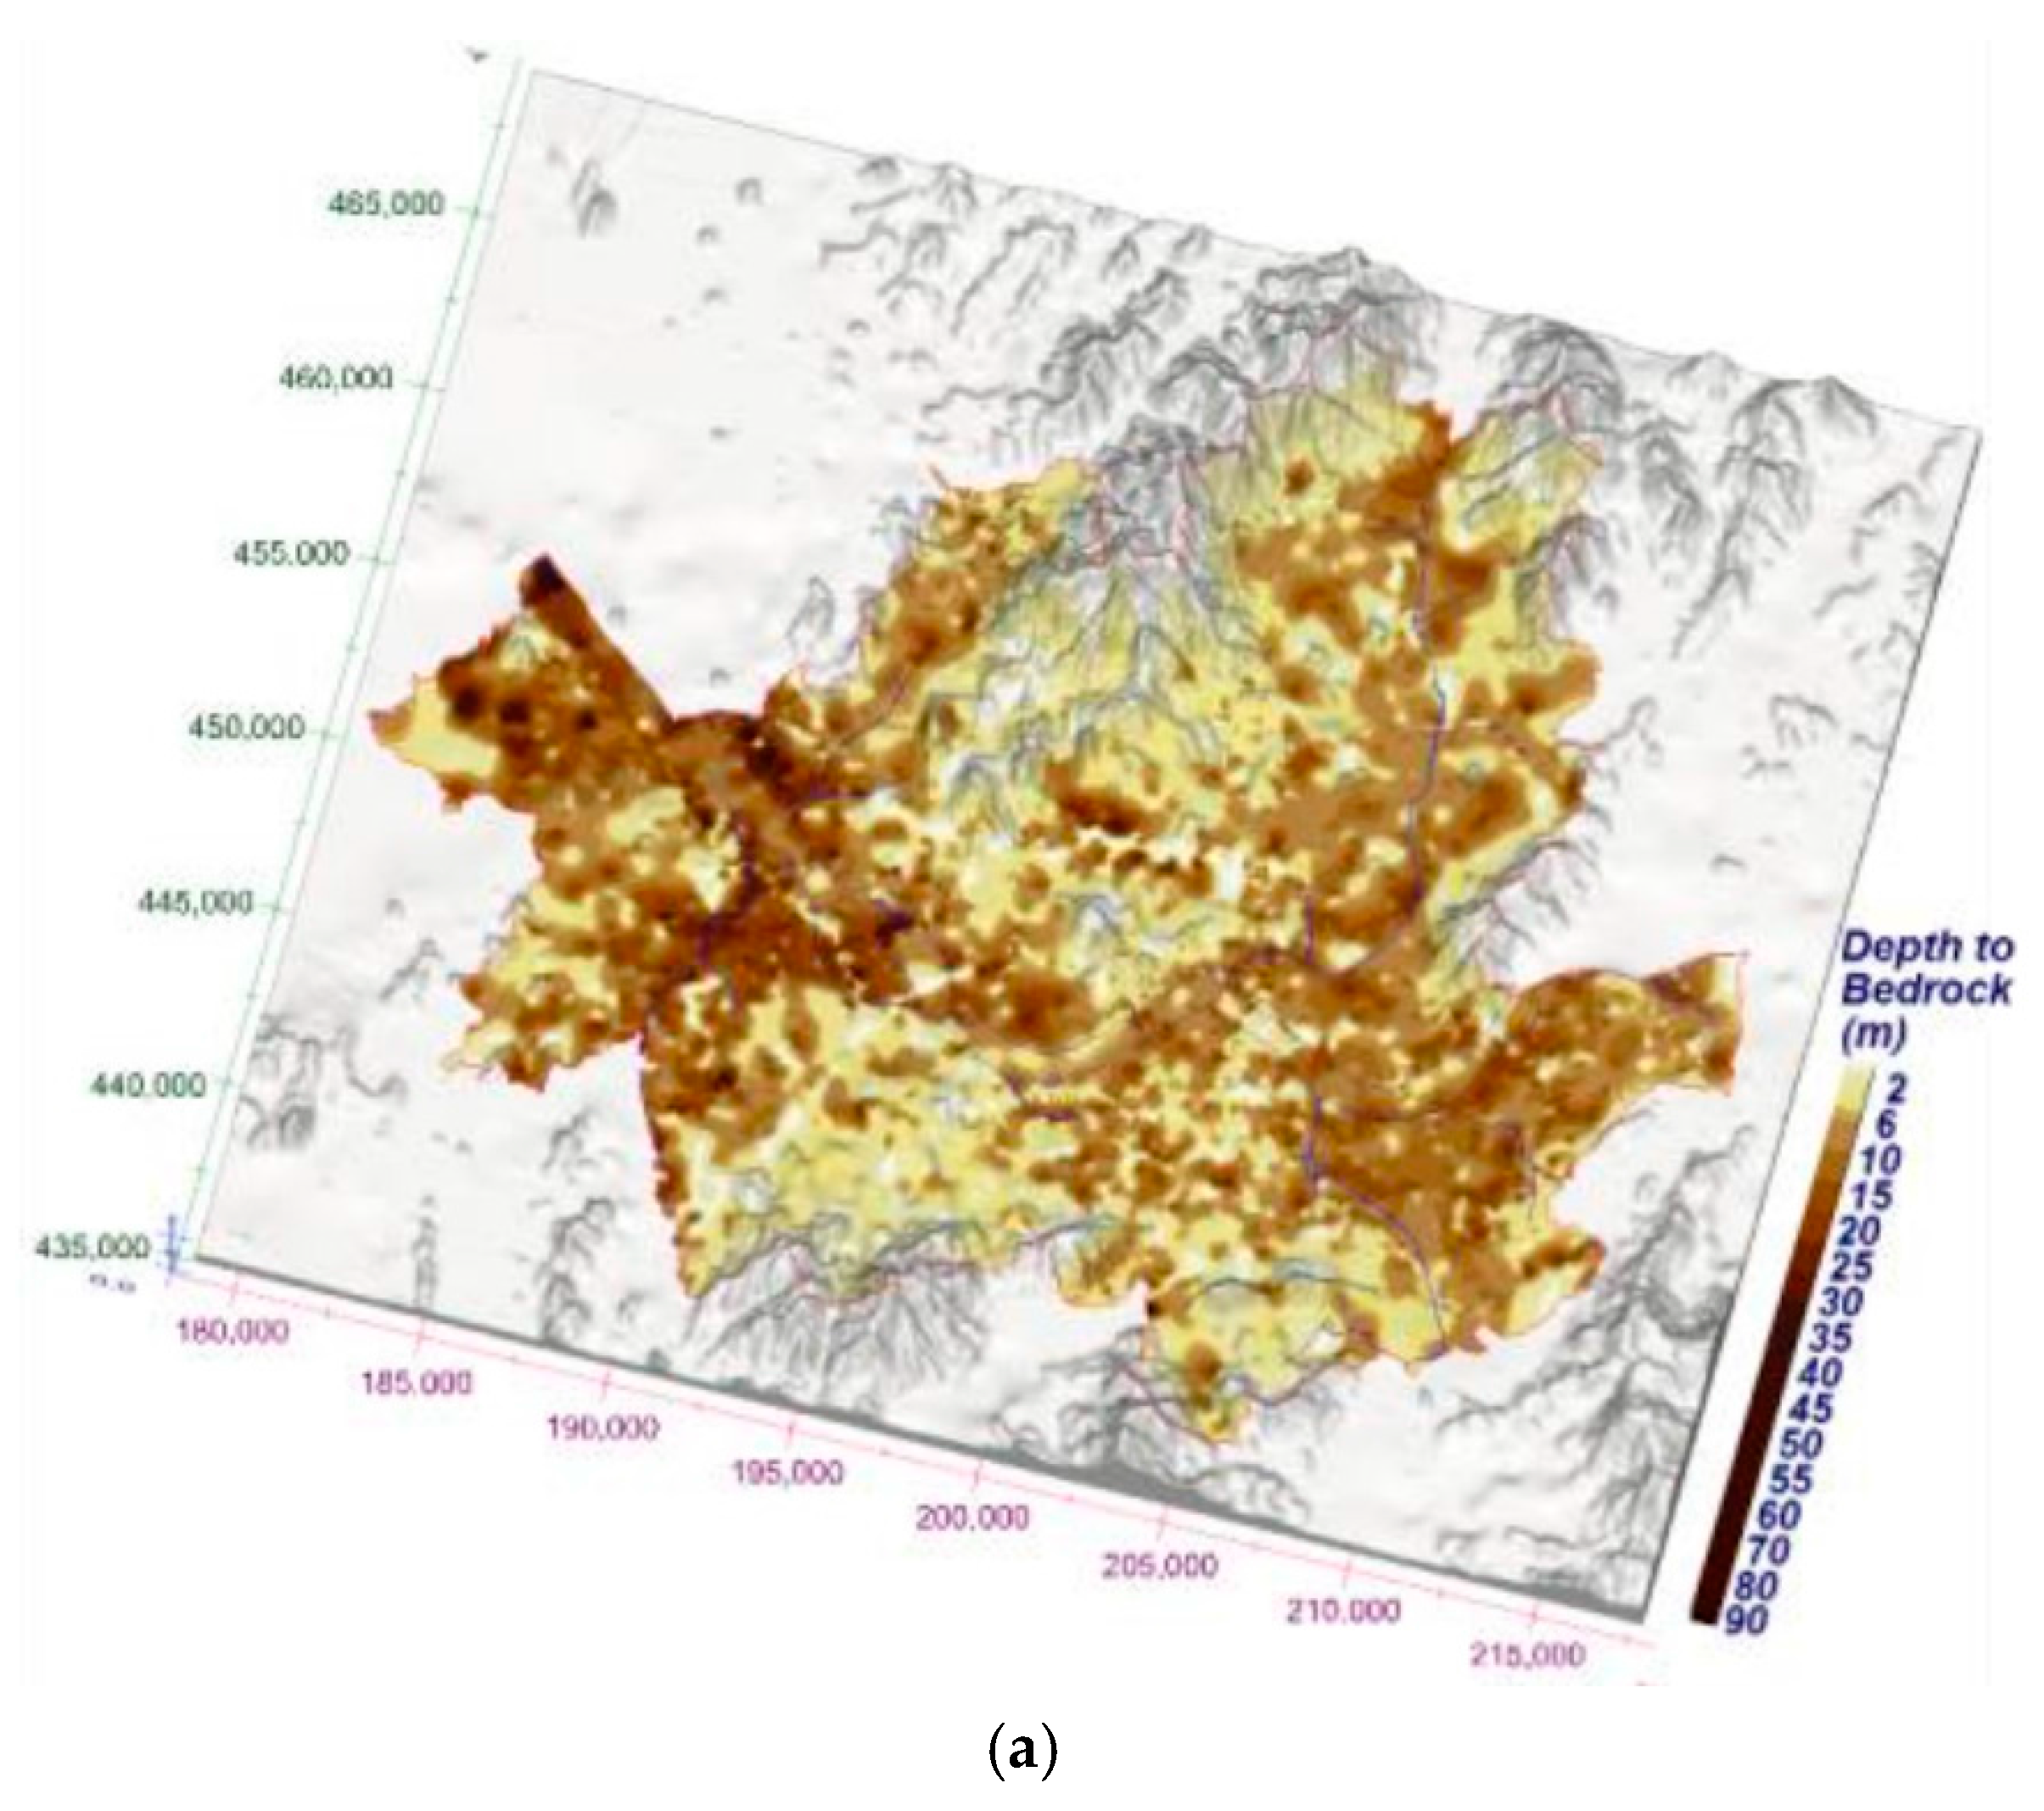
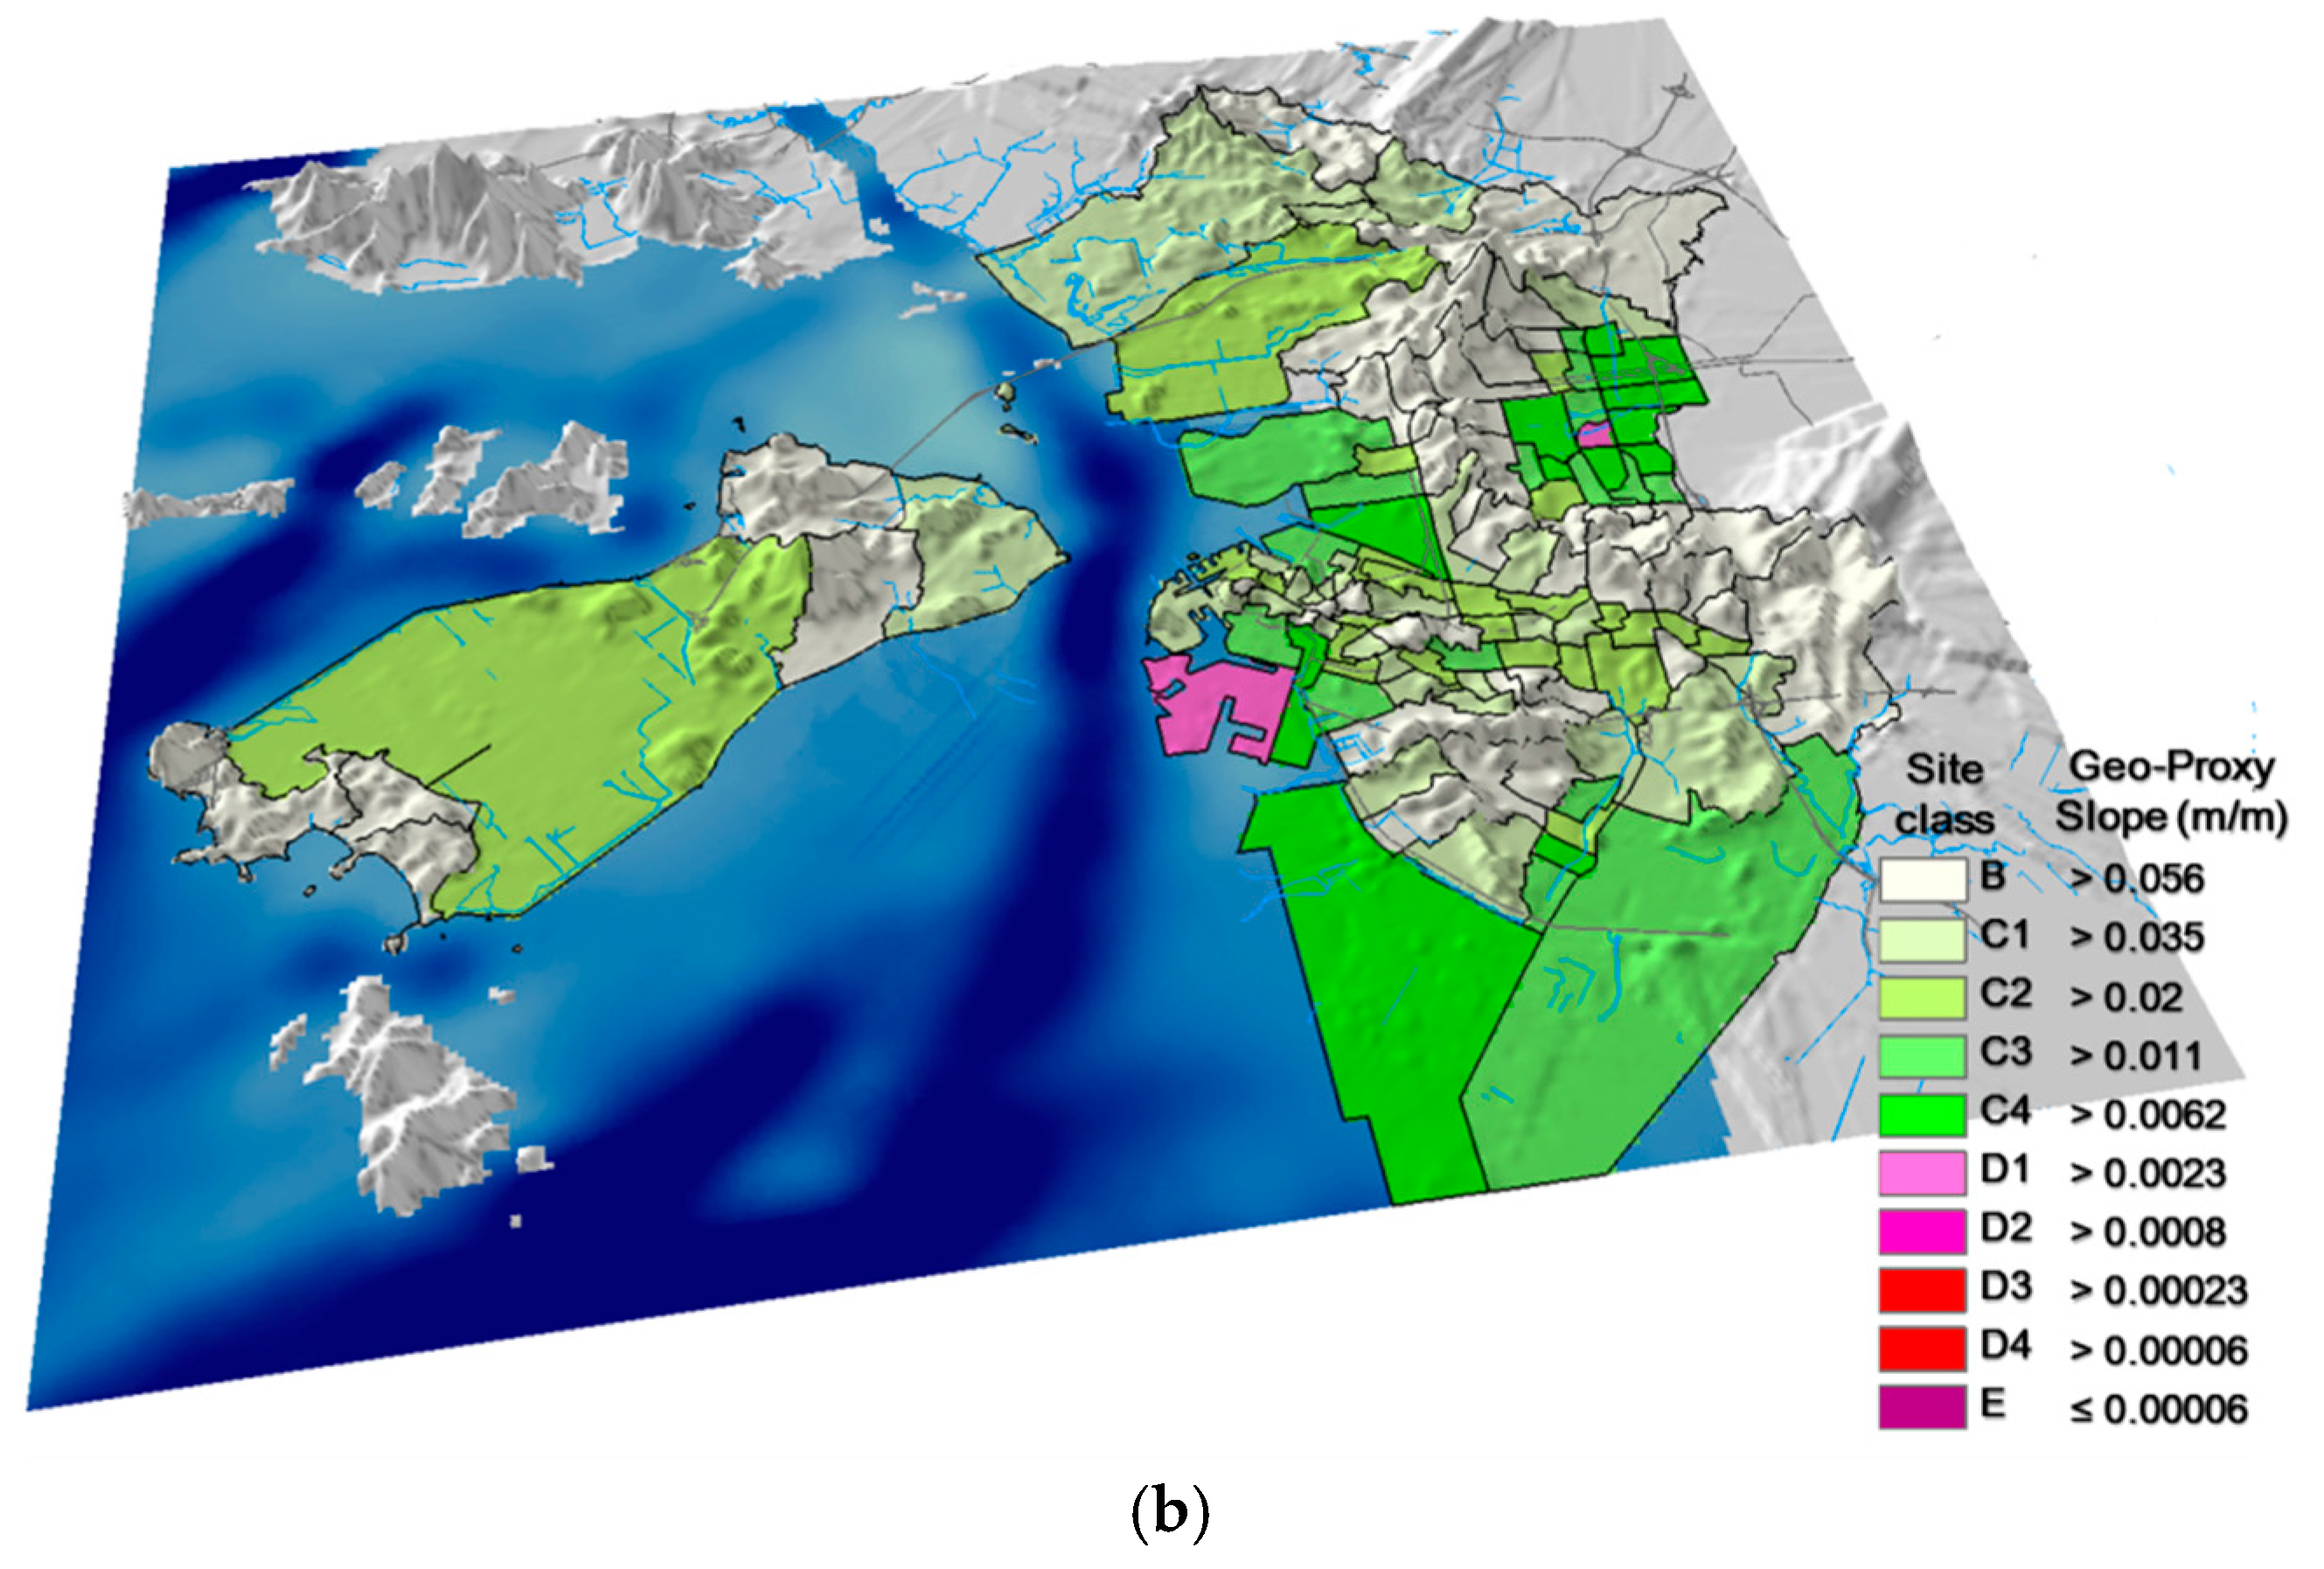
For Seoul, site response characteristics were evaluated and presented as spatial information based on the geotechnical DB [23]. Figure 3 shows bedrock depth (H), spatial distribution of site period (TG) and site classification information according to the site period as major site response parameters presented as fundamental information to be used for seismic strategies of Seoul. Bedrock depth was generally shallow in mountains and hills and site period was therefore evaluated to be low. As a result, the site classification B, in which ground motion amplification does not occur, was dominant. On the other hand, plain land adjacent to the Han River and its tributaries was found to have site classifications C and D with large ground motion amplification. In particular, some water-joining regions and large-scale landfill regions of the western part of Seoul, which corresponds to the lower part of the Han River, were identified as site classification E with the largest site amplification. Such spatial information was predicted and constructed at a grid square interval of 100 m × 100 m in the Seoul administrative area [18]. This study aimed to derive an efficient region-specific site classification technique by calculating the site response parameters for the geo-spatial grid in Seoul and identifying the correlations between these parameters.
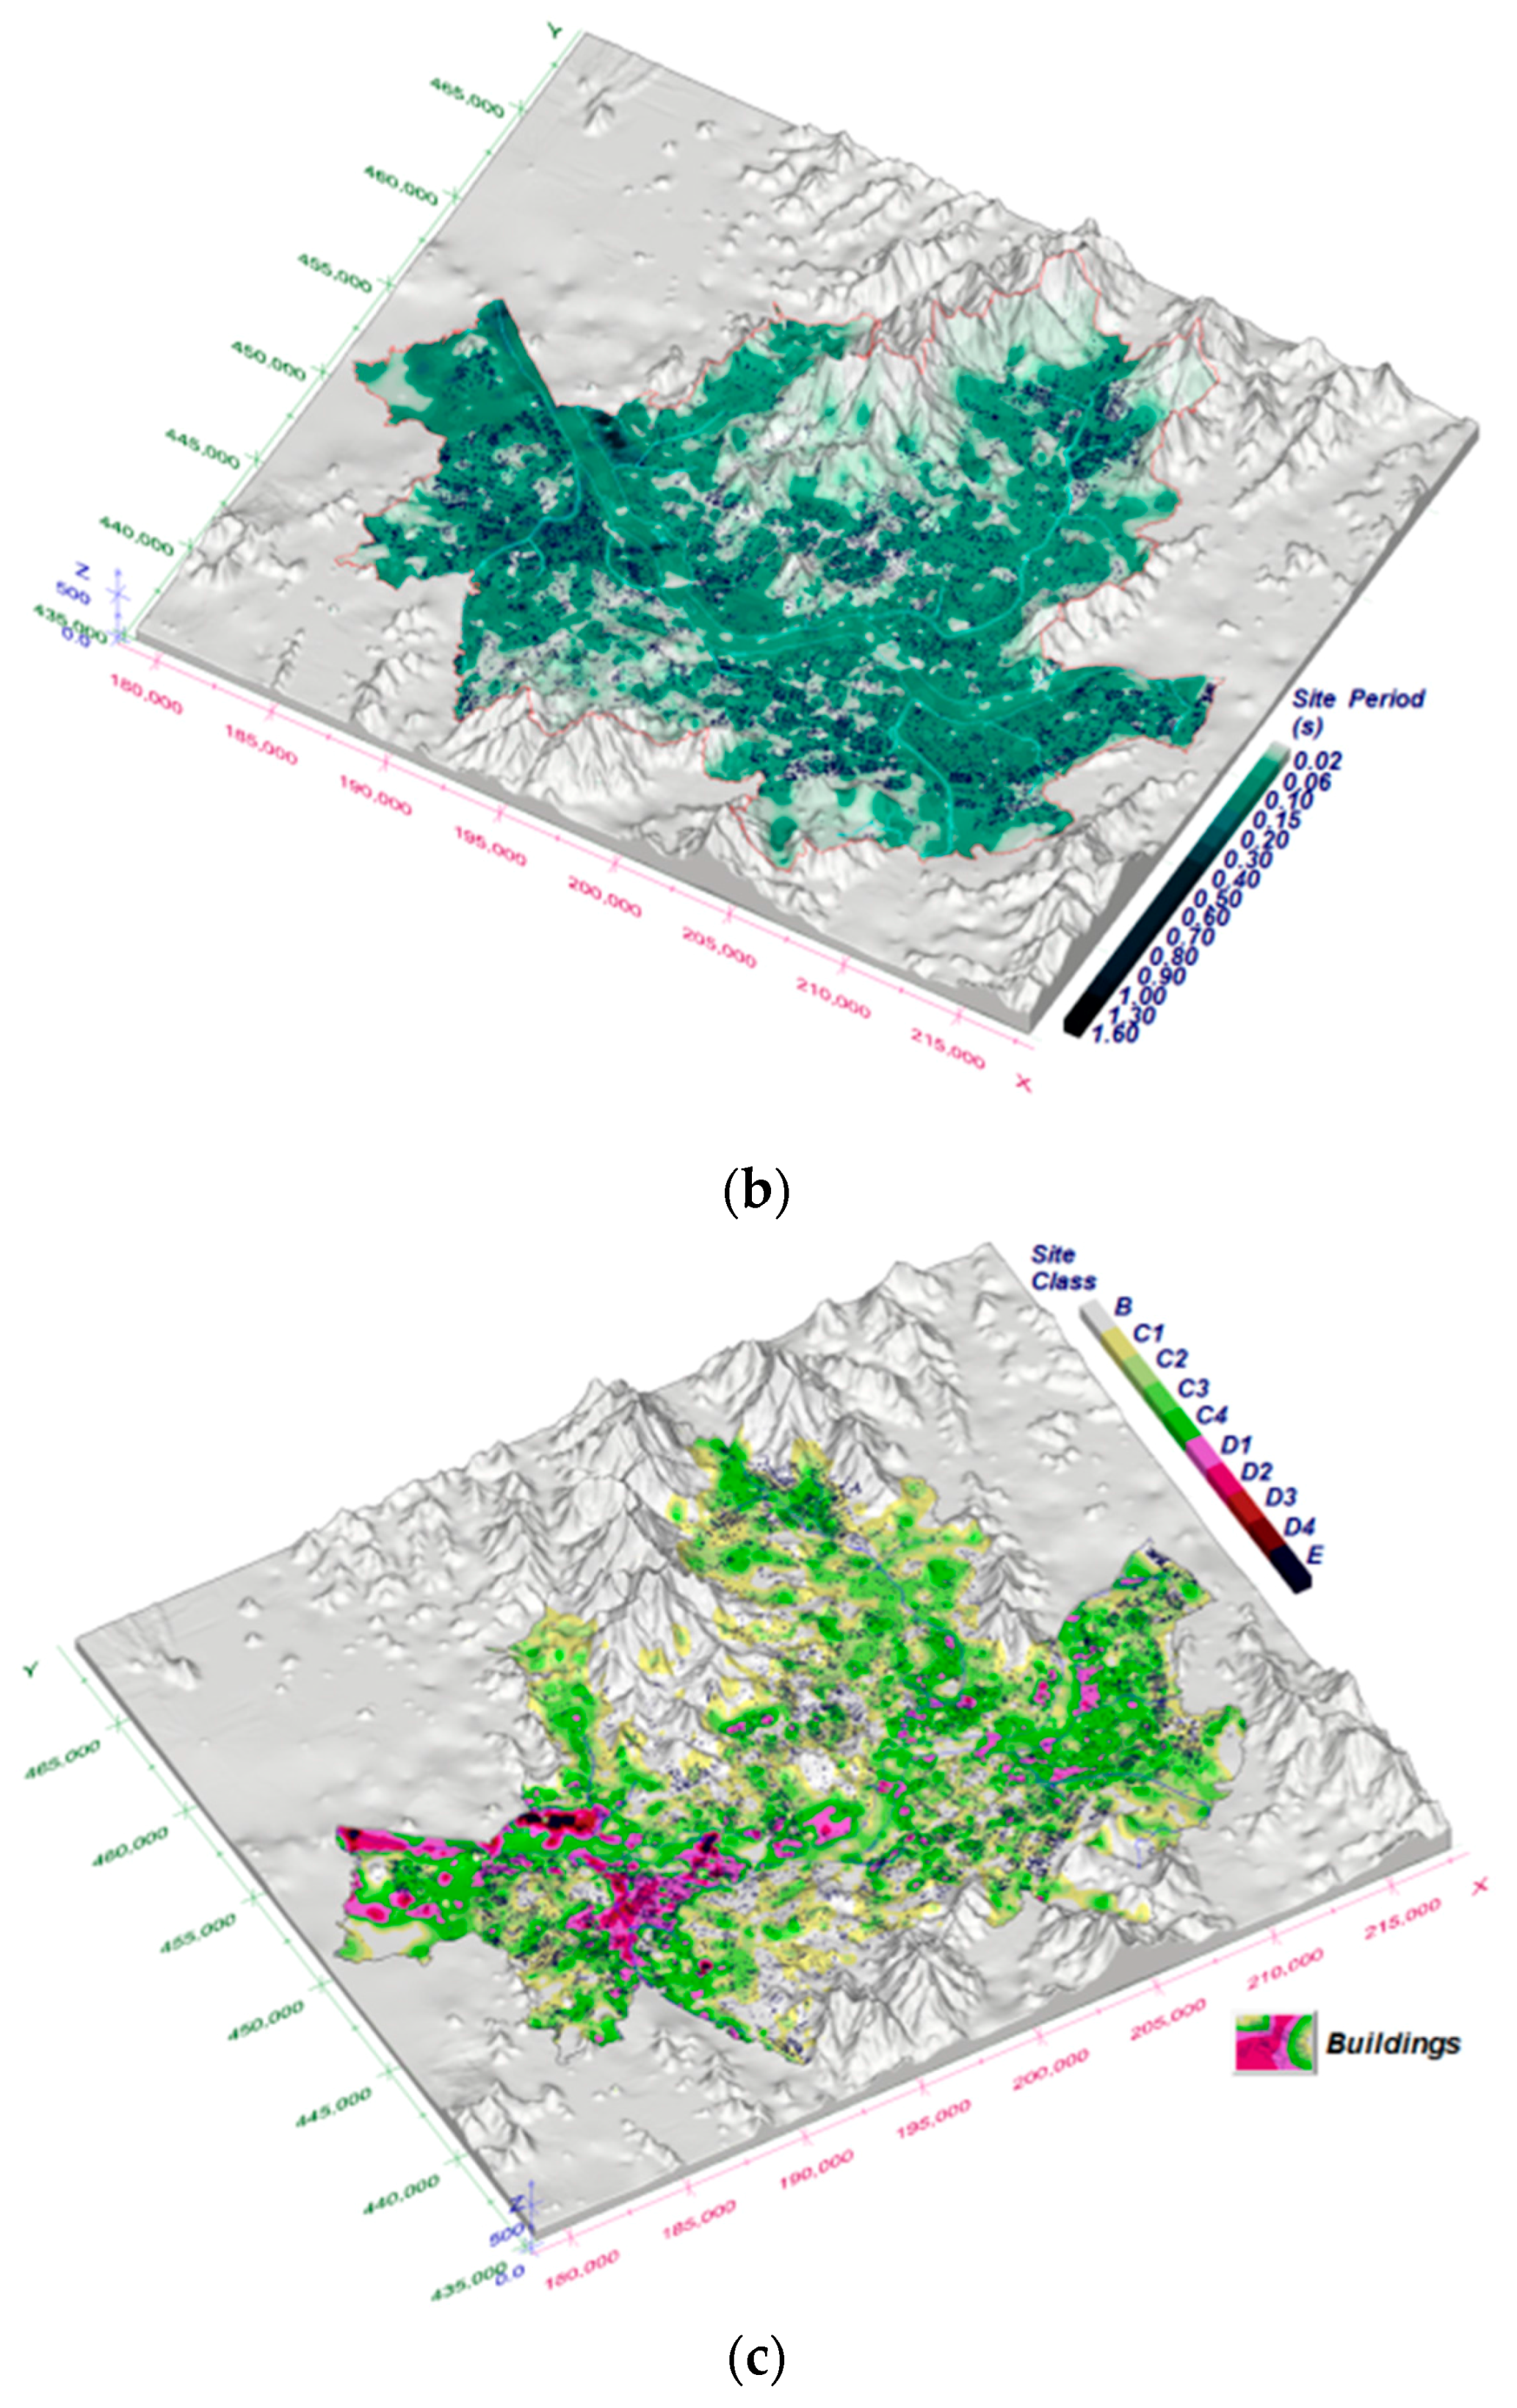
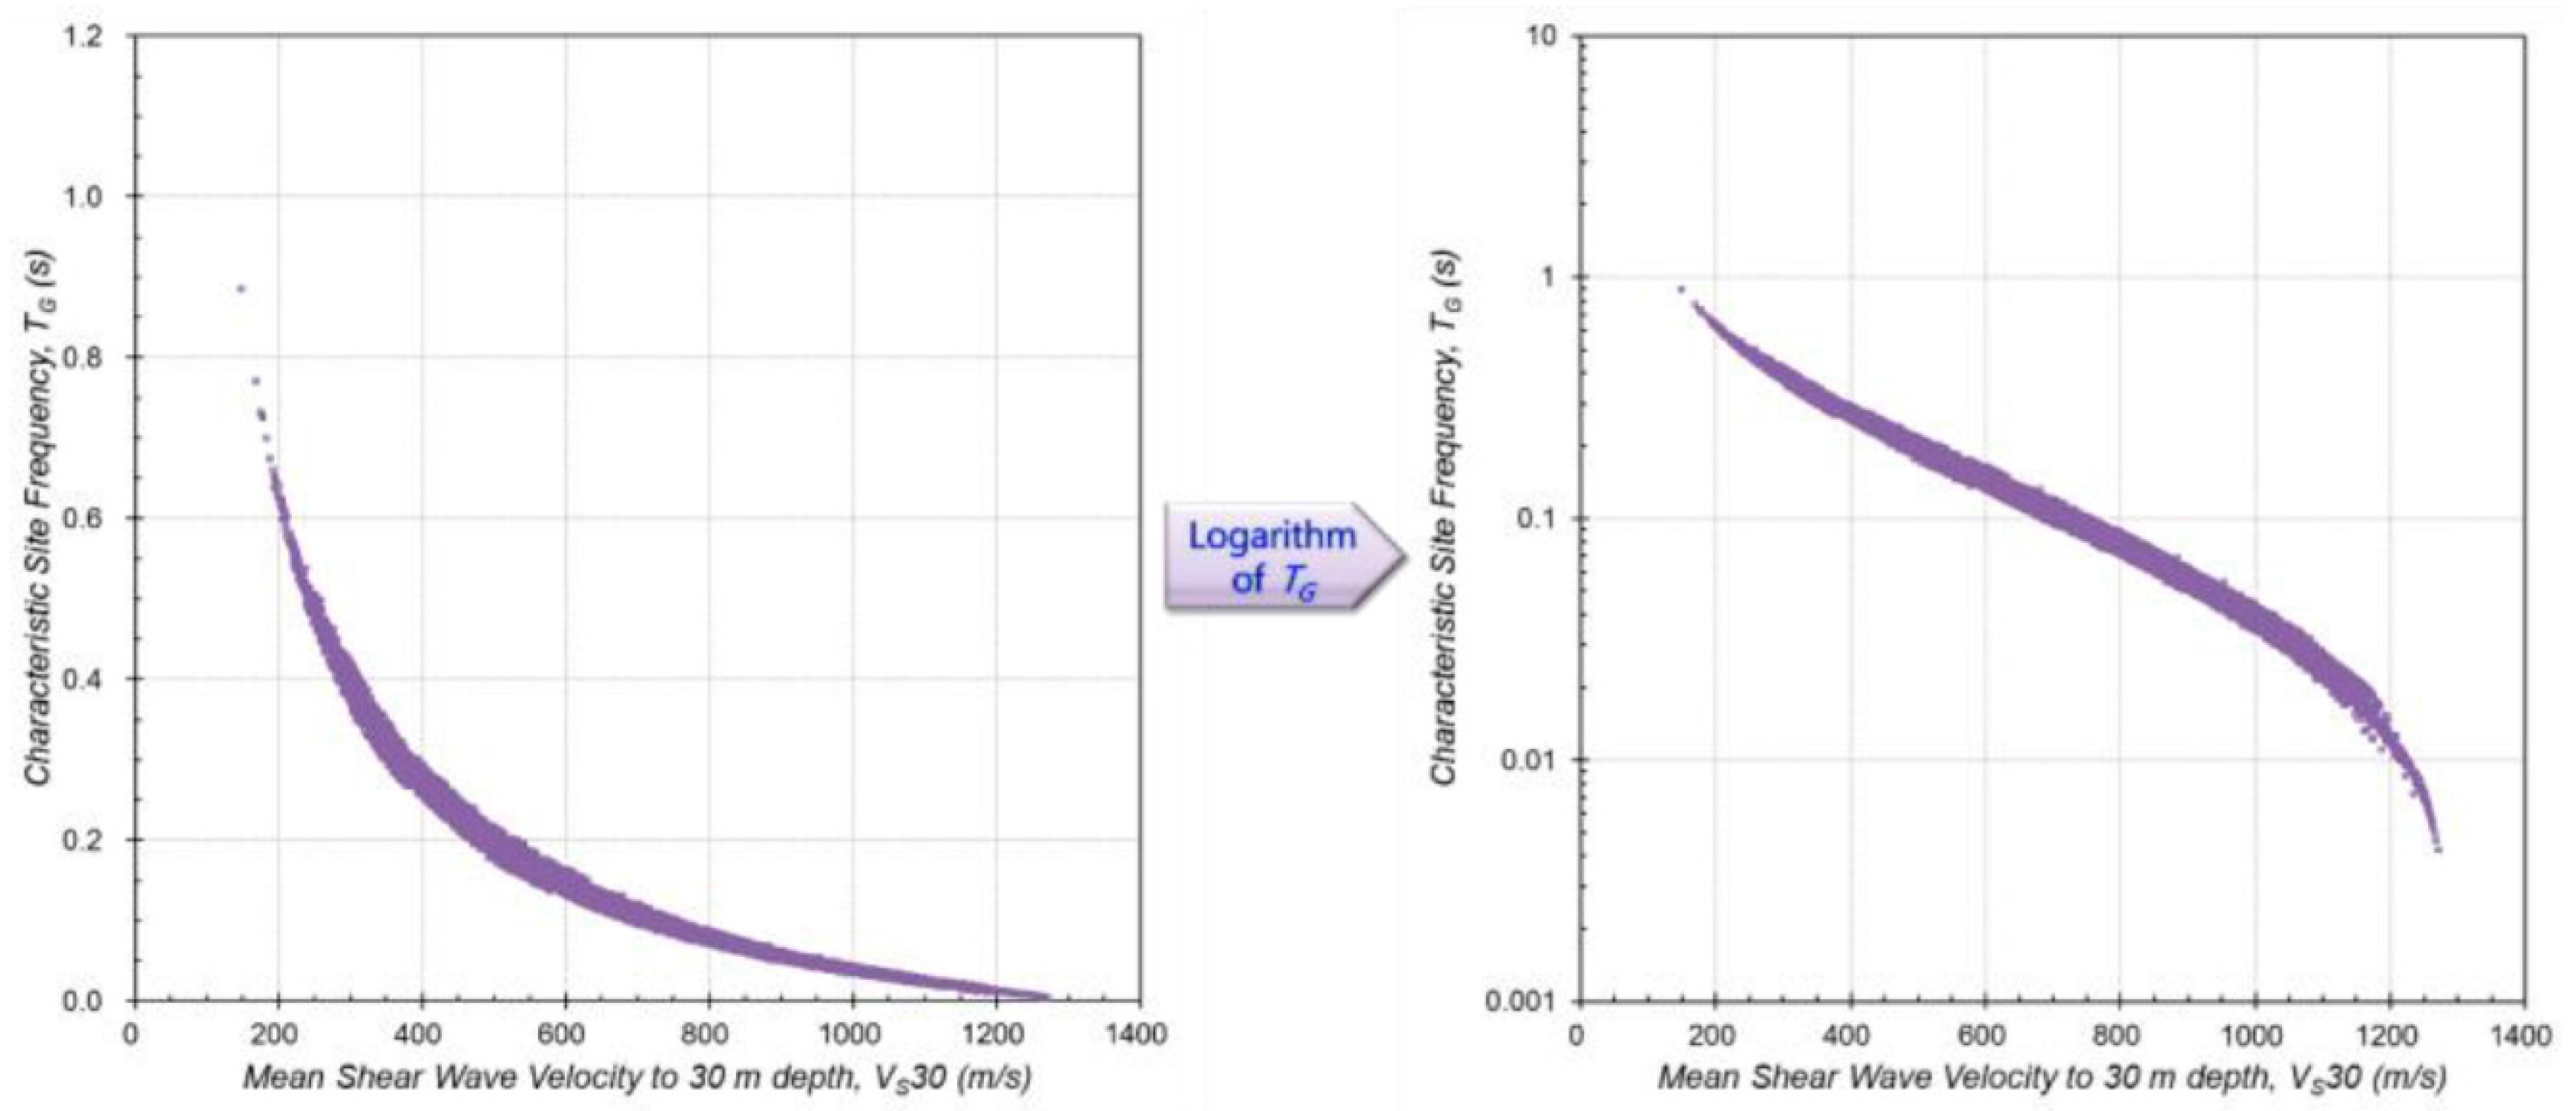
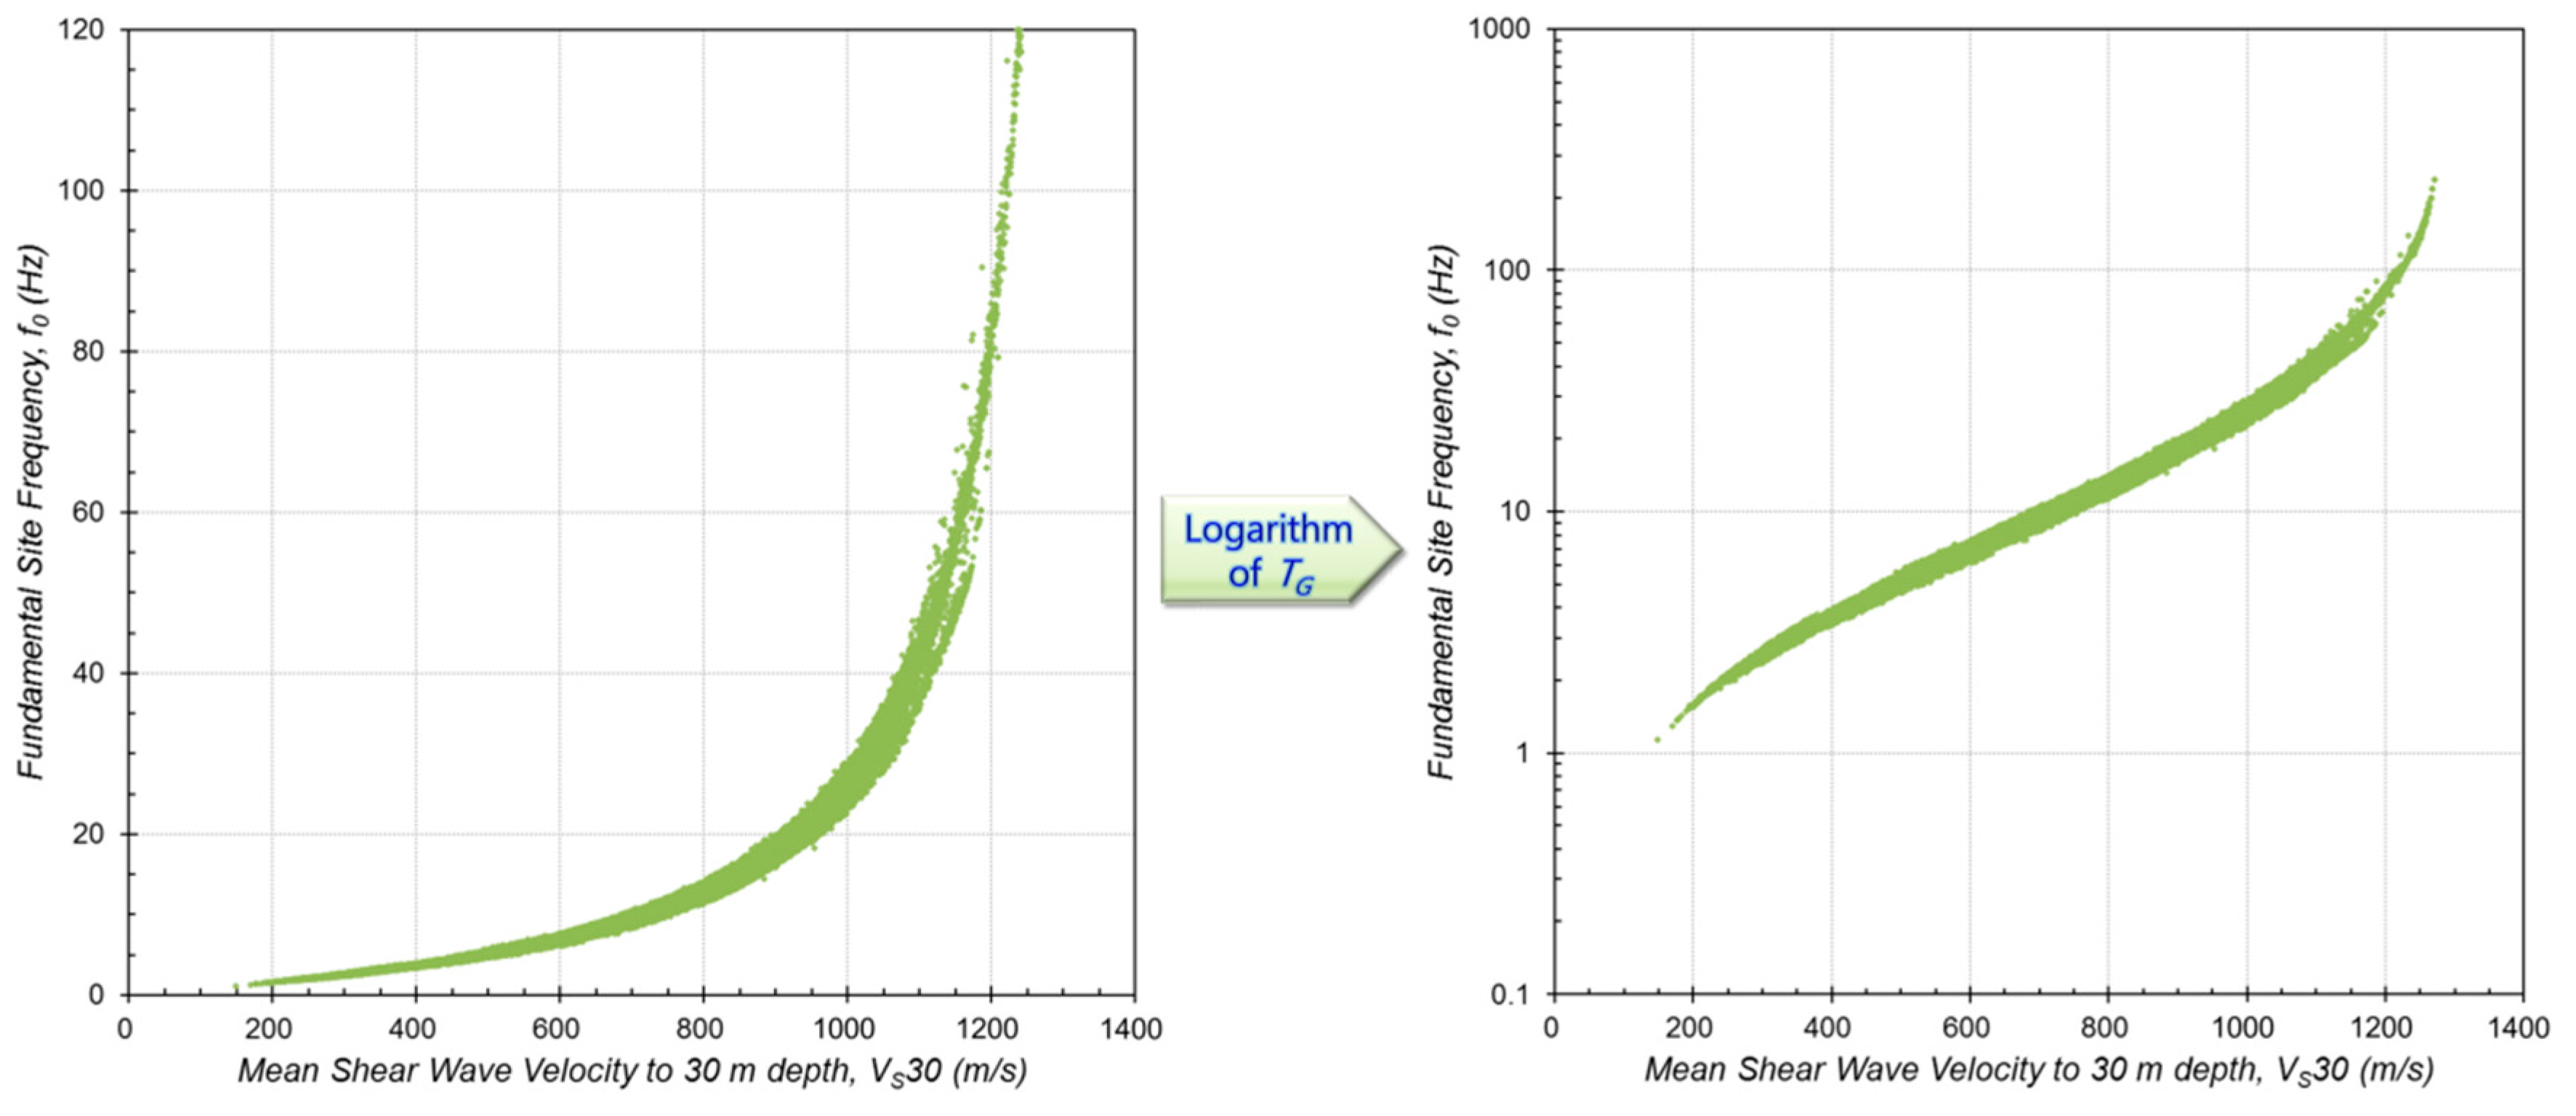
The interdependent tendencies and correlations between site response parameters related to site effects were compared and analyzed. Among such correlations, the relationship between VS30 and TG or fundamental frequency (f0), which corresponded to unified reference parameters of the site classification system, was quantitatively analyzed and preliminary analysis for developing a site-specific empirical site classification technique was conducted. Figure 4 is a comparative correlation to determine the relationship between TG and VS30. In addition, Figure 5 shows the relationship between f0, which has a reciprocal relationship with the site period and VS30. A relationship between the two parameters was confirmed, as could be derived from the relationship between TG and the site period. Therefore, an empirical method for an efficient site classification system based on the site period (or fundamental frequency), which can reasonably represent the site-specific geotechnical characteristics of South Korea, was derived.
3.3. Framework for Site Classifaction Based on Geo-Proxy in South Korea
The geo-proxy-based empirical site classification system was derived from Seoul, South Korea. Seoul includes various geographical features, such as mountains, hills, plains and landfills, as well as geological features, such as various types of bedrock surface geology and alluvium. Considering the representative and inclusive nature of Seoul, the geo-proxy-based site classification system proposed in this study is considered to be sufficiently applicable to the whole of South Korea. In this study, the slope and elevation information of the surface terrain, which may correspond to the major terrain factors related to the geotechnical characteristics, were firstly regarded as topographical indicators and defined as geo-proxies. Studies that evaluate regional seismic response and derive information using proxies from a terrain or geological perspective have been mainly conducted for overseas regions with strong earthquakes [15,17,28,29,30]. In South Korea, such studies have been conducted at an extremely limited level [31,32] and approaches with verification based on a comprehensive geotechnical DB have not been performed. Table 3 is an empirical site classification system derived by setting VS30 and the terrain slope as proxies for overseas sites [15]. According to the tectonic characteristics, the target areas were classified into active tectonics, where tectonic activities such as earthquakes are active and stable continent regions inside the plate.
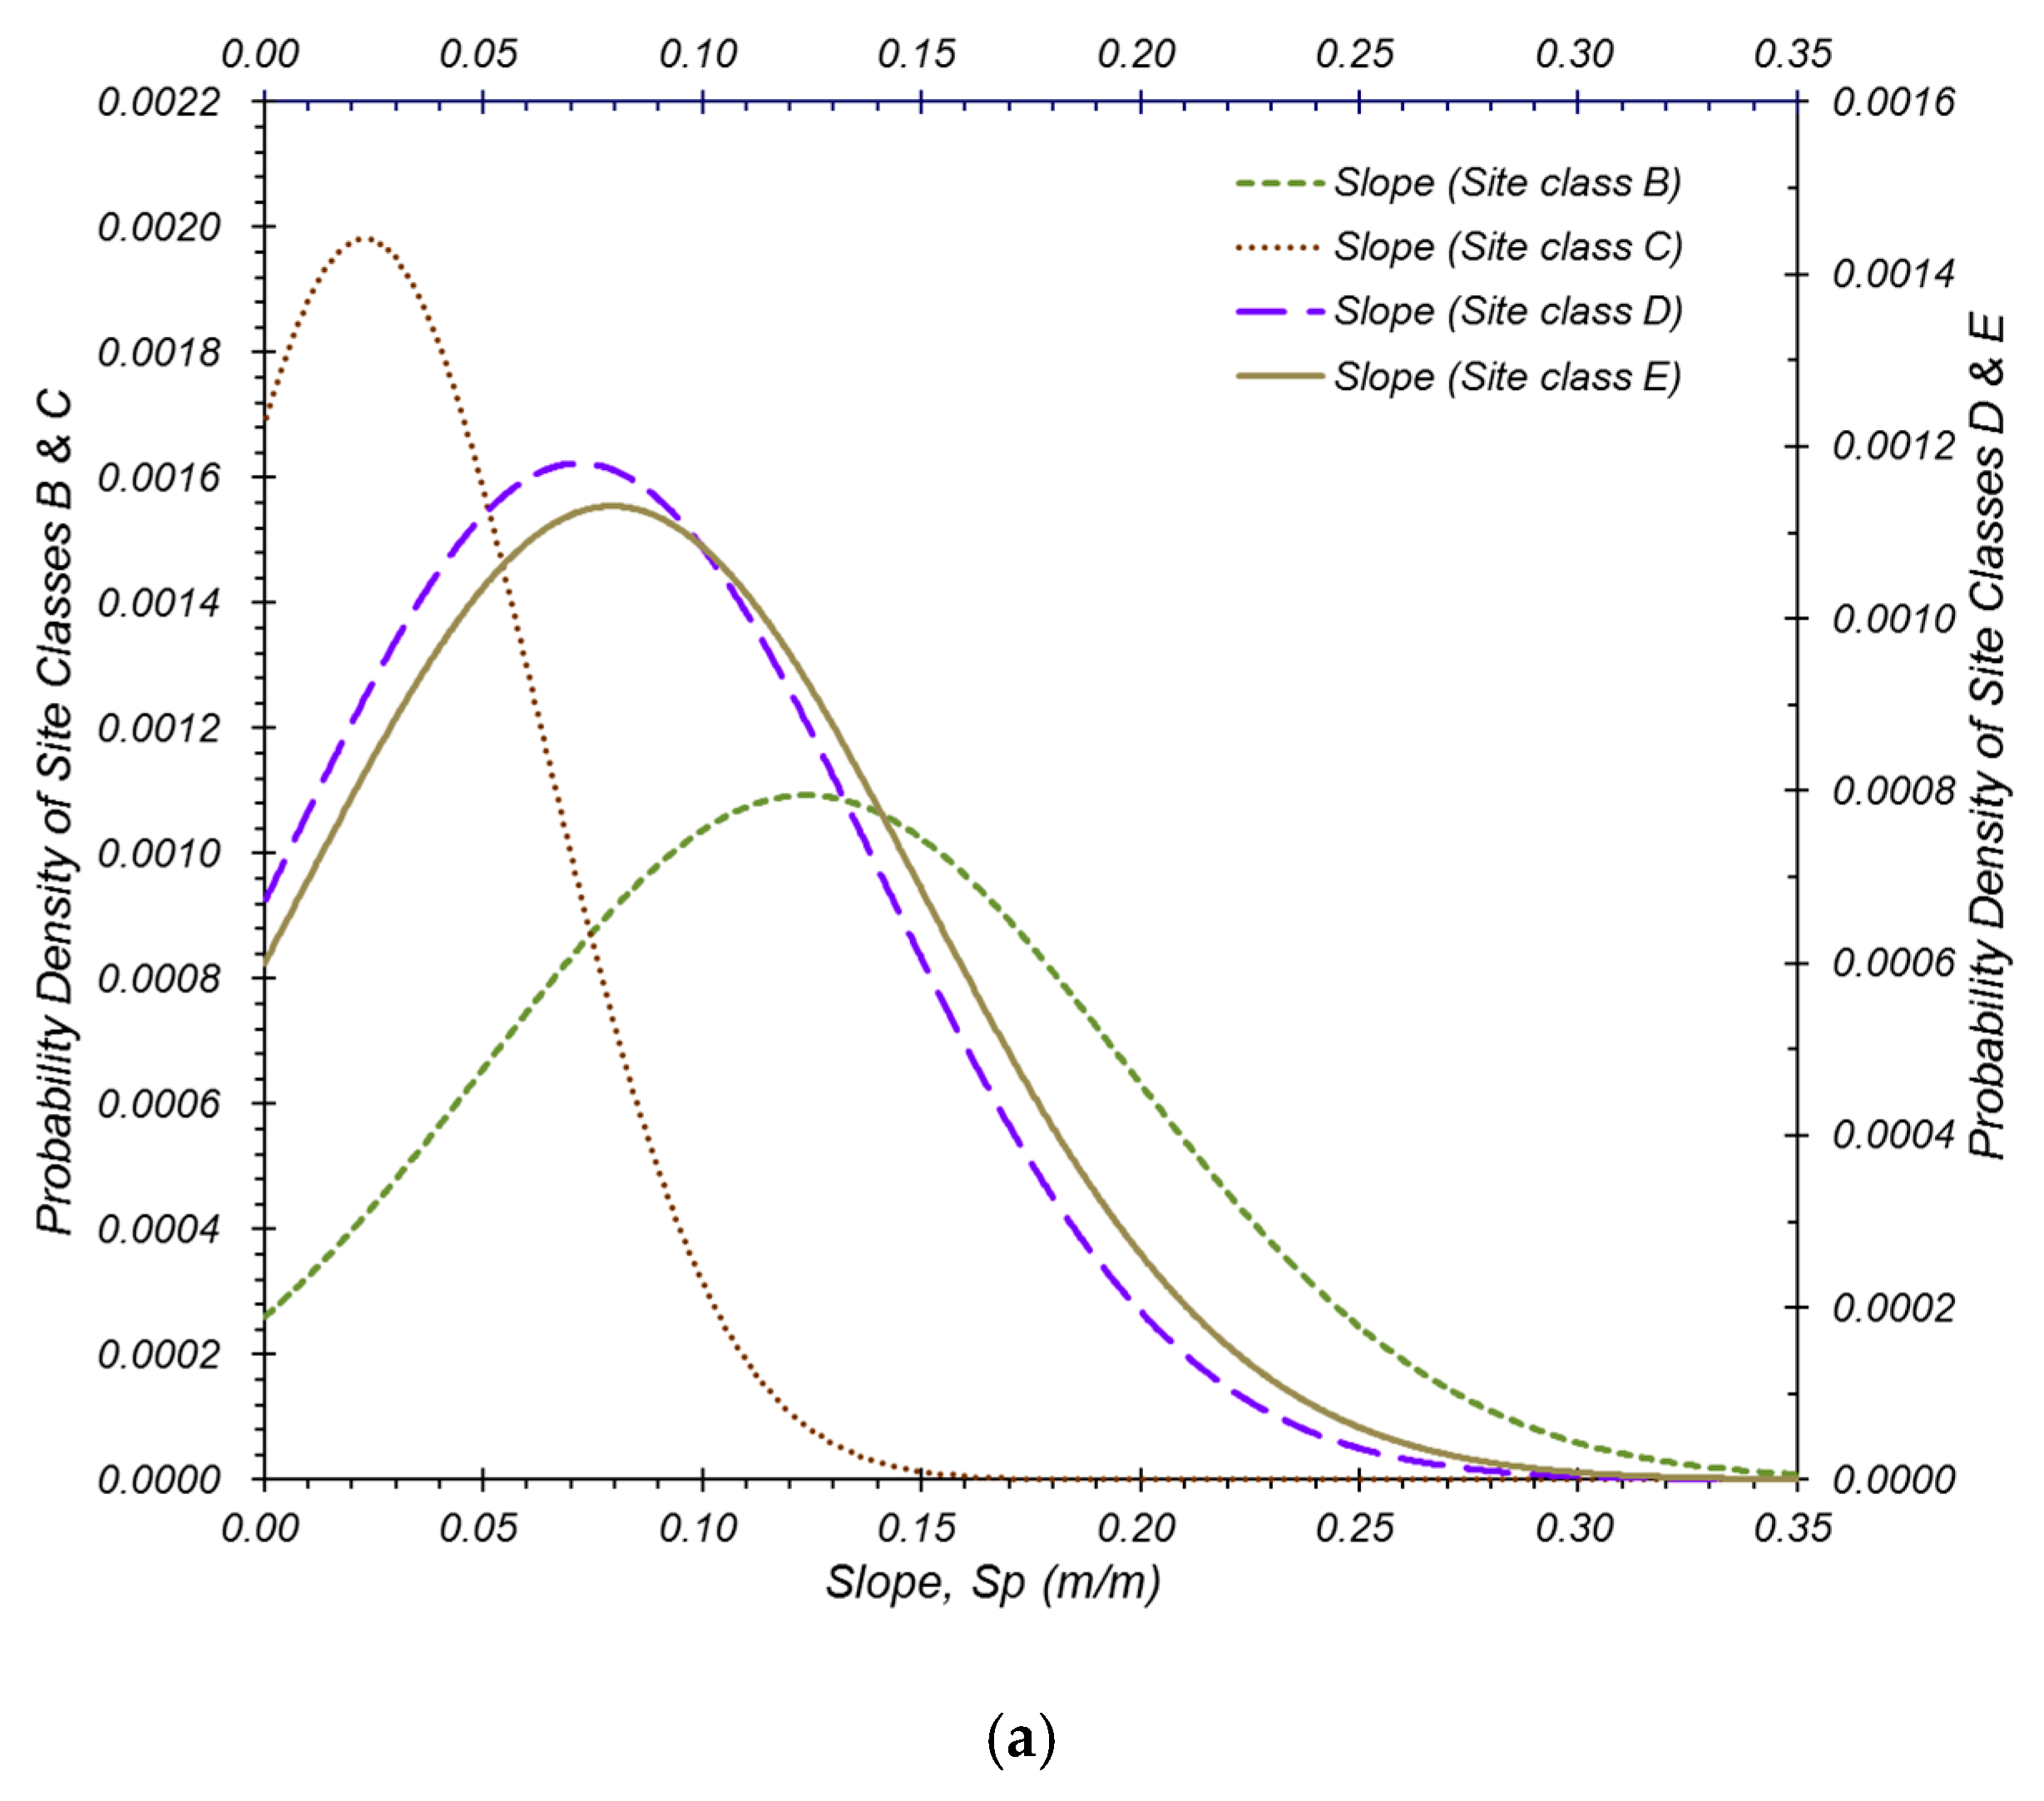
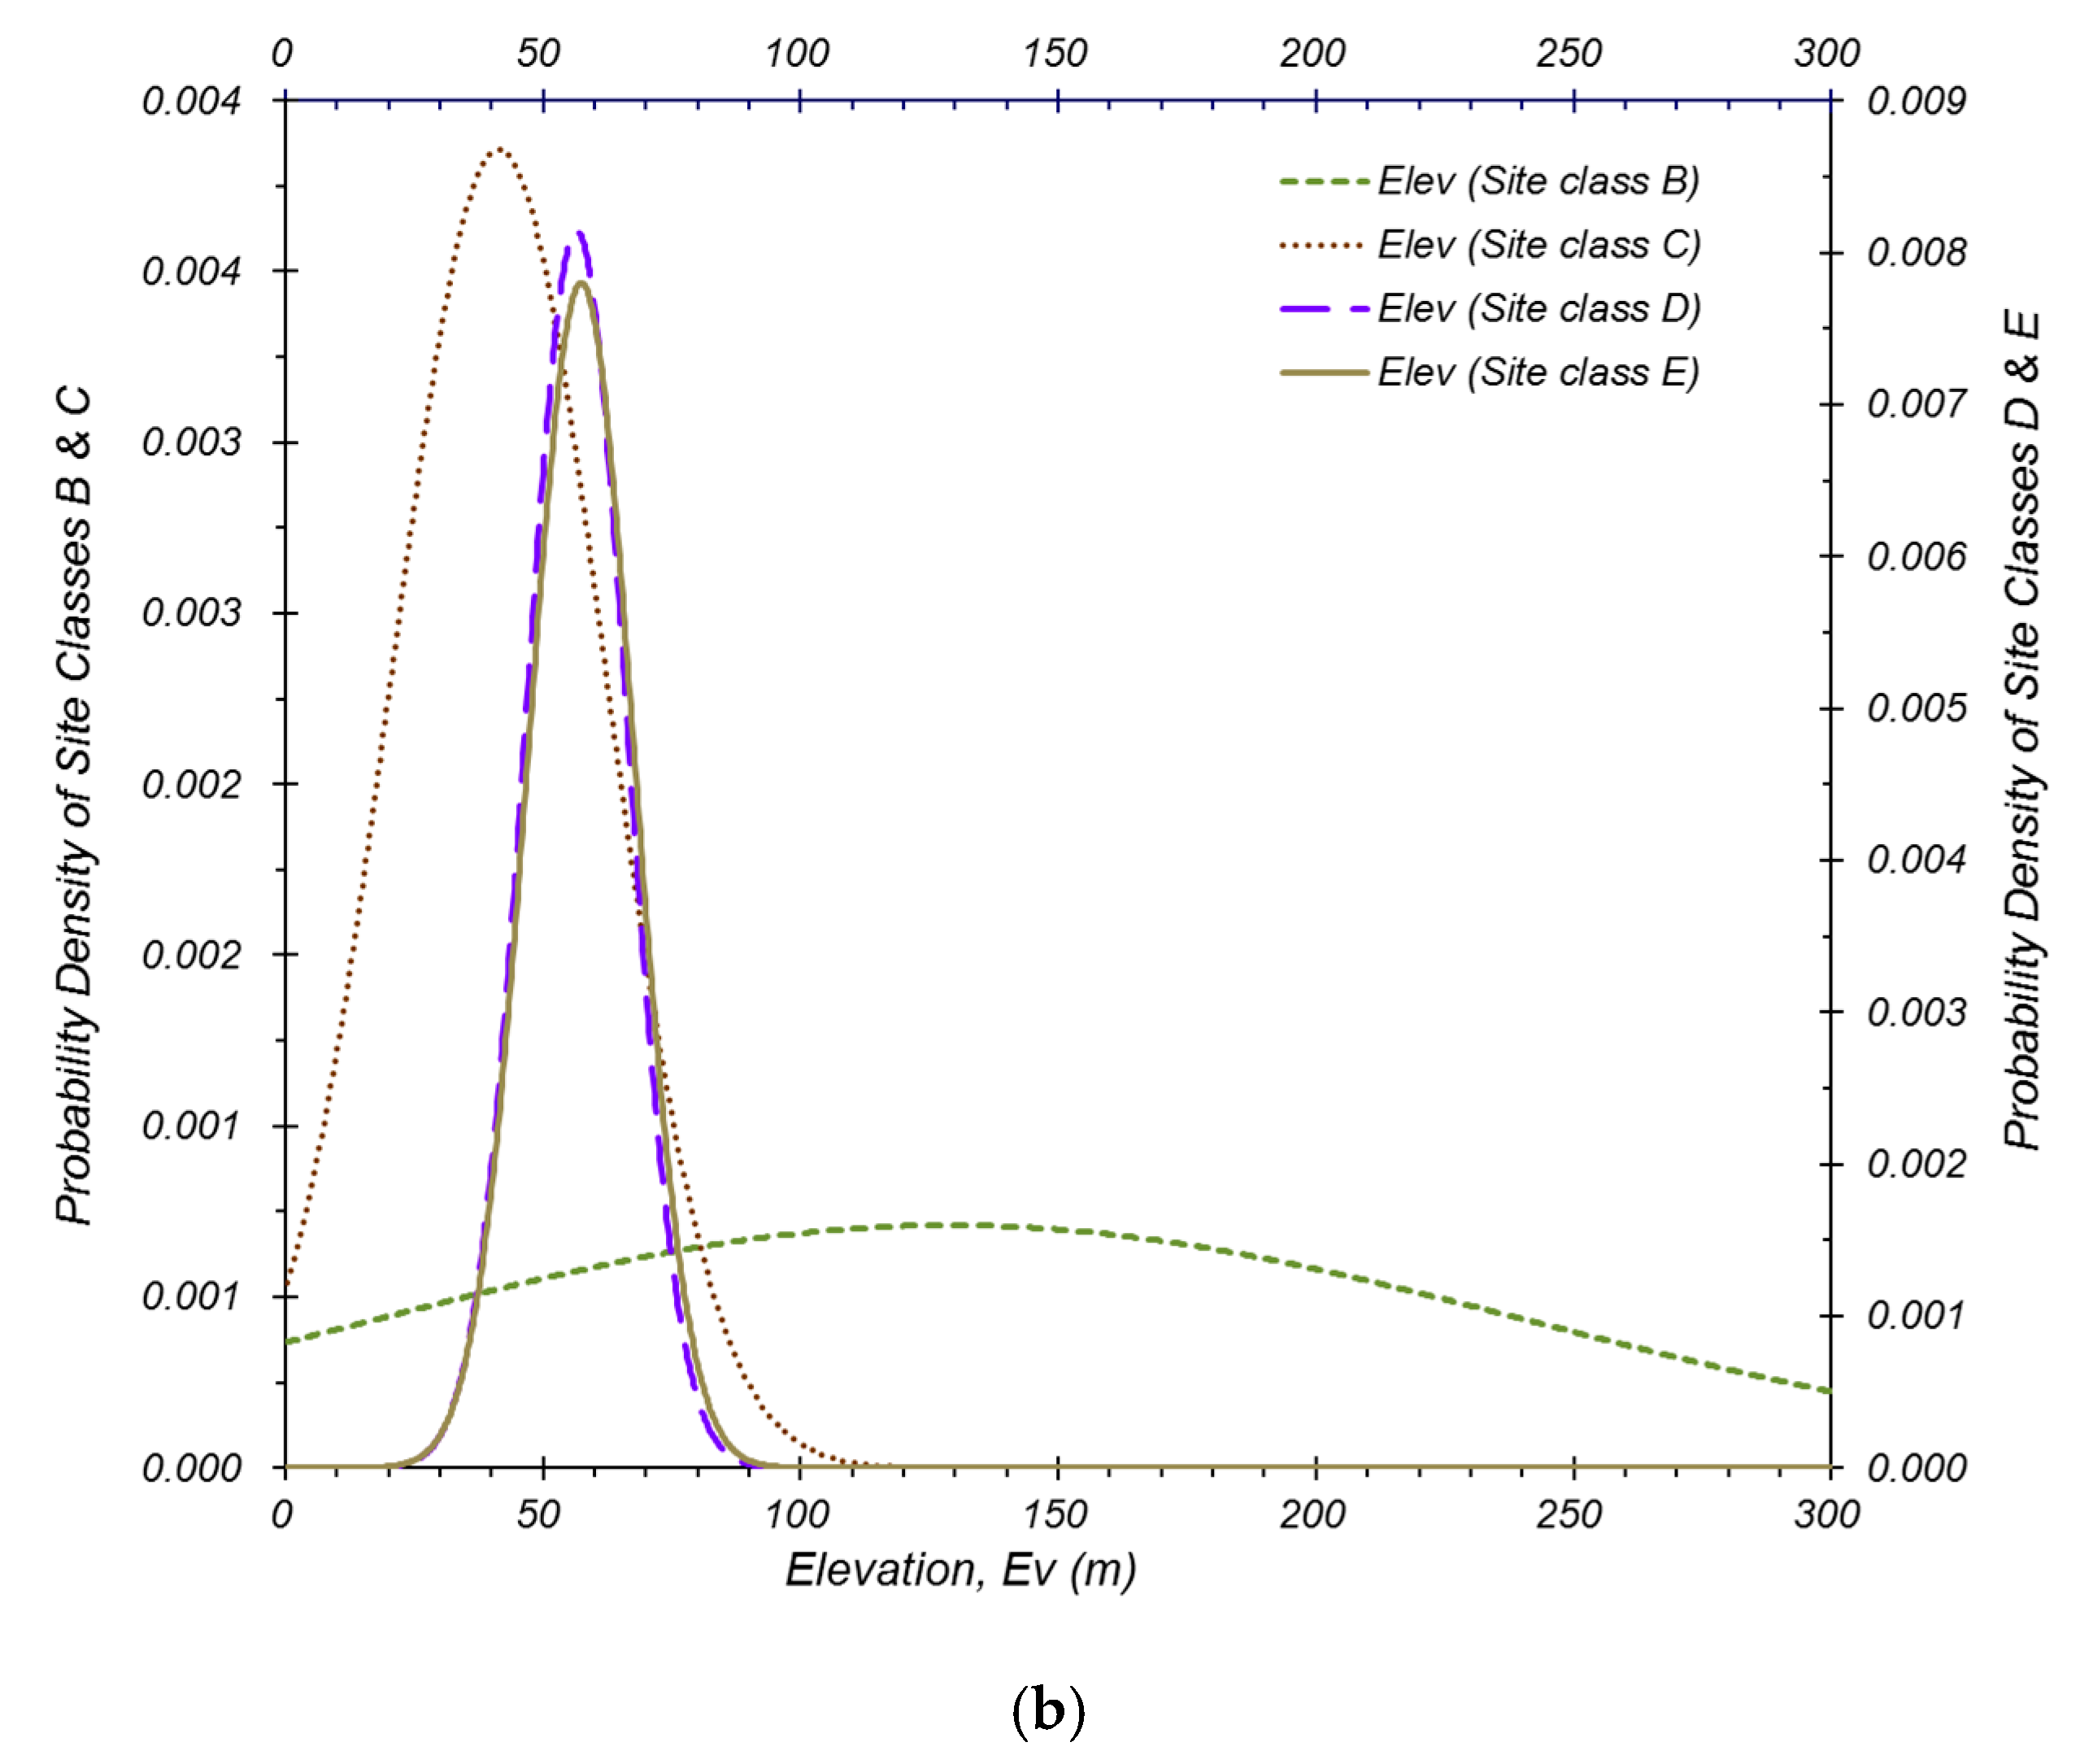
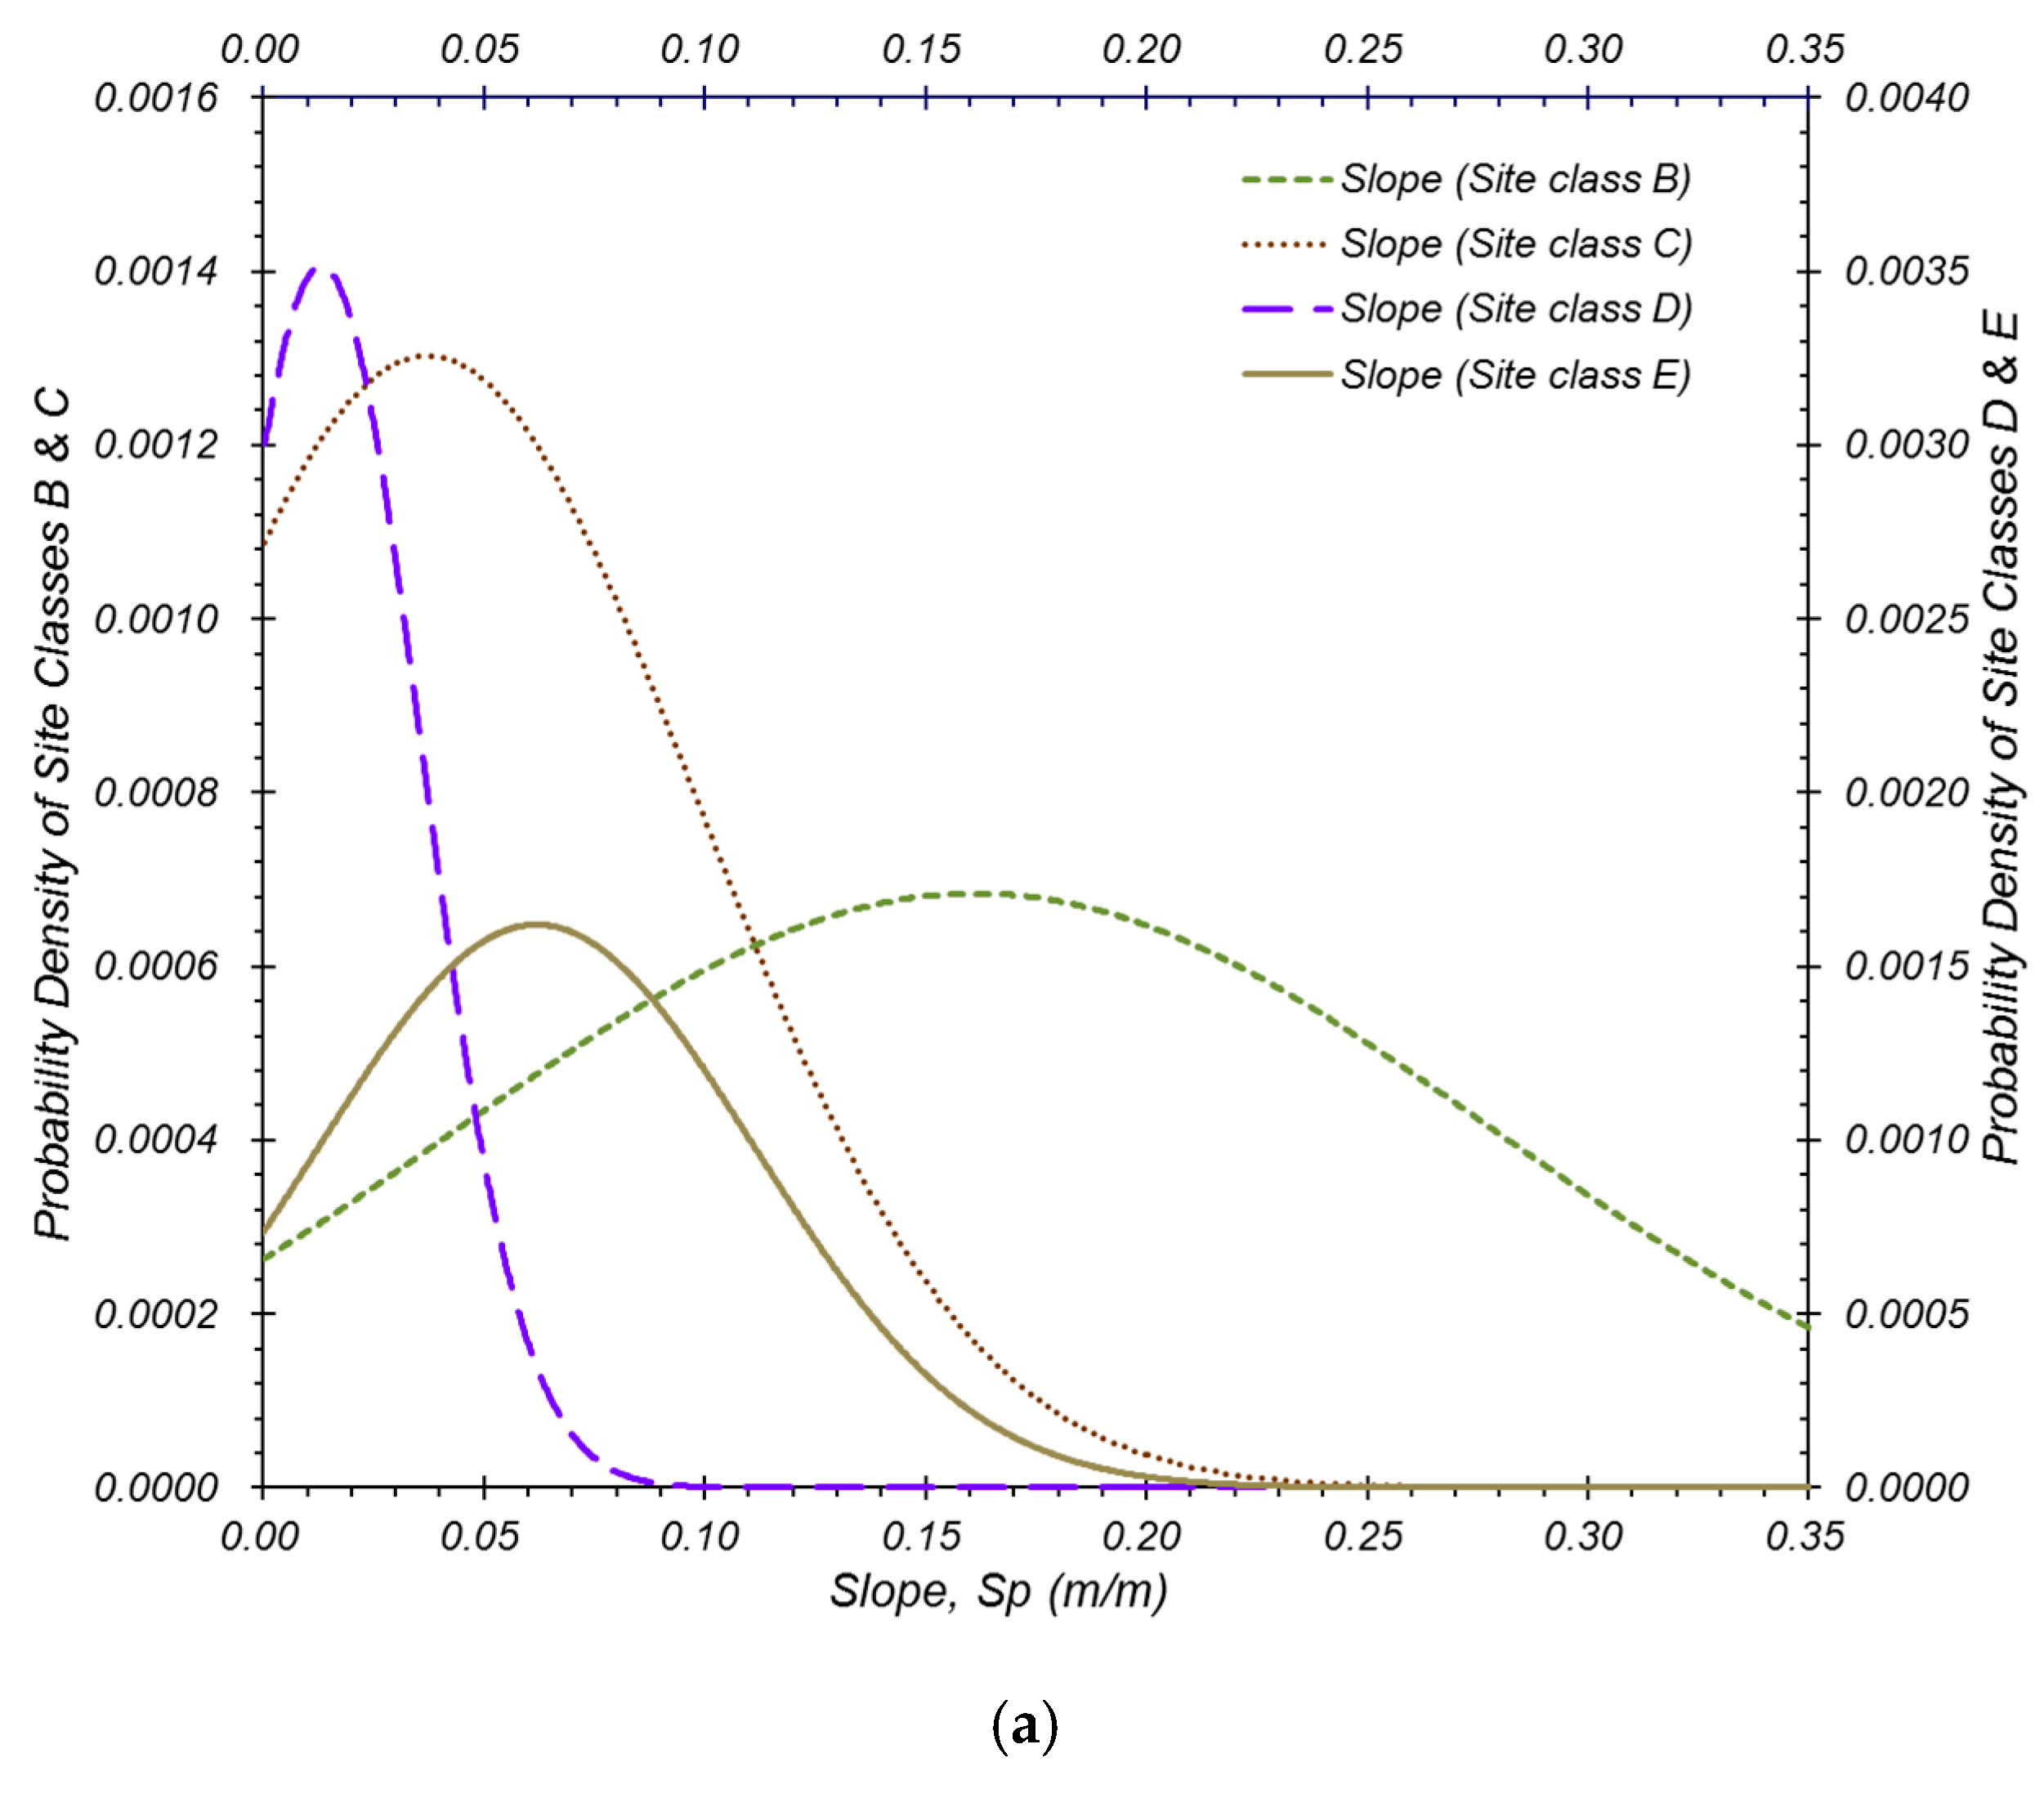
To establish a discriminative site classification system that considers differences in the regional, seismic and geotechnical characteristics, this study derived the surface terrain slope and elevation, which are geo-proxies. And the geo-proxy-based correlations for calculated geo-spatial grid locations in Seoul was utilized as statistical datasets based on site classification according to established site-specific seismic response. The terrain slope and elevation datasets derived for geo-spatial grid squares in Seoul with a 100 m interval were classified as B, C, D, or E according to the calculated site classification criteria (Table 1), i.e., VS30 and site period (TG) and their normal probability density functions were identified, as shown in Figure 6 and Figure 7.
In the division of each probabilistic site classification that can be identified from Figure 6 and Figure 7, the site period (TG) was better than VS30. The tendency for such a relative classification possibility is particularly pronounced in site classifications C and D. This is because the site conditions are concentrated at approximately 360 m/s, which is the criterion of VS30 for site classifications C and D in South Korea. This probabilistic tendency of the site class with VS30 has been suggested by Sun et al. [32] based on the geotechnical DB of major inland sites in South Korea. For this reason, this study aimed to develop a geo-proxy-based site classification system based on a site classification system according to site period, which can more accurately reflect the geotechnical characteristics in South Korea, instead of the conventional classification criteria VS30. Additionally, the fundamental frequency (f0), which corresponds to the reciprocal of the site period, was introduced instead of the site period to match the increasing and decreasing tendency of VS30 for each site class.
Figure 8 visually classifies the slope and elevation as geo-proxies by applying the site classification system according to the existing site period (Table 3) to the locations of the surface distribution grid in Seoul (225,835 grid squares). For the site classifications C and D, the hierarchical classification method was applied instead of the subdivision classification method, to cross-validate the proposed system for proxy-based site classification with conventional proxy-based criteria. By reciprocity, based on this classification, three sub-categories were applied to the site classifications C and D to correspond to the terrain-slope-proxy-based empirical site classification system in the stable continent regions inside the plate proposed in the overseas study [15]. And the terrain slope and elevation, which are dual geo-proxies in Seoul, were divided based on the empirical preliminary classification (Figure 8), as shown in Table 4.
In the case of the site classifications C and D in South Korea, VS30 is concentrated at approximately 360 m/s. Considering this tendency, Sun [4] proposed classifying the existing C and D site conditions into four sub-classes in the site classification system (Table 5) that considered the site-specific geotechnical characteristics of the Korean peninsula [4]. This was applied as a basis for providing regional seismic hazard information. In this study, considering the application of seismic design criteria and the site-specific characteristics of South Korea, a geo-proxy-based empirical site classification system was proposed by applying the four-step sub-category concept to the site classification conditions C and D, as shown in Table 5 and Figure 9.
4. Seismic Zonation with Site Response Parameters and Geo-Proxies in Incheon
The proposed geo-proxy-based site classification system was applied to the extended area of Incheon, which is the target region of a seismic hazard assessment based on the quantification of the geotechnical earthquake engineering characteristics. Figure 2 shows the administrative areas of Incheon as well as the site classification information based on the geo-proxies of surface terrain slope and surface elevation. A comparison with site classification precise zoning information through the geotechnical-DB-based development of geo-spatial grid information was performed.
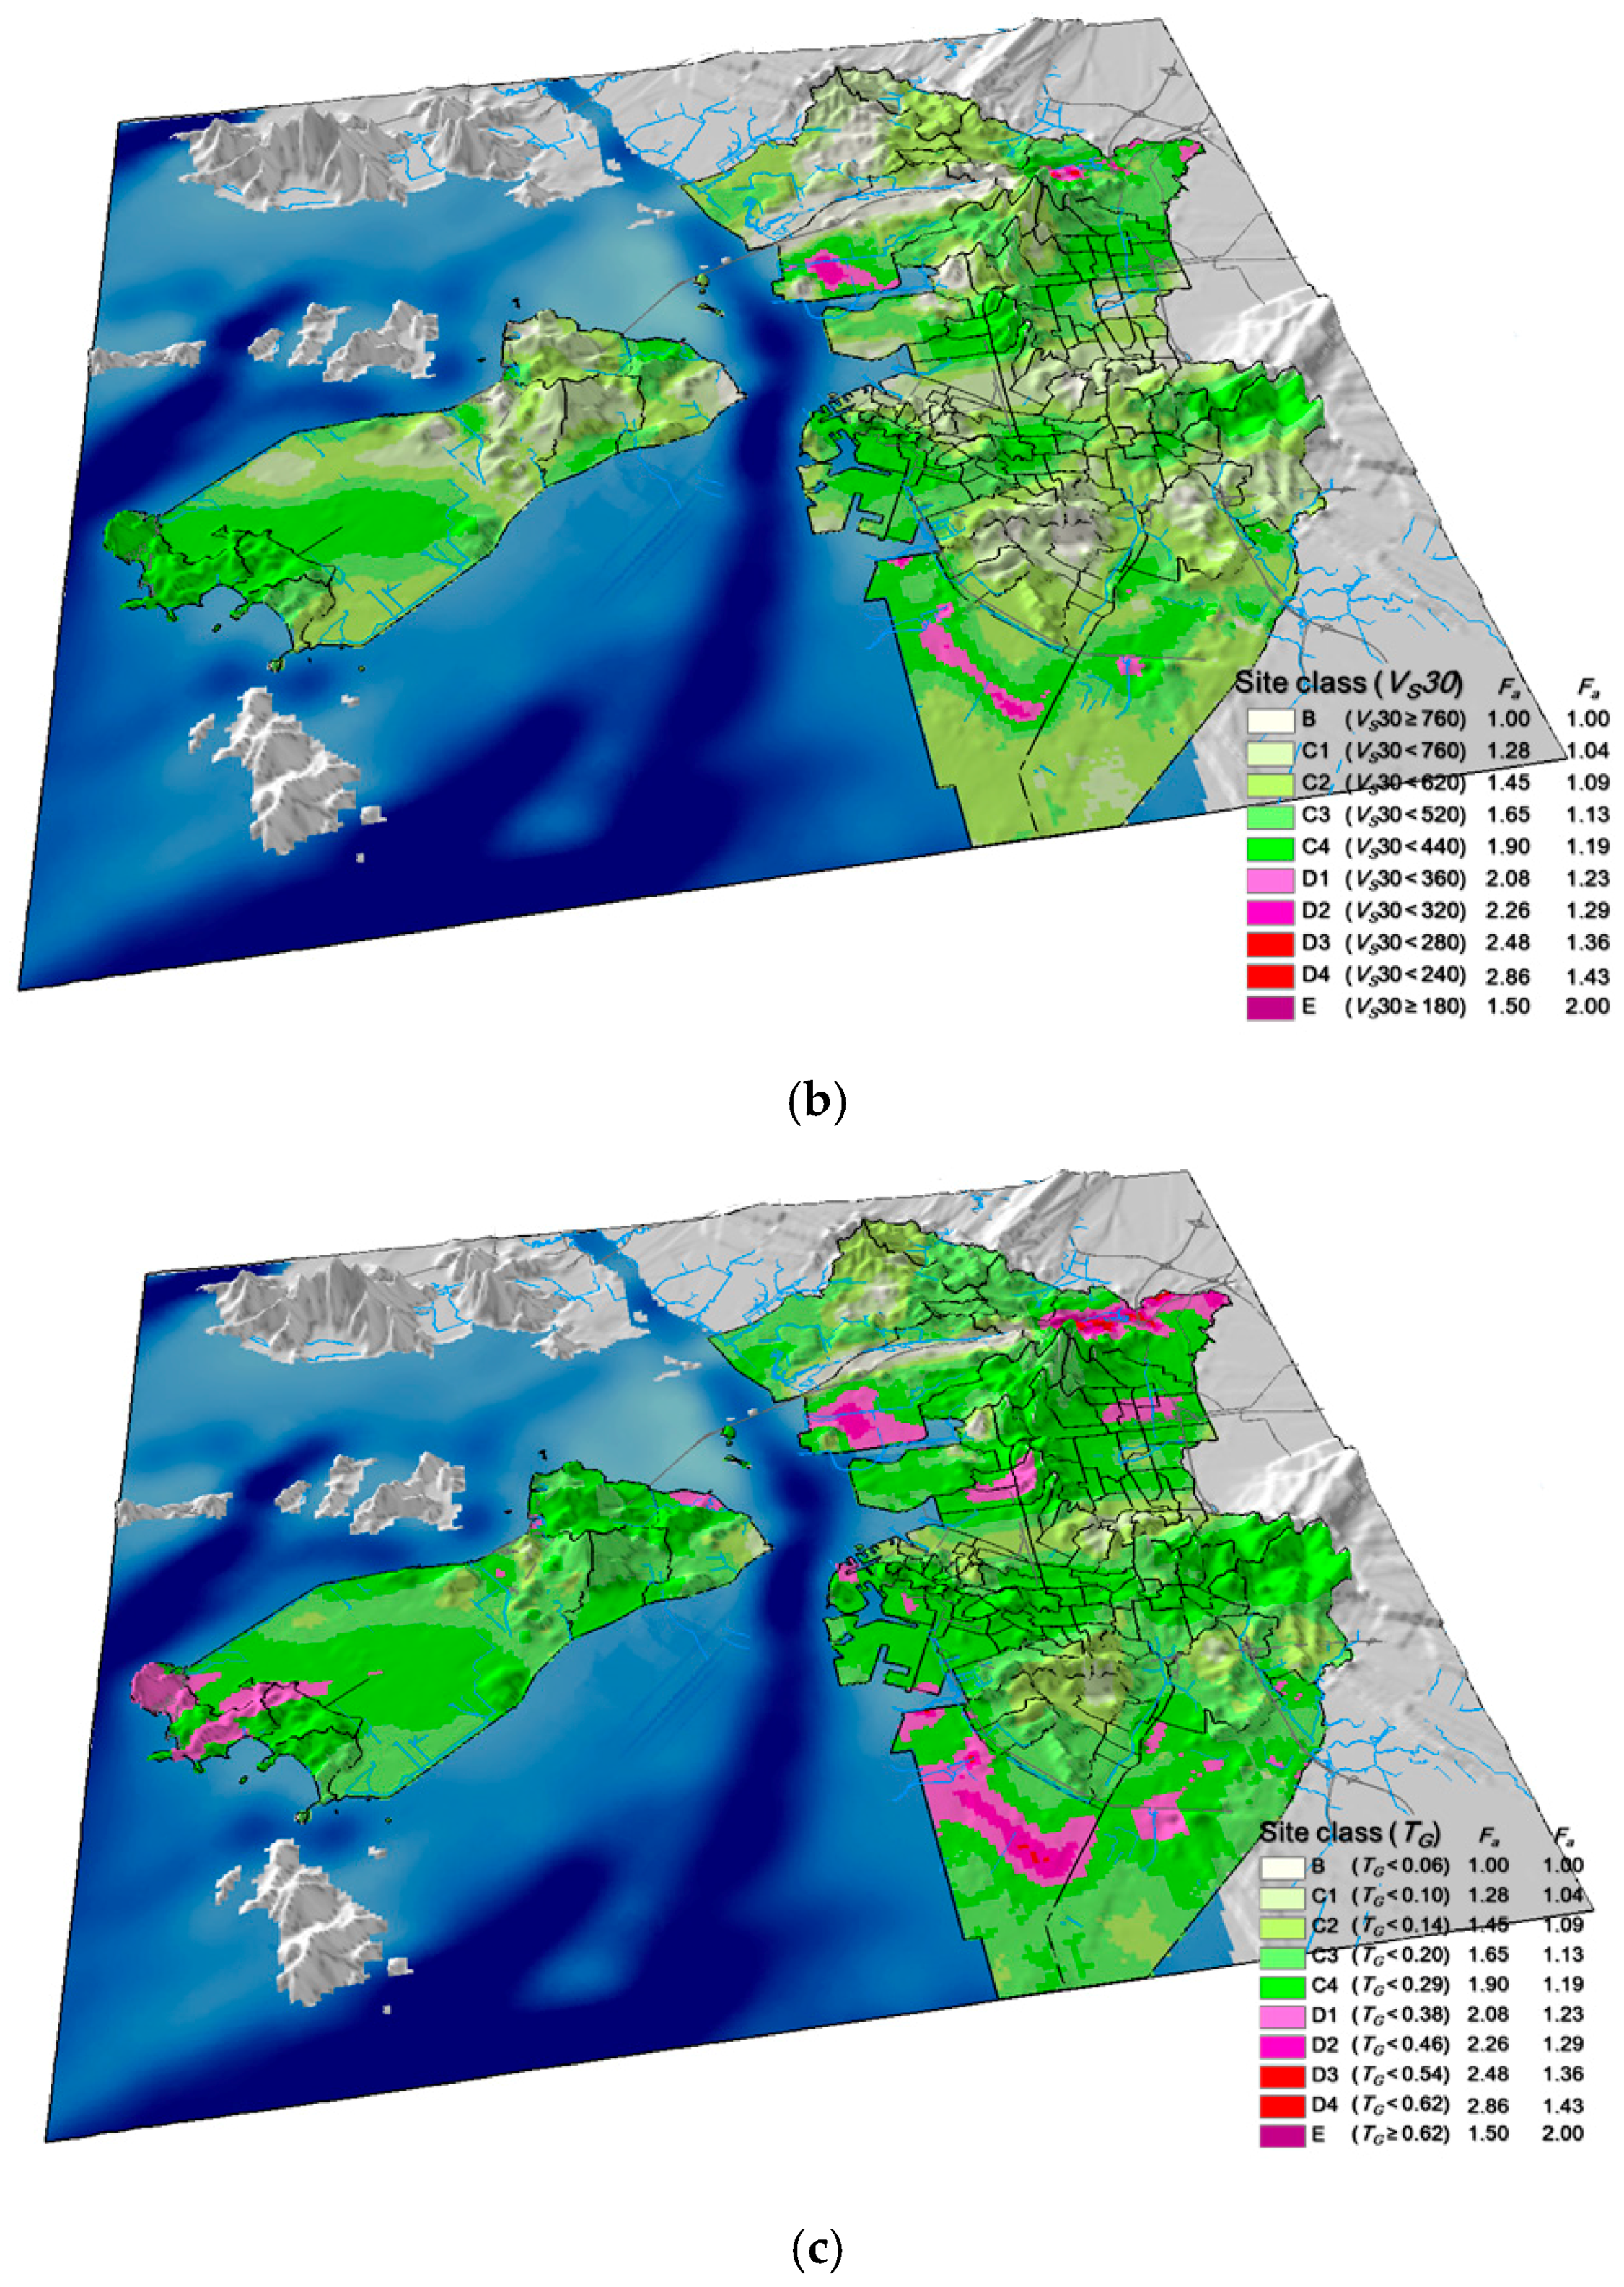
Firstly, to determine the amplification characteristics and cross-check with proxy-based criteria, depending on the site classification system based on the site response parameters, the seismic zonation was performed first for Incheon near Seoul using the geo-spatial grid information, which was reproduced by spatially interpolating the borehole datasets. The ground motion for seismic design can be determined by performing site classification and then calculating site coefficients using the site classification system that includes H, VS30 and TG as classification criteria (Table 1). Figure 10 presents the site classification based on H, VS30 and TG, which were derived by the individual or combined utilization of the spatial geotechnical layer information and the representative VS [4] for each geotechnical layer predicted for Incheon in this study.
The study area has a maximum bedrock depth of approximately 48 m, while bedrock over 20 m depth is mainly distributed in plains near the coast (Figure 10a). VS30 is distributed from approximately 320 to 500 m/s in the areas including plains near the coast, where residential and industrial facilities are concentrated (Figure 10b). In addition, the site period is distributed from approximately 0.2 to 0.5 s in most of the plains near the coast (Figure 10c). By considering the earthquake vulnerability based on the structure resonance possibility using the site-period distribution information, it is possible to predict the earthquake vulnerability of facilities between two and five stories high in plains dense with residential and industrial facilities. This is based on the natural period of 0.1 s according to each building floor [2,33] but major sites in Incheon show approximately 0.2–0.5 s site periods. Considering that the study area contains not only residential but also industrial and commercial areas, it is likely that seismic performance assessments and seismic reinforcement are required for a large number of buildings and structures.
Incheon, a representative coastal metropolitan city in South Korea, has a diverse site classification distribution, in which the amplification of earthquake ground motion is expected in plains near rivers, where residential and commercial facilities are concentrated and industrial facilities are located. In other words, where areas with site classifications C (C1–C4) and D (D1–D4), which are more vulnerable in terms of geotechnical earthquake engineering, are distributed. In some regions, site classification E is distributed if classification according to the site period is applied. Although a considerable area corresponds to site classification C, where the magnitude of ground motion is amplified to relatively small values, such site distribution requires more comprehensive and systematic precision zonation of the study area. It can also be seen that the same site can have somewhat different site classification depending on H, VS30 and TG, which are the geotechnical earthquake engineering parameters. It can be intuitively known through the site classification distribution that the amplification degree is generally intensified in the order of TG, H and VS30.
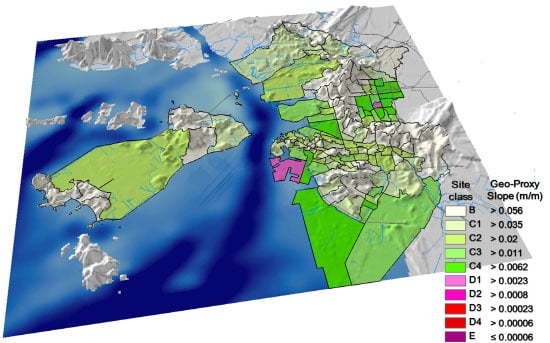
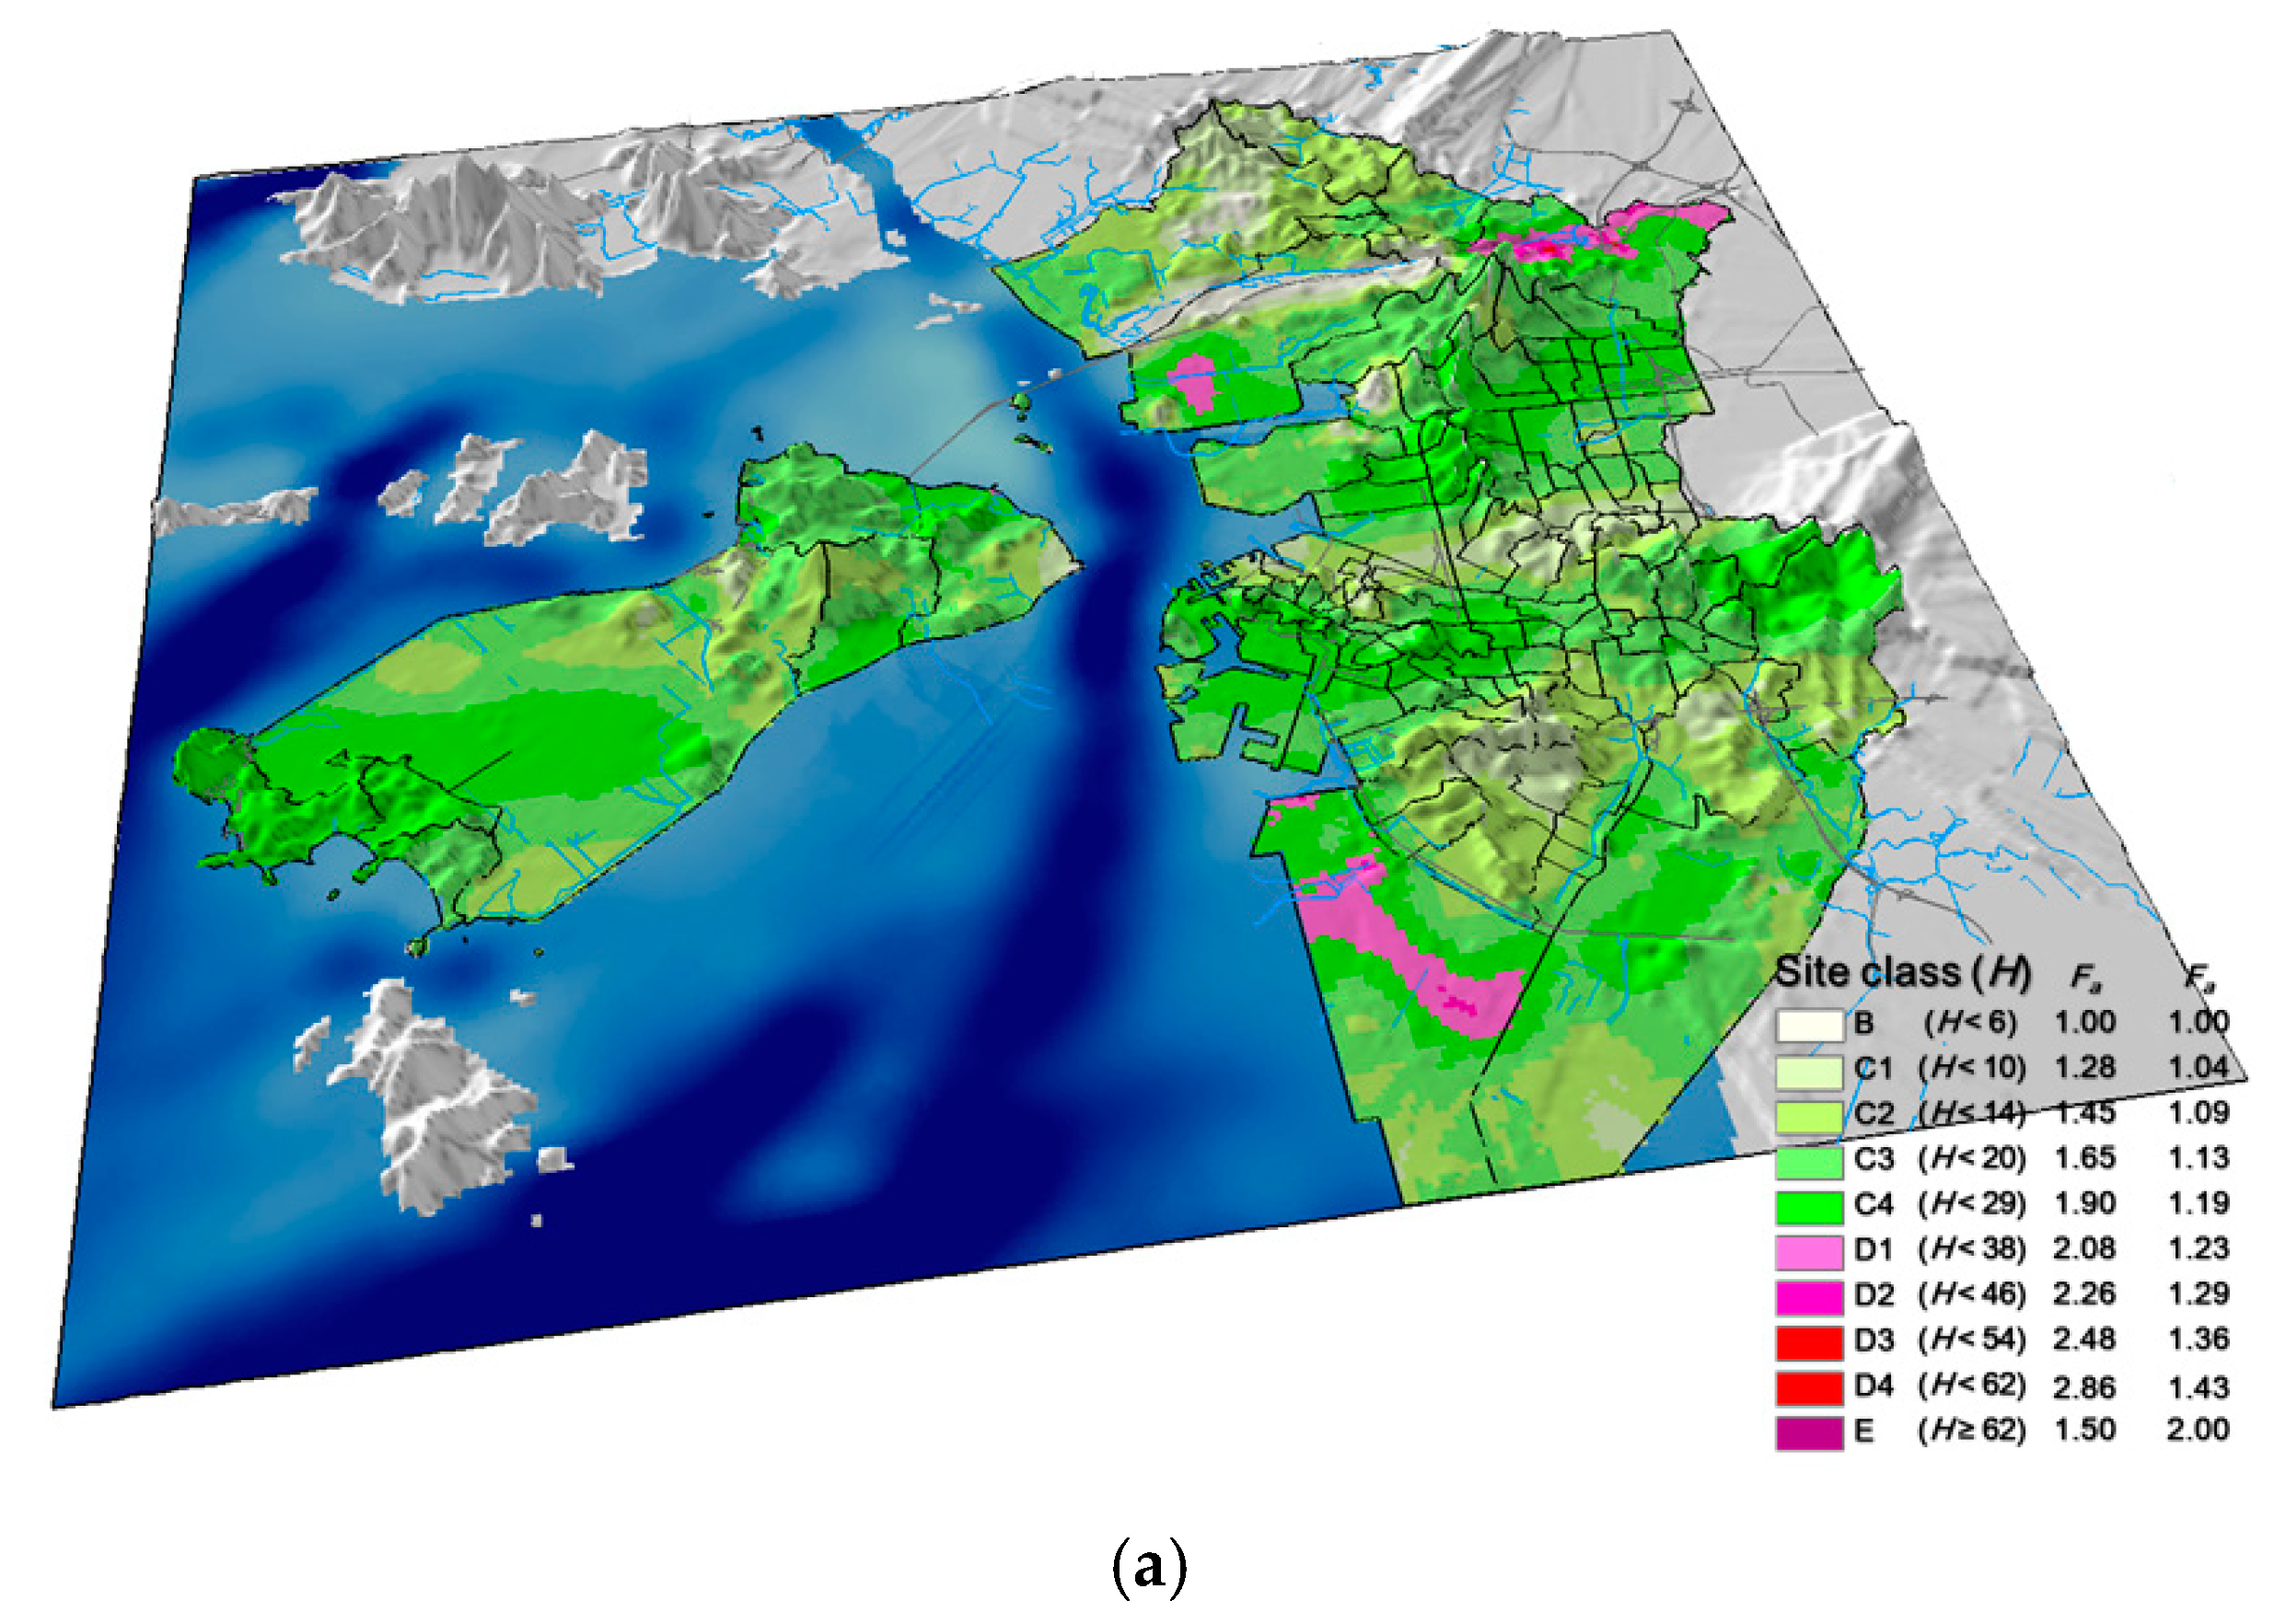
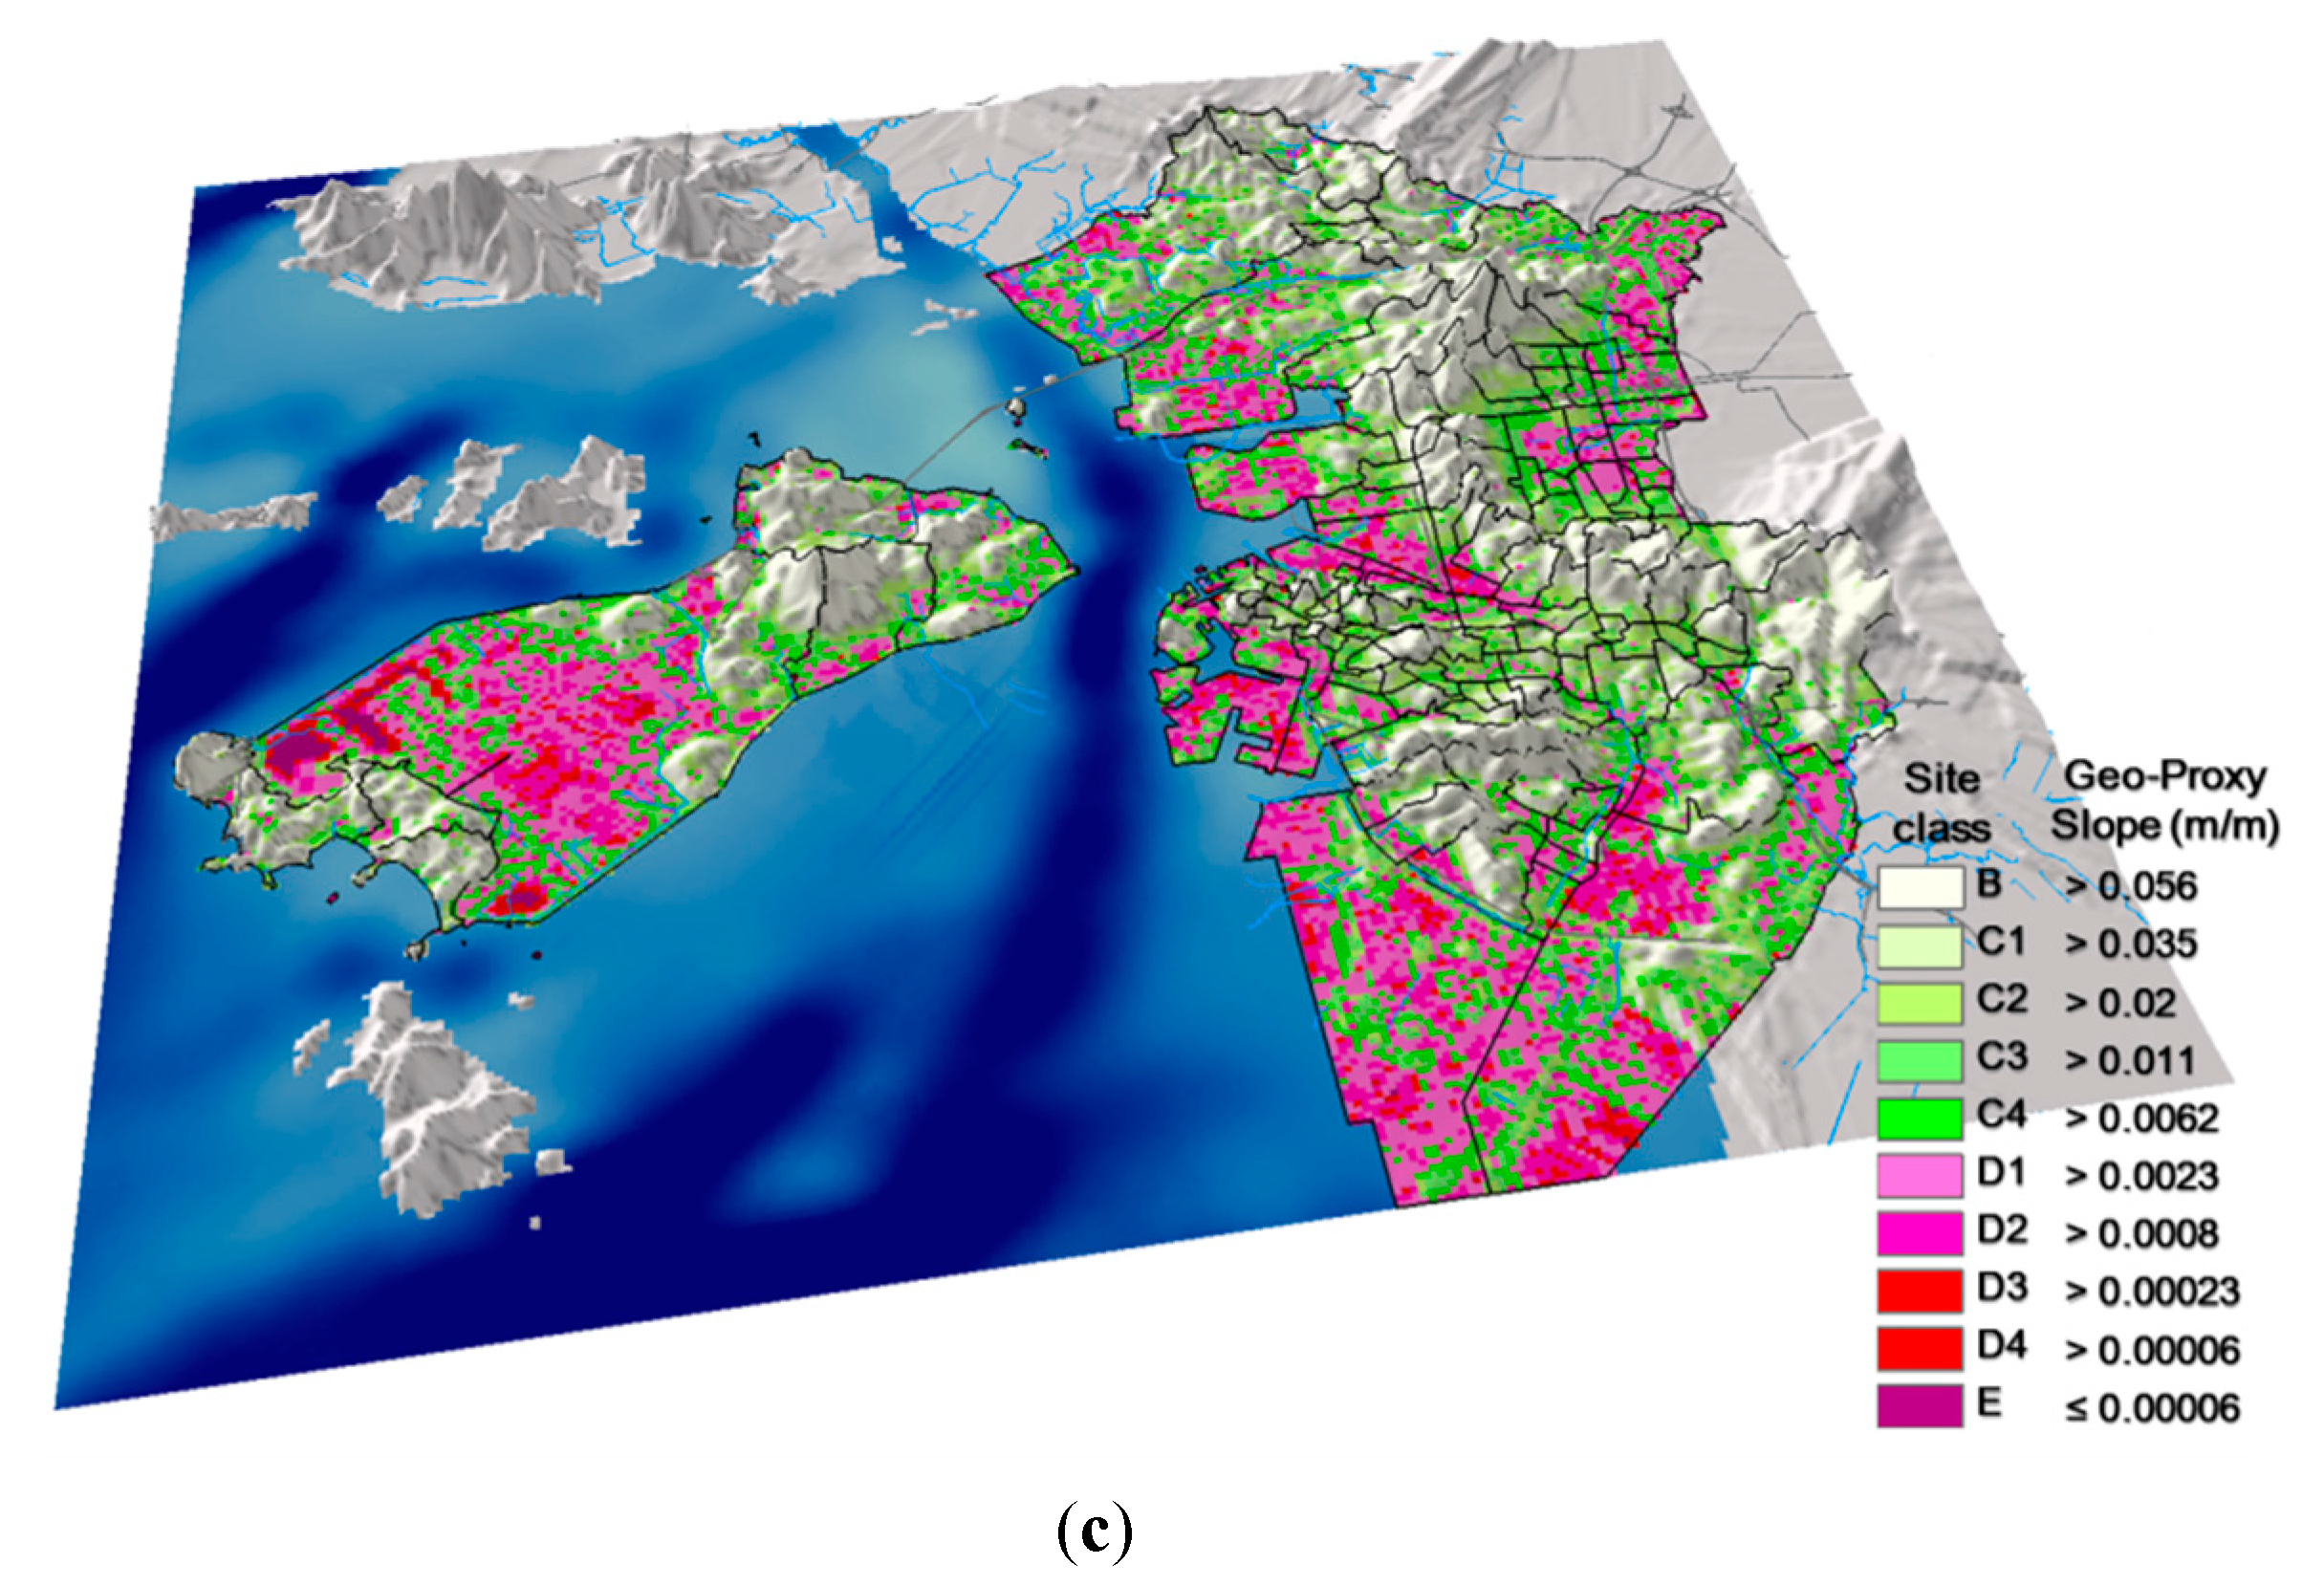
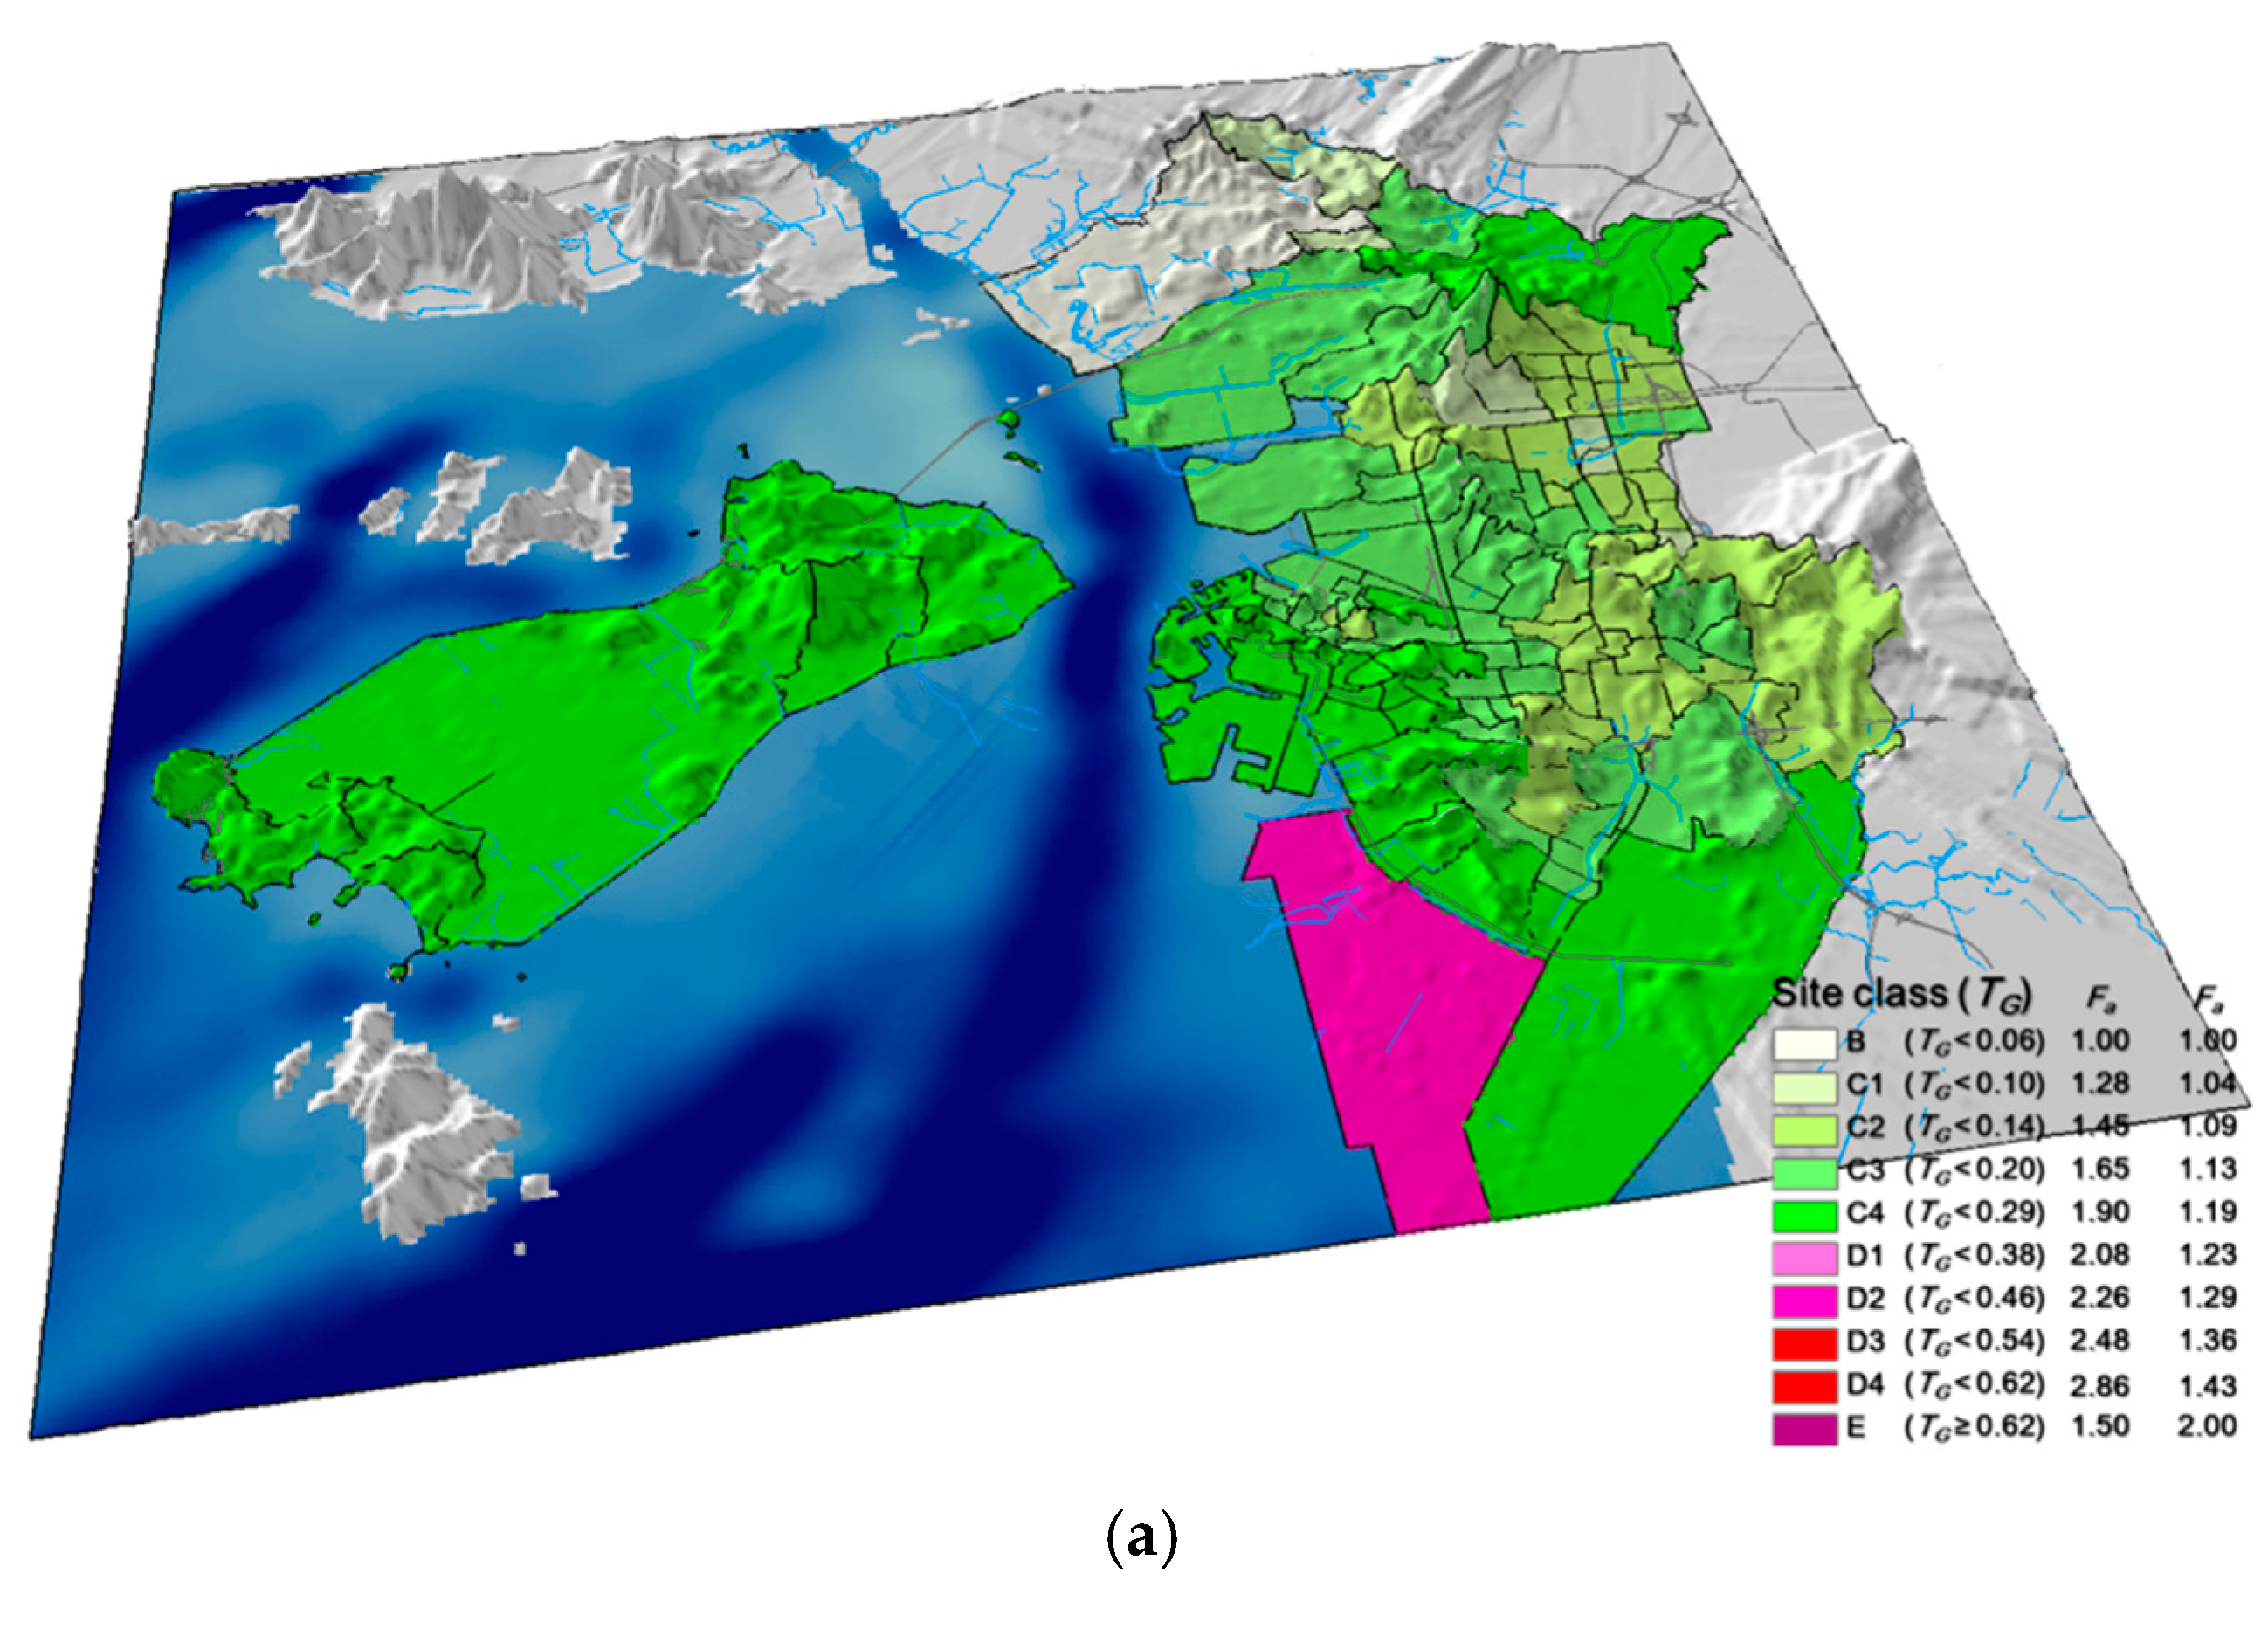
According to the proposed geo-proxy-based empirical site classification using slope and elevation (Table 5), the seismic zonation with elevation- and slope-based classification criteria was developed on the three-dimensional topographic coverage (Figure 11). The spatial distribution of site class was then quantitatively compared with site response parameter-based seismic zonation controlling the geo-spatial grid (Figure 10). Figure 11a presents the spatial distribution of elevation-based site class and site class E was spatially categorized focusing on most of the coast and plain regions, excluding the mountainous area in Incheon. In contrast, the spatial distribution of slope-based site class was estimated in accordance with the classification criteria proposed by Allen and Wald [15] and the proposed geo-proxy-based framework. There are similar spatial trends, except for part of the plain areas. The site classes C4, D1 and D2, which have an average slope of 0.006 m/m, are concentrically distributed in the plain areas. This study determined a lower grade of site class and the corresponding slope-based site classification. This is because the proposed criteria were developed based on borehole datasets characterized from the shallower soil layer in Seoul than San Francisco Bay, where deep soil deposits over 30 m cover a wide area. Thus, the proposed slope-based classification criteria are more appropriate, considering the site-specific geotechnical characteristics in South Korea.
The site-specific site effects estimated from the topographic elevation were relatively overestimated and accordingly, are more conservative criteria in seismic design standards. In addition to the topographic effects, the effects of deep sedimentary basins can also greatly modify the level of ground shaking observed at sites located within them and thus, should be considered in combination with shallow seismic site conditions. It is difficult to find the topographic effect depending on the local curvature by using only the elevation-based classification criteria. Thus, in order to identify the detailed site classification in a plain area (an area with an average elevation lower than 9 m) considering the topographic effects, the slope-based site classification is more appropriate for Incheon. The spatial variation due to geological formation and civil engineering projects is remarkable in Incheon. Moreover, it should be possible to fit simple geometric shapes (e.g., ellipses) at the transition of hills and basins by using the average slope of the hills surrounding the basin as a crude predictor of three-dimensional basin geometry. In case of Seoul and Incheon, the average and standard deviation of slope was 0.015 m/m and 0.002 m/m. Thus, the additional geo-proxy-based application for South Korea is essential to propose the quantitative criterion depending on the simple geometric shapes at the transition of hills and basins. It is likely that this approach will only be valid in regions where large contrasts between hill and basin slopes exist. In this study, the spatial distribution of site class with a slope-based proxy was utilized for developing the seismic zonation.
The seismic zonation maps were developed based on the optimized spatial distribution of seismic site classes with the appropriate site response parameter and geo-proxy, by computing the average TG and the proposed geo-proxy for each unit in the study area of Incheon (Figure 12). Among the three site response parameters, TG, which estimated the intensified amplification property, was selected for the Incheon area. To consider local geotechnical characteristics and the topographic effects, the proposed slope-based site classification was then determined. There are similar spatial gradients of site class, except in some downtown areas. In addition, the TG-based site classification distribution map, which can be used to determine more conservative seismic design site coefficients than the slope-based site classification, was produced. However, the site class of the slope-based zonation was categorized as a more vulnerable grade in the partial administrative sub-unit of the downtown area, where borehole data were lacking. If there is a lack of borehole data to construct the geo-spatial grid information, a large error in the variogram modeling for geostatistical interpolation will swell the prediction errors, without it being apparent in the calculated values. Consequently, if there are insufficient borehole datasets in a target area, the geo-proxy-based site classification was reasonable for seismic design criteria because the closest borehole datasets were spatially interpolated to compute the site response parameter.
5. Conclusions
In this study, geo-proxy-based site classification was proposed based on empirical correlations with site response parameters and conducted for regional zonation of seismic site effects to identify the amplification of characteristics in South Korea depending on the site-specific geo-spatial conditions. In order to optimize the classification criteria, by considering the geotechnical uncertainty and site effects in South Korea, a dual framework for a site classification system with site response parameters and geo-proxies was established. First, a geotechnical DB was constructed from borehole datasets, DEM and a geographic coverage map. This study selected the western metropolitan areas (the Seoul and Incheon regions) in South Korea, where reliable geotechnical datasets and land coverage information were spatially distributed well.
Second, geo-spatial grid information, which included geotechnical layers, SPT-N value and DEM, was determined based on the optimized geostatistical interpolation method. The geo-spatial grid information in the Seoul area was applied as backbone datasets to develop the seismic zonation with seismic response parameters based on the validated classification system and the correlations between seismic response parameters and DEM were normalized to develop the geo-proxy criteria. Based on the geotechnical information calculated for these grid locations, various site effect parameters (H, VS30, VS,soil, TG, VSDS) and geo-proxies were rearranged or calculated. Third, depth to bedrock, VS30 and site period were computed using the thickness of the geotechnical layer with representative VS for each layer based on the verified criteria for seismic site classification. The empirical method for an efficient site classification system based on the site period, which can reasonably represent the site-specific geotechnical characteristics of Seoul, was derived. The site classification B, in which ground motion amplification does not occur, was dominant. However, plain land adjacent to the Han River and its tributaries was found to have site classifications C and D with large ground motion amplification.
Fourth, the proposed geo-proxy-based site classification system based on the topographic elevation and slope was applied to the comprehensive area of Incheon. A comparison with site classification precise zoning information through the geo-spatial grid-based development of geo-spatial grid information was performed. To determine the amplification characteristics and cross-check these with the proxy-based criteria, which depended on the site classification system based on the site response parameters, seismic zonation was performed. The site classifications C4, D1 and D2, which have an average slope of 0.006 m/m, were concentrically distributed in plain areas. The site-specific site effects were estimated based on the topographic elevation and were relatively overestimated when topographic effects were not considered. When developing the seismic zonation with the detailed site classification in the plain areas considering topographic effects, the slope-based site classification was more suitable for Incheon. Therefore, the spatial distribution of site class with the slope-based proxy was utilized for developing the seismic zonation. Geo-proxy-based seismic zonation could be a useful tool for disaster response planning and could provide important information regarding the potential condition and recovery times of crucial lifelines, such as roads, rail networks and ports [17,34]. Although studies on site classification systems are still being conducted, their comprehensive analysis and quantification must be conducted. The seismic zonation map of site effect based on the empirical geo-proxy-based site classification provides a decision making tool to understand the site-specific amplified ground-motion characteristics considering topographic effects and geotechnical uncertainty in multi-scale target areas. In particular, the complementary seismic hazard map, which has possible applications for ShakeMap, can be developed for the Korean Peninsula including regions lacking in borehole datasets. Additionally, topographic gradients can be easily converted to site amplification factors for estimating ground motions in direct conjunction with standard ground-motion prediction equations.
Finally, a dual solution framework for site response parameters and geo-proxy-based site classification was used to identify the local or regional-scale site effects considering the geotechnical and geographical influences on site effects. The correlations and site classification criteria according to geological and land coverage maps of the broad areas in South Korea should be analyzed in future research to consider the geotechnical characteristics of area far from Seoul and Incheon. Furthermore, high-precision seismic hazard spatial zonation of subdivided and various small areas in metropolitan regions in South Korea should be performed in the future. In addition, various geographic coverage maps, such as the geological map, need to be developed for the site-specific site classification criteria by considering geological features in South Korea.
Acknowledgments
The authors wish to express their gratitude for the support from the Basic Research Project of the Korea Institute of Geoscience and Mineral Resources (KIGAM).
Author Contributions
Chang-Guk Sun designed and applied the geo-proxy-based site classification framework and wrote the paper. Han-Saem Kim supervised the research activities and provided guidance and suggestions for the proposed framework and the paper. Hyung-Ik Cho collected the geotechnical database in the Seoul and Incheon areas and supported the GIS work.
Conflicts of Interest
The authors declare no conflict of interest.
References
- Sun, C.G. Applications of a GIS-based geotechnical tool to assess spatial earthquake hazards in an urban area. Environ. Earth Sci. 2012, 65, 1987–2001. [Google Scholar] [CrossRef]
- Sun, C.G. Geotechnical Information System and Site Amplification Characteristics for Earthquake Ground Motions at Inland of the Korean Peninsula. Ph.D. Thesis, Seoul National University, Seoul, Korea, February 2004. [Google Scholar]
- Sun, C.G.; Kim, D.S.; Chung, C.K. Geologic site conditions and site coefficients for estimating earthquake ground motions in the inland areas of Korea. Eng. Geol. 2005, 81, 446–469. [Google Scholar] [CrossRef]
- Sun, C.G. Suggestion of additional criteria for site categorization in Korea by quantifying regional specific characteristics on seismic response. KSCE J. Civ. Eng. 2010, 13, 203–218. [Google Scholar]
- Lee, S.H.; Sun, C.G.; Yoon, J.K.; Kim, D.S. Development and verification of a new site classification system and site coefficients for regions of shallow bedrock in Korea. J. Earthq. Eng. 2012, 16, 795–819. [Google Scholar] [CrossRef]
- Booth, E. The estimation of peak ground-motion parameters from spectral ordinates. J. Earthq. Eng. 2007, 11, 13–32. [Google Scholar] [CrossRef]
- Park, S.; Elrick, S. Predictions of shear-wave velocities in southern California using surface geology. Bull. Seismol. Soc. Am. 1998, 88, 677–685. [Google Scholar]
- Wills, C.J.; Petersen, M.; Bryant, W.A.; Reichle, M.; Saucedo, G.J.; Tan, S.; Taylor, G.; Treiman, J. A site-conditions map for California based on geology and shear-wave velocity. Bull. Seismol. Soc. Am. 2000, 90, S187–S208. [Google Scholar] [CrossRef]
- Holzer, T.L.; Padovani, A.C.; Bennett, M.J.; Noce, T.E.; Tinsley, J.C. Mapping NEHRP VS30 site classes. Earthq. Spectra 2005, 21, 353–370. [Google Scholar] [CrossRef]
- Douglas, J.; Edwards, B. Recent and future developments in earthquake ground motion estimation. Earth Sci. Rev. 2016, 160, 203–219. [Google Scholar] [CrossRef] [Green Version]
- Borcherdt, R.D. Estimates of site-dependent response spectra for design (methodology and justification). Earthq. Spectra 1994, 10, 617–653. [Google Scholar] [CrossRef]
- Earle, P.S.; Wald, D.J.; Allen, T.I.; Jaiswal, K.S.; Porter, K.A.; Hearne, M.G. Rapid exposure and loss estimates for the 12 May, 2008 MW 7.9 Wenchuan earthquake provided by the US Geological Survey’s PAGER system. In Proceedings of the 14th World Conference on Earthquake Engineering, Beijing, China, 12 October 2008; International Association for Earthquake Engineering: Tokyo, Japan, 2008. [Google Scholar]
- Wald, D.J.; Earle, P.S.; Allen, T.I.; Jaiswal, K.; Porter, K.; Hearne, M. Development of the US Geological Survey’s PAGER system (prompt assessment of global earthquakes for response). In Proceedings of the 14th World Conference on Earthquake Engineering, Beijing, China, 12 October 2008; International Association for Earthquake Engineering: Tokyo, Japan, 2008. [Google Scholar]
- Xu, L.; Di, H.; Feng, W.; Li, C. Estimation of the fault-near ground motion of the 2010 Yushu, Qinghai, Ms 7.1 earthquake. Chin. J. Geophys.-CH 2010, 53, 1366–1373. (In Chinese) [Google Scholar]
- Allen, T.I.; Wald, D.J. Topographic Slope as a Proxy for Global Seismic Site Conditions (VS30) and Amplification around the Globe; Open-File Report 2007-1357; U.S. Geological Survey: Reston, VA, USA, 2007.
- Farr, T.G.; Kobrick, M. Shuttle Radar Topography Mission produces a wealth of data. Eos Trans. Am. Geophys. Union 2000, 81, 583–585. [Google Scholar] [CrossRef]
- Allen, T.I.; Wald, D.J. On the use of high-resolution topographic data as a proxy for seismic site conditions (VS30). Bull. Seismol. Soc. Am. 2009, 99, 935–943. [Google Scholar] [CrossRef]
- Sun, C.G.; Kim, H.S. GIS-based regional assessment of seismic site effects considering the spatial uncertainty of site-specific geotechnical characteristics in coastal and inland urban areas. Geomat. Nat. Hazrd Risk 2017, 8, 1592–1621. [Google Scholar] [CrossRef]
- Kim, D.S.; Yoon, J.K. Development of new site classification system for the regions of shallow bedrock in Korea. J. Earthq. Eng. 2006, 10, 331–358. [Google Scholar] [CrossRef]
- Lee, S.J.; Liu, Q.; Tromp, J.; Komatitsch, D.; Liang, W.T.; Huang, B.S. Toward real-time regional earthquake simulation II: Real-time Online earthquake Simulation (ROS) of Taiwan earthquakes. J. Asian Earth Sci. 2014, 87, 56–68. [Google Scholar] [CrossRef]
- Study of Seismic Design Guideline (II). Ministry of Construction and Transportation. 1997. Available online: www.molit.go.kr (accessed on 23 January 2018). (In Korean)
- Borcherdt, R.D. Empirical evidence for site coefficients in building code provisions. Earthq. Spectra 2002, 18, 189–217. [Google Scholar] [CrossRef]
- Dobry, R.; Borcherdt, R.D.; Crouse, C.B.; Idriss, I.M.; Joyner, W.B.; Martin, G.R.; Power, M.S.; Rinne, E.E.; Seed, R.B. New site coefficients and site classification system used in recent building seismic code provisions. Earthq. Spectra 2000, 16, 41–67. [Google Scholar] [CrossRef]
- Sun, C.G.; Kim, H.S. Geostatistical assessment for the regional zonation of seismic site effects in a coastal urban area using a GIS framework. Bull. Earthq. Eng. 2016, 14, 2161–2183. [Google Scholar] [CrossRef]
- Kim, H.S.; Sun, C.G.; Cho, H.I. Geospatial Big Data-Based Geostatistical Zonation of Seismic Site Effects in Seoul Metropolitan Area. ISPRS Int. J. Geo.-Inf. 2017, 6, 174. [Google Scholar] [CrossRef]
- Sun, C.G.; Kim, B.H.; Park, K.H.; Chung, C.K. Geotechnical comparison of weathering degree and shear wave velocity in the decomposed granite layer in Hongseong, South Korea. Environ. Earth Sci. 2015, 74, 6901–6917. [Google Scholar] [CrossRef]
- Yun, H.S.; Lee, J.Y.; Yang, D.Y.; Hong, S.S. Areal Distribution Ratio of Rock ffes with Geologic Ages in the Gyeonggi-Seoul-Incheon Areas. J. Petrol. Soc. Korea 2007, 16, 208–216. (In Korean) [Google Scholar]
- Pilz, M.; Parolai, S.; Picozzi, M.; Wang, R.; Leyton, F.; Campos, J.; Zschau, J. Shear wave velocity model of the Santiago de Chile basin derived from ambient noise measurements: A comparison of proxies for seismic site conditions and amplification. Geophys. J. Int. 2010, 182, 355–367. [Google Scholar] [CrossRef]
- Wills, C.J.; Gutierrez, C.I.; Perez, F.G.; Branum, D.M. A next generation VS30 map for California based on geology and topography. Bull. Seismol. Soc. Am. 2015, 105, 3083–3091. [Google Scholar] [CrossRef]
- Rai, D.C.; Singhal, V.; Raj, S.B.; Sagar, S.L. Reconnaissance of the effects of the M7. 8 Gorkha (Nepal) earthquake of 25 April 2015. Geomat. Nat. Hazrd Risk 2016, 7, 1–17. [Google Scholar] [CrossRef]
- Kang, S.Y.; Kim, K.H. A Case Study of GIS-Based Site Classification in the Gyeongsang Province Constrained by Geologic and Topographic Information. J. Korean Assoc. Geogr. Inf. Stud. 2009, 12, 136–145. [Google Scholar]
- Sun, C.G. Determination of mean shear wave velocity to 30m depth for site classification using shallow depth shear wave velocity profile in Korea. Soil Dyn. Earthq. Eng. 2015, 73, 17–28. [Google Scholar] [CrossRef]
- Kim, D.S.; Chung, C.K.; Sun, C.G.; Bang, E.S. Site assessment and evaluation of spatial earthquake ground motion of Kyeongju. Soil Dyn. Earthq. Eng. 2002, 22, 371–387. [Google Scholar] [CrossRef]
- Felicetta, C.; D’Amico, M.; Lanzano, G.; Puglia, R.; Russo, E.; Luzi, L. Site characterization of Italian accelerometric stations. Bull. Earthq. Eng. 2017, 15, 2329–2348. [Google Scholar] [CrossRef]
Figure 1.
Dual framework for site classification system with site response parameters and geo-proxies.
Figure 1.
Dual framework for site classification system with site response parameters and geo-proxies.
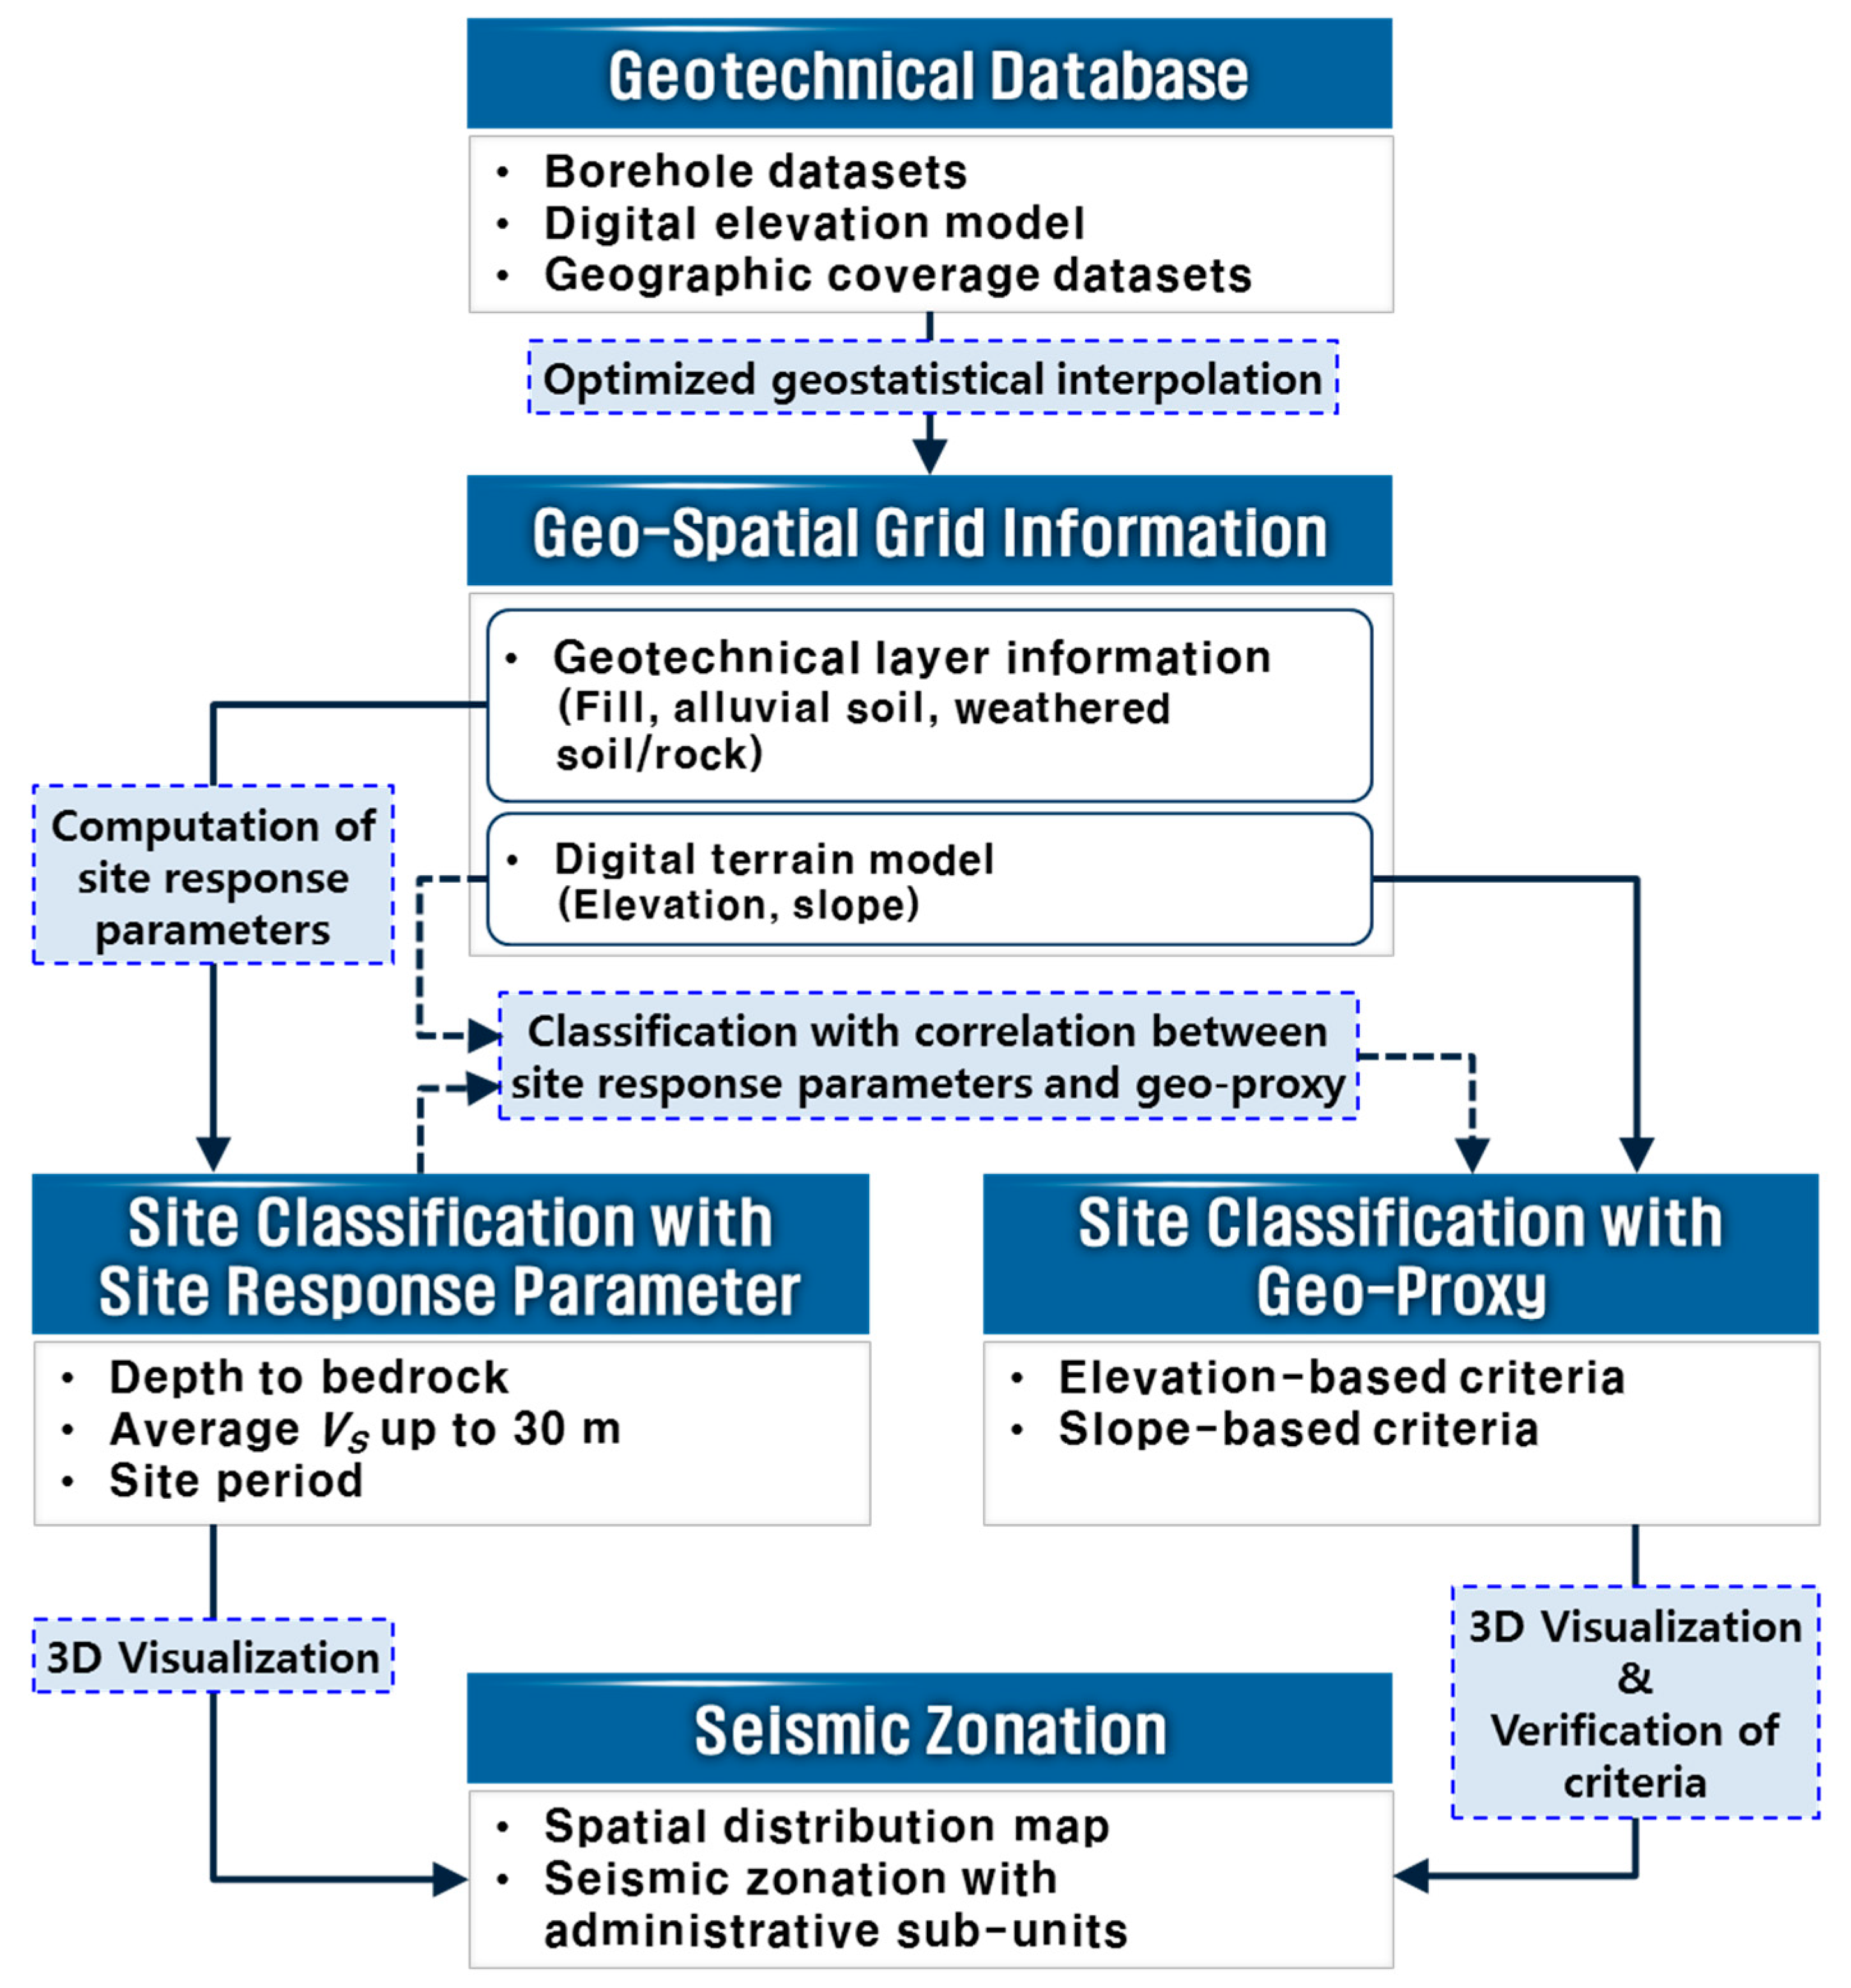
Figure 2.
Geotechnical database (DB) and geo-spatial grid information at 100 m intervals for the Seoul and Incheon areas.
Figure 2.
Geotechnical database (DB) and geo-spatial grid information at 100 m intervals for the Seoul and Incheon areas.

Figure 3.
Site response spatial information for Seoul: (a) bedrock depth, (b) site period, (c) site classification (modified after Sun et al. [26]).
Figure 3.
Site response spatial information for Seoul: (a) bedrock depth, (b) site period, (c) site classification (modified after Sun et al. [26]).


Figure 4.
Correlation between the site period (TG) and VS30 based on the spatial calculation site response information of Seoul.
Figure 4.
Correlation between the site period (TG) and VS30 based on the spatial calculation site response information of Seoul.

Figure 5.
Correlation between the fundamental frequency (f0) and VS30 based on the spatial calculation site response information of Seoul.
Figure 5.
Correlation between the fundamental frequency (f0) and VS30 based on the spatial calculation site response information of Seoul.

Figure 6.
Logarithmic normal probability distribution of geo-proxies for each site classification condition according to VS30 in Seoul: (a) surface terrain slope; (b) surface elevation.
Figure 6.
Logarithmic normal probability distribution of geo-proxies for each site classification condition according to VS30 in Seoul: (a) surface terrain slope; (b) surface elevation.


Figure 7.
Logarithmic normal probability distribution of geo-proxies for each site classification condition according to TG in Seoul: (a) surface terrain slope; (b) surface elevation.
Figure 7.
Logarithmic normal probability distribution of geo-proxies for each site classification condition according to TG in Seoul: (a) surface terrain slope; (b) surface elevation.

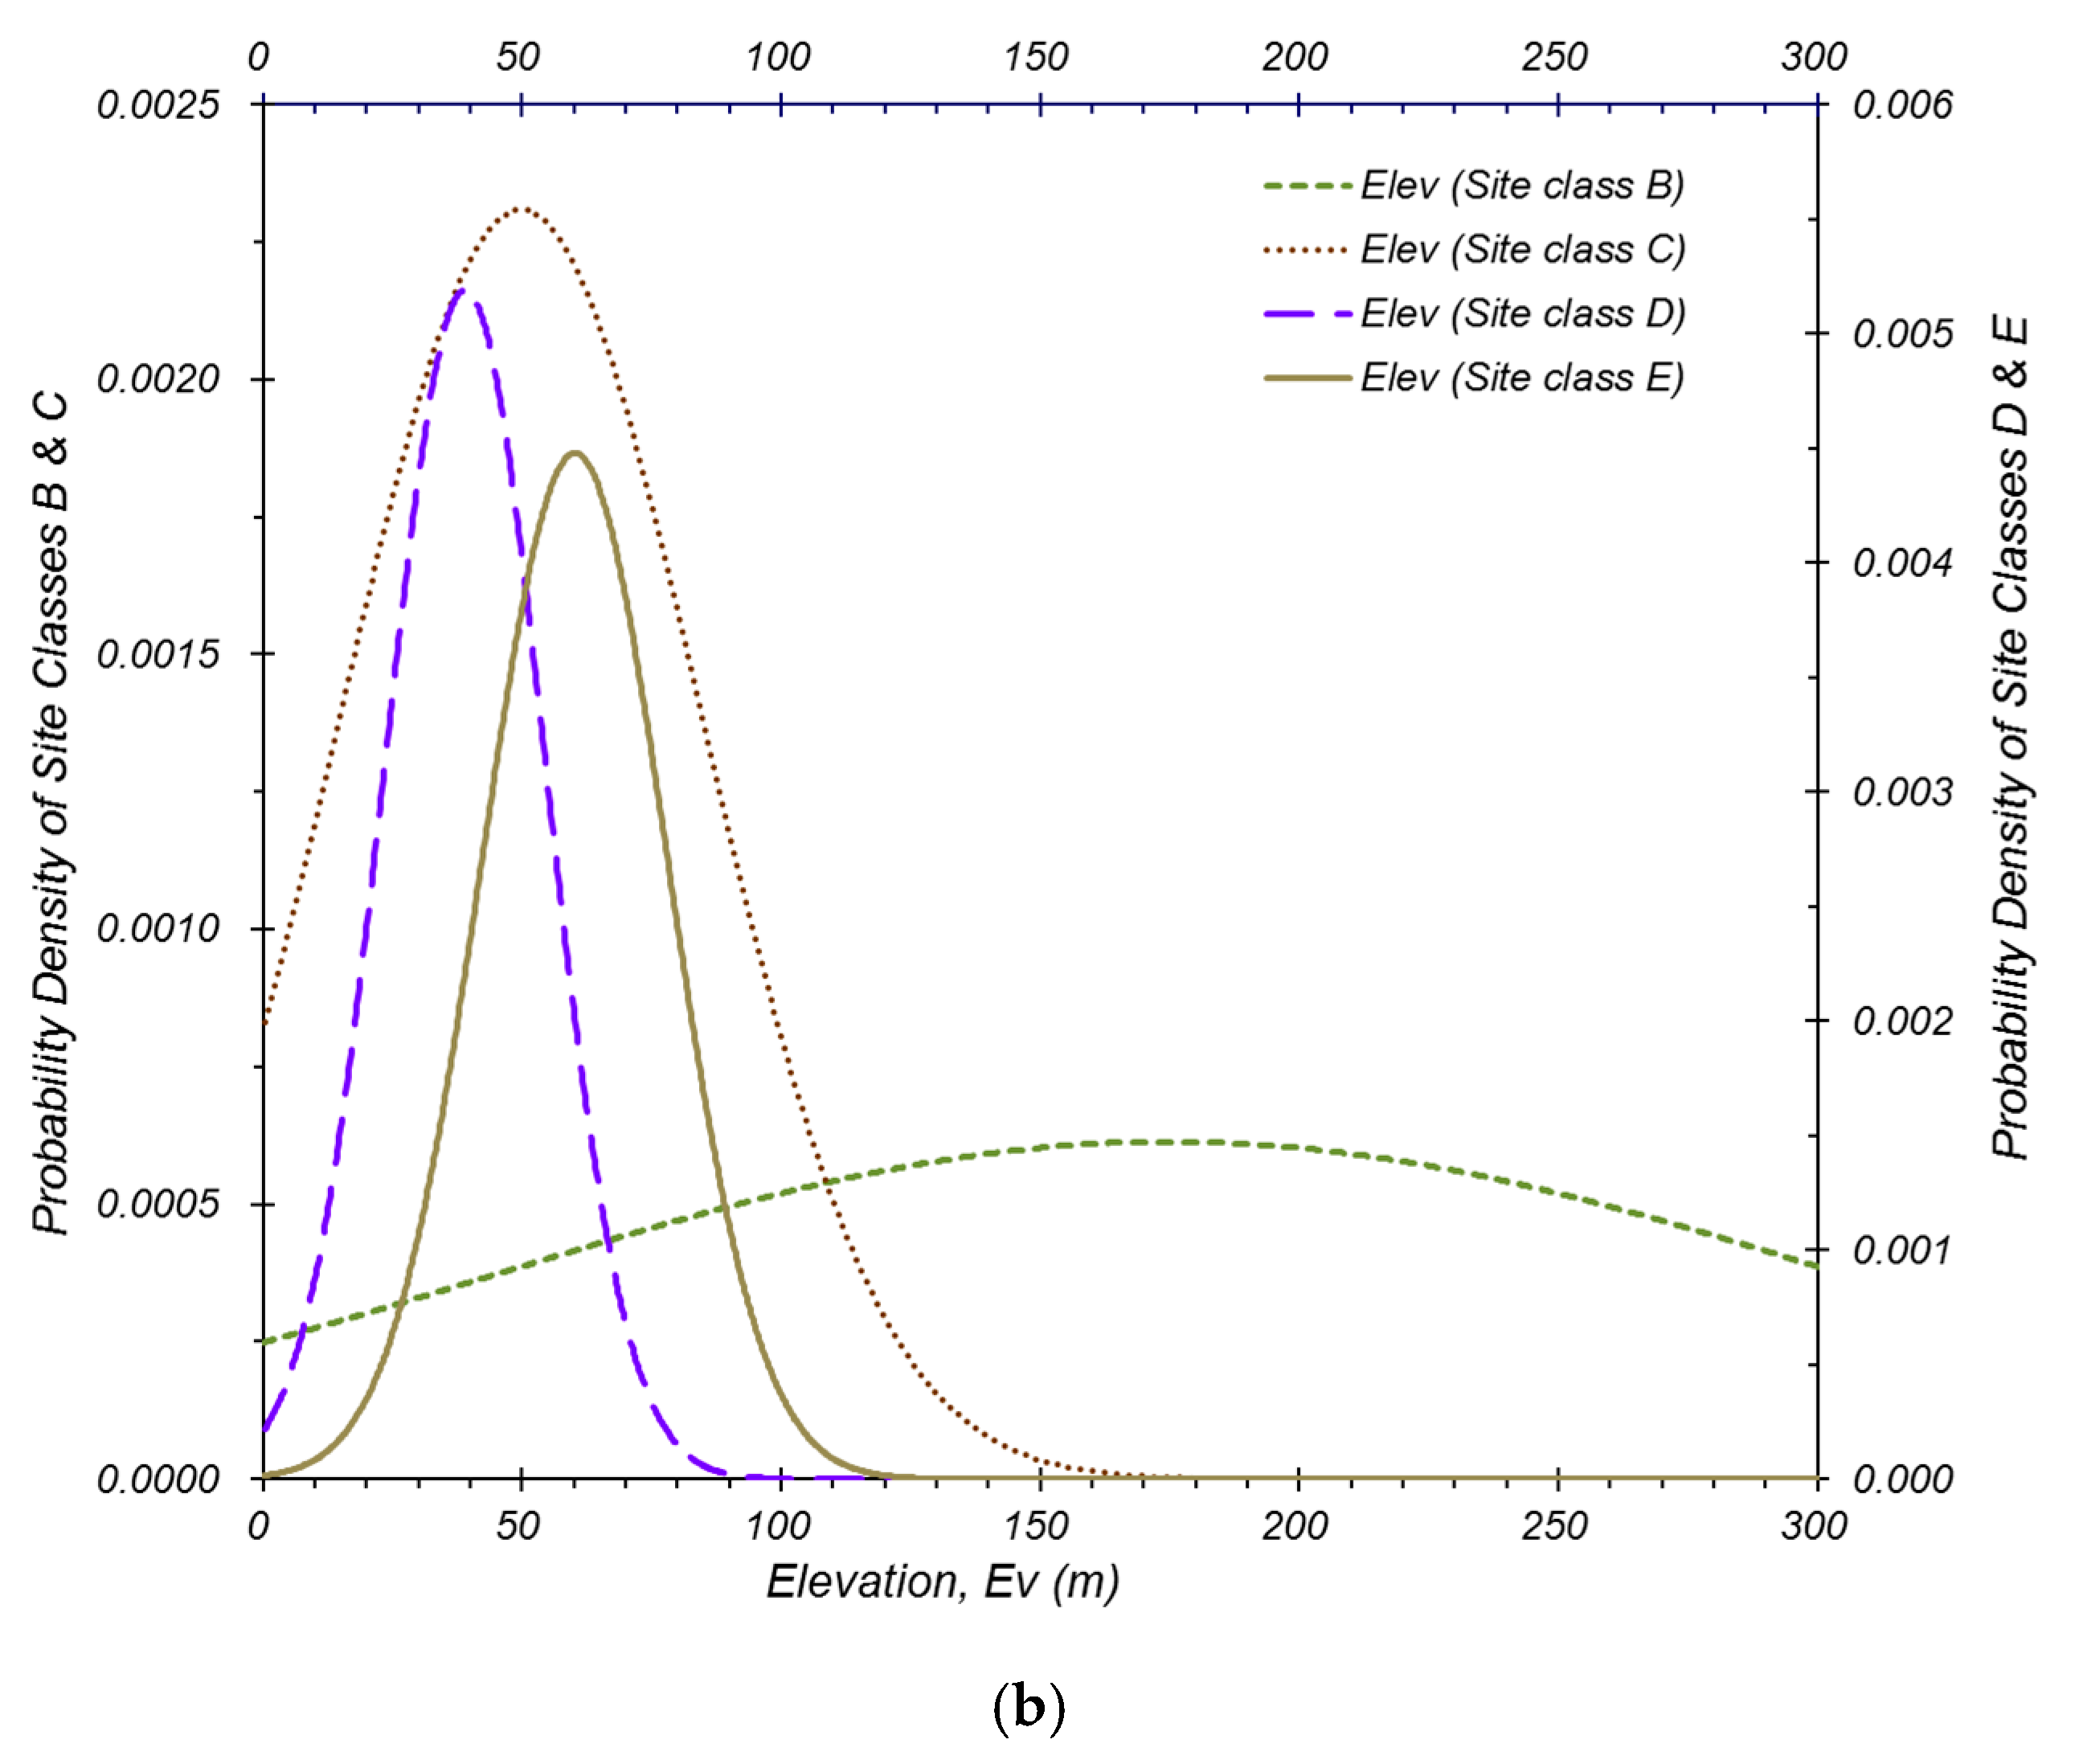
Figure 8.
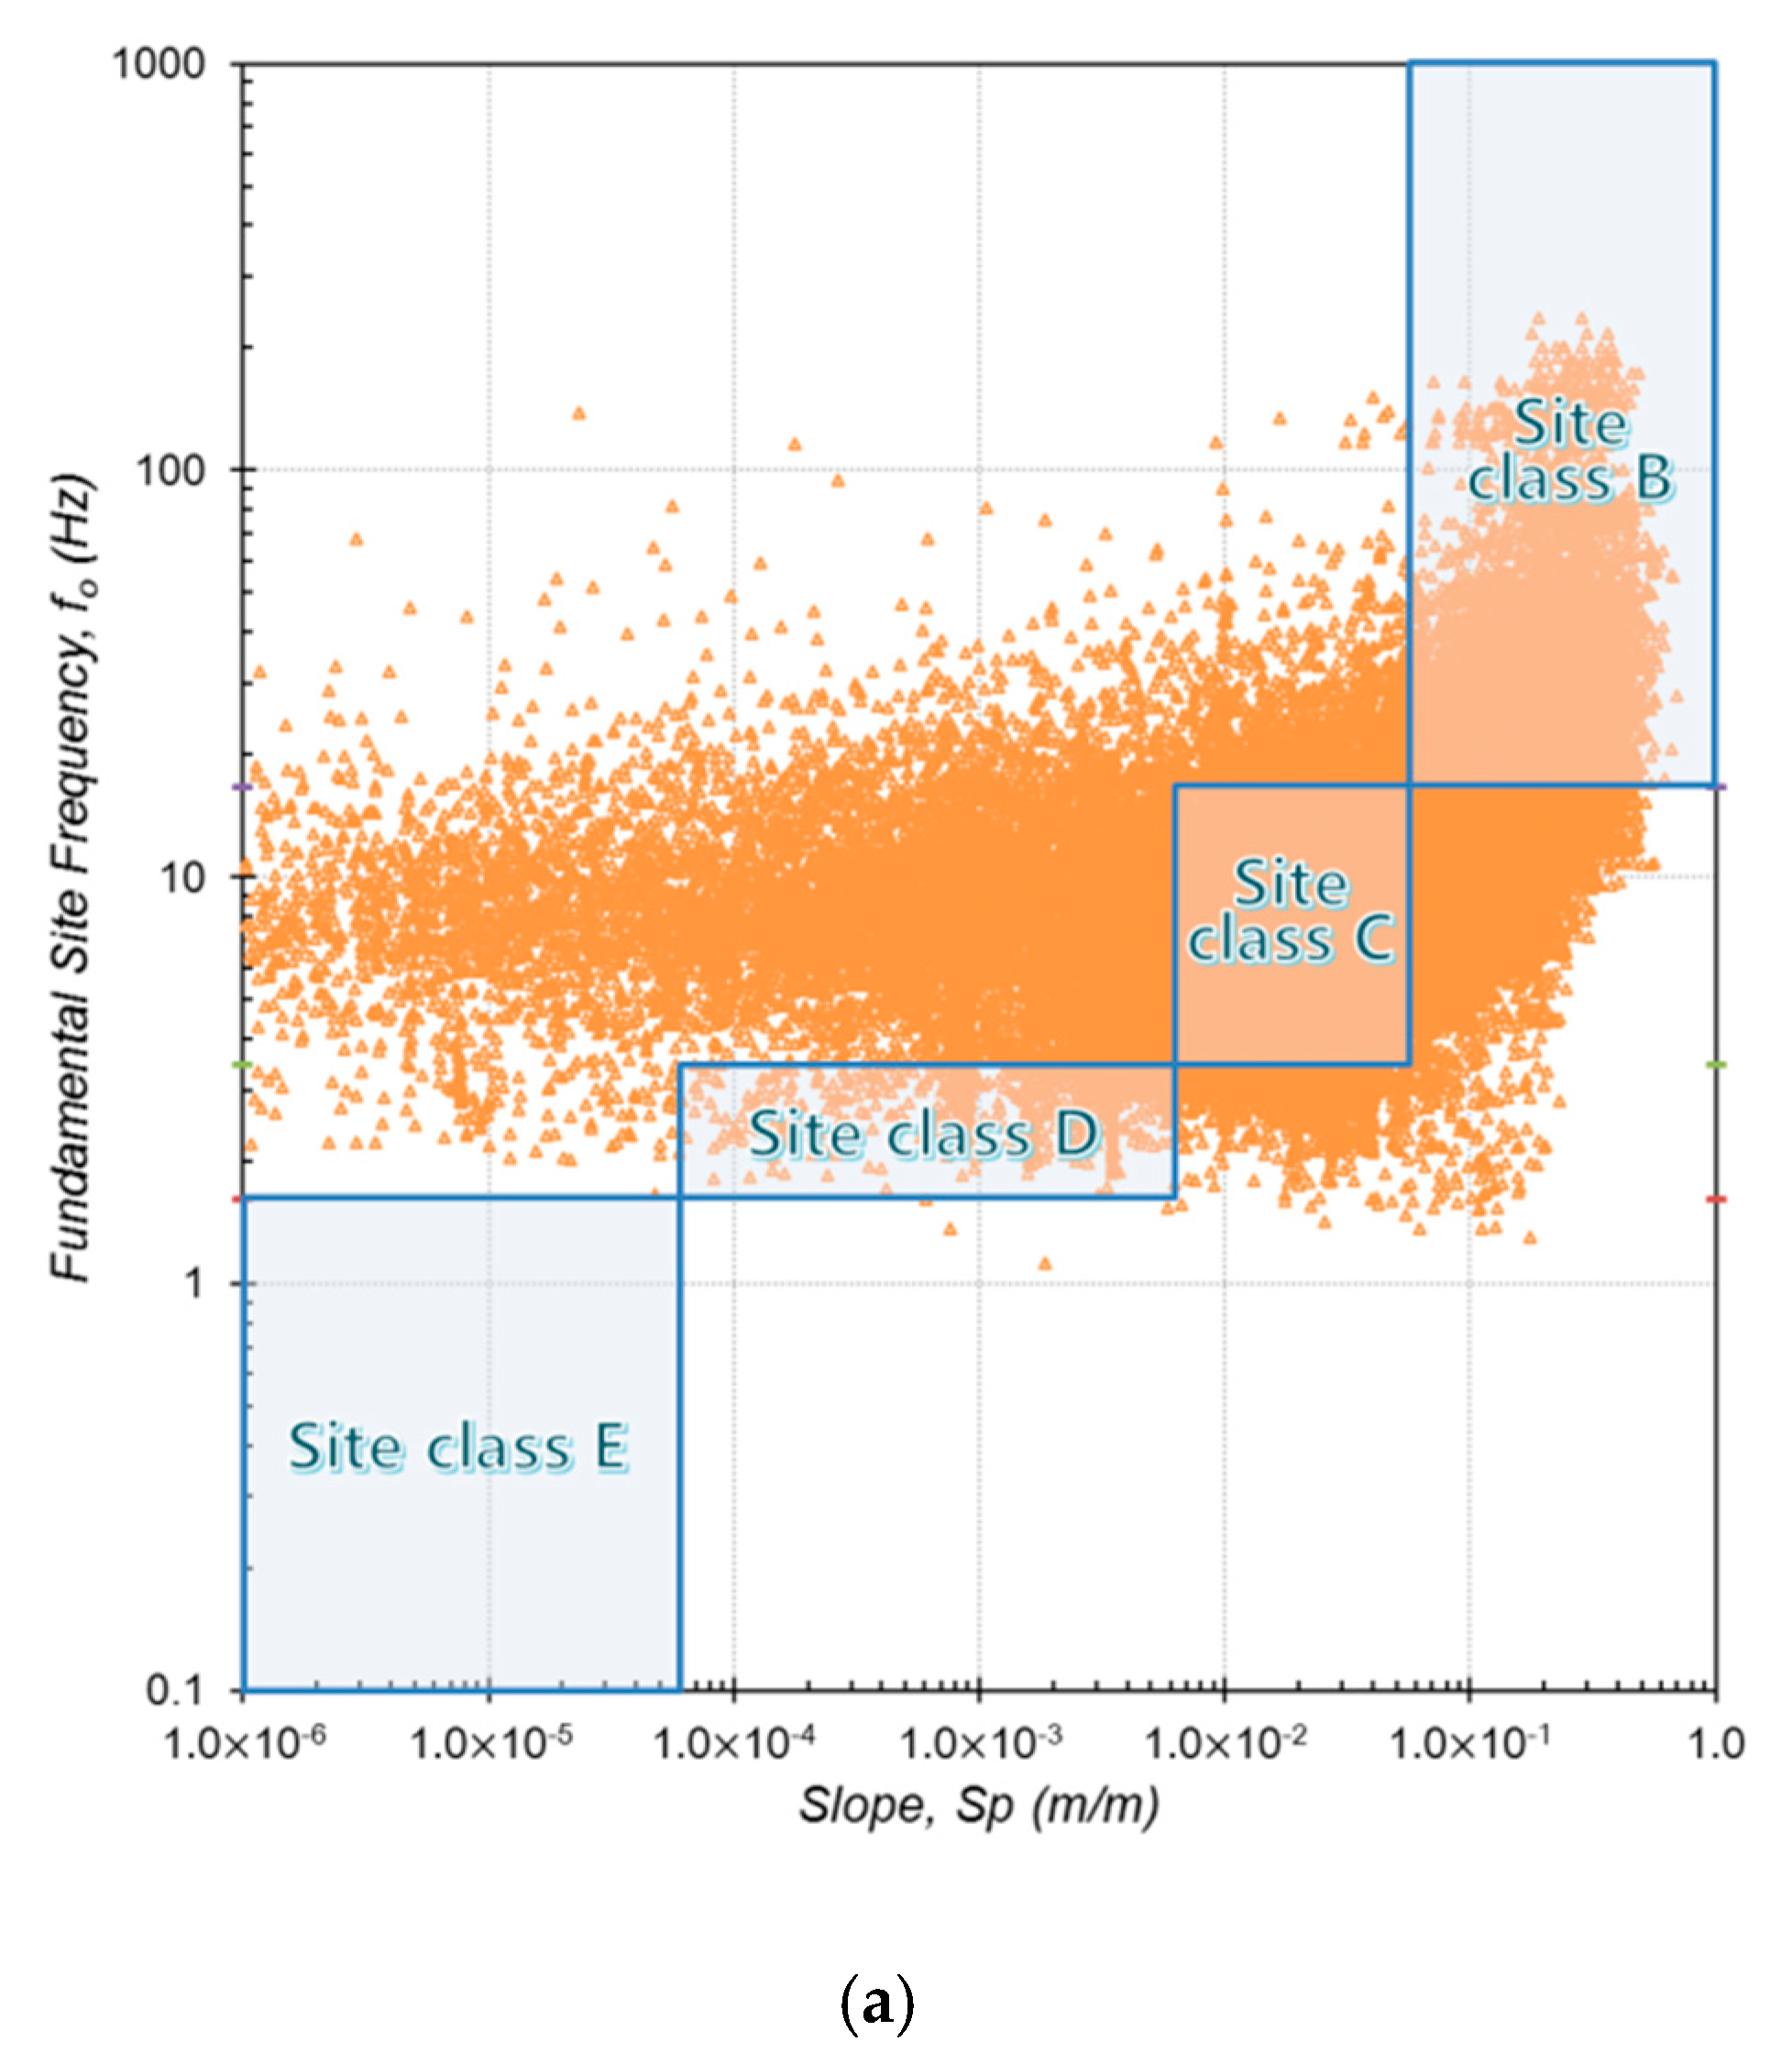
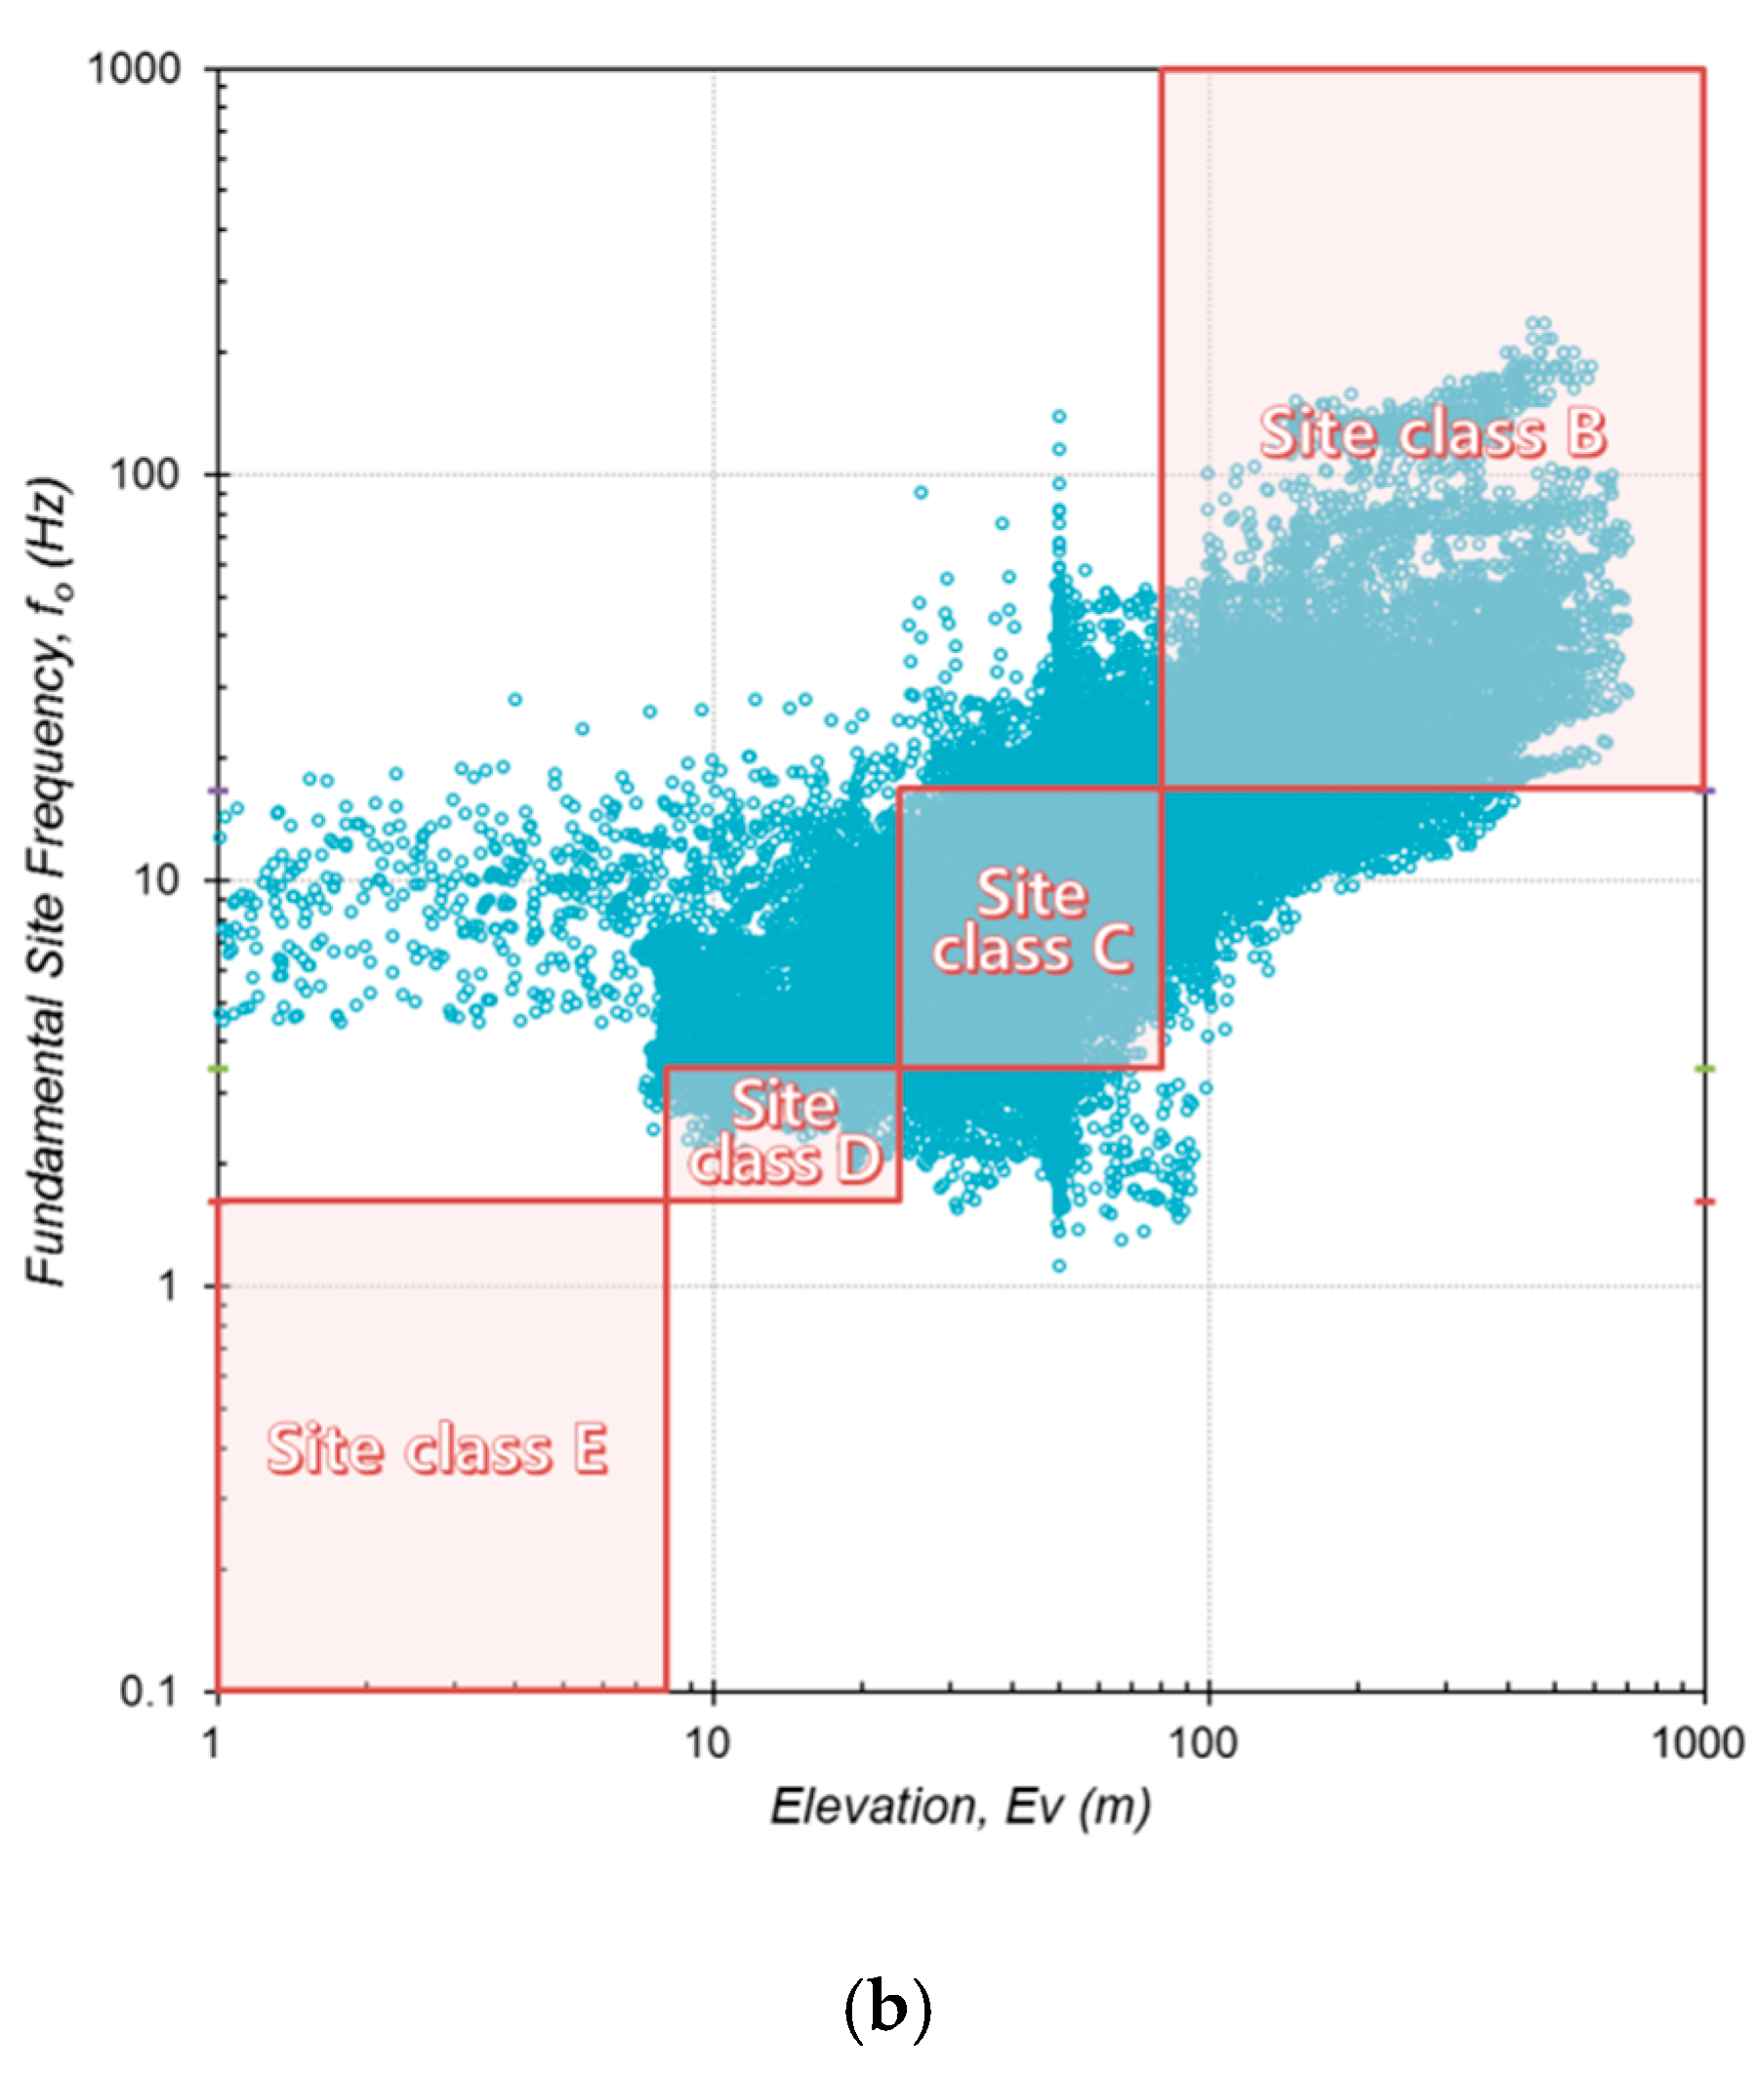
Geo-proxy-based empirical preliminary classification for each site classification condition according to f0 (TG) in Seoul: (a) surface terrain slope; (b) surface elevation.
Figure 8.
Geo-proxy-based empirical preliminary classification for each site classification condition according to f0 (TG) in Seoul: (a) surface terrain slope; (b) surface elevation.


Figure 9.
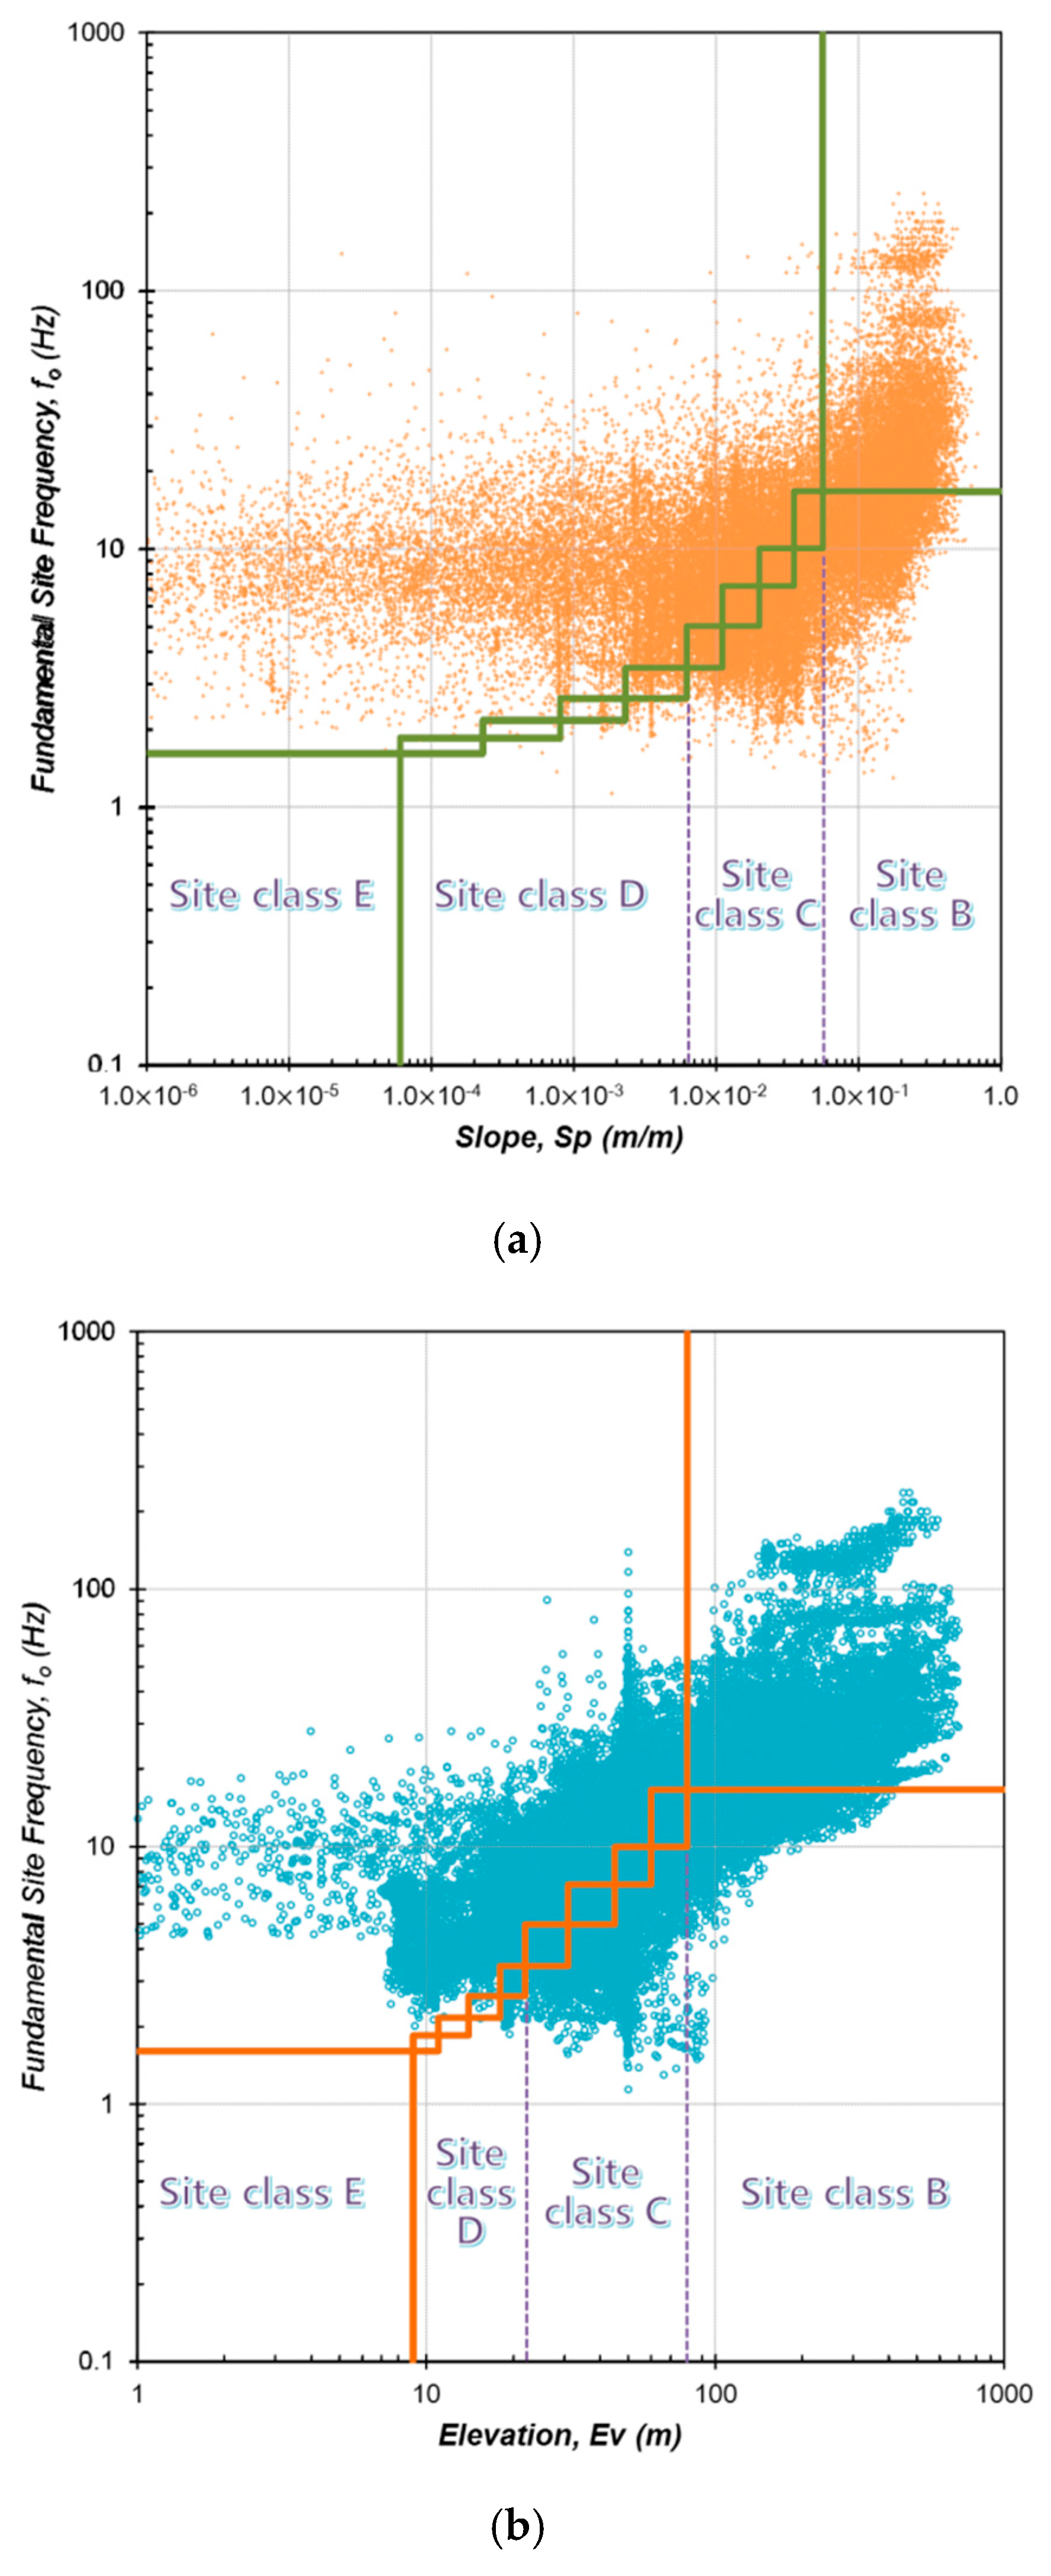
Geo-proxy-based empirical classification for each site classification subdivision according to f0 (TG) in Seoul: (a) surface terrain slope; (b) surface elevation.
Figure 9.
Geo-proxy-based empirical classification for each site classification subdivision according to f0 (TG) in Seoul: (a) surface terrain slope; (b) surface elevation.

Figure 10.
3D view of spatial distribution of site classes in Incheon based on the proposed site response parameters: (a) H; (b) VS30; (c) TG.
Figure 10.
3D view of spatial distribution of site classes in Incheon based on the proposed site response parameters: (a) H; (b) VS30; (c) TG.


Figure 11.
3D view of spatial distribution of seismic site classes in Incheon based on the proposed geo-proxy parameters: (a) elevation (proposed criterion); (b) slope [15]; (c) slope (proposed criterion).
Figure 11.
3D view of spatial distribution of seismic site classes in Incheon based on the proposed geo-proxy parameters: (a) elevation (proposed criterion); (b) slope [15]; (c) slope (proposed criterion).
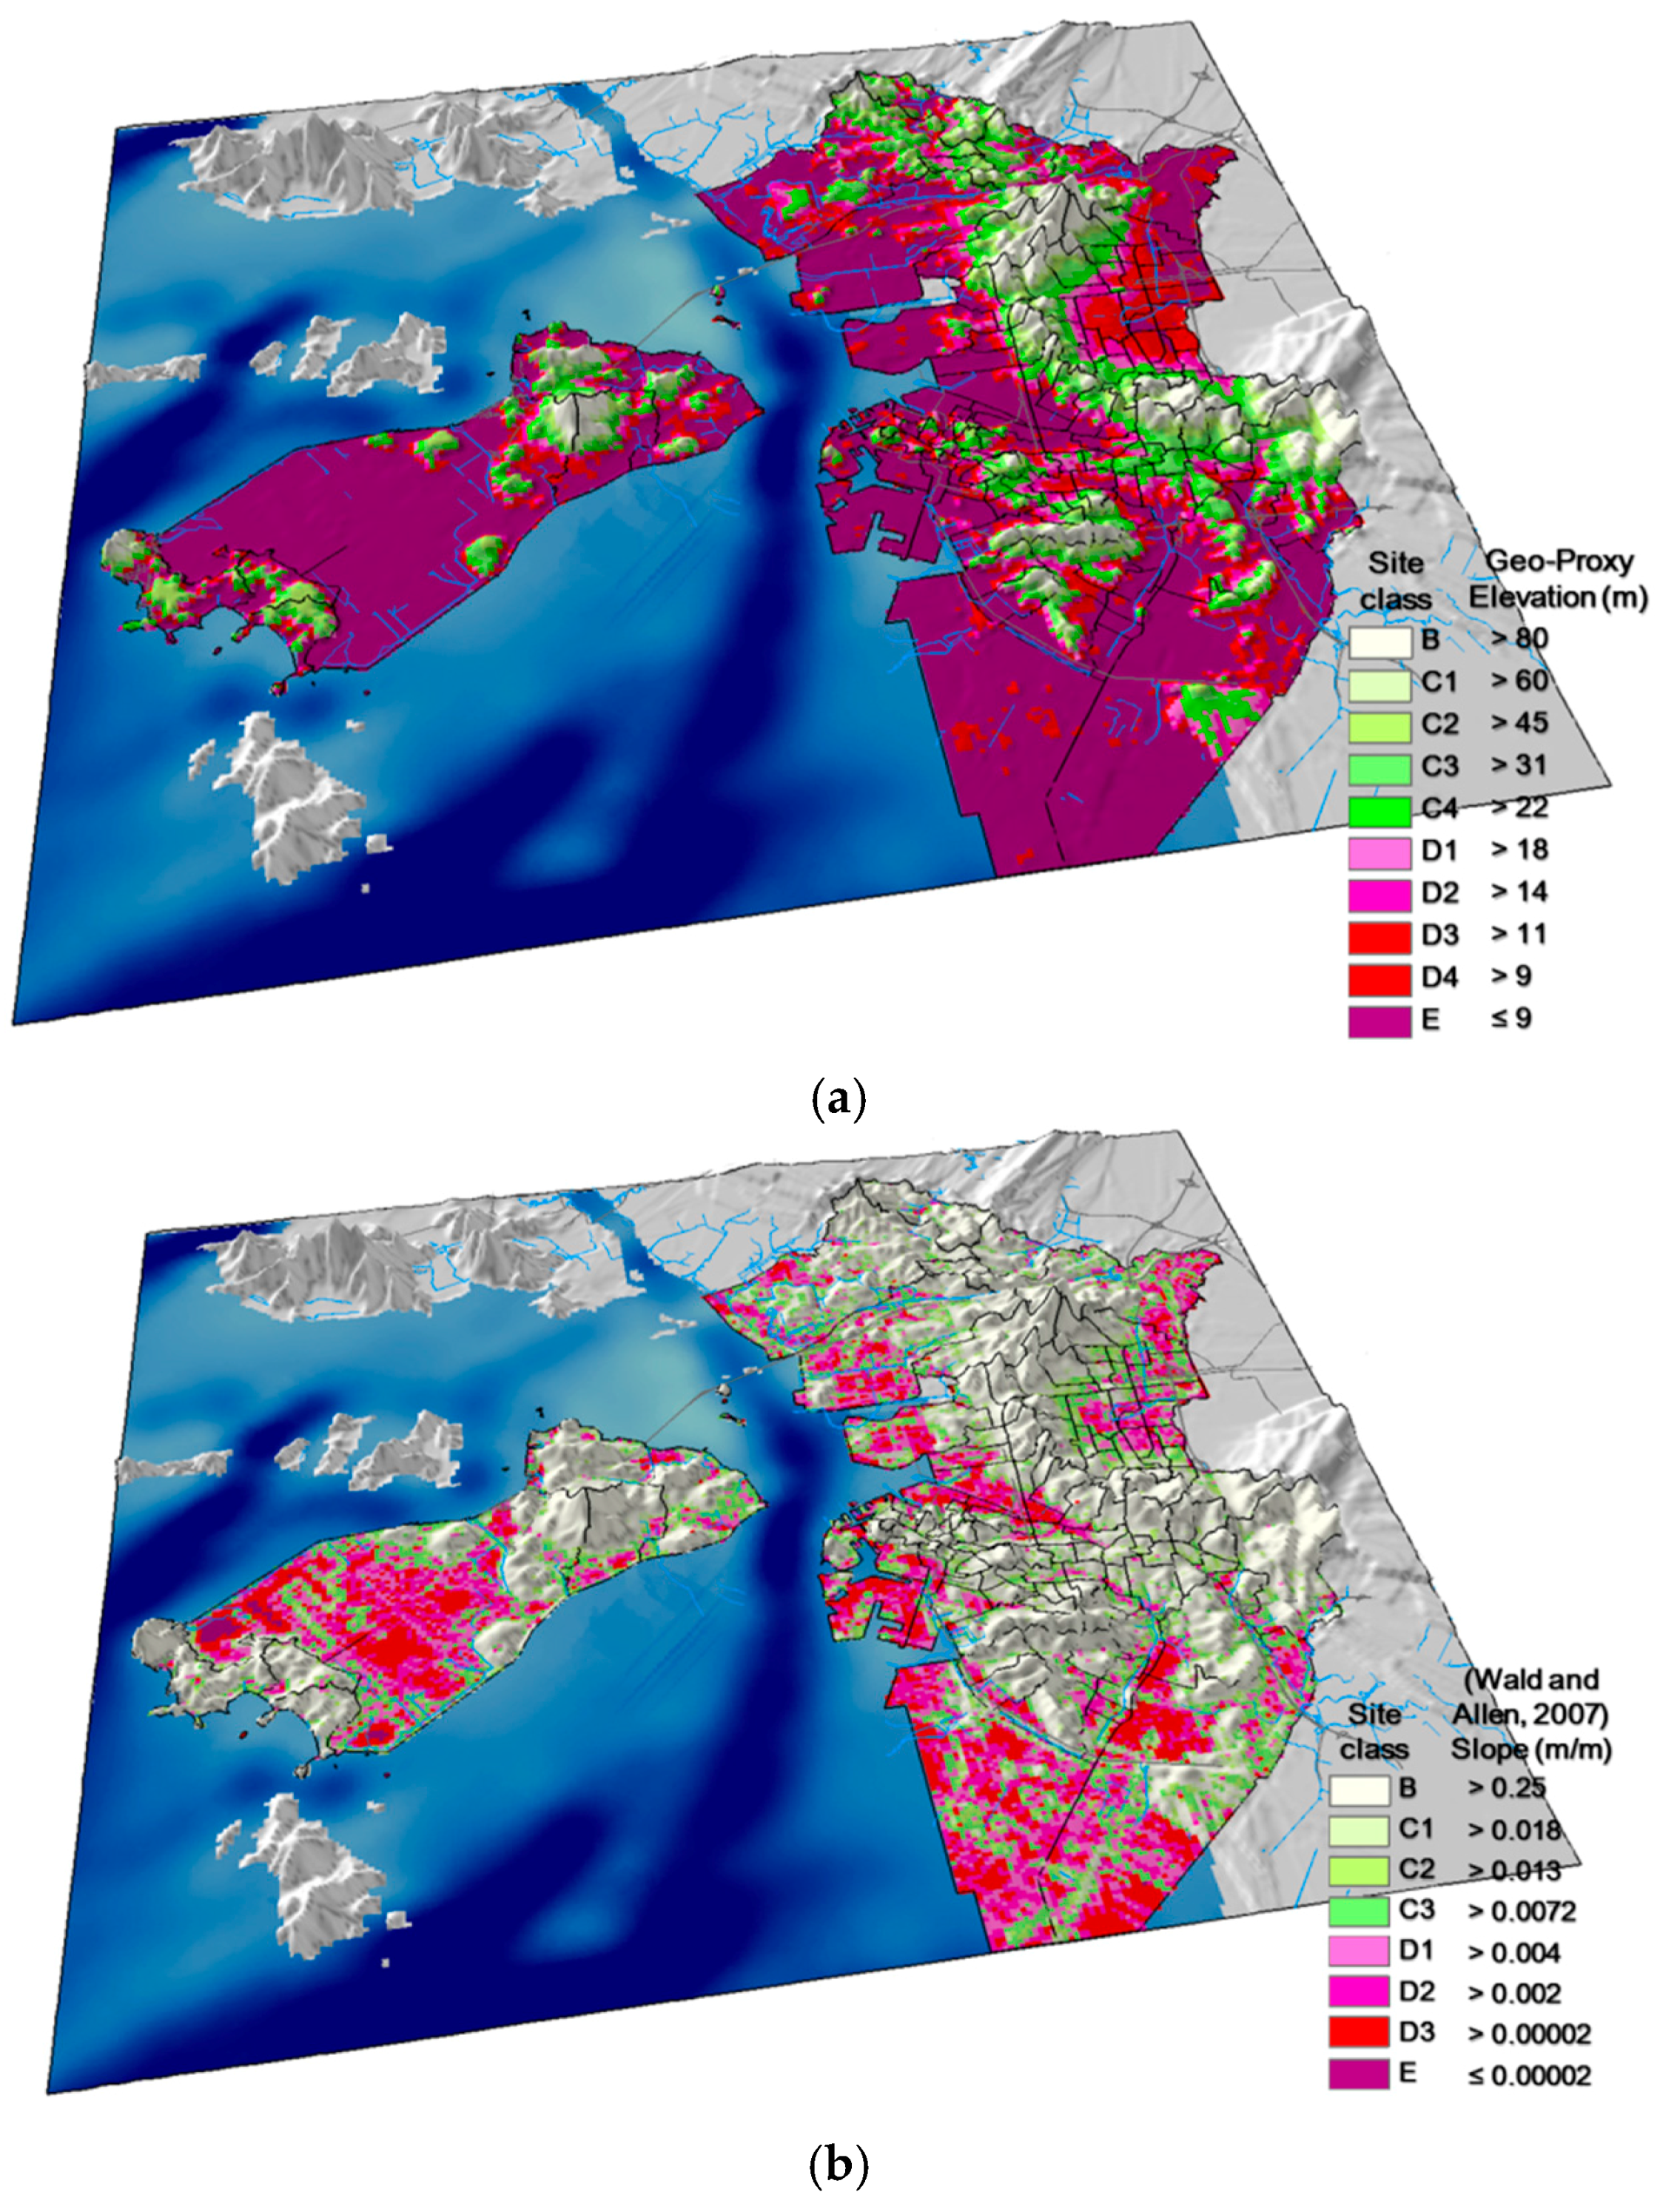

Figure 12.
3D view of seismic zonation with administrative sub-units by computing the average TG and the proposed geo-proxy for each unit in the study area of Incheon: (a) TG; (b) slope (proposed criterion).
Figure 12.
3D view of seismic zonation with administrative sub-units by computing the average TG and the proposed geo-proxy for each unit in the study area of Incheon: (a) TG; (b) slope (proposed criterion).


Table 1.
Domestic site classification system applying criteria including the site period (modified after Sun [4]).
Table 1.
Domestic site classification system applying criteria including the site period (modified after Sun [4]).
| Generic Description | Site Class | Criteria | Site Coefficients | ||||||
|---|---|---|---|---|---|---|---|---|---|
| Current | This Study | H (m) | VS30 (m/s) | VSDS (m/s) | TG (s) | Fa | Fv | ||
| Rock | A | B | <6 | >760 | >760Cs | <0.06 | 1.00 | 1.00 | |
| B | |||||||||
| Weathered Rock and Very Stiff Soil | C | C | C1 | <10 | >620 | >620Cs | <0.10 | 1.28 | 1.04 |
| C2 | <14 | >520 | >520Cs | <0.14 | 1.45 | 1.09 | |||
| Intermediate Stiff Soil | C3 | <20 | >440 | >440Cs | <0.20 | 1.65 | 1.13 | ||
| C4 | <29 | >360 | >360Cs | <0.29 | 1.90 | 1.19 | |||
| Deep Stiff Soil | D | D | D1 | <38 | >320 | >320Cs | <0.38 | 2.08 | 1.23 |
| D2 | <46 | >280 | >280Cs | <0.46 | 2.26 | 1.29 | |||
| D3 | <54 | >240 | >240Cs | <0.54 | 2.48 | 1.36 | |||
| D4 | <62 | >180 | >180Cs | <0.62 | 2.86 | 1.43 | |||
| Deep Soft Soil | E | E | ≥62 | ≤180 | ≤180Cs | ≥0.62 | 1.50 | 2.00 | |
Table 2.
Spatial distribution of geotechnical layer thickness based on geo-spatial grid information in the Seoul and Incheon areas.
Table 2.
Spatial distribution of geotechnical layer thickness based on geo-spatial grid information in the Seoul and Incheon areas.
| Area | Thickness of Fill (m) | Thickness of Alluvial Soil (m) | Thickness of Weathered Soil (m) | Thickness of Weathered Rock (m) |
|---|---|---|---|---|
| Seoul |  |  |  |  |
| Incheon |  |  |  |  |
Table 3.
Empirical slope range for site classification according to VS30 of NEHRP (National Earthquake Hazards Reduction Program) [15]
Table 3.
Empirical slope range for site classification according to VS30 of NEHRP (National Earthquake Hazards Reduction Program) [15]
| Site Class | Slope, Sp (m/m) | ||
|---|---|---|---|
| Class | Criterion, VS30 (m/s) | Active Tectonics | Stable Continent |
| B | 760 < VS30 | 0.138 < Sp | 0.025 < Sp |
| C | 620 < VS30 ≤ 760 | 0.10 < Sp ≤ 0.138 | 0.018 < Sp ≤ 0.025 |
| 490 < VS30 ≤ 620 | 0.050 < Sp ≤ 0.10 | 0.013 < Sp ≤ 0.018 | |
| 360 < VS30 ≤ 490 | 0.018 < Sp ≤ 0.050 | 0.0072 < Sp ≤ 0.013 | |
| D | 300 < VS30 ≤ 360 | 0.0063 < Sp ≤ 0.018 | 0.004 < Sp ≤ 0.0072 |
| 240 < VS30 ≤ 300 | 0.0022 < Sp ≤ 0.0063 | 0.002 < Sp ≤ 0.004 | |
| 180 < VS30 ≤ 240 | 0.0001 < Sp ≤ 0.0022 | 0.00002 < Sp ≤ 0.002 | |
| E | VS30 ≤ 180 | Sp ≤ 0.0001 | Sp ≤ 0.00002 |
Table 4.
Existing and proposed systems for site classification based on the proxy of surface slope.
| Site Class | Criteria | Proxies | ||||
|---|---|---|---|---|---|---|
| VS30 (m/s) | TG (s) | f0 (Hz) | Slope, Sp (m/m) | Elevation, Ev (m) | ||
| Stable Continent [15] | South Korea (Proposed in This Study) | South Korea (Proposed in This Study) | ||||
| B | >760 | <0.06 | >16.67 | >0.025 | >0.056 | >80 |
| C | >620 | <0.10 | >10.00 | >0.018 | >0.002 | >52 |
| >520 | <0.14 | >7.14 | >0.013 | >0.001 | >33 | |
| >360 | <0.29 | >3.45 | >0.0072 | >0.0062 | >22 | |
| D | >320 | <0.38 | >2.63 | >0.004 | >0.0026 | >16 |
| >280 | <0.46 | >2.17 | >0.002 | >0.0016 | >12 | |
| >180 | <0.62 | >1.61 | >0.00002 | >0.00006 | >9 | |
| E | ≤180 | ≥0.62 | ≤1.61 | ≤0.00002 | ≤0.00006 | ≤9 |
Table 5.
Geo-proxy-based empirical site classification proposal according to the slope and elevation for domestic application.
Table 5.
Geo-proxy-based empirical site classification proposal according to the slope and elevation for domestic application.
| Generic Description | Site Class | Criteria | Geo-Proxies | ||||
|---|---|---|---|---|---|---|---|
| VS30 (m/s) | TG (s) | f0 (Hz) | Slope, Sp (m/m) | Elevation, Ev (m) | |||
| Rock | B | >760 | <0.06 | >16.67 | >0.056 | >80 | |
| Weathered Rock and Very Stiff Soil | C | C1 | >620 | <0.10 | >10.00 | >0.035 | >60 |
| C2 | >520 | <0.14 | >7.14 | >0.02 | >45 | ||
| Intermediate Stiff Soil | C3 | >440 | <0.20 | >5.00 | >0.011 | >31 | |
| C4 | >360 | <0.29 | >3.45 | >0.0062 | >22 | ||
| Deep Stiff Soil | D | D1 | >320 | <0.38 | >2.63 | >0.0023 | >18 |
| D2 | >280 | <0.46 | >2.17 | >0.0008 | >14 | ||
| D3 | >240 | <0.54 | >1.85 | >0.00023 | >11 | ||
| D4 | >180 | <0.62 | >1.61 | >0.00006 | >9 | ||
| Deep Soft Soil | E | ≤180 | ≥0.62 | ≤1.61 | ≤0.00006 | ≤9 | |
© 2018 by the authors. Licensee MDPI, Basel, Switzerland. This article is an open access article distributed under the terms and conditions of the Creative Commons Attribution (CC BY) license (http://creativecommons.org/licenses/by/4.0/).
Share and Cite
MDPI and ACS Style
Sun, C.-G.; Kim, H.-S.; Cho, H.-I. Geo-Proxy-Based Site Classification for Regional Zonation of Seismic Site Effects in South Korea. Appl. Sci. 2018, 8, 314. https://doi.org/10.3390/app8020314
AMA Style
Sun C-G, Kim H-S, Cho H-I. Geo-Proxy-Based Site Classification for Regional Zonation of Seismic Site Effects in South Korea. Applied Sciences. 2018; 8(2):314. https://doi.org/10.3390/app8020314
Chicago/Turabian StyleSun, Chang-Guk, Han-Saem Kim, and Hyung-Ik Cho. 2018. "Geo-Proxy-Based Site Classification for Regional Zonation of Seismic Site Effects in South Korea" Applied Sciences 8, no. 2: 314. https://doi.org/10.3390/app8020314
Note that from the first issue of 2016, this journal uses article numbers instead of page numbers. See further details here.