Article

Multidimensional Analysis of the Effects of Waste Materials on Physical and Mechanical Properties of Recycled Mixtures with Foamed Bitumen

Department of Transportation Engineering, Faculty of Civil Engineering and Architecture, Kielce University of Technology, Al. Tysiąclecia Państwa Polskiego 7, 25-314 Kielce, Poland
*
Author to whom correspondence should be addressed.
Appl. Sci. 2018, 8(2), 282; https://doi.org/10.3390/app8020282
Submission received: 5 December 2017 / Revised: 30 January 2018 / Accepted: 6 February 2018 / Published: 13 February 2018
(This article belongs to the Section Materials Science and Engineering)

Abstract

:
The paper reports the results from the tests of recycled mixture samples containing waste materials. Six types of waste materials were used in the mineral mix, in various configurations. Statistical inference was based on the multidimensional analysis through the reduction of input data size. Three groups of recycled mixtures were identified, each representing significantly different properties. The first group included rigid recycled mixtures, the second group comprised flexible mixtures, and those with the lowest cohesion and rigidity were in the third group. The statistical inference demonstrated that the recycled mixtures with waste materials to be most recommended were those with a high bitumen content (>2.5%). A high proportion of reclaimed asphalt pavement material was found to provide high performance of the recycled mixture, whereas recycled aggregate reduced the stiffness of the mix and its resistance to moisture.

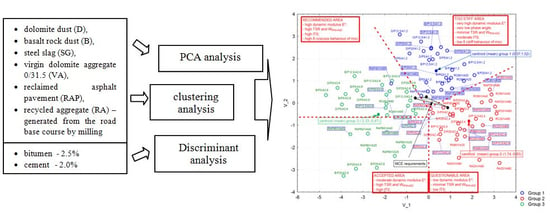
Graphical Abstract

1. Introduction

Over the last 20 years, recycling technology has shown its potential for maintaining and renovating road pavements [1,2]. Environmental and economic considerations influenced the development of effective cold recycling technology [3,4] and, in particular, cold in-place recycling with foamed bitumen, which is currently being used for the rehabilitation of expressways and pavement structural layers under variable levels of municipal traffic loads [5]. Cold recycled mixtures with foamed bitumen show better cohesion compared to unbound mixes. Depending on the amounts of foamed bitumen and active filler used, physical and mechanical properties may vary from those of recycled mixtures used in base courses to those of conventional [6,7]. The literature on the use of waste materials in deep recycling with foamed bitumen is limited. However, in recent times some trials with marginal materials in Europe have been carried out [8,9]. The attention typically focuses on applications of recycled materials from pavement surface reclamation [10,11] with authors pointing to the use of high quality virgin aggregate. Mineral–cement–emulsion (MCE) requirements impose the use of large quantities of virgin aggregates, which reduces the advantages of using MCE [12]. Waste materials as an equivalent of virgin aggregate can provide a favorable economic balance. In addition, their use does not adversely affect the properties of recycled mixes. Aside from certain recommendations for MCE mix design [13] and requirements developed based on experimental studies on recycled mixtures with foamed bitumen, namely mineral–cement mixture with foamed bitumen (MCAS) [14], no comprehensive requirements for recycled mixtures with foamed bitumen and waste materials exist in Poland. It should be taken into consideration that the mechanism of foamed bitumen effect on the structure of the recycled mixture is slightly different from the mechanism observed in the classical cement-emulsion mixture [7]. The literature lacks general information on the influence of a wider range of waste materials or high reclaimed asphalt aggregate (RAP) content. This paper discusses possible application of waste materials at various proportions to the mineral skeleton of recycled mixtures. The primary objective was to identify the nature of their effects on the mix properties. Advanced statistical algorithms were used to perform multidimensional analysis to determine the nature of influence of recycled materials on the mineral–cement mixture with foamed bitumen (MCAS). This grouping analysis has been made on the basis of results relating only to the physical and visco-elastic properties of waste materials of ongoing work of RID research project.

2. Materials and Testing

2.1. Composition of Mineral-Cement Mixtures with Foamed Bitumen

Six types of mineral-cement mixtures with foamed bitumen (MCAS) were used. The design of the recycled mix composition was modified by varying bitumen amount and, above all, quantity and type of waste materials added. The following waste materials were used in the experiment:
  • dolomite dust (D),
  • basalt rock dust (B),
  • steel slag (SG),
  • virgin dolomite aggregate 0/31.5 (VA),
  • reclaimed asphalt pavement (RAP),
  • recycled aggregate (RA)—generated from the road base course by milling,
  • recycled cement concrete (RC).
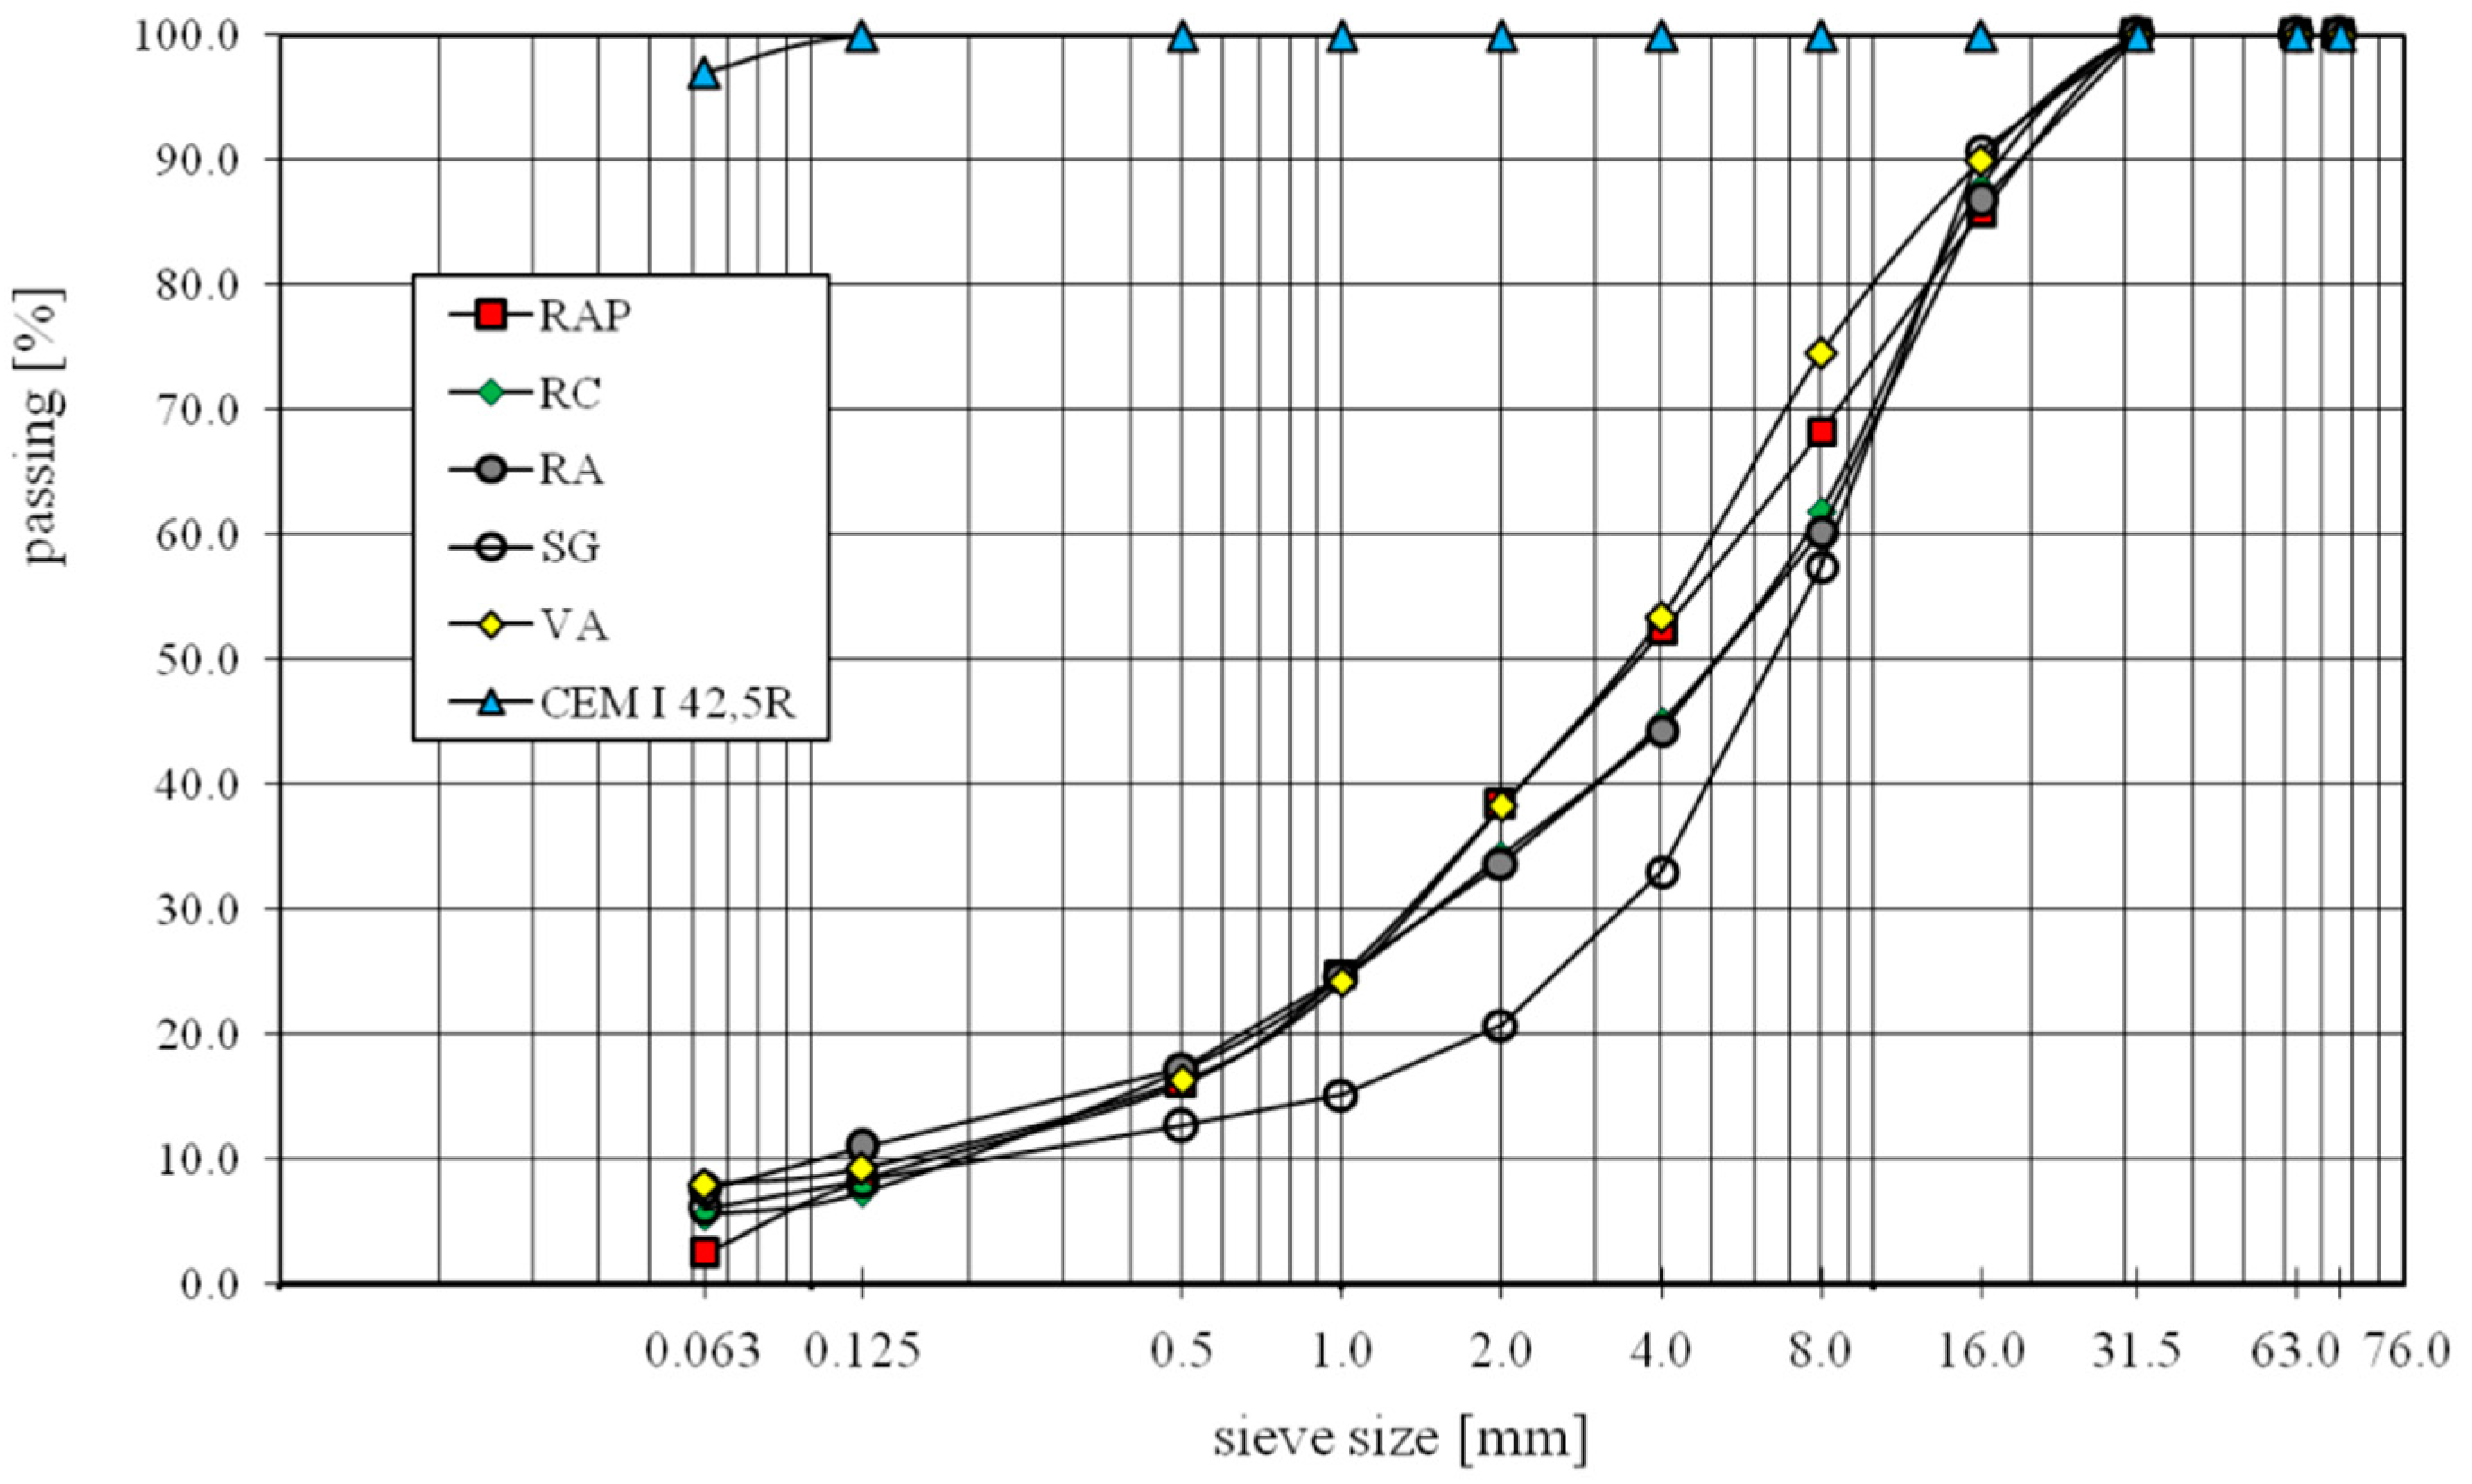
The principal aim when designing MCAS was to choose additional waste materials with similar granulometric compositions. The basic virgin aggregate (VA) had a continuous gradation curve with a maximum “D” grain size of 31.5 mm and complied with Polish requirements WT-2010 [15] based on EN 13242 [16]. In order to provide the required size aggregate to be used in a Marshall sample, constituents of the recycled waste materials were screened through a #22.4 mm sieve. The mineral mix was designed following the Wirtgen guidelines [7]. The target range defined by the limiting curves [7] allowed adding more dust, thus creating a possibility of considering a variant of recyclable mixture containing basalt and dolomite dust. The grading curves of the materials used are shown in Figure 1.
The experiment was designed to assign the samples of MCAS recycled mixtures to appropriate mix types in a series of tests using a single plot of the grading curve. Consequently, the basic mineral skeleton of the recycled mixture remained the same. Variables were the combinations of waste material proportions or mineral dust quantities. Note that the gradation of the reclaimed cement concrete (RC) and the reclaimed aggregate (RA) components was almost identical, which greatly facilitated interpretation of the test results. It should be added that the marginal material denoted as a mineral dust (derived from dedusting system by extraction of aggregates in the mine) in accordance to Polish standards and regulations was a waste material. The same inactive dusts were used and analyzed in paper [17].
Mixture types and assumptions in the form of waste material quantities are compiled in Table 1.
Cement content (Table 1) was established at the average value from the recommended range [18]. In recycled mixtures, the amount of foamed bitumen was also established at the average level of 2.5%. The mixtures containing mineral dust were an exception. The material derived from recycled pavement (RAP) was tested for quality in compliance with WT-2/2010 [15].

2.2. Tests and Criteria

The mineral-cement mixture with foamed bitumen (MCAS) should have adequate physical and mechanical parameters. The following parameters were used for the evaluation of the MCAS:
  • air void content (Vm) to EN 12697-8 [19],
  • water absorption (Nw),
  • density ρSSD to EN 12697-6 [20],
  • indirect tensile strength (ITS) to EN 12697-23 [21] and to [22],
  • dynamic modulus E* (DTC-CY) to EN 12697-26 D [23],
  • resistance to moisture damage (TSR) to AASHTO T283 [24],
  • resistance to moisture damage (WRW-2M) after two freezing cycles (modified method) on the basis of conclusions in [25,26]
Cylindrical specimens for testing the dynamic stiffness modulus were prepared using a gyratory compactor in accordance with EN 12697-31 [27]. The dimensions of the specimens had to meet the H(height)/D(diameter) > 1.8 requirement. The parameters of the gyratory press were set based on the review of the literature [28,29]. The density of the gyratory specimens had to be approximately the same as that of the specimens compacted using the modified method indicated in [11,12]. The modification involved static loading of the specimen with a force of 80 kN for 180 s. The number of test specimens depended on the provisions of the standards according to which the tests were carried out. Nevertheless, after removing outliers, at least three specimens had to be used.
The number of freezing cycles for determining the resistance to moisture damage (WRW-2M) was established from the findings that the stiffness modulus reduced noticeably after 2 freezing cycles [16]. This test was performed to supplement the TSR test. The dynamic stiffness modulus (E*) was determined in the DTC-CY test to extend the analysis of classical results over the rheological properties of the recycled mixtures with waste materials, conducted at various temperatures and loading times. A possibility of applying sinusoidal load helped determine the phase angle (δ). The load was applied at frequencies: 0.1 Hz, 0.3 Hz, 1 Hz, 3 Hz, 10 Hz and 20 Hz. Test temperatures used were as follows: −7 °C, 5 °C, 13 °C, 25 °C and 40 °C. To comply with [22,30], where the stiffness of the recycled mixtures has to be evaluated in the IT-CY, the stiffness modulus was also determined using the DTC-CY method at a temperature of 5 °C and frequency of 10 Hz. All the requirements set forth in [22] and those concerning ITS [31] are represented in diagrams with respect to the clusters obtained.

3. Multidimensional Analysis

It is difficult to analyze dynamic data in materials engineering without multidimensional techniques of data exploration which follow advanced mathematical formalism and iterative procedures with large matrices. The statistical multidimensional analysis of the dataset of MCAS and waste materials was performed using the STATISTICA package. In this analysis, 3150 single measurements were grouped based on 35 parameters. Given the large amount of data and the high number of recycled mixtures with various compositions, identification of patterns in the datasets was the priority issue. The presence of certain clusters and general patterns in the dataset under analysis was very helpful if only from the standpoint of developing design recommendations and criteria. Classical regression methods would be infeasible in the evaluation of one arbitrarily adopted variable with respect to other independent variables in the dataset. Failure to account for the relationships between dependent variables {Y1, Y2, …, Yn} and those determined as independent variables {X1, X2, …, Xn} would distort evaluation results [32]. The main reason for which classical regression methods could not be used in this study was the collinearity of variables, i.e., redundancy in the model. High correlation among independent variables in the sets disqualified inference based on multiple regression models. Elimination of independent variable collinearity required using the principal components analysis (PCA) [33]. The more detailed information on used algorithm can be find in work [34]. The main task of this data transformation is to reduce the number of variables in the analysis and the proportion of correlation between the variables. The reduced number of new uncorrelated variables is a linear combination of original variables (determined parameters in the experiment) according to (1):
i   >   2 X i = a i 1 · X 1 + a i 2 · X 2 + + a i k · X k
where:
  • X 1 —raw variable (standardized),
  • X i —new uncorrelated variable,
  • k —the number of principal components,
  • a i 1 —eigenvectors of correlation
This procedure allows fulfilling the main assumption of canonical analysis required to discriminate sets with similarity of the set of features, unlike in the classical regression method, where the reference is made to one variable. For example, in the case of two mixtures with the same stiffness modulus, but with significantly different air void contents, stating their similarity in terms of durability would be incorrect. The purpose of the procedure used in this study was to eliminate relations of that kind in determining the suitability of a given waste material. The last element required before carrying out the correct multidimensional analysis on the set of recycled mixture results was to determine the initial number of sets. The tools in taxonomy were used [35]. It was necessary to initially group the set of objects (specimens) in such a way that the objects in the same group were similar to one another, but, to satisfy the separation property, different from the objects in other groups. In this case, a set of complex grouping algorithms was used. Among a number of available cluster algorithms, Ward’s method is based on the classical analysis of variance, which is to minimize the sum of squared distances from all points within the cluster [32]. As a result, we get a cluster with minimal data variation, which is important for analyzing the set of results obtained for recycled mixtures with waste materials and foamed bitumen. As a measure of group association, Pearson’s 1 − r coefficient (r—the Pearson correlation coefficient) was used. The algorithm of the whole process of inference is presented as a block diagram in Figure 2.
As a result, a set of information was obtained and generalizations were made to quickly classify the results of the study and to compare the statistical results of the groups with respect to the requirements. Assignment of individual recycled mixtures with different types of waste materials will allow more accurate differentiation between the causes and identification of patterns that formed the homogeneous groups.

4. Test Results

4.1. Principal Components Analysis

The data dimensionality was reduced with the PCA method, which sought to find linear transformational functions that would bind the highest possible number of highly-correlated variables. The outlier results were eliminated first. Outlier values were those that were outside the 1.5 interquartile range [34]. After the elimination step, a correlation table was prepared. Analysis of the correlation table data indicates that features such as Vm, Nw, ρssd and ITS are correlated at the significance level of R2 > 0.5. Parameters TSR and WRW+M2 are correlated significantly at R2 > 0.58. The highest collinearity occurs between the set of dynamic modulus E* results and the set of phase angle δ results, regardless of frequency level or test temperature used. The coefficient of determination is several times higher than 0.9. Both E* and δ are also strongly correlated with the recycled mixtures physical properties (Vm, Nw) and with ITS. The strong correlation in the group of rheological parameters, E and δ, makes constructing any classical model using multiple regression impractical. The inverse of the correlation matrix in the model would also be difficult. As a result, the PCA method turned out to be the best solution because it allowed the transformation of the measured parameter values into a new data set in such a way that new variables would be maximally uncorrelated with each other. Further analyzes were performed on new variables (new principal components).
With PCA the total number of original variables were reduced to 4 new variables. The Kaiser criterion [36] was adopted, according to which the number of factors in the analysis could have factor loadings greater than 1, and the proportion of the variance explained was more than 85%. The results of the analysis are in Table 2.
Finally, the phenomenon of collinearity between variables was eliminated when by the lost in representation quality approximately of 11%. Note that variable 5 did not make any significant contribution to explaining the 2.2% variability in the dataset. Thereby, the number of variables was limited to 4 using the Kaiser criterion. At this stage in the analysis, each new variable was functionally related with the real variables introduced into the dataset. The correlation and eigenvector table (Table 3) shows the nature of the relationship between raw variables and the given new grouping variable.
Using results of eigenvectors together with the mean and the standard deviation statistics in Table 3 every new result out of analysis can be transformed to new collection of uncorrelated variables (Z1–Z4). Note that all the results of the elastic stiffness modulus (E) and the phase angle (δ) showed the highest correlation with the first variable (Z1). This factor, based on Table 2, explains almost 57% of the variation in the entire dataset. It should be noted that between moduli determined at different temperatures (in viscoelastic range) there were a relationship according to well know TTSP (time temperature superposition principle). The impact of the stiffness modulus and phase angle parameters on the observed data set were expressed by the parameter Z1 which defines the viscoelastic character of the recycled mixes. The presented analysis assumed the possibility of entering missing stiffness modulus data on the basis of the results coming from the leading curve.
Factor Z1 is in fact responsible for the rheological characteristics in the linear viscoelasticity range of the recycled mixtures. It gather a whole impact of stiffness modulus and phase angle at all. Regardless of how many stiffness modulus measurements were made its influence on analysis will be the greatest. The second variable (Z2) is strongly correlated with air void content (Vm) and absorption (Nw), and moderately correlated with indirect tensile strength (ITS) and viscous behavior of specimens at high temperature as shown by (δ) measurement. This variable explains about 21% of the variation in the population. The third variable (Z3) is correlated with the parameters responsible for moisture resistance. The portion of variation it explains is only about 6%, which can probably be attributed to the low sensitivity to the presence of water of the set of MCAS mixtures with waste materials. The last variable (Z4) explains only 4.6% (Table 3) of data variation in the dataset, and is correlated mainly with the density of recycled mixtures in conjunction with moisture resistance. The low proportion of variation in (Z4) is probably caused by the presence of “heavy-weight” steel slag aggregate. The new variables providing a global view of the set of effects were used in the process of grouping objects in the dataset of the recycled mix specimens.

4.2. Cluster Analysis

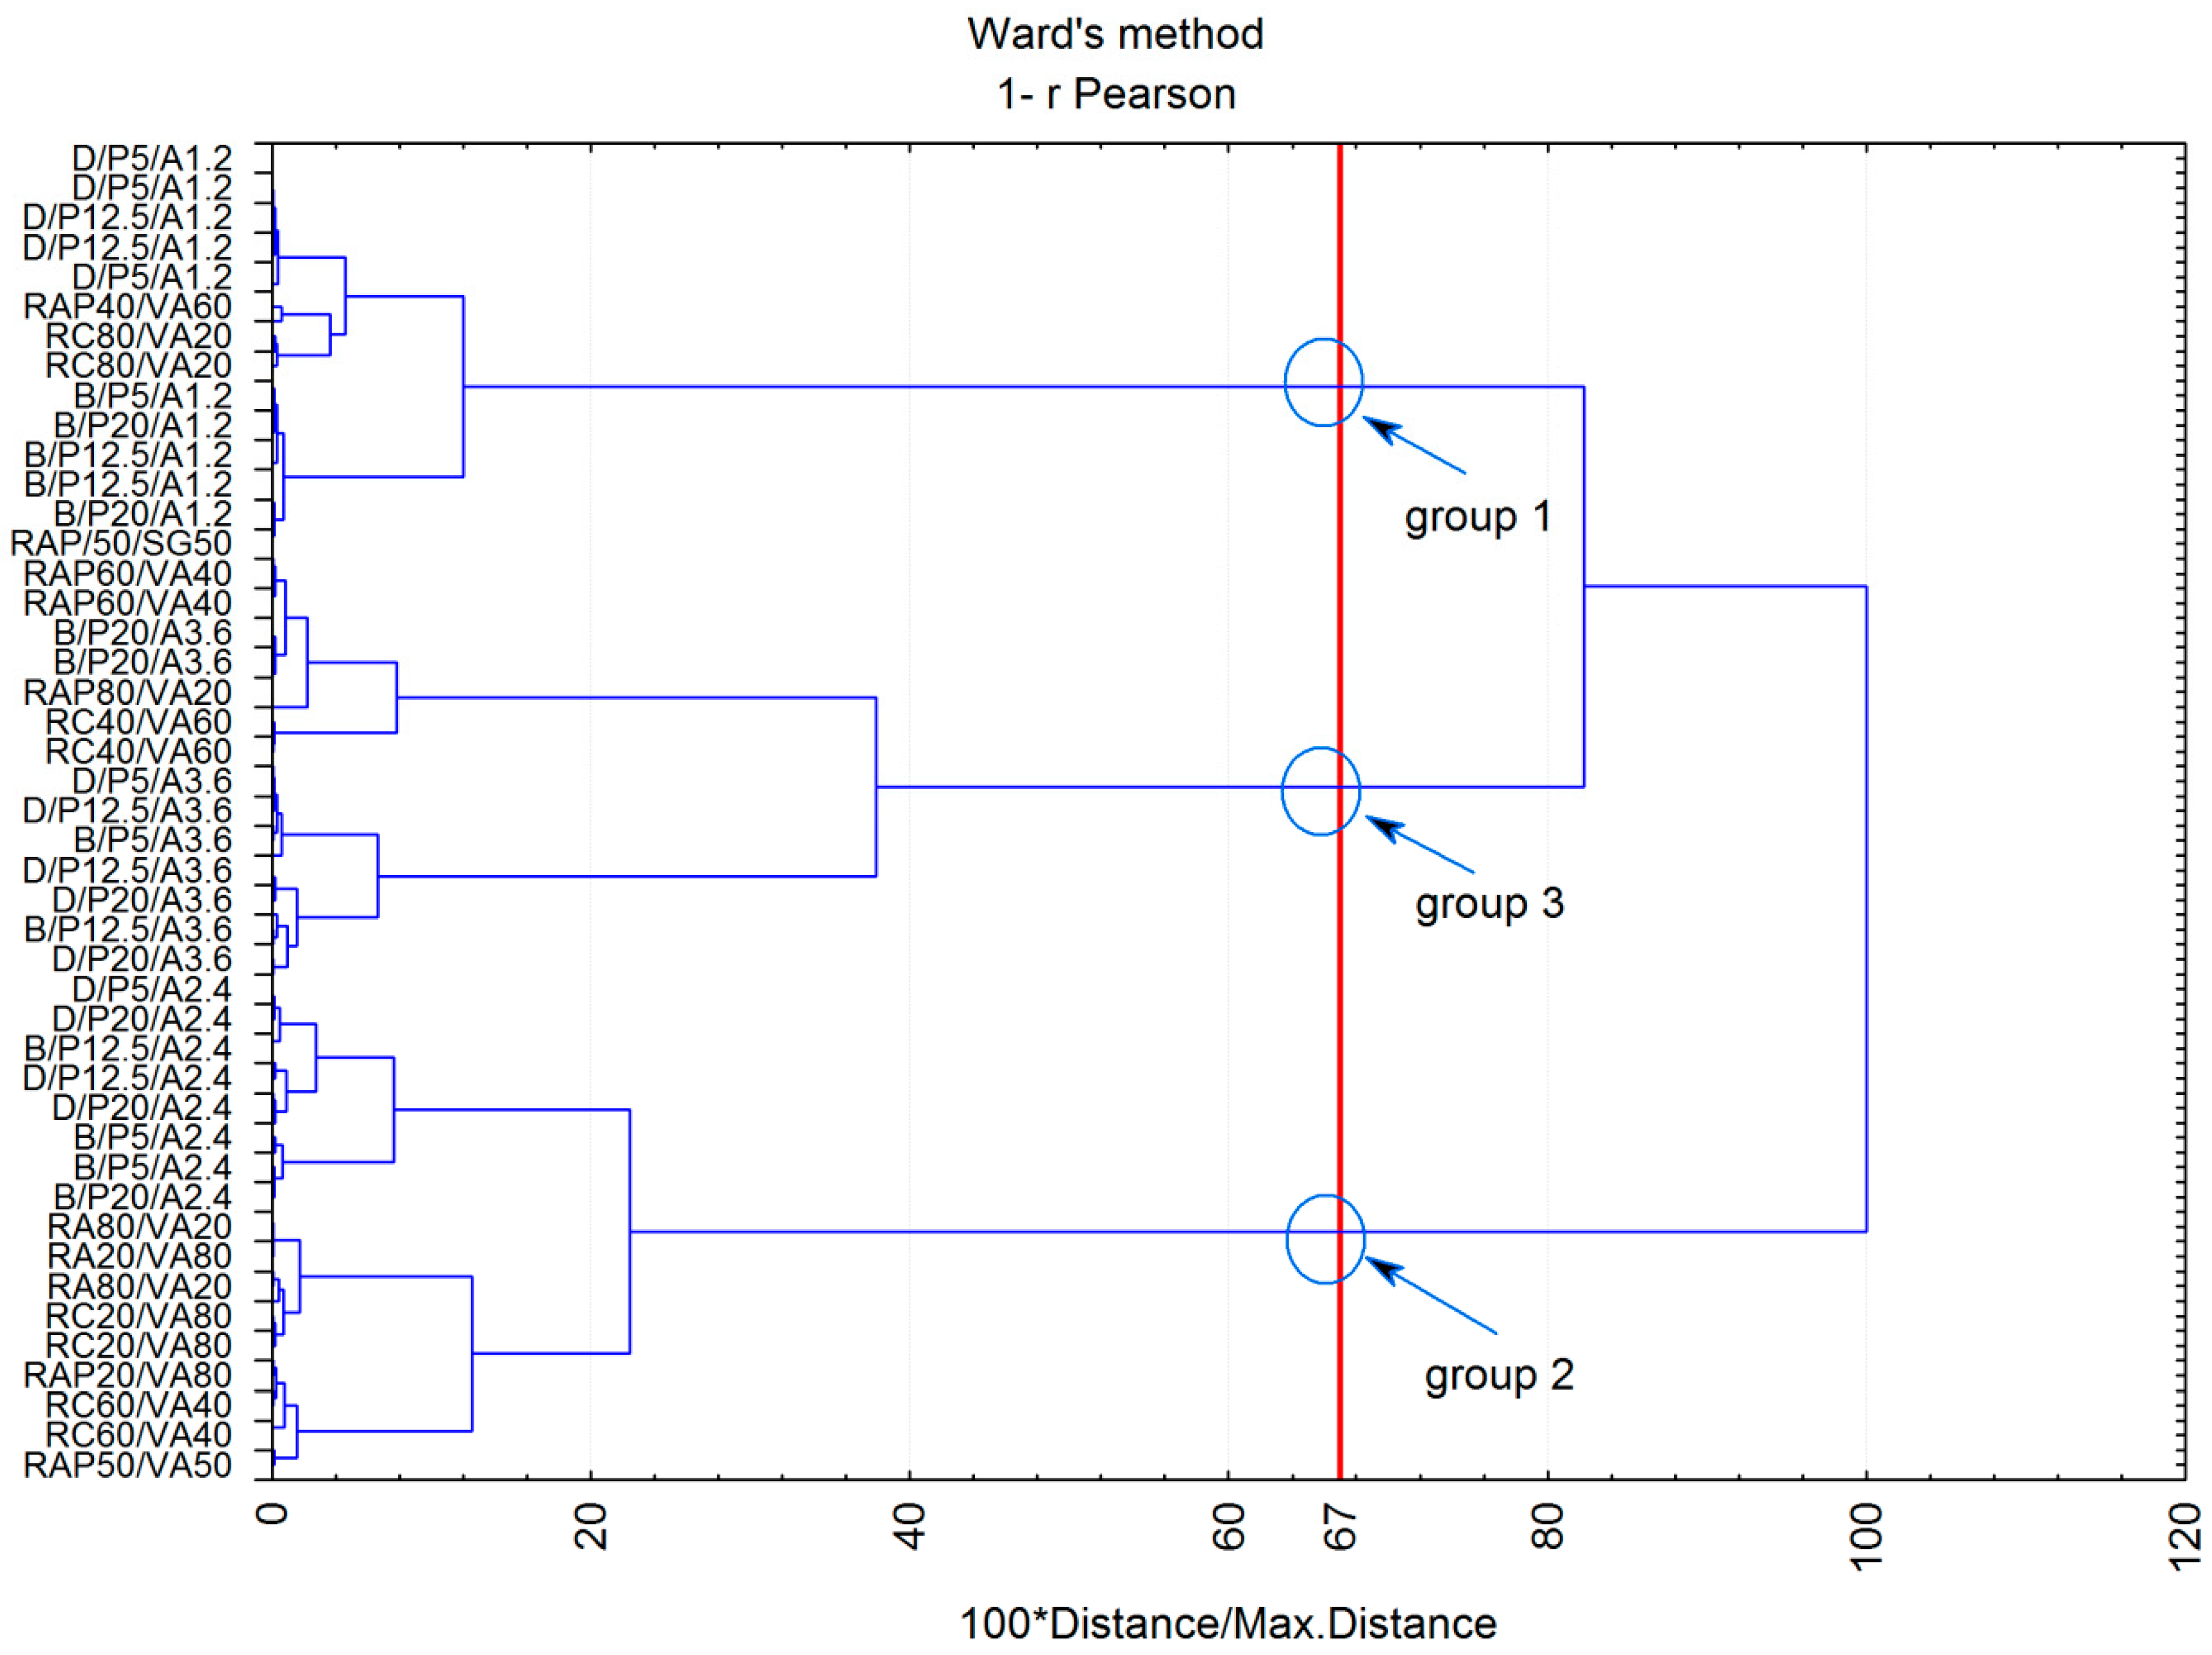
The selection of suitable variables was extremely important in cluster analysis, as was the isolation of the principal components at the earlier stage. The key issue was to choose the variables that best represent the population of recycled MCAS mixes with waste materials. The previous stage of the analysis was aimed at eliminating outlying points and minimizing the collinearity of new variables. The subsequent grouping step was based on the new four factorial variables Z1 to Z4 and indirectly on the real variables which represented the specimens of the mixtures. Ward’s method was used as a hierarchical method of agglomeration [37,38] In practice, there is no arbitrary method that clearly states the number of clusters. The Grabiński [39] and the frequently used Sneath criterion were used in this study [40]. The limit value for the Sneath criterion is shown in Figure 3.
The vertical axis in Figure 3 shows every second case. The main intention was to present as many cases from the specific group as possible. On the basis of the agglomeration results (Figure 3) and using four variables (Z1 to Z4), three new groups were obtained, different in terms of physical and mechanical parameters. Their differentiation was very clear given the normalized distances between the clusters. The red line in Figure 3 cuts off a set of high internal similarity objects (clusters) but characterized by a great dissimilarity between one another. This information is important because the agglomeration can be the basis for assigning particular MCAS specimens. Finally, three groups were chosen for further analysis. Table 4 shows the types of MCAS recycled mixtures represented by the highest number of specimens in the given group.
The mix denotation as RAP20/VA80 indicates the use of 20% RAP and 80% VA in the mix. In the case of mixtures with mineral dust, D.P12.5/A1.2 denotes a blend of 12.5% dolomite mineral dust (D) and 1.2% foamed bitumen. The grouping as described above provides preliminary information on certain factors that separate the properties of the specimens being analyzed. In the present form, the amount of bitumen in the mixtures with mineral dust (D/P/A and B/P/A) was a major factor in assigning them to adequate groups. The amount and type of dust played a secondary role. Other important elements were the amount of recycled aggregate (RA) and the amount of RAP used in the recycling process. The increase in the amounts of RAP and foam bitumen caused the convergence between the grouping results for the recycled mixture specimens with the average results in Group 3. However, the presence of cement in the mix or its increased content due to the addition of recycled cement concrete materials could also influence the grouping effect because Group 1includes a case of mixtures with high amounts of reclaimed concrete (RC) and a case of a low bitumen mixture, which may suggest excessive stiffness of the mixtures.
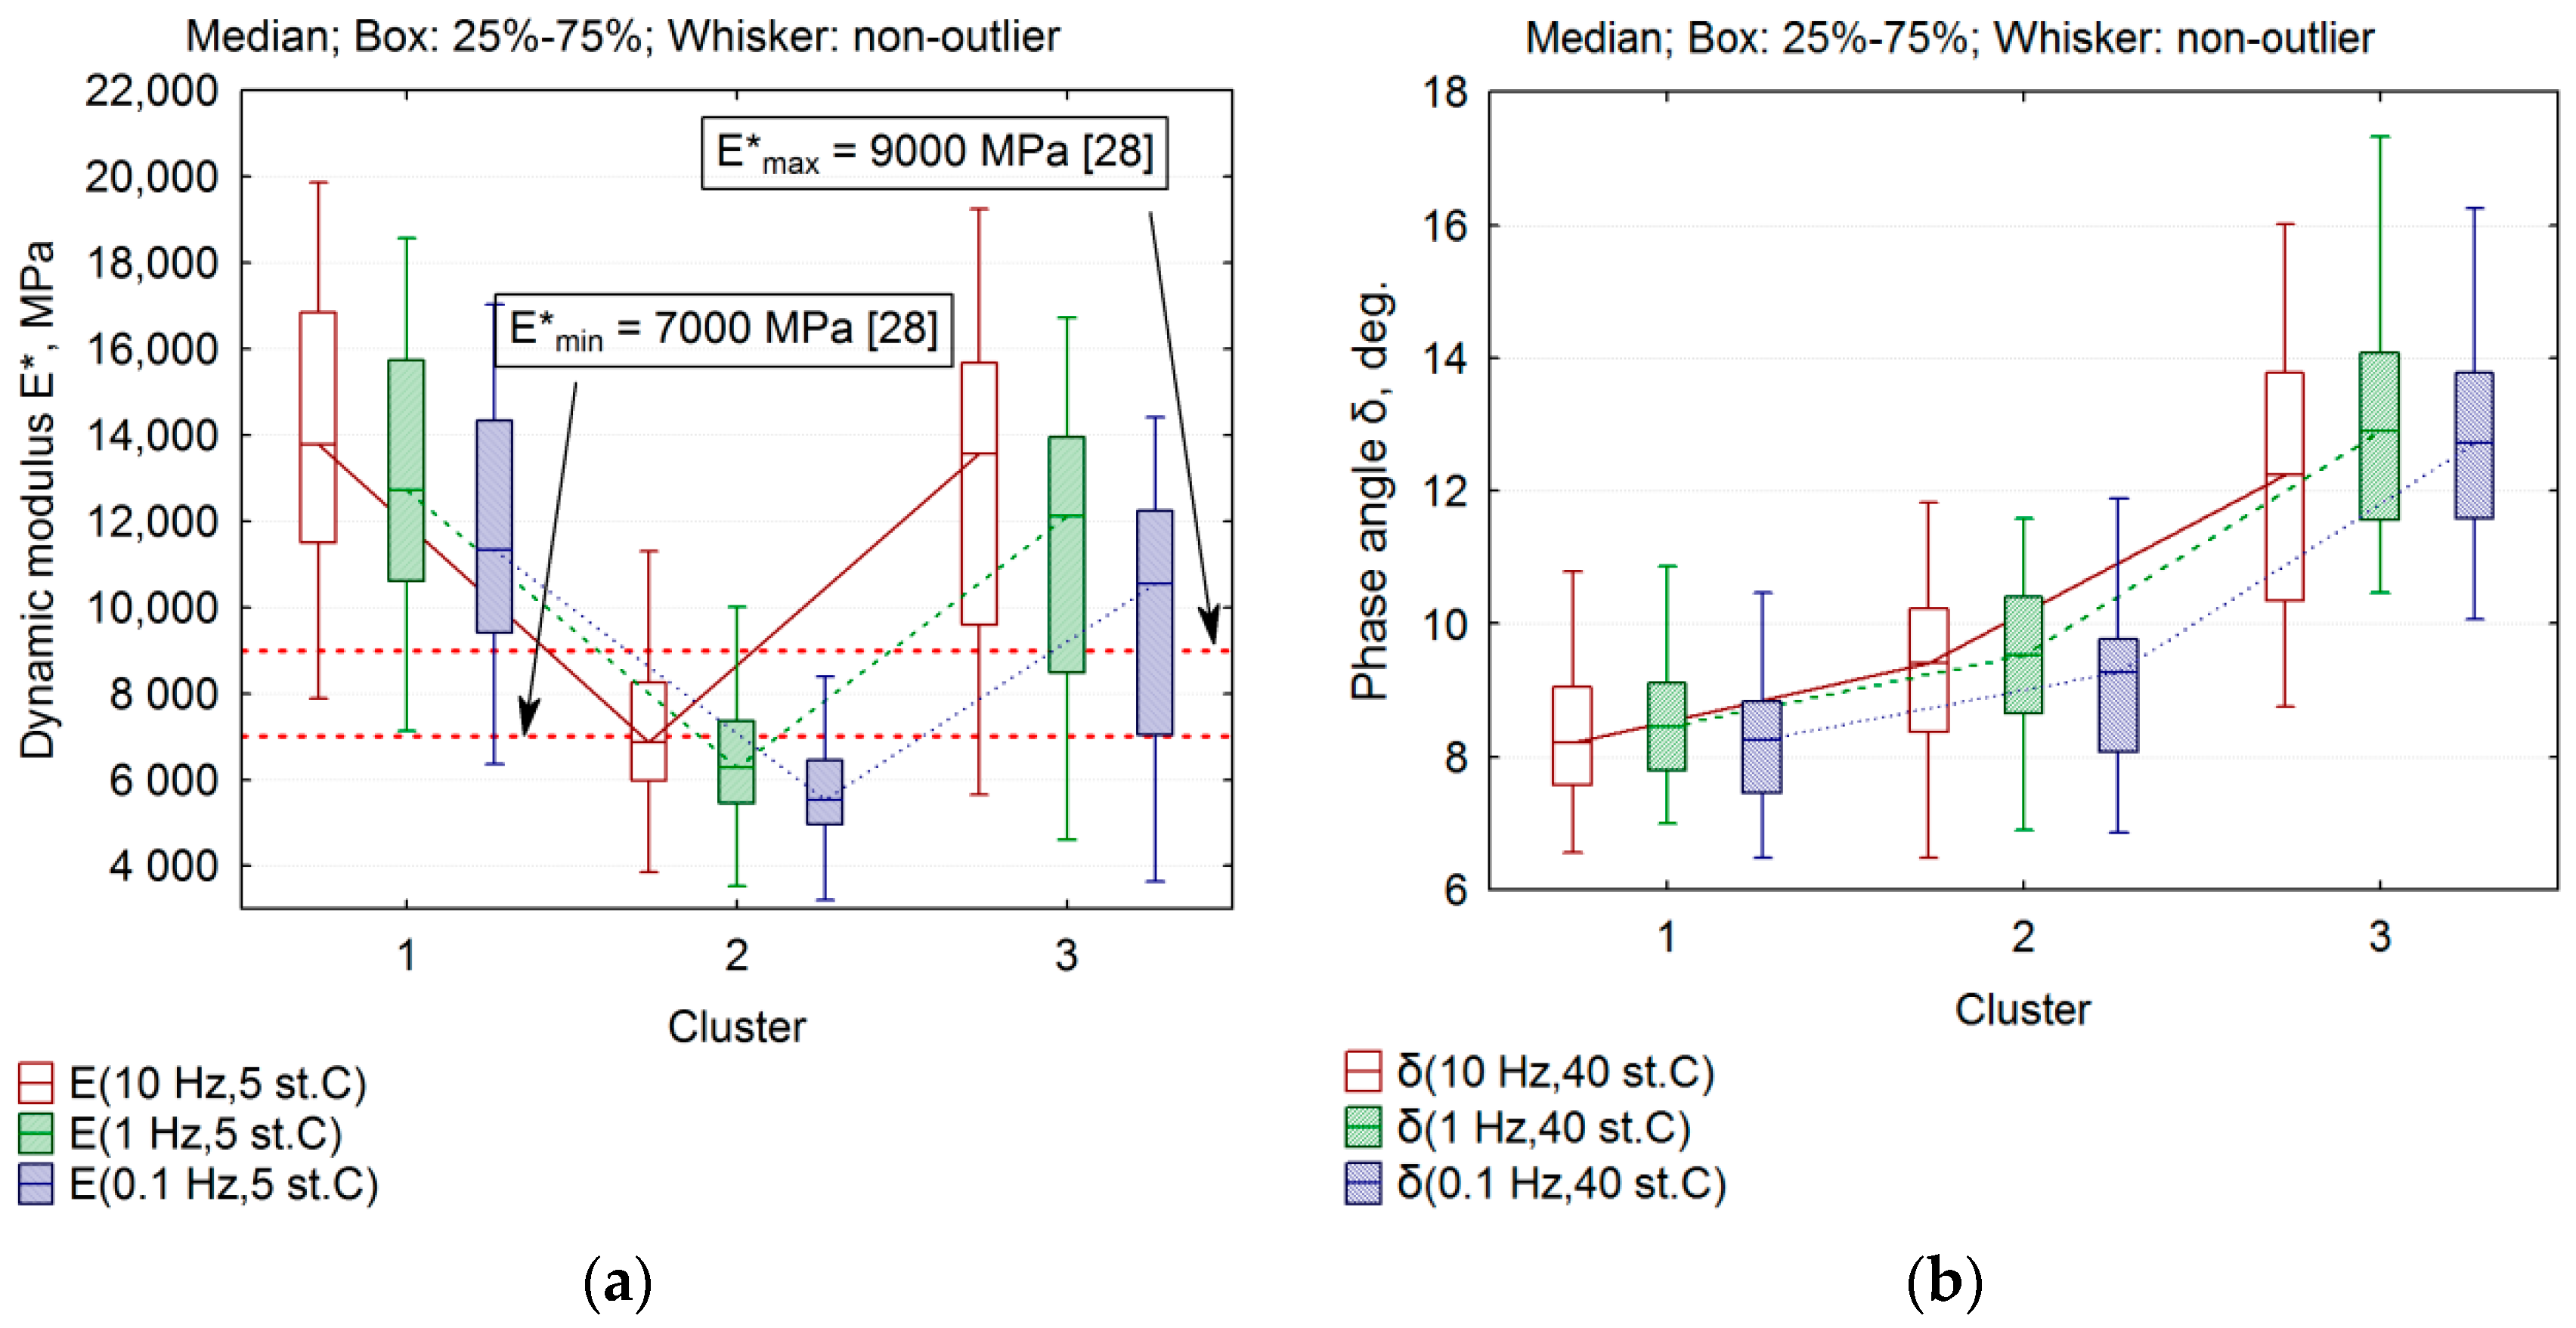
The next step in multidimensional inference was the statistical estimation of the results within particular groups of MCAS specimens with waste materials. First, the average dynamic stiffness modulus (E) and the phase shift (δ) were evaluated. Due to the high collinearity of rheological results and in compliance with provisions [30,31], the results of the stiffness modulus determined at 5 °C and 10 Hz loading time were used for comparative purposes. As for the phase angle, the average value determined at 40 °C was used. This choice was based on the distinctness of this case observed in Table 3, as reflected in the behavior of the mixtures at high service temperatures. The viscoelasticity results of the recycled MCAS mixes are shown in Figure 4.
The results in Figure 4a show that the mix specimens in Group 1 had the highest average dynamic moduli (E). The average value of the stiffness modulus determined at 5 °C and 10 Hz was E = 13,787 MPa. This value is almost twice as high as the minimum criterion set forth in [18]. Such a high stiffness modulus and low sensitivity to loading time have also been observed by other researchers [8]. However, their observations do not confirm excessive cracking in pavements due to high stiffness of incorporated MCAS. Group 3 attained comparable dynamic modulus results to those in Group 1. Their equivalence indicates that this parameter (stiffness modulus) cannot be the only criterion when considering suitability of recyclable MCAS mixes with waste materials. The lowest results were obtained in Group 2 composed of mix specimens with dusts and large proportion of recycled aggregates, probably because of inadequate foamed bitumen-dust amount ratio. Group 2 included the specimens with dolomite and basalt dusts made independently in time, which excludes systematic errors in dosing. The average level of stiffness modulus in Group 2 was E* = 6866 MPa. Note that this group contained also the specimens with recycled dolomite aggregate (RA) whose quality could have influenced the grouping process [7]. The phase angle (δ) results complemented the analysis (Figure 4b). Note that although Group 1 and Group 3 were similar in terms of stiffness, their rheological character at 40 °C was different. In Group 3, the phase angle was almost twice that of Group 1. Probably the viscous effect of Group 3 was due to the presence of specimens containing high amounts of bitumen and RAP material used in the composition of recycled MCAS mixtures. As a result, mixtures in Group 3 were different from Group 1 mixes by having an increased reserve of flexibility also at low temperatures. The effect of hydraulic binders, including binder blends, on the rheological character of the recycled mixtures was observed in [41] 4.0.
Another group of parameters whose levels were diversified with respect to clusters were the characteristics related to climatic factors (TSR and WRW + 2M) and indirect tensile strength (ITS) at 25 °C. The grouping results are illustrated in Figure 5.
The results of moisture resistance for the MCAS recycled mixtures (TSR and WRW+2M) (Figure 5a) were convergent with each other and showed the similarity of the overall results in Group 1 and Group 2. In Group 3, the average TSR value was high, TSR > 90%. This demonstrates the increased resistance to moisture-induced damage of the specimens in Group 3. It should be noted that Group 3 comprised the specimens with a large amount of bitumen. As with the ITS (Figure 5b) and TSR results, the highest levels were recorded in Group 3. The large group of MCAS results in Group 3 was within the MCE requirements range. Thus, the recycled mixtures in Group 3 had the highest cohesion and improved moisture resistance. In contrast, Group 2 represented mixtures with an acceptable moisture resistance level but with the lowest average level of the ITS parameter was relative to MCE. Evaluation of the results in Group 2 indicates a likelihood that ITS > 500 kPa and TSR < 50. This may be a sign of low cohesion of some of the mixes in Group 2, as mentioned in [7,29]. Therefore, the durability of mixes similar to this group is questionable.
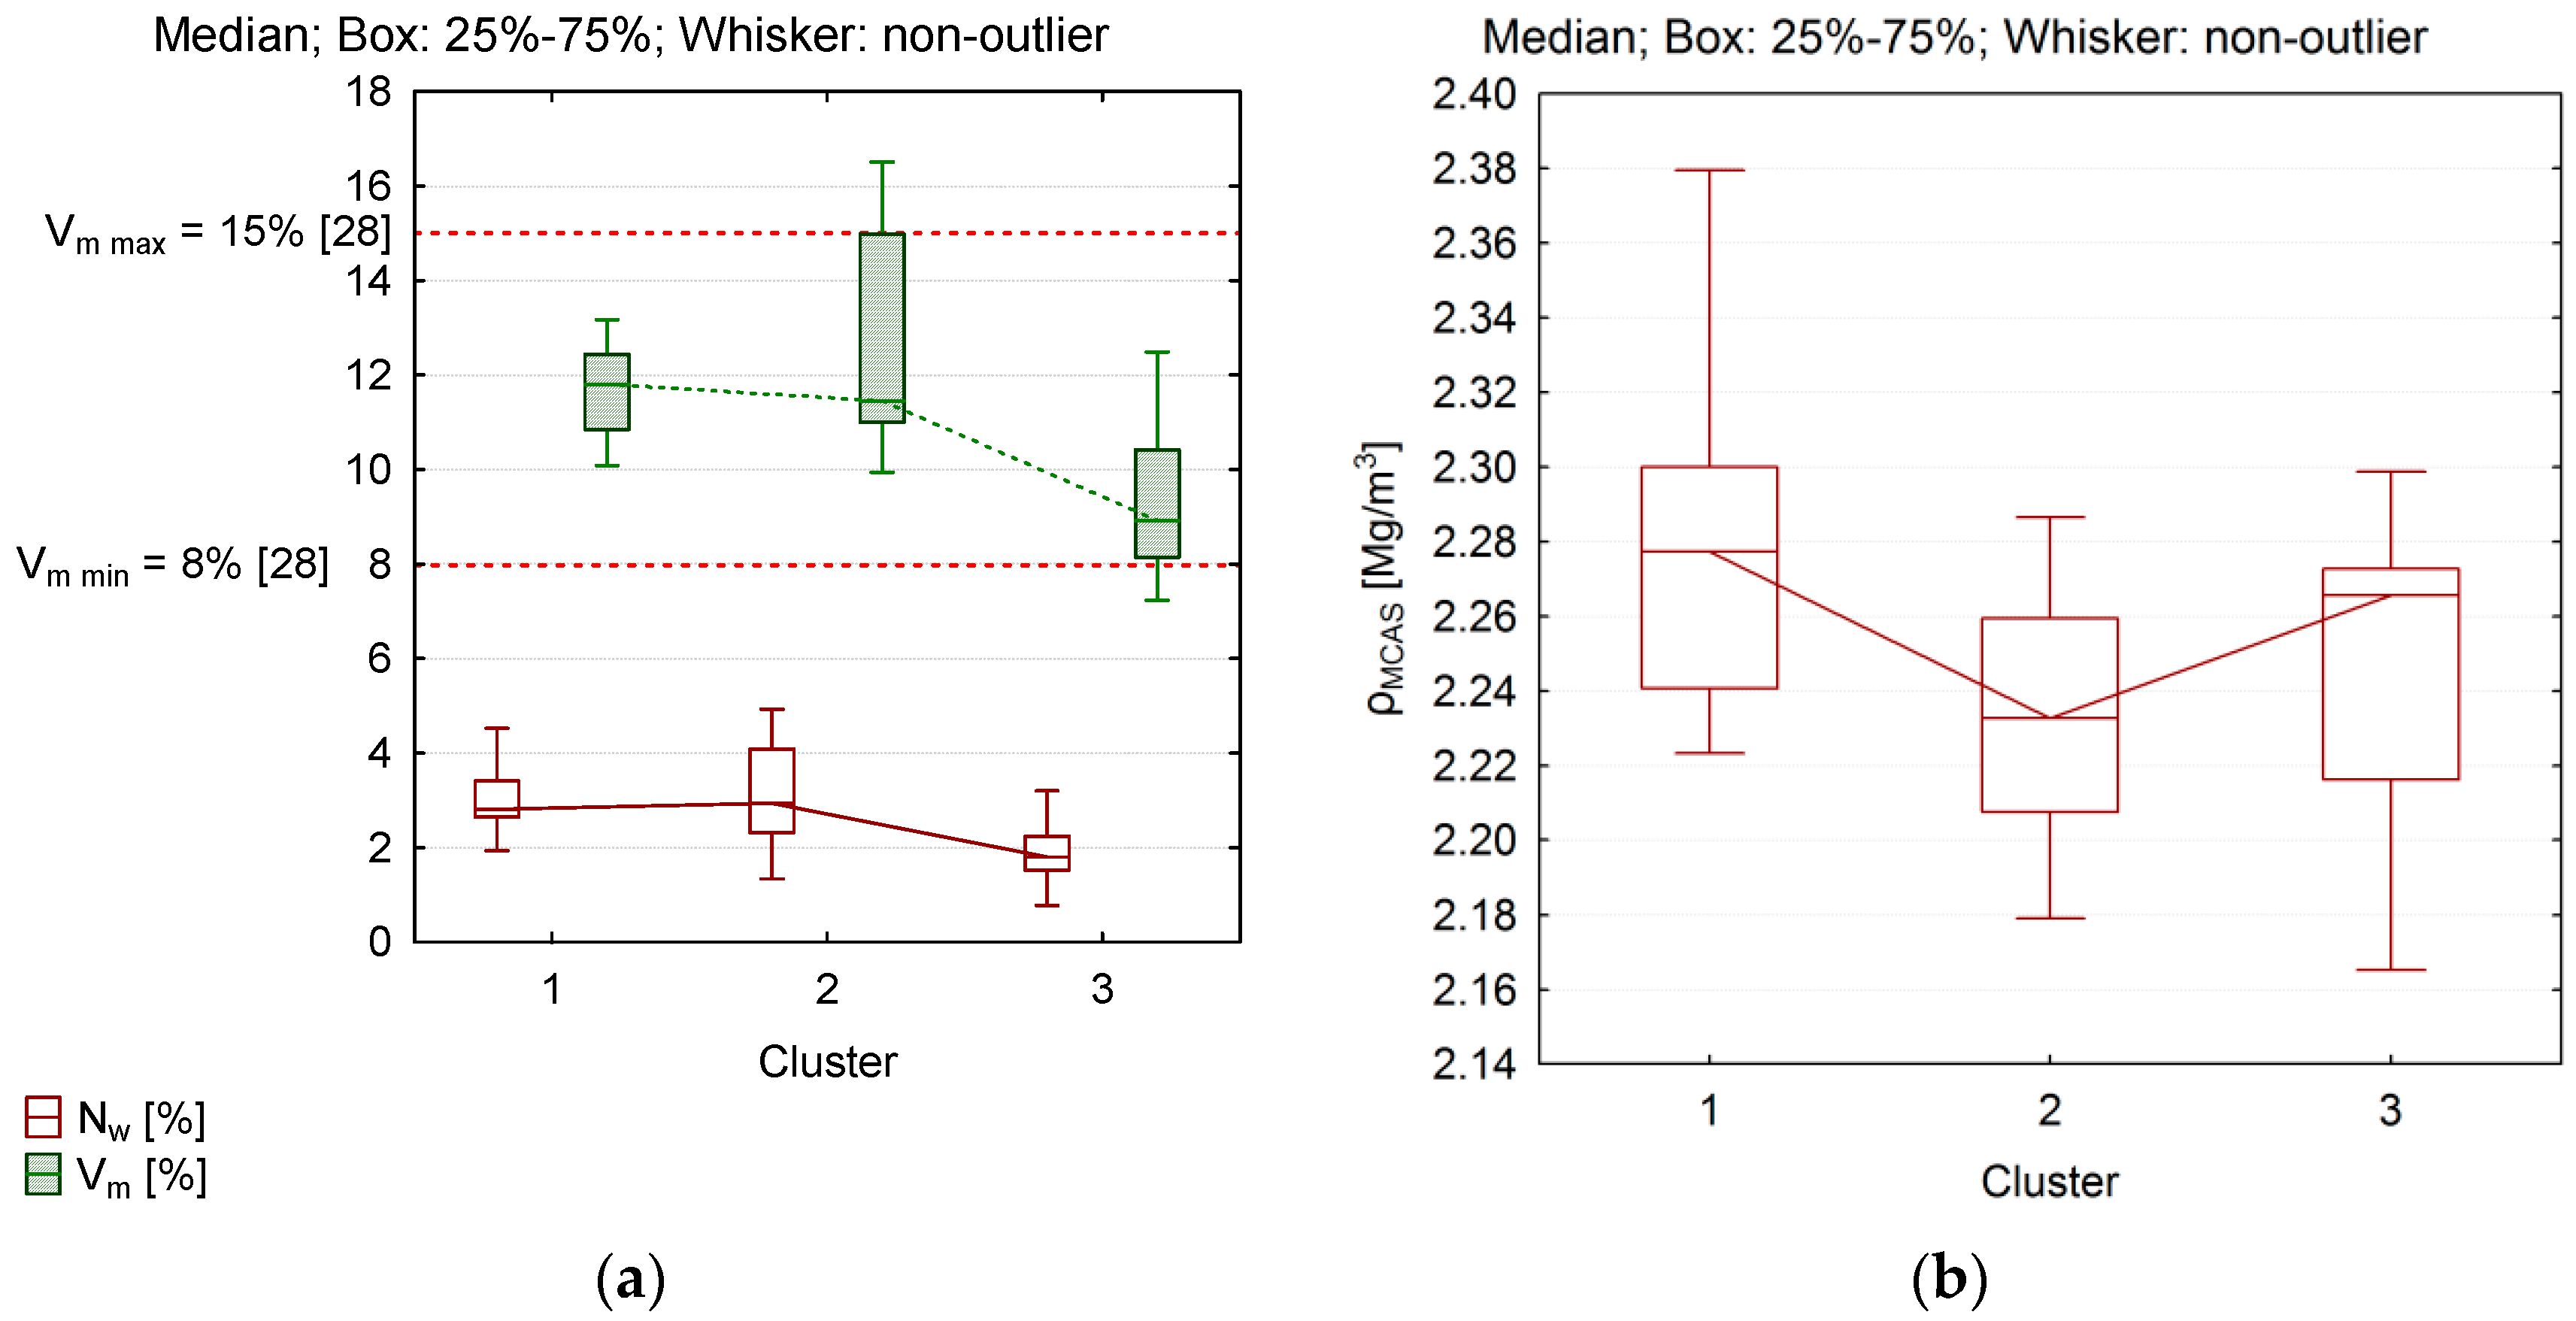
Finally, physical parameters, air void content (Vm), absorption (Nw) and density (ρMCAS), were considered in the analysis of the recycled mixtures population. The results are shown in Figure 6.
Analysis of the results of grouping the specimens of MCAS recycled mixtures indicates that the average value of air void content was the lowest in Group 3, Vm = 8.9%. The low level of this parameter was probably due to the high content of free bitumen in the recycled mixtures. In the other groups (1 and 2), the average air void content was about 11%, with high asymmetry observed in Group 2 in the distribution of air void content population with at least 25% of the results being above 15%. This result correlated with the low ITS performance. The mixtures in Group 2 had the lowest density, which may be a sign of low cohesion in the mix specimens. A certain singularity in achieving high mix density was observed in Group 1. This cluster grouped the mixes with the highest density but with the air void content was comparable with Group 2. This observation can be explained by the presence of recycled mixtures with high density steel slag.
To summarize the discussion so far, we can state that the specimens of recycled mixtures in the first group were characterized by high air void content and low amount of bitumen. The viscoelastic rheological character of mixtures indicates excessively stiff response. Parameter ITS suggests moderate cohesion. The resistance to climatic conditions was at a satisfactory level. The second group, representing low cohesion mixtures containing recycled aggregates (RC) and up to 50% of RAP material in the virgin aggregate, was characterized by low ITS, minimal resistance to climatic factors and low stiffness, indicating potentially low durability. In contrast, the third group represented the mixtures with high moisture resistance, high indirect tensile strength, high stiffness modulus and noticeably more viscous behavior at 5 °C, attained owing to the adequate amount of bitumen and higher amounts of RAP in the mixtures. The mixtures similar to those in Group 3 in the current dataset may be most recommended for use.

4.3. Discriminative Function Analysis

The last stage of multidimensional statistical inference was the discriminatory analysis. Its main purpose was to identify the mathematical functions that allow for the best discrimination between the clusters as described in the preceding paragraph. Discriminant functions answer the question which variables are the best predictors of group membership. In addition, the discriminatory analysis was to verify the validity of the adopted groups. In the first place, discriminatory analysis required the canonical analysis to separate the present clusters by mathematical functions [40] 39, starting from the review of variables in the model. The results of the discriminatory analysis are summarized in Table 5.
The discriminant analysis was performed on transformed variables obtained during the search for principal components (PCA). The results shown in Table 5 indicate that the parameters expressed by variable Z2 (the lowest value of partial Willks’ Lambda), responsible for the structural properties of the recycled mixture, provided the most overall discrimination (p < 0.05). The second most discrimination was provided by variable Z1 (rheological properties), responsible for MCAS viscoelastic properties. As for variable Z3, its effect on the group discrimination was marginal. Variable Z3 bonds moisture resistance parameters and a portion of the ITS variation. Its statistically insignificant contribution to the discrimination was due to the low diversity of moisture resistance results across the dataset. With the initial knowledge of the contribution of the given variables on the discrimination, it was necessary to determine the canonical coefficients, on the basis of which the discriminant functions (classification functions) were computed. Arbitrarily, two significant functions were used. The predictive validity of the functions was assessed in the χ2 test and summarized in Table 6.
The results in Table 6 indicate that both discriminant functions were statistically significant (p < 0.05) and thus could be used for further statistical inference. The raw values of the canonical functions required for the final determination of discriminant functions, important for the classification of other cases of recyclable MCAS mixes with waste materials, are shown in Table 7.
It follows from the results above that the first canonical function (V_1) explained about 74% of the variation whereas the second function (V_2) explained 26% of discrimination. The canonical discriminant function had the form (2):
{ V _ 1 = 0.032 × Z 1 + 0.695 × Z 2 0.019 × Z 3 0.395 × Z 4 V _ 2 = 0.3 × Z 1 + 0.07 × Z 2 0.112 × Z 3 0.25 × Z 4
The discriminant (classification) functions allowed direct classification of each mixture case and its projection to the results space used in the experiment. These functions are a valuable reference material, since other mix results can be projected to this “learned” database and used to evaluate their similarity to their already isolated clusters. The clusters may represent areas of the recycled mix properties proposed for recommendation. The ultimate forms of the discriminant functions are shown in Table 8.
This final stage of analysis enabled the mathematical description of the boundaries required to classify the cases of recycled mixes with waste materials (specimens) in existing clusters. As mentioned above, they can be treated as a “learned” reference model for the behavior of MCAS mixtures with waste materials. Therefore, based on the value of the discriminant function and the coefficients in Table 8, a new case of a recycled mixture of unknown membership can be classified in a given group. The group membership is established based on the maximum value obtained from the computation of all three classification functions. The grouping procedure adopted in the analysis was 98% effective. In Groups 1 and 3 only one case was probably misclassified—the one at the boundary between the arbitrary boundary determined by the classification function.
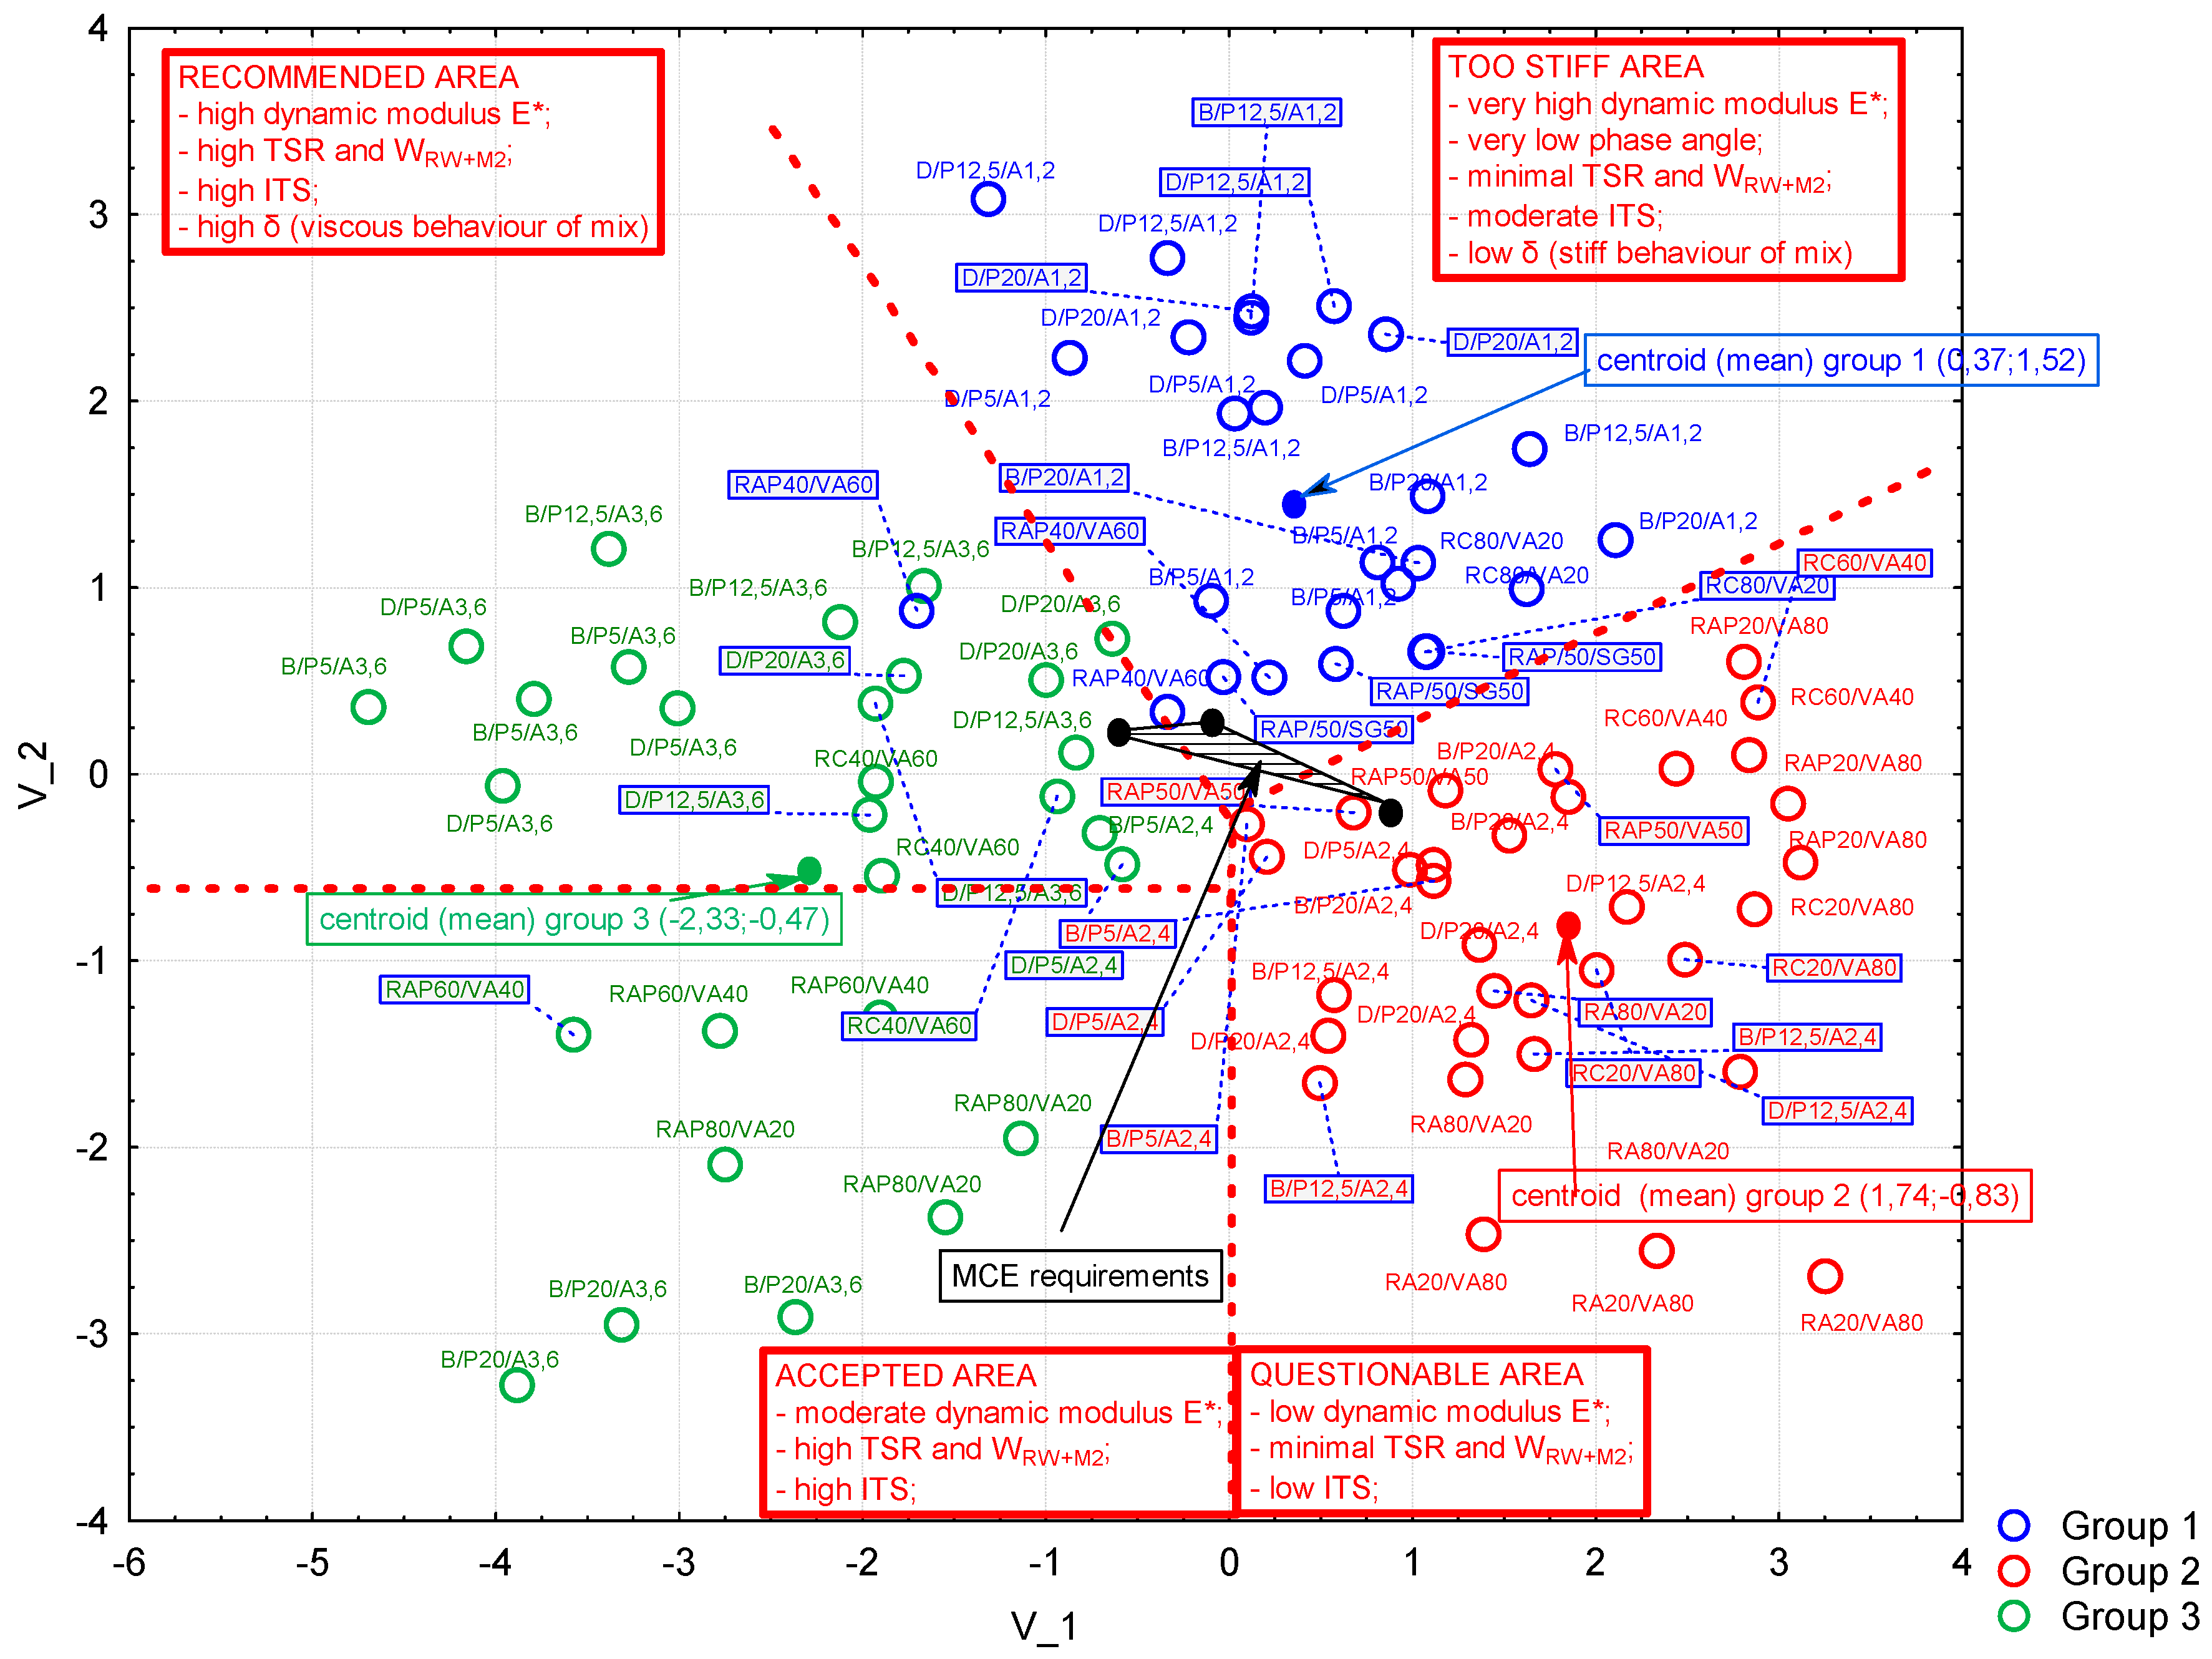
The multidimensional analysis summarizes the projection plot of the data with respect to the values of two canonical functions. It allows global assessment of the population partition and rules applicable in the given set of recycled mixtures with waste materials. The canonical data scatter plot with the cases of recycled MCAS is shown in Figure 7.
The canonical value scatter plot provides an overview of a number of general rules and relationships in a given set of results for the samples of recycled mixtures made with different waste materials. The samples of recycled mixtures that best represent the data sets can be defined as those at the group centroid (mean). In the case of Group 1, these were the mix samples with the addition of basalt mineral dust, regardless of the mineral dust amount, with 1.2% bitumen foam content. The RC80/VA20 mix was also close to the canonical mean in Group 1. This proves that Group 1 was represented by the mixtures whose rheological state could result from the high content of hydraulic binders.
Group 2 could be represented by the samples with dolomite dust, mixes with 20% RC (20RC/80VA) and, which is most important, by the mixtures with 80% recycled aggregate (80RC/20VA), which suggests that the use of large amounts of recycled aggregate should be investigated further for its suitability. The latter case makes the use of a large recycled aggregate subject to its thorough examination in terms of suitability. Analysis of the parameters assigned to Group 2 shows that the use of recycled aggregates can be an acceptable compromise between the quality and durability of mixtures produced using deep recycling with foamed bitumen.
Group 3 was represented by mixtures with dolomite aggregate and a large amount of foamed bitumen (3.6%). The RC40/60VA and RAP60/VA40 cases could also be included. This demonstrates that mixtures in this group were predominantly viscous due to higher amount of bitumen binder, which is in contrast to the mixtures in Group 1. Considering the effect of a given variable’s influence on a given discriminatory function (Table 6), the second canonical variable (V_2) is a major mixture discriminant factor due to its viscoelastic nature. The mixtures that had high V_2 value were characterized by high dynamic stiffness modulus (E) with dominant elastic portion (E’), while those with the lowest V_2 had the lowest dynamic modulus (E). The mixtures with high values of the first canonical variable (V_1) exhibited high density, low ITS, and low but acceptable TSR.
More information can be derived from the results in Table 7. The key issue in each task is to determine the area in which cases of recycled mixtures with best properties are located. Analysis of data in Table 3 and Table 7 should include minimization of the first variable (V_1) and maximization of the second canonical variable (V_2). Figure 7 has this area marked as recommended. All the areas were determined through canonical function plots. An inverse optimization provides examples of recycled mixtures with lower durability relative to the parameters used in the experiment. On the basis of the multidimensional analysis, accounting for the classification functions and factor variables, four areas were defined in the plane determined by the canonical variables. The first recommended area (Figure 7) represents the samples of mixtures with 5–12% dust contents (basalt or dolomite) and 3.6% of foamed bitumen. High similarity to this group was demonstrated by samples designated as 40RC/60VA, which were classified in this group. The second area represents the samples of mixtures with high moisture resistance, moderate stiffness and viscous character at 40 °C due to increased free bitumen content. This area is designated as acceptable. The results of the third area, designated as questionable, should be considered with caution. This area represents the samples of mixtures with very high stiffness, minimum moisture resistance and moderate ITS. However, the most disturbing fact is that due to the elastic–brittle nature, the mixtures in this area may be sensitive to reflective cracking. The fourth group is the case of recycled mixtures with the lowest stiffness and low phase angle, causing reflected cracking at lower stress than in the “questionable” area (third area). In addition, the low ITS level and minimal frost resistance make them less useful. In this area, recycled mixtures with a high content of recycled dolomite aggregate, above 20%, with RAP content of less than 40% and a small amount of RC are predominant. This confirms the hypothesis that the use of recycled aggregate must be preceded by a careful analysis of the quality of such material prior to its application in deep recycling technology.
Figure 7 shows the initial projection of MCE requirements in Poland [13,14] with respect to the V_1 and V_2 coordinates included in Figure 4, Figure 5 and Figure 6. It should be noted that after determining the results of classification functions, the obtained MCE solution space is in the center of diagram in Figure 7. A portion of the MCE results is in the solution space marked as questionable. Nevertheless, on the basis of Figure 7, the use of MCAS mixes with waste materials allows attaining far better results than those that are compared to the classical MCE mix. The results of the iterative process required to project the requirements for MCE are shown in Table 9.
The limiting point of MCE results projection with respect to the space determined by the mixtures with waste materials were defined by maximizing each discriminant function. The value of each point within the polygon in Figure 7 was decoded with respect to the real parameters for the recycled mixtures (Table 9). Note that the mix with high air void content and low moisture resistance will be assigned, as a similar mixture, to Group 2, i.e., to questionable results from the perspective of the mix durability. For the mix to obtain the results similar to Group 3 (recommended), a larger amount of bitumen emulsion and cement will have to be used to improve its physical and mechanical parameters. The area of the results similar to Group 1 represents the mixtures with high cement content. The same results were observed in [18].

5. Conclusions

Having determined the groups, detailed models for each of them (clusters) can be constructed based on, for example, generalized linear models (GLM) and factor variables. The following conclusions were formulated:
  • Multidimensional analysis turned out to be an effective tool for analyzing a large data set. Owing to its algorithms, a number of generalizations can be made being the basis for creating future requirements;
  • The most important element in the article was the change in the method of analyzing research results. This time, the primary issue was not comparing the averages of certain mixture cases, but searching for certain characteristic groups being a collection of similar mixture results;
  • Owing to the tools such as the PCA and cluster analysis, it is possible to predict the durability of other mixtures by projecting their results into the trained space described by canonical variables;
  • Variable transformation by PCA reduced the number of variables that were unrelated, which was the necessary condition for further multidimensional analysis;
  • Four principal components were chosen in the dataset of samples of recycled mixtures with waste materials. The first component was related to the rheology of the samples. The second component was correlated with physical properties of the mixtures. The variation of the third component was determined through the moisture resistance parameter. The fourth component was strongly related with the density of the mixture;
  • Grouping analysis using the Ward technique indicated to high probability the existence of three clusters of mix results. This was the basis for developing future recommendations;
  • The first group of the recycled mixtures represented those mixtures whose behavior was elastic-brittle. The level of the stiffness modulus was high at the low level of the phase angle. The ITS was at the acceptable level relative to the requirements for MCE, as was the level of moisture resistance. This group comprised the mixtures with a high amount of RC (>40%);
  • The second group represented the mixtures with low stiffness, low phase angle and low ITS. Those mixtures would not ensure the expected lifespan of pavements. The results are correlated with the low but acceptable level of moisture resistance (TSR). This group comprised the mixtures containing a high amount of RA;
  • The third group represented the mixtures with high stiffness and high flexibility at 5 °C. This result is advantageous from the perspective of low-temperature-induced cracking reduction. As the mixtures contained high amounts of bitumen added with dusts and a high RAP content (>50%), the mixtures will be resistant to moisture damage, as demonstrated in this study;
  • Discriminant analysis revealed that rheological and structural properties of the recycled mixtures had the highest discriminant power and that moisture resistance parameter was the least helpful;
  • The recycled mixtures recommended for use were those with mineral dusts and high amount of bitumen, and those with a high RAP content. The analysis revealed that large amounts of RA material (more than 40%) in MCAS composition should be carefully considered with caution;
  • Based on the results of the experiment, MCAS mixes with the use of some waste materials in an appropriate amount allow obtaining mixes for road base layer with parameters better than the traditional recycled mixture performed in MCE technology.

Acknowledgments

The research results have been developed under the project “The use of recycled waste materials” with the RID project co-funded by the National Center for Research and Development and the General Directorate for National Roads and Motorways.

Author Contributions

Grzegorz Mazurek (70%): conceived an article, performed experiments, analyzed data files with preparing necessary macro scripts. Marek Iwański (30%): co-wrote an article, corrected some mistakes and commented some test results.

Conflicts of Interest

The authors declare no conflicts of interest.

References

  1. Gao, L.; Ni, F.; Charmot, S.; Li, Q. High-temperature performance of multilayer pavement with cold in-place recycling mixtures. Road Mater. Pavement Des. 2014, 15, 804–819. [Google Scholar] [CrossRef]
  2. Santagata, F.A.; Bocci, M.; Grilli, A.; Cardone, F. Rehabilitation of an Italian highway by coldin-place recycling techniques. In Proceedings of the 7th international RILEM Symposium on Advanced Testing and Characterization of Bituminous Materials, Rhodes, Greece, 27–29 May 2009; Volume 2, pp. 1113–1122. [Google Scholar]
  3. Stimilli, A.; Ferrotti, G.; Graziani, A.; Canestrari, F. Performance evaluation of cold recycled mixture containing high percentage of reclaimed asphalt. Road Mater. Pavement Des. 2013, 14, 149–161. [Google Scholar] [CrossRef]
  4. Iwański, M.; Chomicz-Kowalska, A. Laboratory Study on Mechanical Parameters of Foamed Bitumen Mixtures in the Cold Recycling Technology. Procedia Eng. 2013, 57, 433–442. [Google Scholar] [CrossRef]
  5. Asphalt Academy. Technical Guideline (TG2): Bitumen Stabilized Materials, 2nd ed.; CSIR Built Environment: Pretoria, South Africa, 2009. [Google Scholar]
  6. Loizos, A. In-situ characterization of foamed bitumen treated layer mixes for heavy-duty pavements. Int. J. Pavement Eng. 2007, 8, 123–135. [Google Scholar] [CrossRef]
  7. Wirtgen Group. Wirtgen Cold Recycling Technology, 1st ed.; Wirtgen GmbH: Windhagen, Germany, 2012. [Google Scholar]
  8. Pasetto, M.; Baldo, N. Laboratory investigation on foamed bitumen bound mixtures made with steel slag, foundry sand, bottom ash and reclaimed asphalt pavement. Road Mater. Pavement Des. 2012, 13, 691–712. [Google Scholar] [CrossRef]
  9. Pasetto, M.; Baldo, N. Foamed bitumen bound mixtures made with marginal aggregates: An experimental study, sustainability, eco-efficiency and conservation in transportation infrastructure asset management. In Proceedings of the 3rd International Conference on Tranportation Infrastructure, Pisa, Italy, 22–25 April 2014; pp. 3–13. [Google Scholar]
  10. Dal Ben, M.; Jenkins, K.J. Performance of cold recycling materials with foamed bitumen and increasing percentage of reclaimed asphalt pavement. Road Mater. Pavement Des. 2014, 15, 348–371. [Google Scholar] [CrossRef]
  11. Leandri, P.; Losa, M.; Di Natale, A. Field validation of recycled cold mixes viscoelastic properties. Constr. Build. Mater. 2015, 75, 275–282. [Google Scholar] [CrossRef]
  12. Godenzoni, C.; Graziani, A.; Perraton, D. Performance evaluation of a cold-recycled mixture containing high percentage of reclaimed asphalt. Road Mater. Pavement Des. 2013, 14, 130–150. [Google Scholar] [CrossRef]
  13. Iwański, M.; Chomicz-Kowalska, A. Evaluation of the pavement performance. Bull. Pol. Acad. Sci. Tech. Sci. 2015, 63, 97–105. [Google Scholar] [CrossRef]
  14. Judycki, J.; Dołżycki, B.; Hunik, K.; Stienss, M. Weryfikacja Zasad Projektowania Mieszanek Mineralno-Cementowo-Emulsyjnych; Validation of Mineral-Cement-Emulsion Mixtures Design Method: Final Report; Politechnika Gdańska: Gdańsk, Poland, 2009. [Google Scholar]
  15. General Directorate for National Roads and Highways (GDDKiA). WT-2/2010—Techical Requirements—Bituminous Mixtures—Annex 2; Order Nr 102; GDDKiA: Kraków, Poland, 2010.
  16. UNE—Asociación Española de Normalización. Aggregates for Unbound and Hydraulically Bound Materials for Use in Civil Engineering Work and Road Construction; EN 13242; UNE: Madrid, Spain, 2008. [Google Scholar]
  17. Buczyński, P.; Iwanski, M. Inactive mineral filler as a stiffness modulus regulator in foamed bitumen-modified recycled base layers. In IOP Conference Series: Materials Science and Engineering; IOP Publishing: Bristol, UK, 2017; Volume 245. [Google Scholar] [CrossRef]
  18. Dolzycki, B. Instrukcja Projektowania i Wbudowywania Mieszanek Mineralno-Cementowo-Emulsyjnych; The Design and Performance Guide of Mineral-Cement-Emulsion Mixtures; Gdańsk University: Gdańsk, Poland, 2013. [Google Scholar]
  19. Bituminous Mixtures—Test Methods for Hot Mix Asphalt. Determination of Void Characteristics of Bituminous Specimens; EN 12697-8; British Standards Institution (BSI): London, UK, 2003.
  20. Bituminous Mixtures—Test Methods for Hot Mix Asphalt. Determination of Bulk Density of Bituminous Specimens; EN 12697-6; British Standards Institution (BSI): London, UK, 2012.
  21. Bituminous Mixtures—Test Methods for Hot Mix Asphalt. Determination of the Indirect Tensile Strength of Bituminous Specimens; EN 12697-23; British Standards Institution (BSI): London, UK, 2003.
  22. Kim, Y.R. Asphalt Pavements; CRC Press: Boca Raton, FL, USA, 2014. [Google Scholar]
  23. Bituminous Mixtures—Test Methods for Hot Mix Asphalt. Stiffness; EN 12697-26:2012; British Standards Institution (BSI): London, UK, 2012.
  24. Standard Method of Test for Resistance of Compacted Asphalt Mixtures to Moisture-Induced Damage; AASHTO T283; American Association of State Highway and Transportation Officials (AASHTO): Atlanta, GA, USA, 2014.
  25. Jaskula, P.; Judycki, J. Durability of Asphalt Concrete Subjected to Deteriorating Effects of Water and Frost. J. Perform. Constr. Facil. 2016, 30, C4014004. [Google Scholar] [CrossRef]
  26. Fakhri, M.; Ahmadi, A. Evaluation of fracture resistance of asphalt mixes involving steel slag and RAP: Susceptibility to aging level and freeze and thaw cycles. Constr. Build. Mater. 2017, 157, 748–756. [Google Scholar] [CrossRef]
  27. Bituminous Mixtures—Test Methods—Part 31. Specimen Preparation by Gyratory Compactor; EN 12697-31; British Standards Institution (BSI): London, UK, 2007.
  28. Grilli, A.; Graziani, A.; Bocci, M. Compactability and thermal sensitivity of cement-bitumen treated materials. Road Mater. Pavement Des. 2012, 13, 599–617. [Google Scholar] [CrossRef]
  29. Gonzalez, A.A. An Experimental Study of the Deformational and Performance Characteristics of Foamed Bitumen Stabilised Pavements. Ph.D. Thesis, University of Canterbury, Christchurch, New Zeland, 2012. [Google Scholar]
  30. Dołżycki, B. Polish experience with cold in-place recycling. In IOP Conference Series: Materials Science and Engineering; IOP Publishing: Bristol, UK, 2017; Volume 236. [Google Scholar]
  31. Zawadzki, J.; Matras, J.; Mechowski, T.; Sybilski, D. Warunki Techniczne Wykonania Warstw Podbudowy z Mieszanki Mineralno-Cementowo Emulsyjnej (MCE); Technical Reqirements of Mineral-Cement-Emulsion Mixes (MCE) Performance; IBDiM: Warszawa, Poland, 1999. [Google Scholar]
  32. Stanisz, A. Przystępny Kurs Statystyki z Zastosowaniem Statistica na Przykładach z Medycyny; Application of Statistica Package on Examples of Medicine; StatSoft: Kraków, Poland, 2016; Volume III. [Google Scholar]
  33. Dąbrowski, J. O Problemie Redukcji Wymiarów; Some Issues on Dimentions Redution; Polskie Towarzystwo Inżynierii Rolniczej: Kraków, Poland, 2000. [Google Scholar]
  34. Miller, J.N.; Miller, J. Statistic and Chemometrics for Analytical Chemistry; Pearson Education Limited: London, UK, 2010. [Google Scholar]
  35. Hartigan, J.A. Clustering Alghoritms; John Wiley & Sons: New York, NY, USA, 1975. [Google Scholar]
  36. Kaiser, H.F. The varimax criterion for analytic rotation in factor analysis. Psychometrica 1958, 23, 187–200. [Google Scholar] [CrossRef]
  37. Ward, J.H. Hierarchical grouping an objective function. J. Am. Stat. Assoc. 1963, 58, 236–244. [Google Scholar] [CrossRef]
  38. Panek, T. Statystyczne Analizy Wielowymiarowej Analizy Porównawczej; Statistical Multidimensional Analysis; SGGW: Warszawa, Poland, 2009. [Google Scholar]
  39. Grabiński, T. Metody Taksonometrii; Taksonomy; Akademia Ekonomiczna w Krakowie: Kraków, Poland, 1992. [Google Scholar]
  40. Sneath, P.H.A. The application of computers to taxonomy. J. Gen. Microbiol. 1957, 17, 201–226. [Google Scholar] [CrossRef] [PubMed]
  41. Iwański, M.; Buczyński, P.; Mazurek, G. Optimization of the road binder used in the base layer in the road construction. Constr. Build. Mater. 2016, 125, 1044–1054. [Google Scholar] [CrossRef]
Figure 1. Grading curves of the waste materials.
Applsci 08 00282 g001
Figure 2. Multidimensional analysis stages.
Applsci 08 00282 g002
Figure 3. Dendrogram showing similarities between recycled MCAS mixes with waste materials.
Applsci 08 00282 g003
Figure 4. Grouping of the mixes based on: (a) dynamic modulus (E) at 5 °C; (b) phase angle (δ) at 40 °C.
Applsci 08 00282 g004
Figure 5. Grouping by: (a) moisture resistance (TSR and WRW+2M); (b) indirect tensile strength at 25 °C (ITS).
Applsci 08 00282 g005
Figure 6. Grouping by (a) air void content (Vm), absorption (Nw); (b) density (ρMCAS).
Applsci 08 00282 g006
Figure 7. Canonical value scatter plot.
Applsci 08 00282 g007
Table 1. Mineral–cement mixture with foamed bitumen (MCAS) recycled mixture types with waste materials.
MixtureType 1 (D/P/A)Type 2 (B/P/A)Type 3 (RAP/SG)Type 4 (RAP/VA)Type 5 (RC/VA)Type 6 (RA/VA)
Amount of foam bitumen (A)1.2%; 2.4%; 3.6%1.2%; 2.4%; 3.6%2.5%2.5%2.5%2.5%
Amount of cement (C)2.0%2.0%2.0%2.0%2.0%2.0%
Amount of additional dust (P)5%; 12.5%; 20% Dolomite (D)5%; 12.5%; 20% Basalt (B)----
Amount of steel slag (SG)--50%---
Amount of virgin dolomite aggregate (VA)---80%; 60%; 50%; 40%; 20%80%; 60%; 40%; 20%80%; 20%
Amount of RAP (RAP)--50%20%; 40%; 50%; 60%; 80%20%; 40%; 60%; 80%-
Amount of recycled aggregate (RA)-----20%; 80%
Table 2. Eigenvalues of new variables.
Value No.Eigenvalues (Correlations) and Related Statistics
Eigenvalue% of VarianceCumulative EigenvalueCumulative %
120.5165256.9903520.5165256.9903
27.5783621.0510128.0948978.0414
32.263426.2872730.3583084.3286
41.639304.5536031.9976088.8822
50.792792.2021932.7903991.0844
Table 3. Correlation and eigenvector between the factors and real variables.
VariableFactors-Variables Correlation (Factor Loadings)Eigenvector (Based on Factor Loadings)MeanStandard Deviation
Z1Z2Z3Z4Z1Z2Z3Z4
ρMCAS (Mg/m3)−0.399209−0.3657310.173339−0.569877−0.088135−0.1328540.115217−0.4450952.240.060
Nw (%)0.0046690.762452−0.4997380.3477420.0010310.276965−0.3321700.2715992.751.042
Vm (%)0.2013740.710880−0.2883580.0525670.0444580.258231−0.1916680.04105711.262.171
ITSDRY (kPa)−0.327910−0.5169540.470119−0.429201−0.072394−0.1877860.312482−0.335222609.63191.513
TSR (%)0.100090−0.2677480.5053180.6566110.022097−0.0972610.3358790.51283783.8914.416
WRW+M2 (%)−0.031076−0.0545520.6778230.480963−0.006861−0.0198160.4505410.37564978.4913.686
Elastic modulus, E (MPa)10 Hz−7 °C−0.788323−0.551240−0.1277250.141726−0.174041−0.200241−0.0848970.11069313,160.724982.906
1 Hz−0.815361−0.523406−0.1350340.122257−0.180011−0.190130−0.0897560.09548712,137.384670.719
0.1 Hz−0.846137−0.482033−0.1351340.108796−0.186805−0.175101−0.0898220.08497311,133.584342.440
10 Hz5 °C−0.875098−0.458662−0.1052750.043740−0.200304−0.144134−0.0717950.0367299848.993889.504
1 Hz−0.899953−0.408318−0.1182610.046226−0.204970−0.123379−0.0858840.0335588623.683512.044
0.1 Hz−0.922513−0.355705−0.1215460.039734−0.201346−0.100674−0.0894040.0827867261.833301.671
10 Hz13 °C−0.907281−0.396783−0.1080130.047026−0.206071−0.107888−0.0892790.0056498294.503256.261
1 Hz−0.928417−0.339649−0.1292100.042966−0.210645−0.077970−0.0966310.0063056880.202798.289
0.1 Hz−0.912001−0.277144−0.1345050.105995−0.212857−0.043647−0.1056940.0053325569.012360.482
10 Hz25 °C−0.933401−0.297004−0.1343170.007233−0.212419−0.050451−0.1020880.0624496058.102534.833
1 Hz−0.954121−0.214643−0.1453780.008072−0.212245−0.011061−0.1142790.0662274767.982092.121
0.1 Hz−0.964142−0.120156−0.1590140.006826−0.2081360.030821−0.1298030.0612393820.171754.616
10 Hz40 °C−0.962154−0.138886−0.1535870.0799570.095179−0.070764−0.255309−0.2388384.101.106
1 Hz−0.961366−0.030450−0.1719280.0847940.199469−0.005856−0.1883980.0438704.381.036
0.1 Hz−0.9427570.084846−0.1952840.0784080.172904−0.068660−0.1731350.1588994.821.707
Phase angle, δ, (o)10 Hz−7 °C0.431117−0.194805−0.384104−0.3057960.149790−0.166651−0.274779−0.0140285.941.502
1 Hz0.903497−0.016120−0.2834380.0561700.193354−0.158429−0.0821300.0012656.741.429
0.1 Hz0.783171−0.189013−0.2604760.2034460.148220−0.152221−0.0598170.1114207.662.093
10 Hz5 °C0.729772−0.220053−0.2970670.2843980.180983−0.168883−0.017755−0.0396497.421.708
1 Hz0.917516−0.247012−0.2111930.0237460.159792−0.244296−0.020388−0.0162348.751.786
0.1 Hz0.924085−0.272070−0.1862730.0011420.135627−0.278374−0.015123−0.0082849.892.066
10 Hz13 °C0.678478−0.458771−0.413395−0.0179600.109687−0.2926960.0519750.0719409.942.250
1 Hz0.875799−0.436136−0.1235620.0016200.105587−0.3126530.0385880.02757910.332.361
0.1 Hz0.671367−0.419046−0.0899930.1426560.106238−0.3032820.0168370.04590810.052.512
10 Hz25 °C0.819764−0.464915−0.026712−0.0507650.161115−0.079935−0.1974570.2221255.131.323
1 Hz0.723780−0.672517−0.030673−0.0207850.202564−0.089729−0.1403780.0185465.581.290
0.1 Hz0.614327−0.766331−0.022751−0.0106070.204014−0.098831−0.1238140.0008926.361.475
10 Hz40 °C0.496829−0.8057590.0781940.092109−0.193199−0.166612−0.0699750.03416311,012.434352.296
1 Hz0.478259−0.8606980.0580540.035310−0.198686−0.148324−0.0786070.0361059921.764004.010
0.1 Hz0.481209−0.8349010.0253300.058778−0.203667−0.129212−0.0807900.0310338793.243645.950
All variables highly correlated with given factor were bolded.
Table 4. List of recycled mixtures after preliminary classification in clusters (groups).
Group 1Group 2Group 3
B/P5/A1.2B/P5/A2.4B/P5/A3.6
B/P12.5/A1.2B/P12.5/A2.4B/P12.5/A3.6
B/P20/A1.2B/P20/A2.4B/P20/A3.6
D/P5/A1.2D/P5/A2.4D/P5/A3.6
D/P12.5/A1.2D/P12.5/A2.4D/P12.5/A3.6
D/P20/A1.2D/P20/A2.4D/P20/A3.6
RAP50/SG50RA20/VA80RAP60/VA40
RAP40/VA60RA80/VA20RAP80/VA20
RC80/VA20RAP20/VA80RC40/VA60
RAP50/VA50
RC20/VA80
RC60/VA40
Table 5. Discriminant variables choice results.
N = 89Summary of Discriminant Function Analysis F (8.166) = 39.124 p < 0.0000
Wilks’ LambdaPartial Wilks’ LambdaF to Remove (2.83)pTolerance1-Tolerance (R2)
Z10.2395620.50135941.27500.0000000.9593530.040647
Z20.4605460.260792117.63090.0000000.8932450.106755
Z30.1219890.9845650.65060.5243860.9919390.008061
Z40.1502450.79940110.41390.0000920.8642170.135783
Table 6. Chi-squared test results for subsequent roots.
Removed RootsChi-Squared Tests of Roots
EigenvalueCanonical RWilks’ Lambdaχ2dfp
03.0293390.8670760.120106179.087480.000000
11.0663320.7183670.48394961.328030.000000
Table 7. Raw canonical function coefficients.
VariableRaw Canonical Coefficients for Variables
V_1V_2
Z10.032485−0.300443
Z20.6948750.069673
Z3−0.0193450.112120
Z4−0.3952120.249668
Constant0.0000000.000000
Eigenvalue3.0293391.066332
Table 8. Discriminant function coefficients for recycled MCAS mixes with waste materials.
VariableClassification Functions
G_1:1 p = 0.30337G_2:2 p = 0.37079G_3:3 p = 0.32584
Z1−0.444940.305430.06670
Z20.368491.14900−1.65056
Z30.16332−0.12652−0.00808
Z40.23067−0.893270.80172
Constant−2.42206−2.84355−3.94296
Table 9. Projection coordinates of mineral–cement–emulsion (MCE) mixtures based on maximized discriminant functions.
ParameterGroup 1Group 2Group 3
Vm15158
ITS310310310
TSR957095
WRW+2M957095
E* (10 Hz, 5 °C)900090009000
V_1−0.0572900.734094−0.600156
V_20.321659−0.2072870.342952