Article

Three-Dimensional Identification for Unbalanced Mass of Rotor Systems in Operation

School of Instrument Science and Opto-electronics Engineering, Hefei University of Technology, No. 193 Tunxi Road, Hefei 230009, China
*
Author to whom correspondence should be addressed.
Appl. Sci. 2018, 8(2), 173; https://doi.org/10.3390/app8020173
Submission received: 1 December 2017 / Revised: 11 January 2018 / Accepted: 18 January 2018 / Published: 25 January 2018

Abstract

:
Unbalanced mass identification is important for rotor systems. Current methods normally use sensors, which only detect vibration in two-dimensional (2D) space. Actually, the rotor systems vibrate in three-dimensional directions. In this paper, a non-contact method is developed to identify unbalanced mass of rotor systems in 3D space. A stereo video system with a pair of synchronized high-speed cameras is established and a feature point is employed to replace traditional contact transducer for measurement. Checkerboard target on a vibration table is used to implement dynamic calibration. The proposed method is compared with eddy current method and laser displacement method. The comparison experiments verify the detection ability of the unbalanced mass for the proposed method. Overall, the proposed method can provide more information than 2D detection methods, which has the great potential for fault diagnosis of rotating machinery.

1. Introduction

Rotor systems play an important role in gas turbine, aircraft engine, industrial compressors, and many other machineries. A typical rotor failure is the nonconforming response problem caused by unbalanced mass. The unbalanced mass is probably induced by bending of bearing, asymmetric rotor, cracked rotor and so on [1]. However, measuring the unbalanced mass of rotating machinery under operating conditions is difficult. Most contact measurement methods are unavailable for operating rotor systems [2,3]. Traditional contact transducers are directly attached to the structure to measure vibrations, which results in unwanted mass-loading that affects the whole dynamic system. The non-contact sensors, typically eddy current sensors, measure the vibration in one- or two-dimensional dynamical responses for rotor systems. Based on the 1D or 2D vibration information, two groups of identification methods have been developed: model-based methods [4] and statistical methods [5]. The model-based methods, for example, the classical influence coefficient method [6] and modal balancing method, identify the parameters by the model emanating from a physics model without considering the uncertainties. The statistical methods estimate the parameters on the basis of statistical models such as autoregressive-moving average with exogenous terms (ARMAX) models [7], expert systems [8] and machine learning algorithms [9]. A. Lee, J.K. Sinha and M. Friswell comprehensively review the identification methods of rotating machinery, and point out that, no matter what kind of identification method is used, as much data as possible should be provided, such as directions, positions, and the vibration responses, to ensure the best possible model is developed [10].
The actual vibration of rotor-bearing systems is in three-dimensional space, which performs quite different with the analysis based on 2D information [11]. When the rotor operates in low rotating speed, the vibration responses are mainly in a plane and the rotor can be treated as rigid at this condition. If the rotating speed keeps increasing, the flexibility of the rotors cannot be ignored and the dynamic responses are three-dimensional for the flexible rotor systems, which raise a challenge for the measurement technology. The traditional sensor measurement is not adequate for this challenge and new measurement methods are required [12]. Recently, different non-contact vibration-based measurement methods have been developed such as laser vibrometers [13,14], stator current method, digital image correlation (DIC) and videometric technology. Ling et al. determine the torsional vibration of a rotating shaft system under electrical network impact using laser doppler vibrometer [15]. Stator current-based methods use the current information from the stator of a motor to identify the motor failure even the gearbox perturbations [16]. F. Trebua et al. discuss the advantages and disadvantages of existing non-contact measurements in detail and introduce that DIC techniques which have the potential to provide 3D data at a wealth of points at a time [17]. DIC is a full-field measurement technique for deformation measurement which is developing rapidly over the years [18]. The studies of the photogrammetry make significant progress in the speed of image processing and measurement accuracy [19,20]. In the meantime, this technique is widely applied to identify the displacement and strain of materials and structures [21]. However, DIC random speckled patterns are usually applied to a structure for the DIC approach, which are difficult to remove after the testing and lead to long duration measurement images in different time series [22]. Moreover, DIC has some limitations for high frequency measurement and requires relatively complex algorithms to obtain initial prediction parameters to converge correctly and rapidly [23]. 3D point tracking (3DPT) stereovision measurement is a method to obtain surface information of a static structure by three-dimensional reconstruction [24,25]. Unlike DIC techniques, 3DPT does not need spraying speckled patterns on the surface of the structure and only requires some discrete points. To apply 3D point stereovision measurement for dynamic test, videometric technology is adopted for the development of 3DPT technology. Y. Wang et al. [26] investigate the dynamic error distribution of 3DPT stereo video measurement for vibration test and analyze the possibility for vibration reconstruction with high accuracy. J. Zhang et al. [27] use an error compensation method and achieve the high accuracy reconstruction for sinusoidal motion by the videometric measurement based on 3DPT method. J. Baqersad et al. obtain the modal identification of a wind turbine by videometric measurement [28]. In another research of wind turbine, videometric method derived from 3DPT method is applied to determine the large-scale blade deformations [29]. To the best of authors’ knowledge, no research has been reported for the unbalanced mass detection by video metric technology.
In this paper, a modified videometric measurement is presented for unbalanced mass detection of rotating system in operation. The 3D displacement components and corresponding vibration frequency, which are important information for parameters identification, are measured by videometric method for rotating systems. The changes in orbits of the movement of the rotor center caused by different unbalanced mass are also investigated and compared with the measurement results from eddy current sensors and laser displacement sensors. The structure of this paper is as follows. In Section 2, a detailed introduction of the model and measurement procedure is given. The experimental setup is introduced in Section 3. In Section 4, the results of non-imbalance experiment and different unbalanced mass experiments are discussed. Finally, the conclusions are drawn in Section 5.

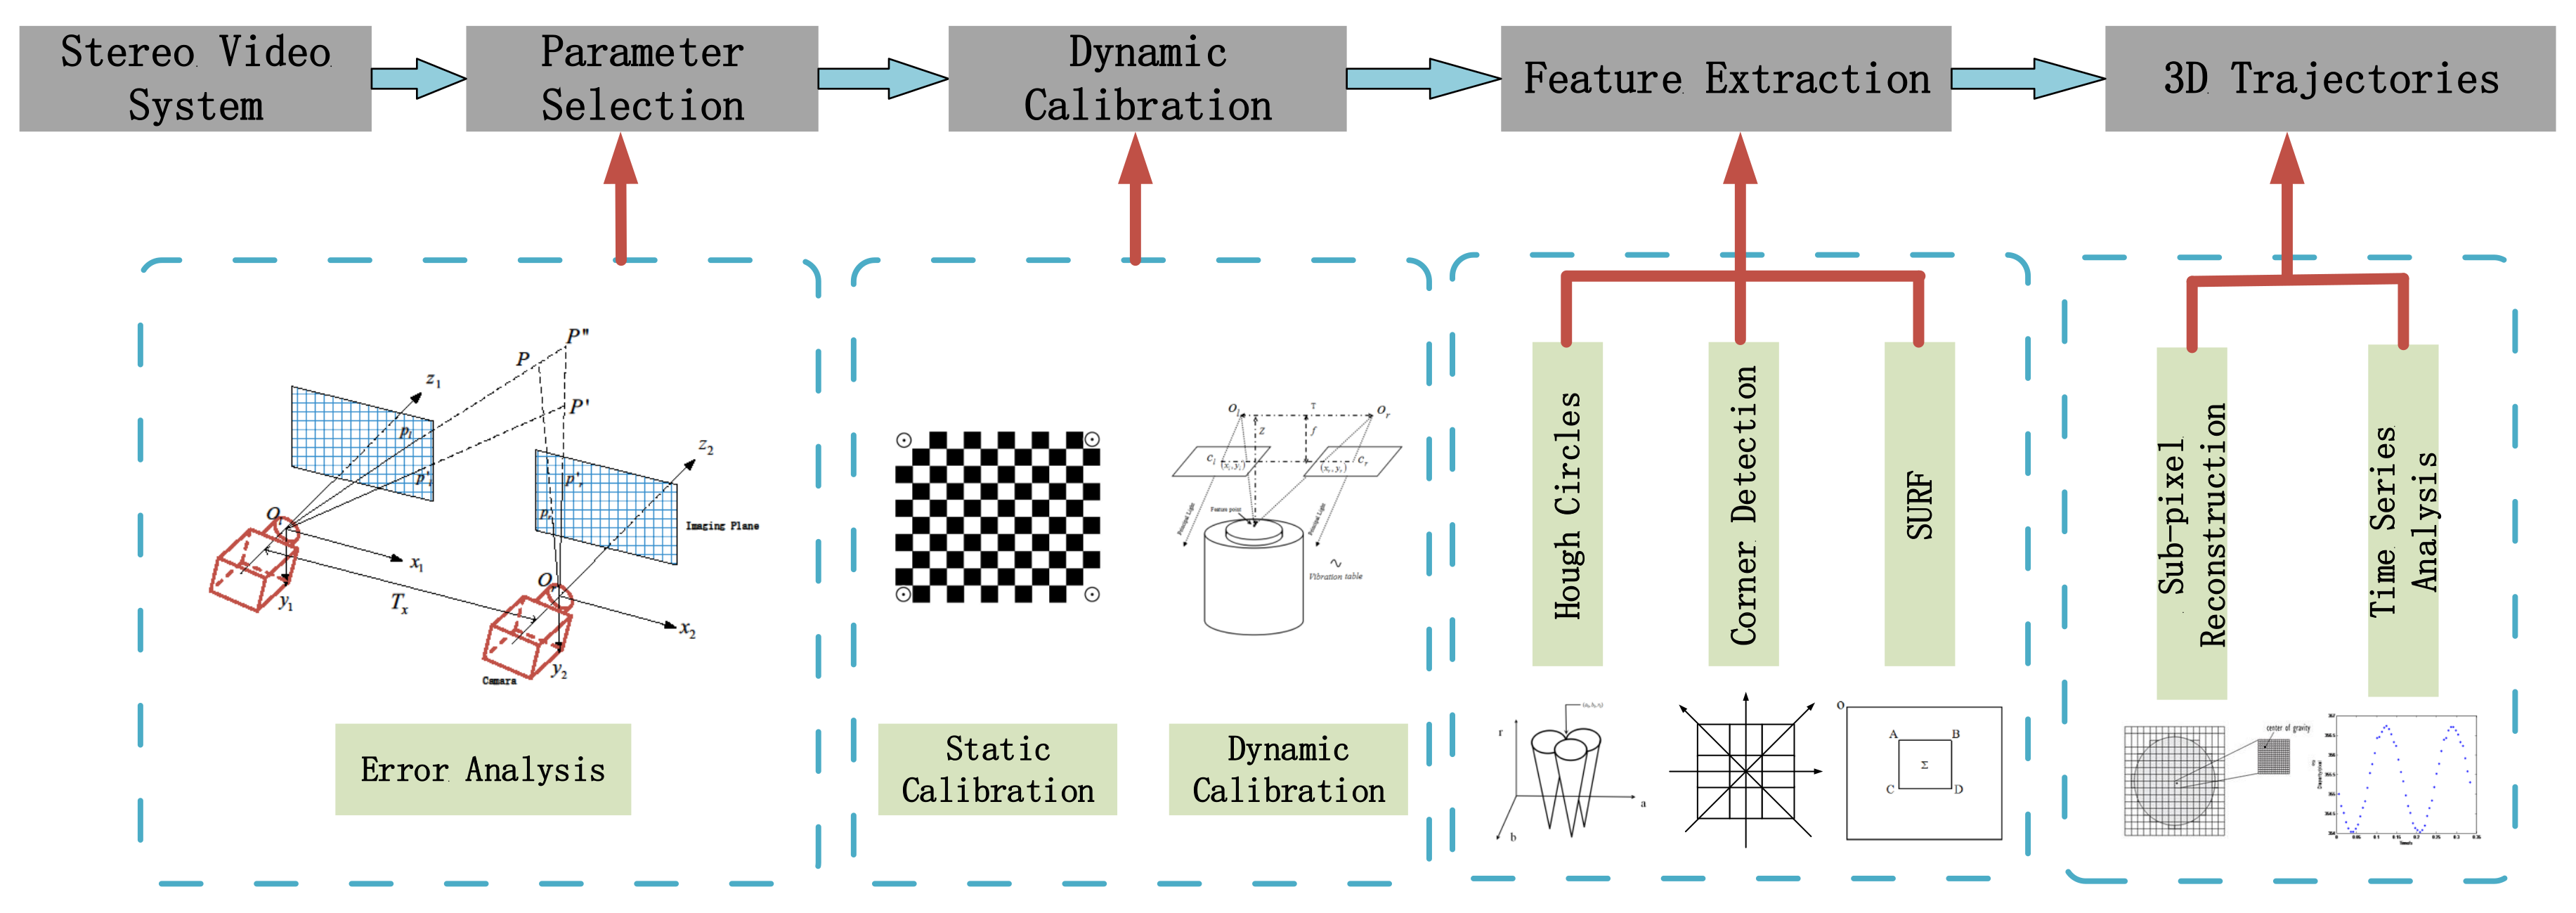
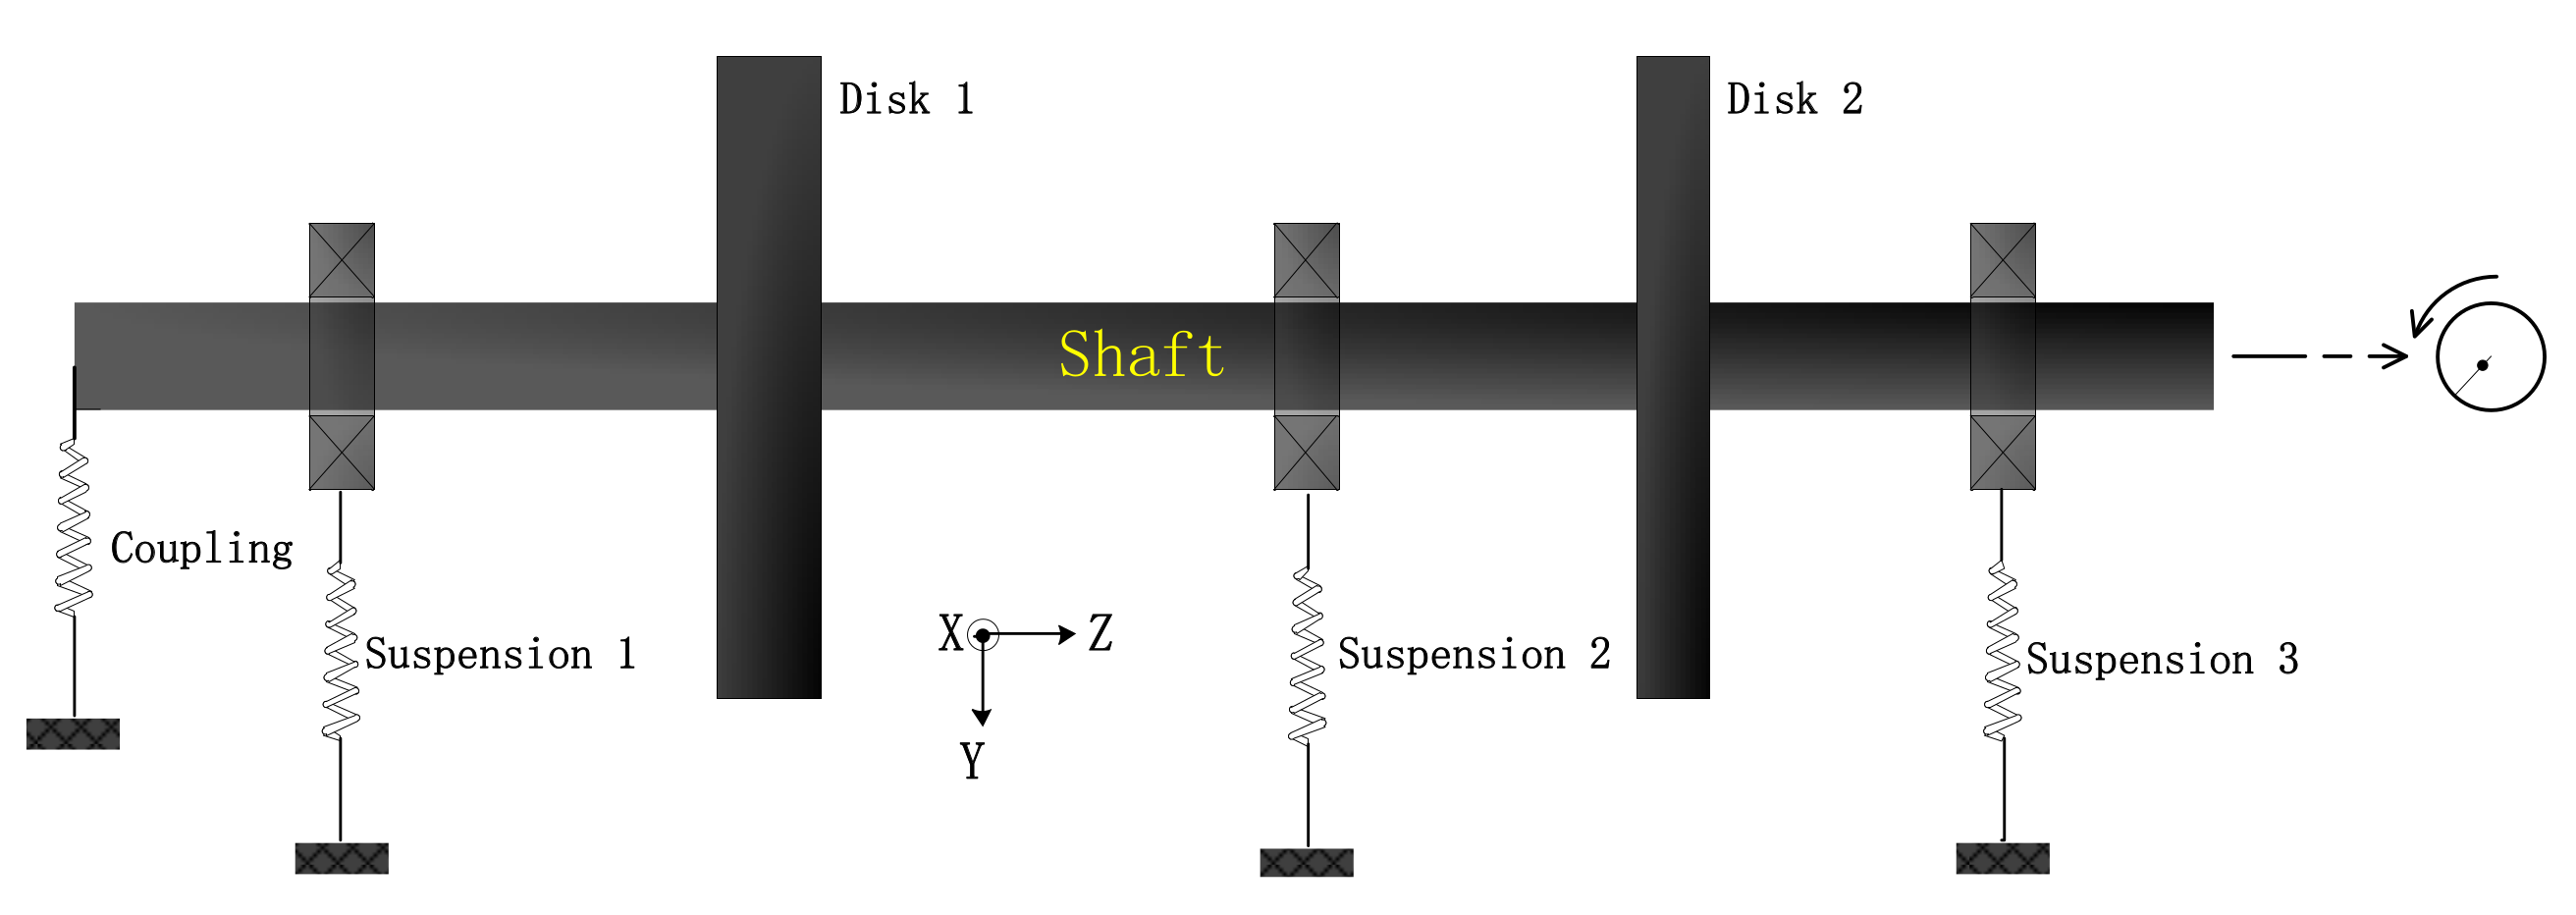
2. Model and Measurement Procedure

The entire procedure to identify the 3D unbalance mass with the stereo video system includes parameters selection, calibration, feature extraction, error analysis and reconstruction of 3D trajectories. The flowchart is presented in Figure 1. For the videometric technology, the distance between the cameras, the distance from the target, the camera resolution and other parameters affect the physical resolution of the measurement system. Thus, the suitable parameters are selected by the error analysis. The detail of error analysis is in the authors’ previous paper [26]. Calibration is important for the 3DPT reconstruction. The intrinsic parameters and external parameters of cameras are calibrated firstly by the classic Zhang’s method using checkerboard. Our previous work find the dynamic calibration is a solution for dynamic error compensation in the 3DPT videometric measurement technology [27]. A standard sinusoidal signal is provided by the vibration table for the dynamic calibration. Feature extraction and sub-pixel reconstruction are subsequently used for the 3D reconstruction for one image. The 3D trajectories are reconstructed for the unbalanced mass detection based on the time series information.

2.1. Model Error Analysis

In parameters selection process, the point P is assumed to move sinusoidally in a specific axis. At initial time, the coordinate of P is ( X w , Y w , Z w ) , the projections on the imaging planes are P l ( x 1 , y 1 ) , P r ( x 2 , y 2 ) . After Δ t , P moves to P ( X w , Y w , Z w ) , and the projections change to P l ( x 1 , y 1 ) , P r ( x 2 , y 2 ) . The measurement result of P is P ( X w , Y w , Z w ) . In actual measurement, there is a deflection angel θ between two cameras, and E x , E y , E z are the relative errors which can be compensated by Wang’s method [26].
E x = ( 1 + θ ) ( Z w + T z ) Δ S Z w ( 1 + θ ) ( T z Δ S ) + ( θ 1 ) Y w T z ( T x T y ) Z w
E y = ( θ 1 ) ( T z + Z w ) Δ X w ( 1 + θ ) T z + ( θ 1 ) ( Y w T z Δ Z w ) ( T x T y ) Z w
E z = [ T y T x + Y w X w θ ( X w + Y w ) ] Δ ( 1 + θ ) X w ( Δ + T z ) + ( θ 1 ) ( Δ + T z ) Y w ( T x T y ) Z w
Further accuracy analysis of both parallel and unparallel binocular stereo vidio models is also discussed in detail in Wang’s paper [26].

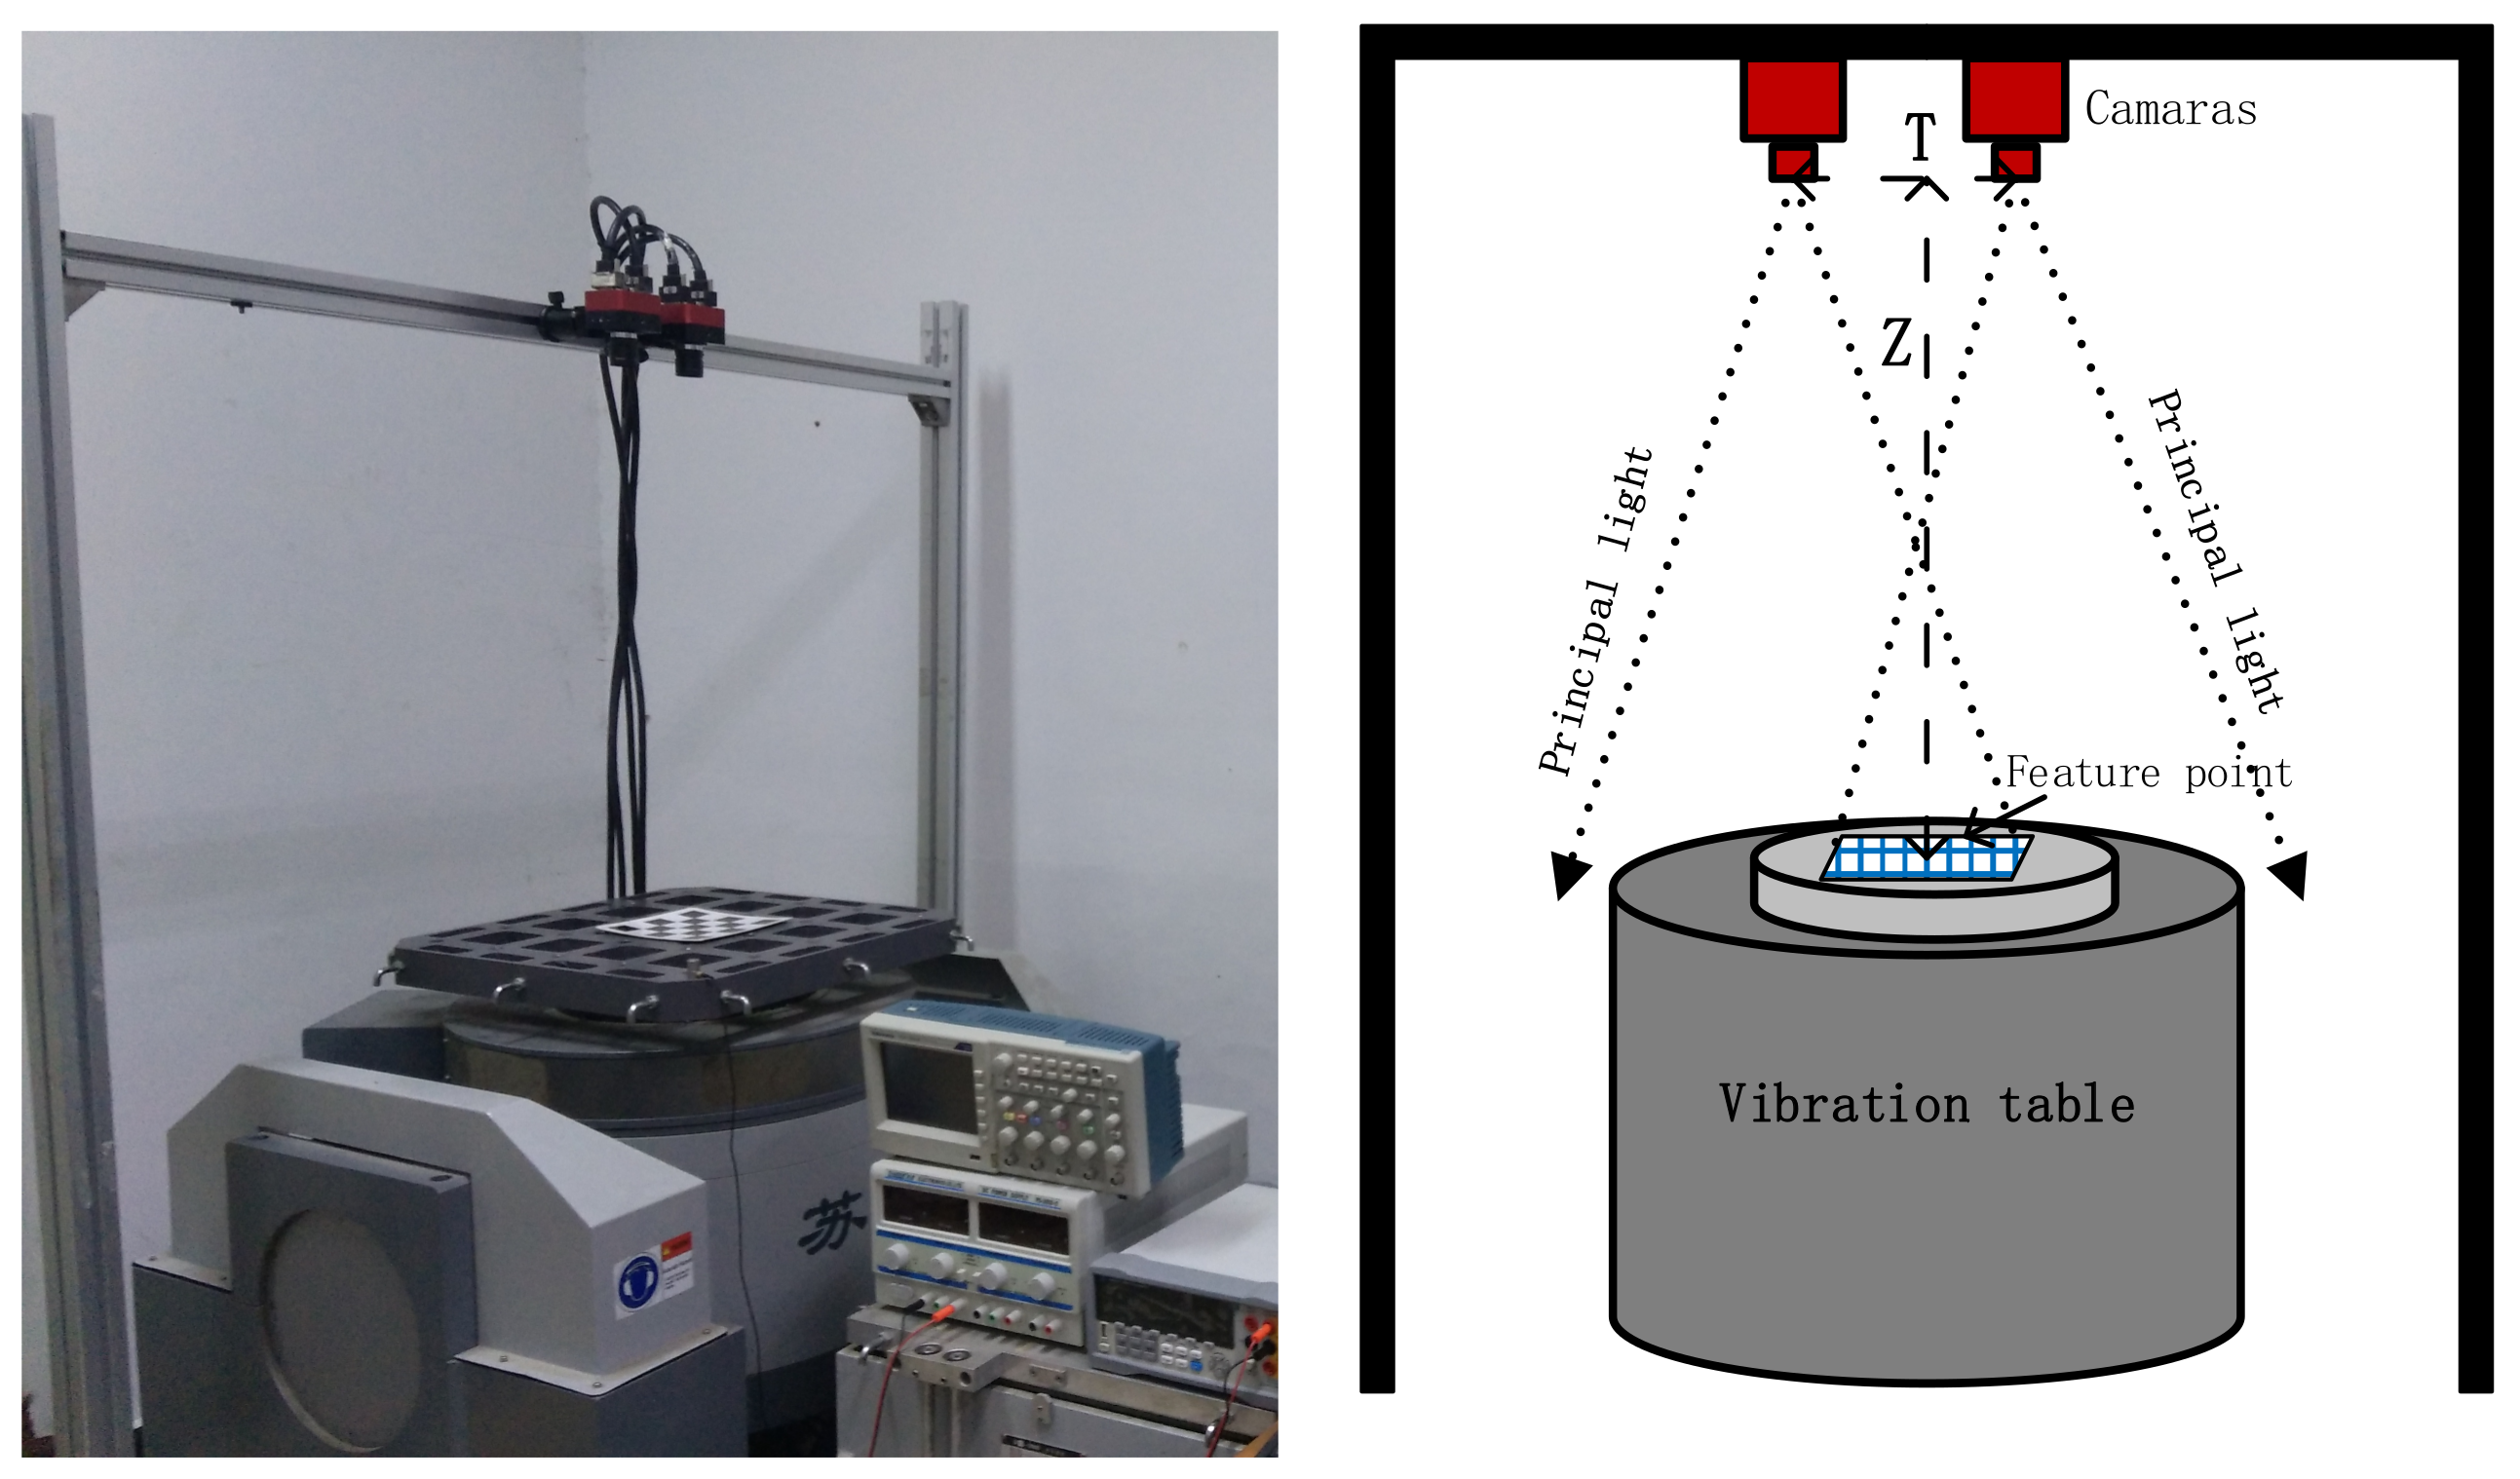
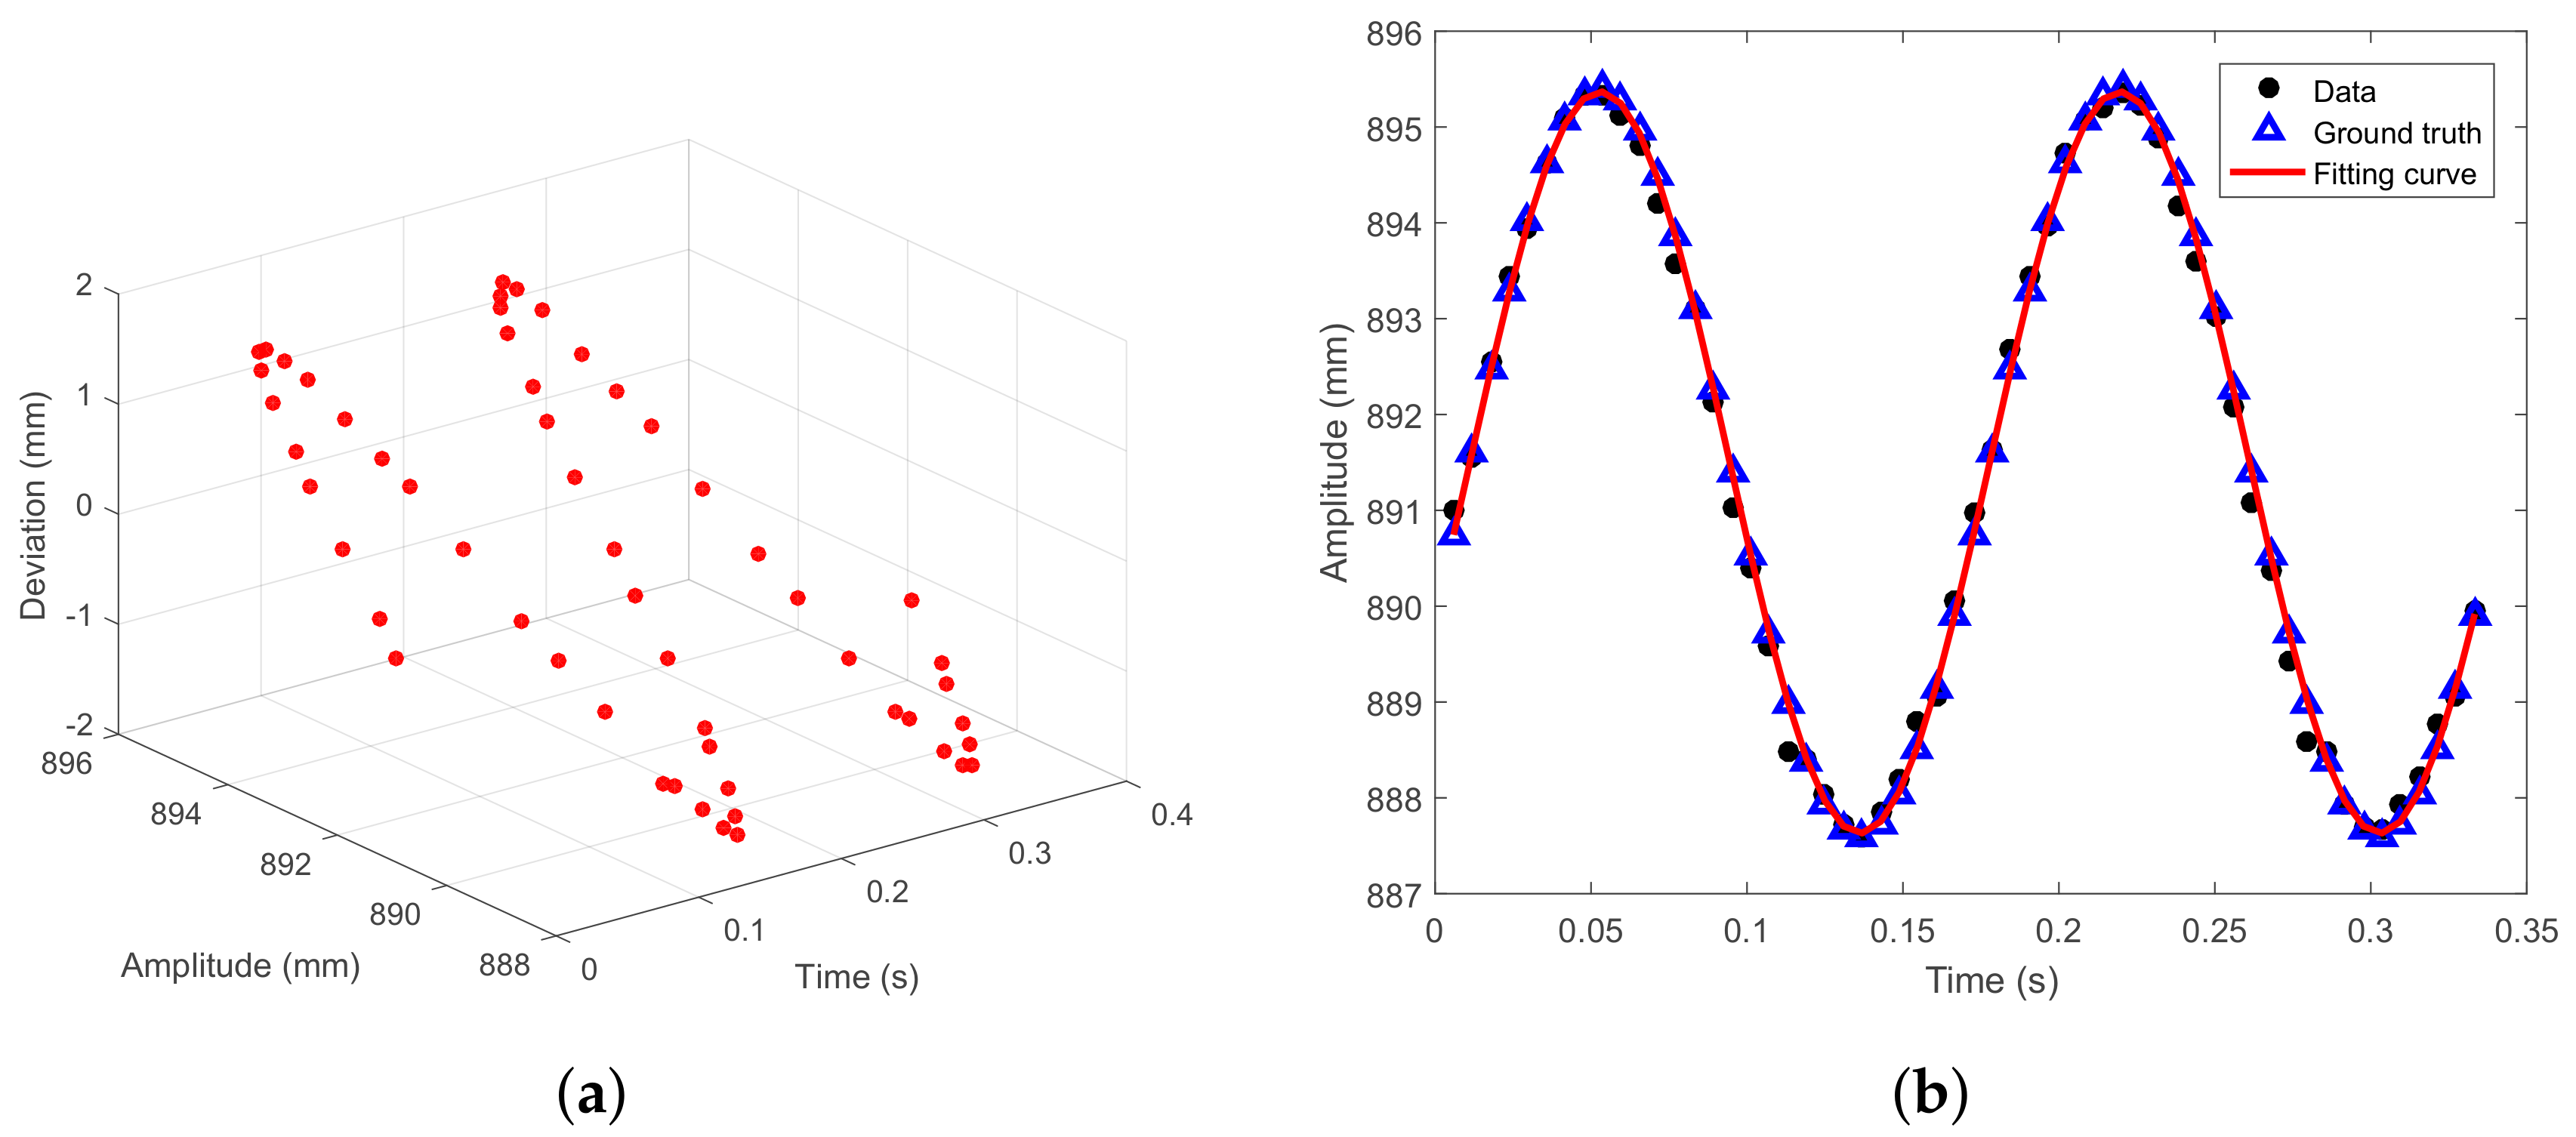
2.2. Dynamic Calibration

Calibration is important for the accuracy of vibration reconstruction. The previous calibration for vision system normally only detects the static parameters of the system. In this paper, for the purpose of dynamic calibration, a vibration table is used to calibrate the precision of the stereo video system for dynamic tests. In Figure 2, a standard sinusoidal motion is provided by the vibration table and a checkerboard is placed on the vibration table. The sinusoidal motion is the basic motion in vibration and a vibrational motion can be treated as the sum of different sinusoidal motions. This is the reason why we use the sinusoidal motion for dynamic calibrations. The vibration frequency is 6 Hz and the amplitude is 4 mm, while the sample frequency of cameras is 168 Hz. Zhang’s checkerboard target method is adopted and the three steps of calibration are described as follows [30]:
  • Calibrate cameras for intrinsic and extrinsic parameters.
  • Operate the vibration table at the standard frequency and amplitude.
  • Compensate dynamic errors.

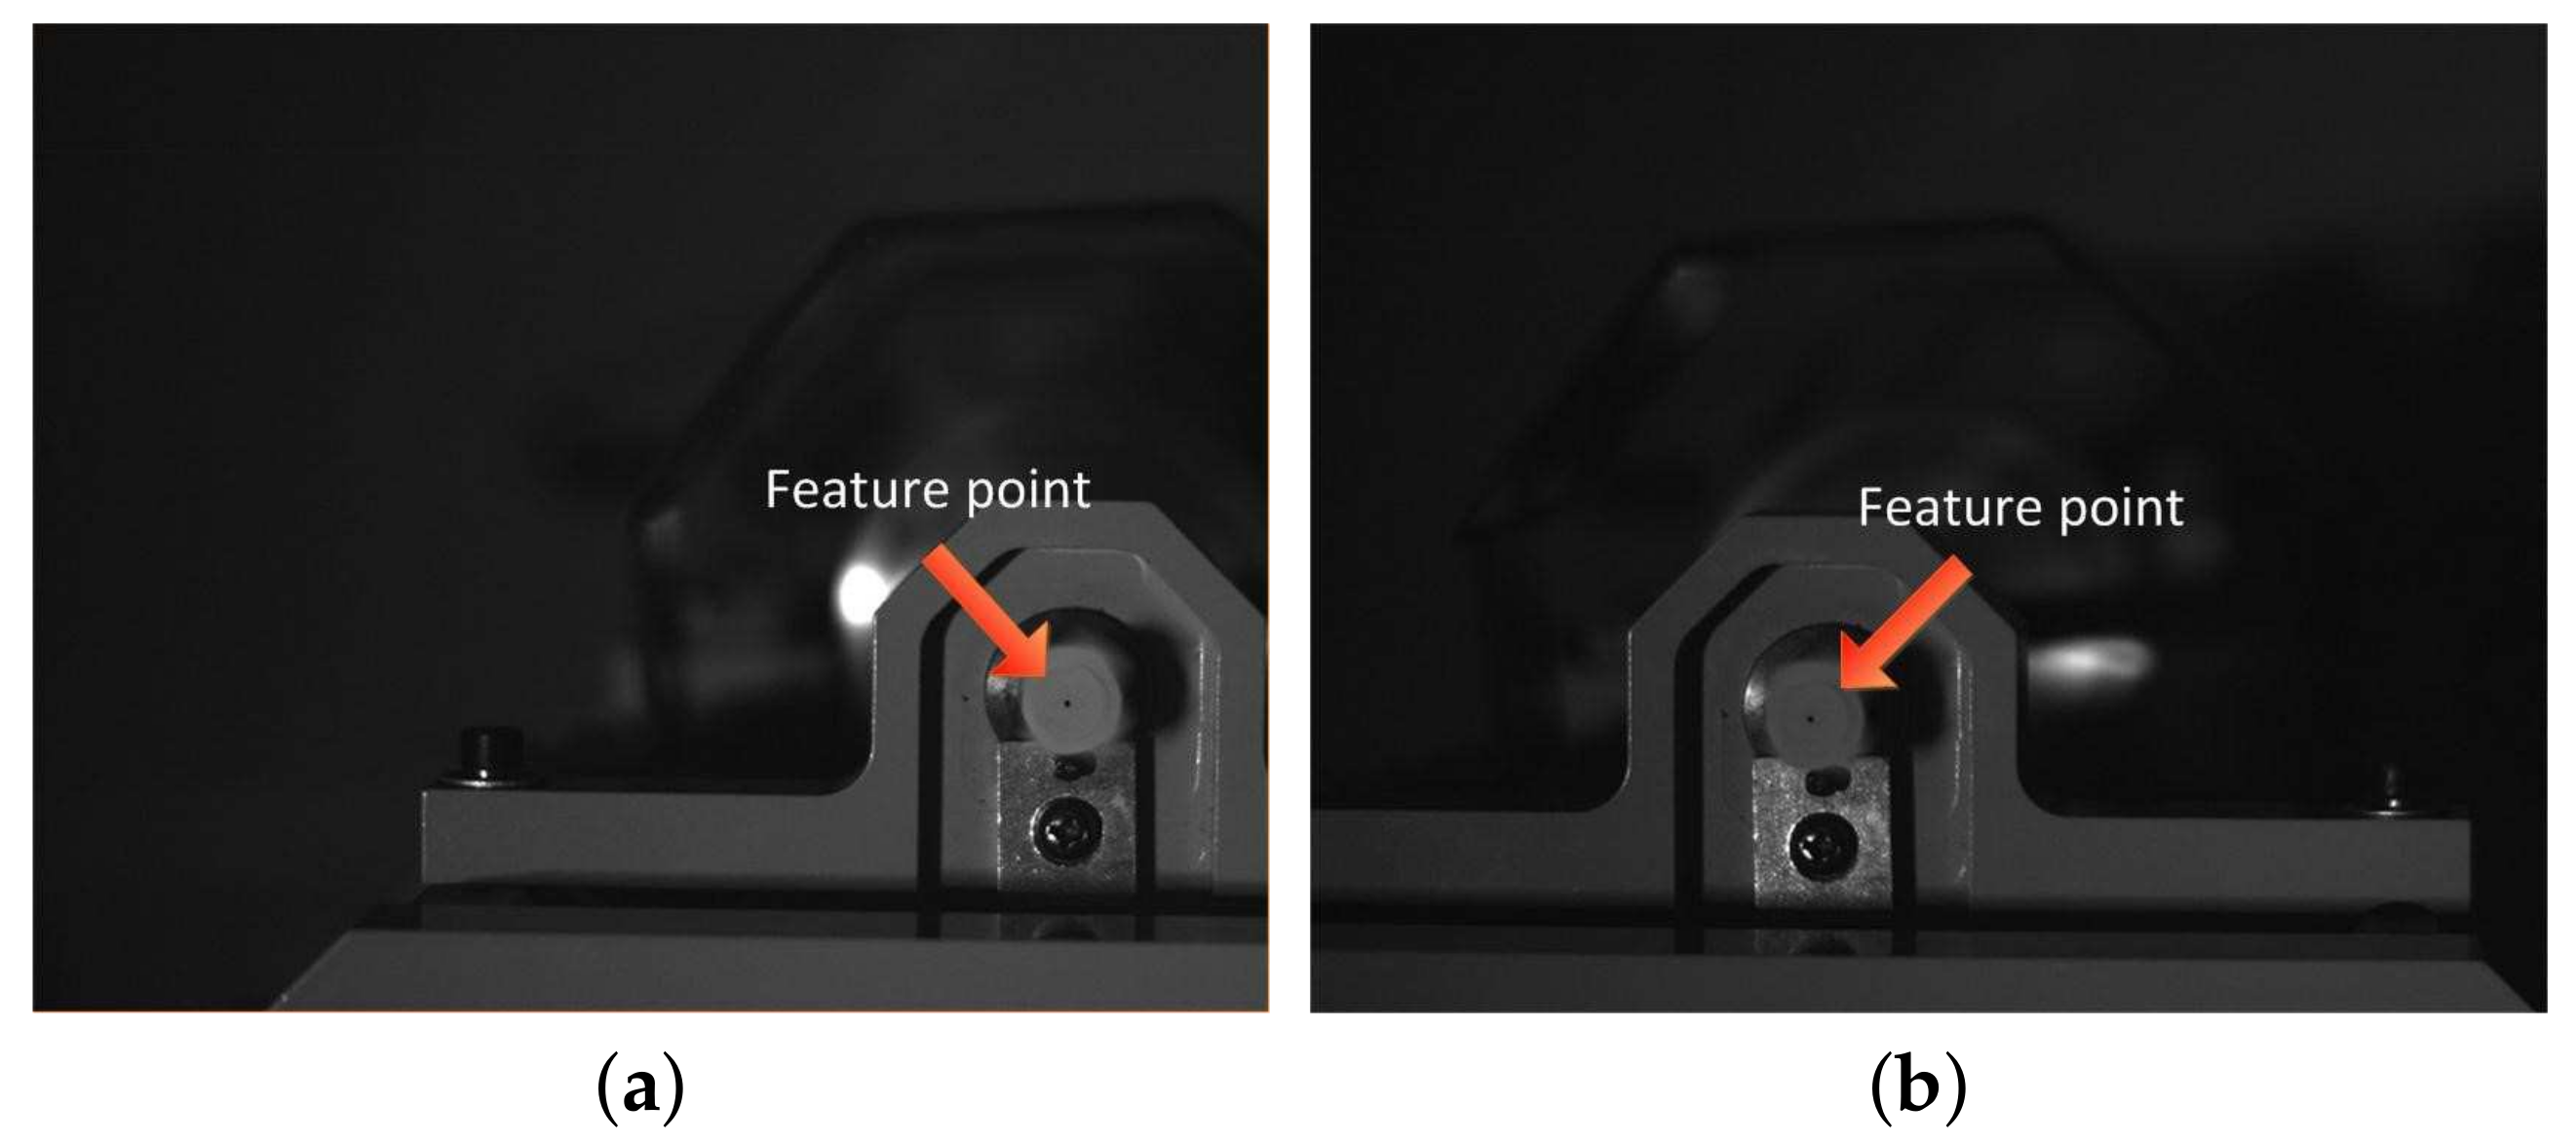
2.3. Feature Extraction

Classic methods to extract feature in image processing include Hough circles, corner detection, speed up robust features(SURF). and so on. In this paper, the SURF is selected to detect the marks of the feature point, which is a scale and rotation invariant detector and descriptor proposed by Herbert Bay in 2007 [31]. Because of the accuracy and stability, SURF detector is more suitable for videometric method in dynamic testing.

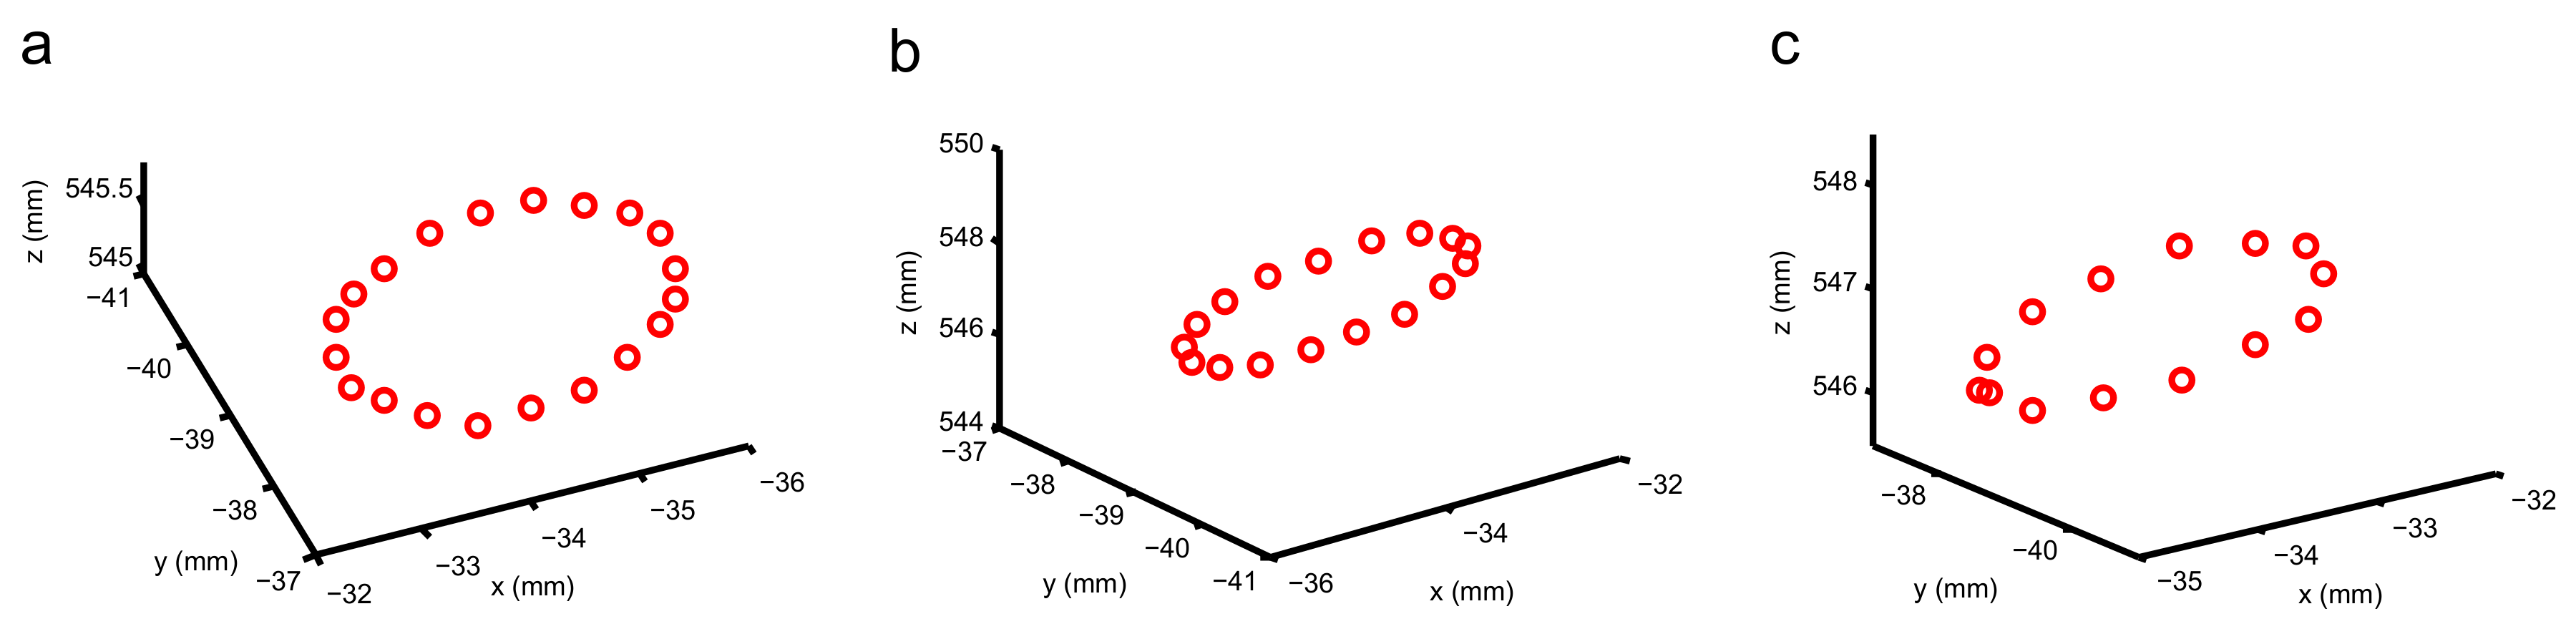
2.4. 3D Reconstruction
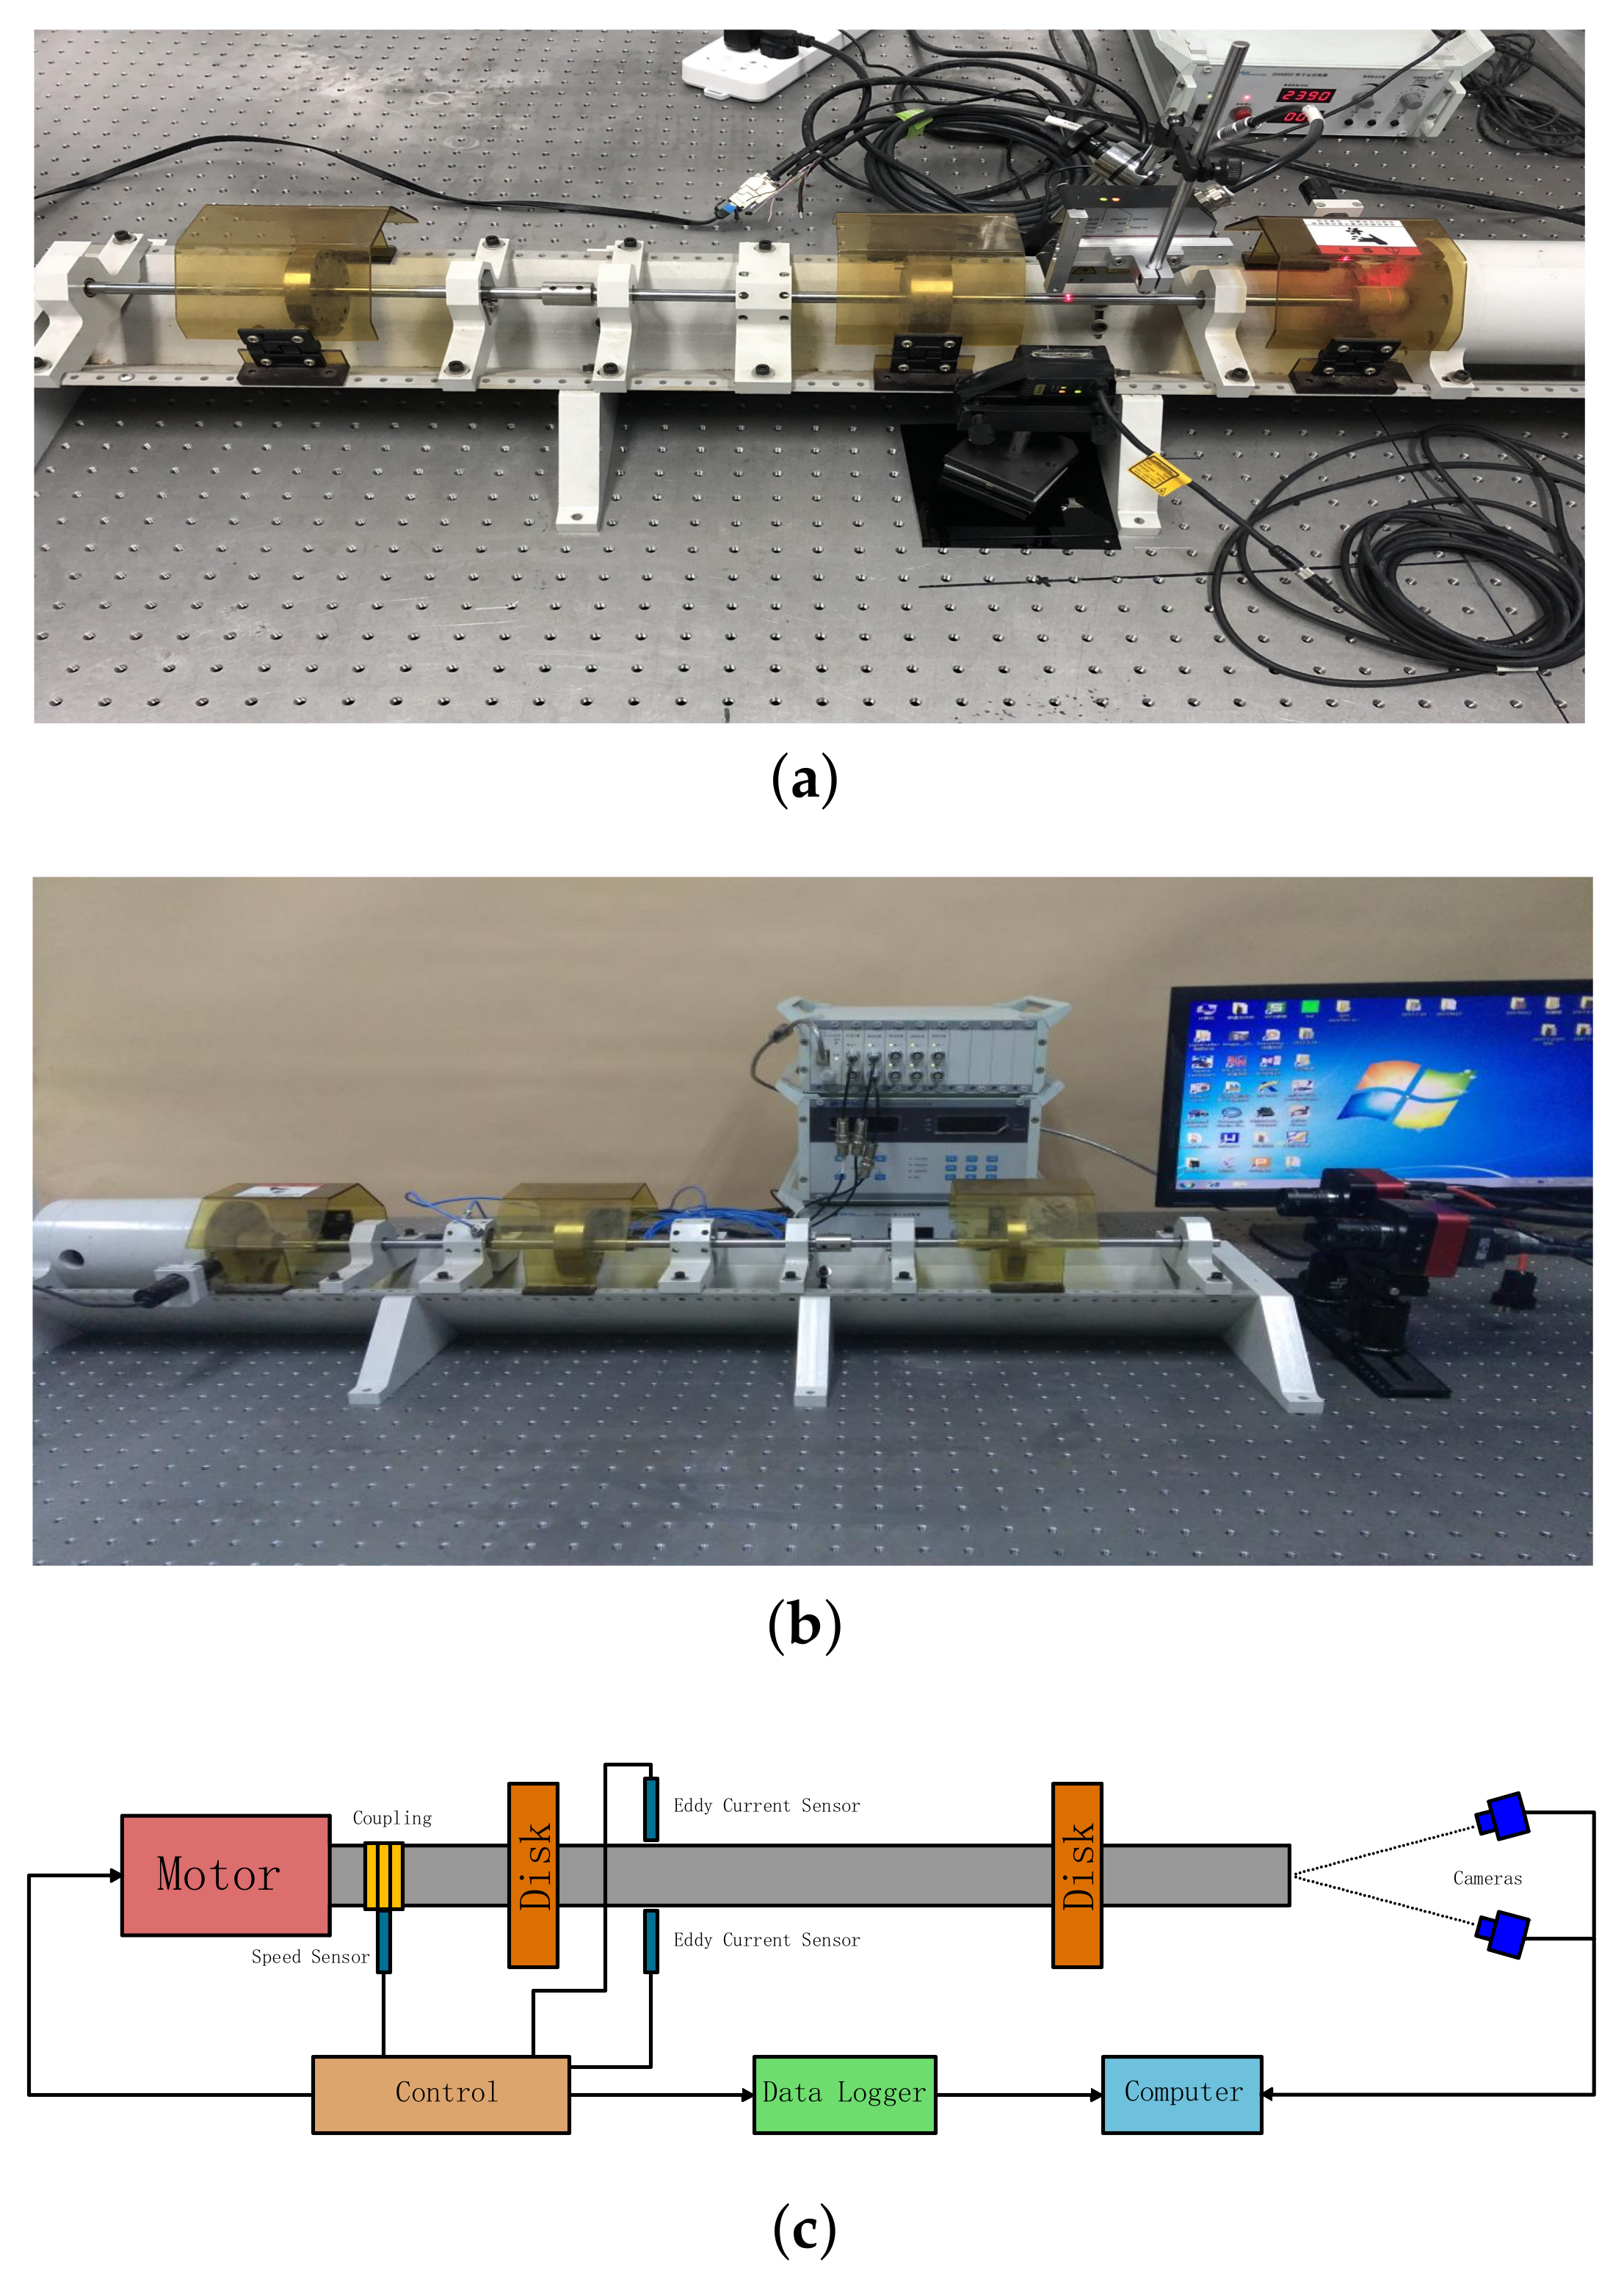
Better resolution of the stereo video system is expected for the measurement of higher precision requirement [32], especially for measurements in the out-of-plane direction. An effective way to improve the resolution is to increase sub-pixel accuracy. Here, Taylor expansion interpolation is used for the resolution of 0.1 mm displacement corresponds to 0.1 pixel [27].
The dots in Figure 3a represent the final 3D reconstruction results with the method of Taylor expansion, which are fitted to a sinusoidal curve that coincides with the standard motion. The further accuracy analysis data of Figure 3a are shown in Table 1. The ground truth here representing vibration information is measured by laser displacement sensor. From the projection in Figure 3b, the amplitude in a plane is 3.91 mm, which is very close to the ground truth of 3.87 mm.

3. Experiment

The experimental setup is shown in Figure 4. A high-speed dual camera image acquisition system includes two high-speed cameras (Flare-CL offered by IO Industries in Canada) equipped with 25 mm lenses, two Xcelera-CL image acquisition cards, a ring light, a signal generator and a computer. The rotor machine, eddy current sensors and Xcelera-CL image acquisition cards are all offered by Donghua Testing Technology Compony in Jiangsu of China. The laser displacement sensors are offered by Micro-Epsilon (Beijing) Measurement Compony in Beijing of China.
Two high-speed cameras are mounted on a crossbar atop a tripod and they are able to capture images with spatial resolution of 1280 × 1024 pixel at a rate of 300 fps (frames per second). A signal generator is used to transmit the trigger signal for the purpose to ensure sufficiently high synchronization accuracy. Figure 4c is a brief schematic of the whole testing system. The high-speed cameras are placed in front of the end face of the rotor bearing systems as shown in Figure 4c to capture images. To define the X O Y plane of the world coordinate system parallel to the end face of the rotor bearing systems, the lens of left camera are set perpendicular to the shaft because the origin of the world coordinate system is the optical center of left camera. The rotation of the shaft is in X O Y plane of the world coordinate system and the out-of-plane movement is considered as turbulence caused by imbalance and defects in shaft [33,34]. During the experiments, the rotating speed of the shaft is adjusted by the control cabinet and the cameras work at 300 fps.
The experimental setup can be modelled as a rotor bearing systems, which is illustrated in Figure 5. The major excitation of the system is a radial unbalance at the disk. The rotor is connected to the stator through sliding bearings and the flexible coupling between the rotor and the motor is regarded as a radial linear spring. The length of the shaft is about 800 mm, and the diameter is approximately 10 mm. The thickness of disk 1 is 25 mm and the weight is 800 g, while the thickness of disk 2 is 19 mm and the weight is 500 g. The speed of this rotor varies from 200 to 8000 rpm (rotation per minute). A feature point is attached to the end face of the shaft. The vibration is three-dimensional and the dynamic model is as follows.
The governing equations of the 3D model of rotor bearing system can be expressed as Equation (4):
M u ¨ + ( C b + Ω C c o r ) u ˙ + ( K s + K b Ω 2 K d ) u = f e x t
where M and K s are the mass and elastic stiffness matrices, C b and K b are the periodical damping and stiffness matrices due to bearings, Ω C c o r denotes the Coriolis matrix, Ω 2 K d is the spin softening matrix due to the rotation of structure, u is the vector of nodal displacement in the rotating frame, and f e x t denotes the external force vector.
When reduced to the model in 2D plane, assuming the acting elastic ( k ξ ξ , k η η ), damping ( c ω γ ), inertial ( m ω 2 γ ), and unbalance ( f d ) forces [35], where k ξ ξ and k η η are two main flexural axis of the shaft the dynamic equilibrium in 2D plane is stated on each axis as:
f d cos ( θ d θ ) x cos θ y sin θ + m ω 2 γ = 0
f d sin ( θ d θ ) + x sin θ y cos θ + c ω γ = 0
where
f d = k ξ γ ( cos θ ) 2 + k η γ ( sin θ ) 2 m ω 2 γ cos ( θ d θ )
f d = k ξ γ sin θ cos θ + k η γ sin θ cos θ c ω γ sin ( θ d θ )
According to rotor dynamics, the displacement response vector of rotor in the case of unbalance is expressed as
[ x , θ y , y , θ x ] i = R e ( [ x ¯ , θ y ¯ , y ¯ , θ x ¯ ] i e i Ω t )
If
x i ¯ = x c i + i x s i
Then, the in-plane vibration is written as
x i = R e [ ( x c i + i x s i ) e i Ω t ] = x c i 2 + x s i 2 cos ( Ω t + Φ x i )
y i = y c i 2 + y s i 2 sin ( Ω t + Φ y i )
Φ x i = t g 1 ( x s i x c i ) ; Φ y i = t g 1 ( y c i y s i )
Therefore, the trajectory equation of a node is obtained as
( y c 2 + y s 2 ) x 2 + ( x c 2 + x s 2 ) y 2 2 ( x c y c + x s y s ) x y ( x s y c x c y s ) 2 = 1
Thus, the trajectory motion is a circle expressed by Equation (14).

4. Results and Discussion

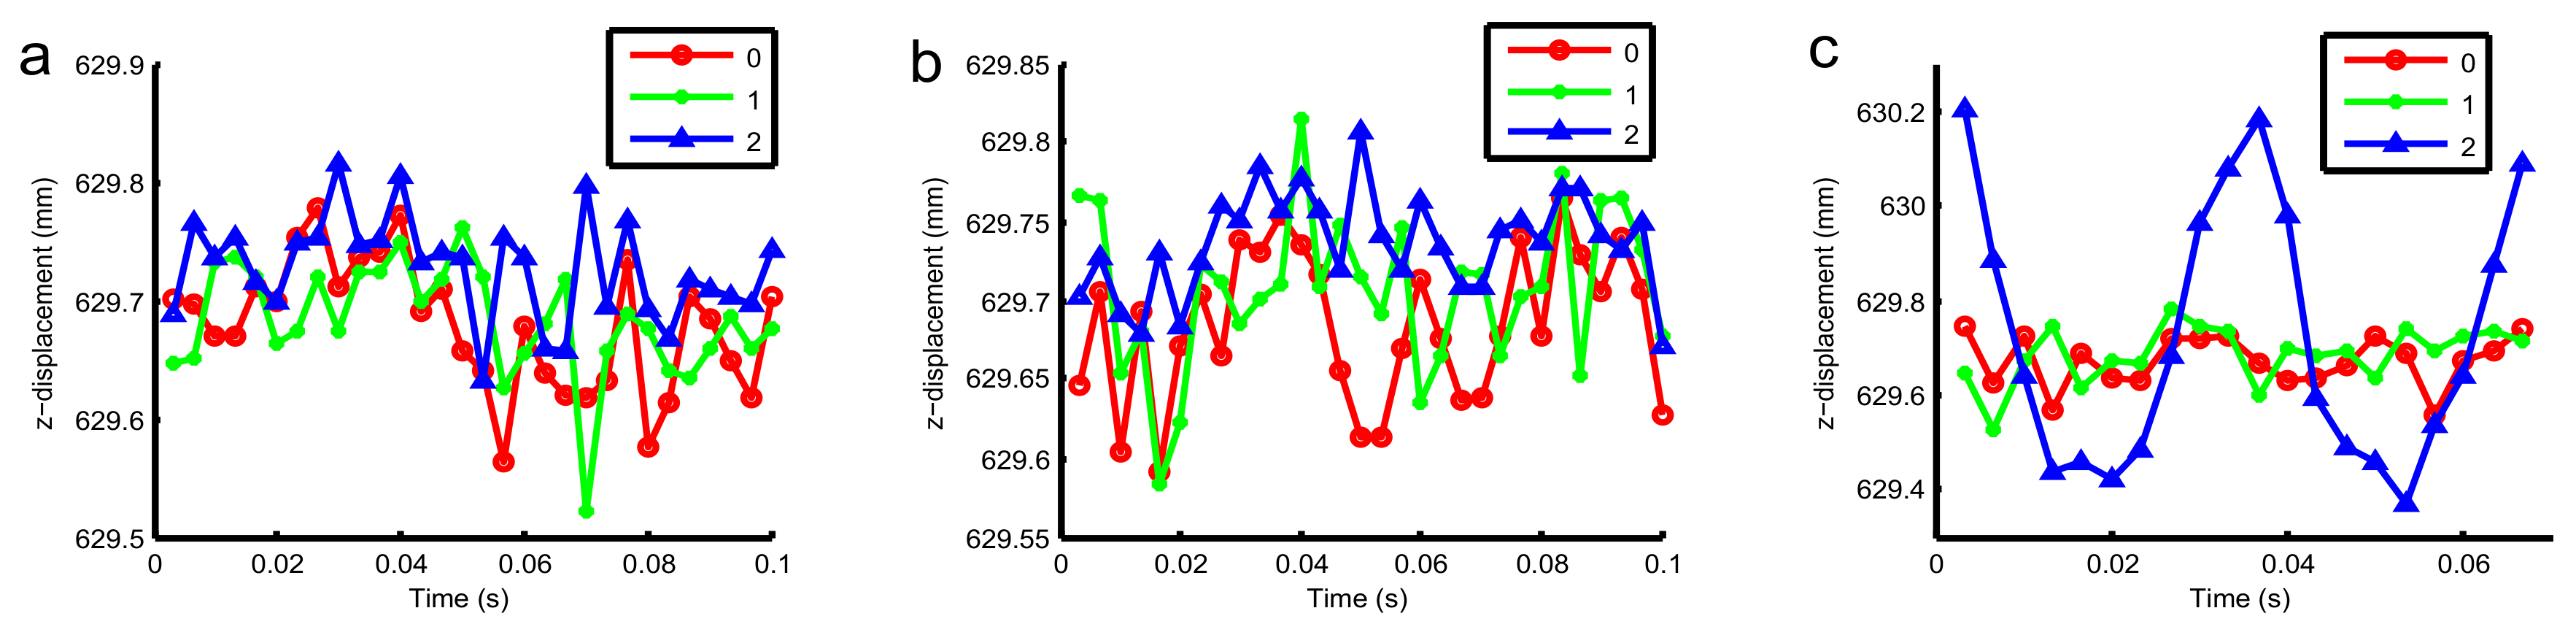
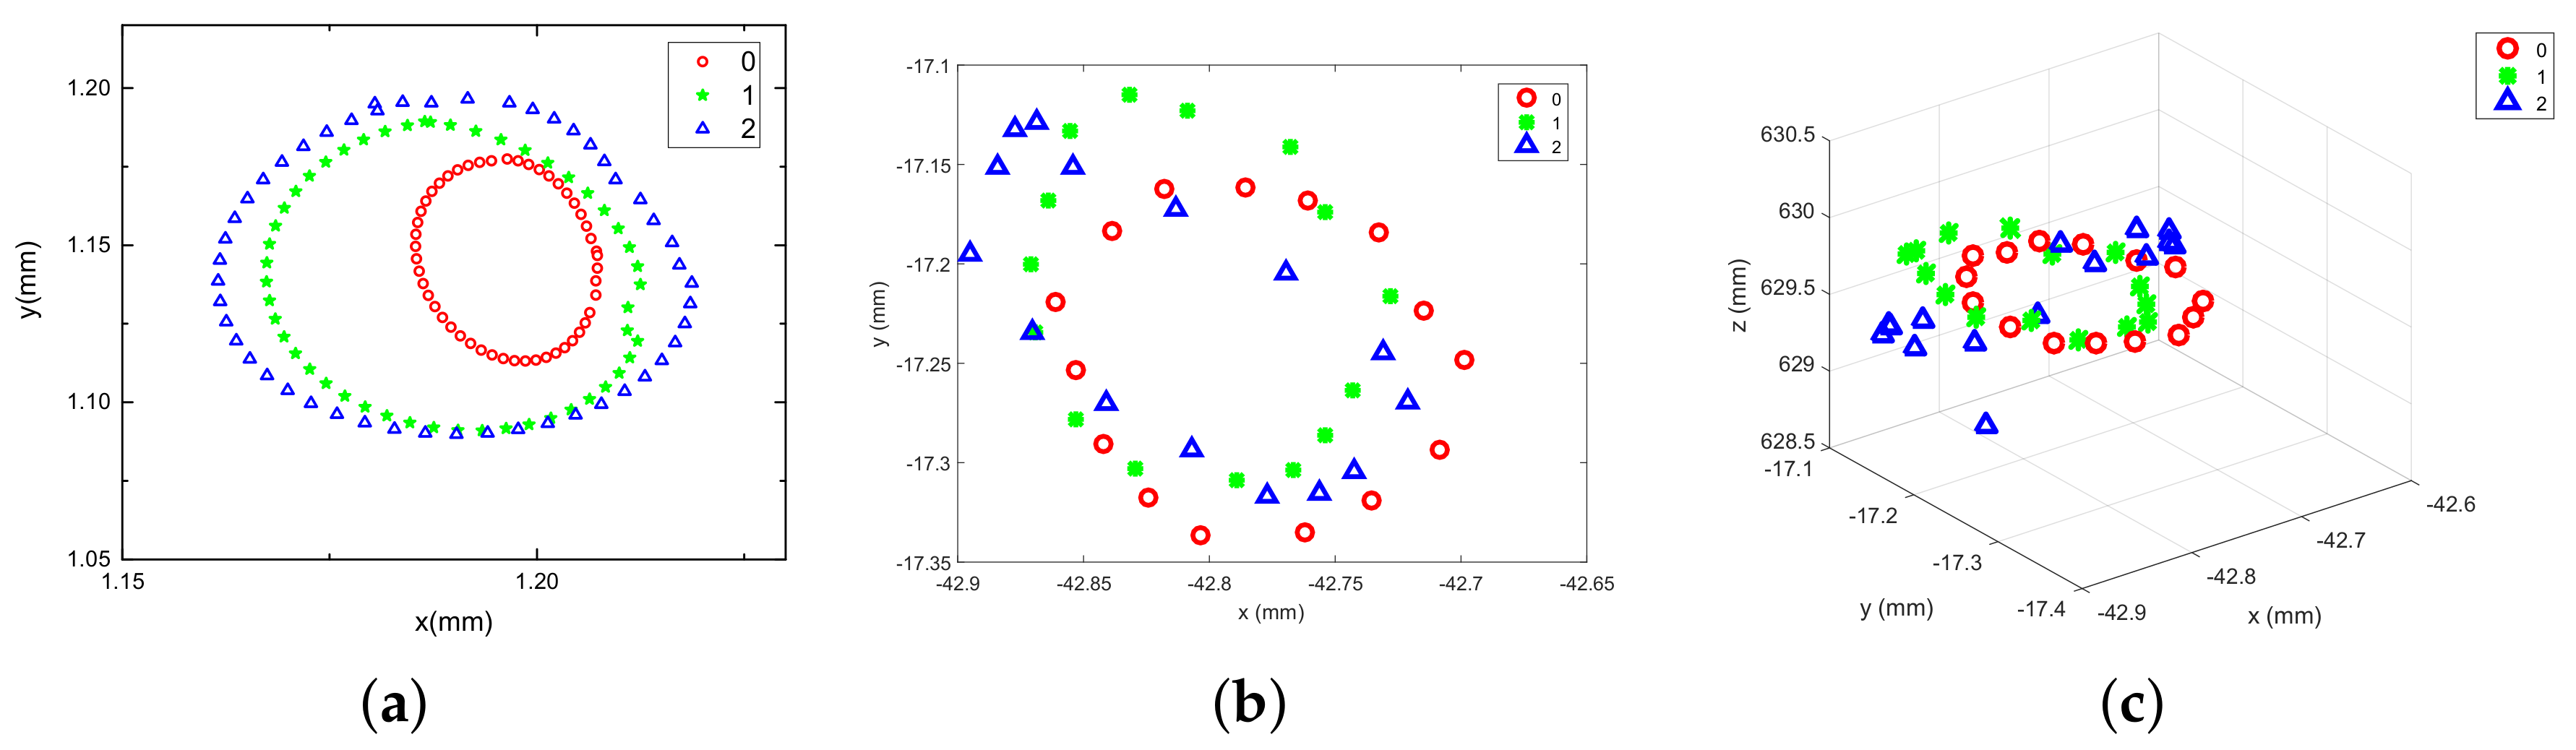
4.1. Non-Imbalance Experiment

The 3D displacement components of the feature point attached to the shaft are analyzed by triangulation based on feature detector SURF. The raw images captured by binocular stereo video system are shown in Figure 6. The rotation speeds are 600 rpm, 1200 rpm and 1500 rpm, respectively.
The motion trajectories of the feature point in world coordinate system are reconstructed in Figure 7. Since the rotor bearing systems are in a stable operating state and slightly vibrate in axial direction, the trajectory of the point is approximately a circle in the 3D space. These results are consistent with the 2D plane analysis, which again verify the feasibility of this measurement system. For the traditional technique, the orbits of the movement of the rotor center are obtained by two eddy current sensors which are mounted on two mutually perpendicular directions in the same transverse section. The method using sensors is problematic because the tracking object is not the same point with the axial movement of the shaft. The approach proposed in this paper comparably tracks the same point at different times. The videometric measurement system is more intuitive for monitoring the operational status of rotor machinery because 3D motion of rotary structure is observed at the same time.

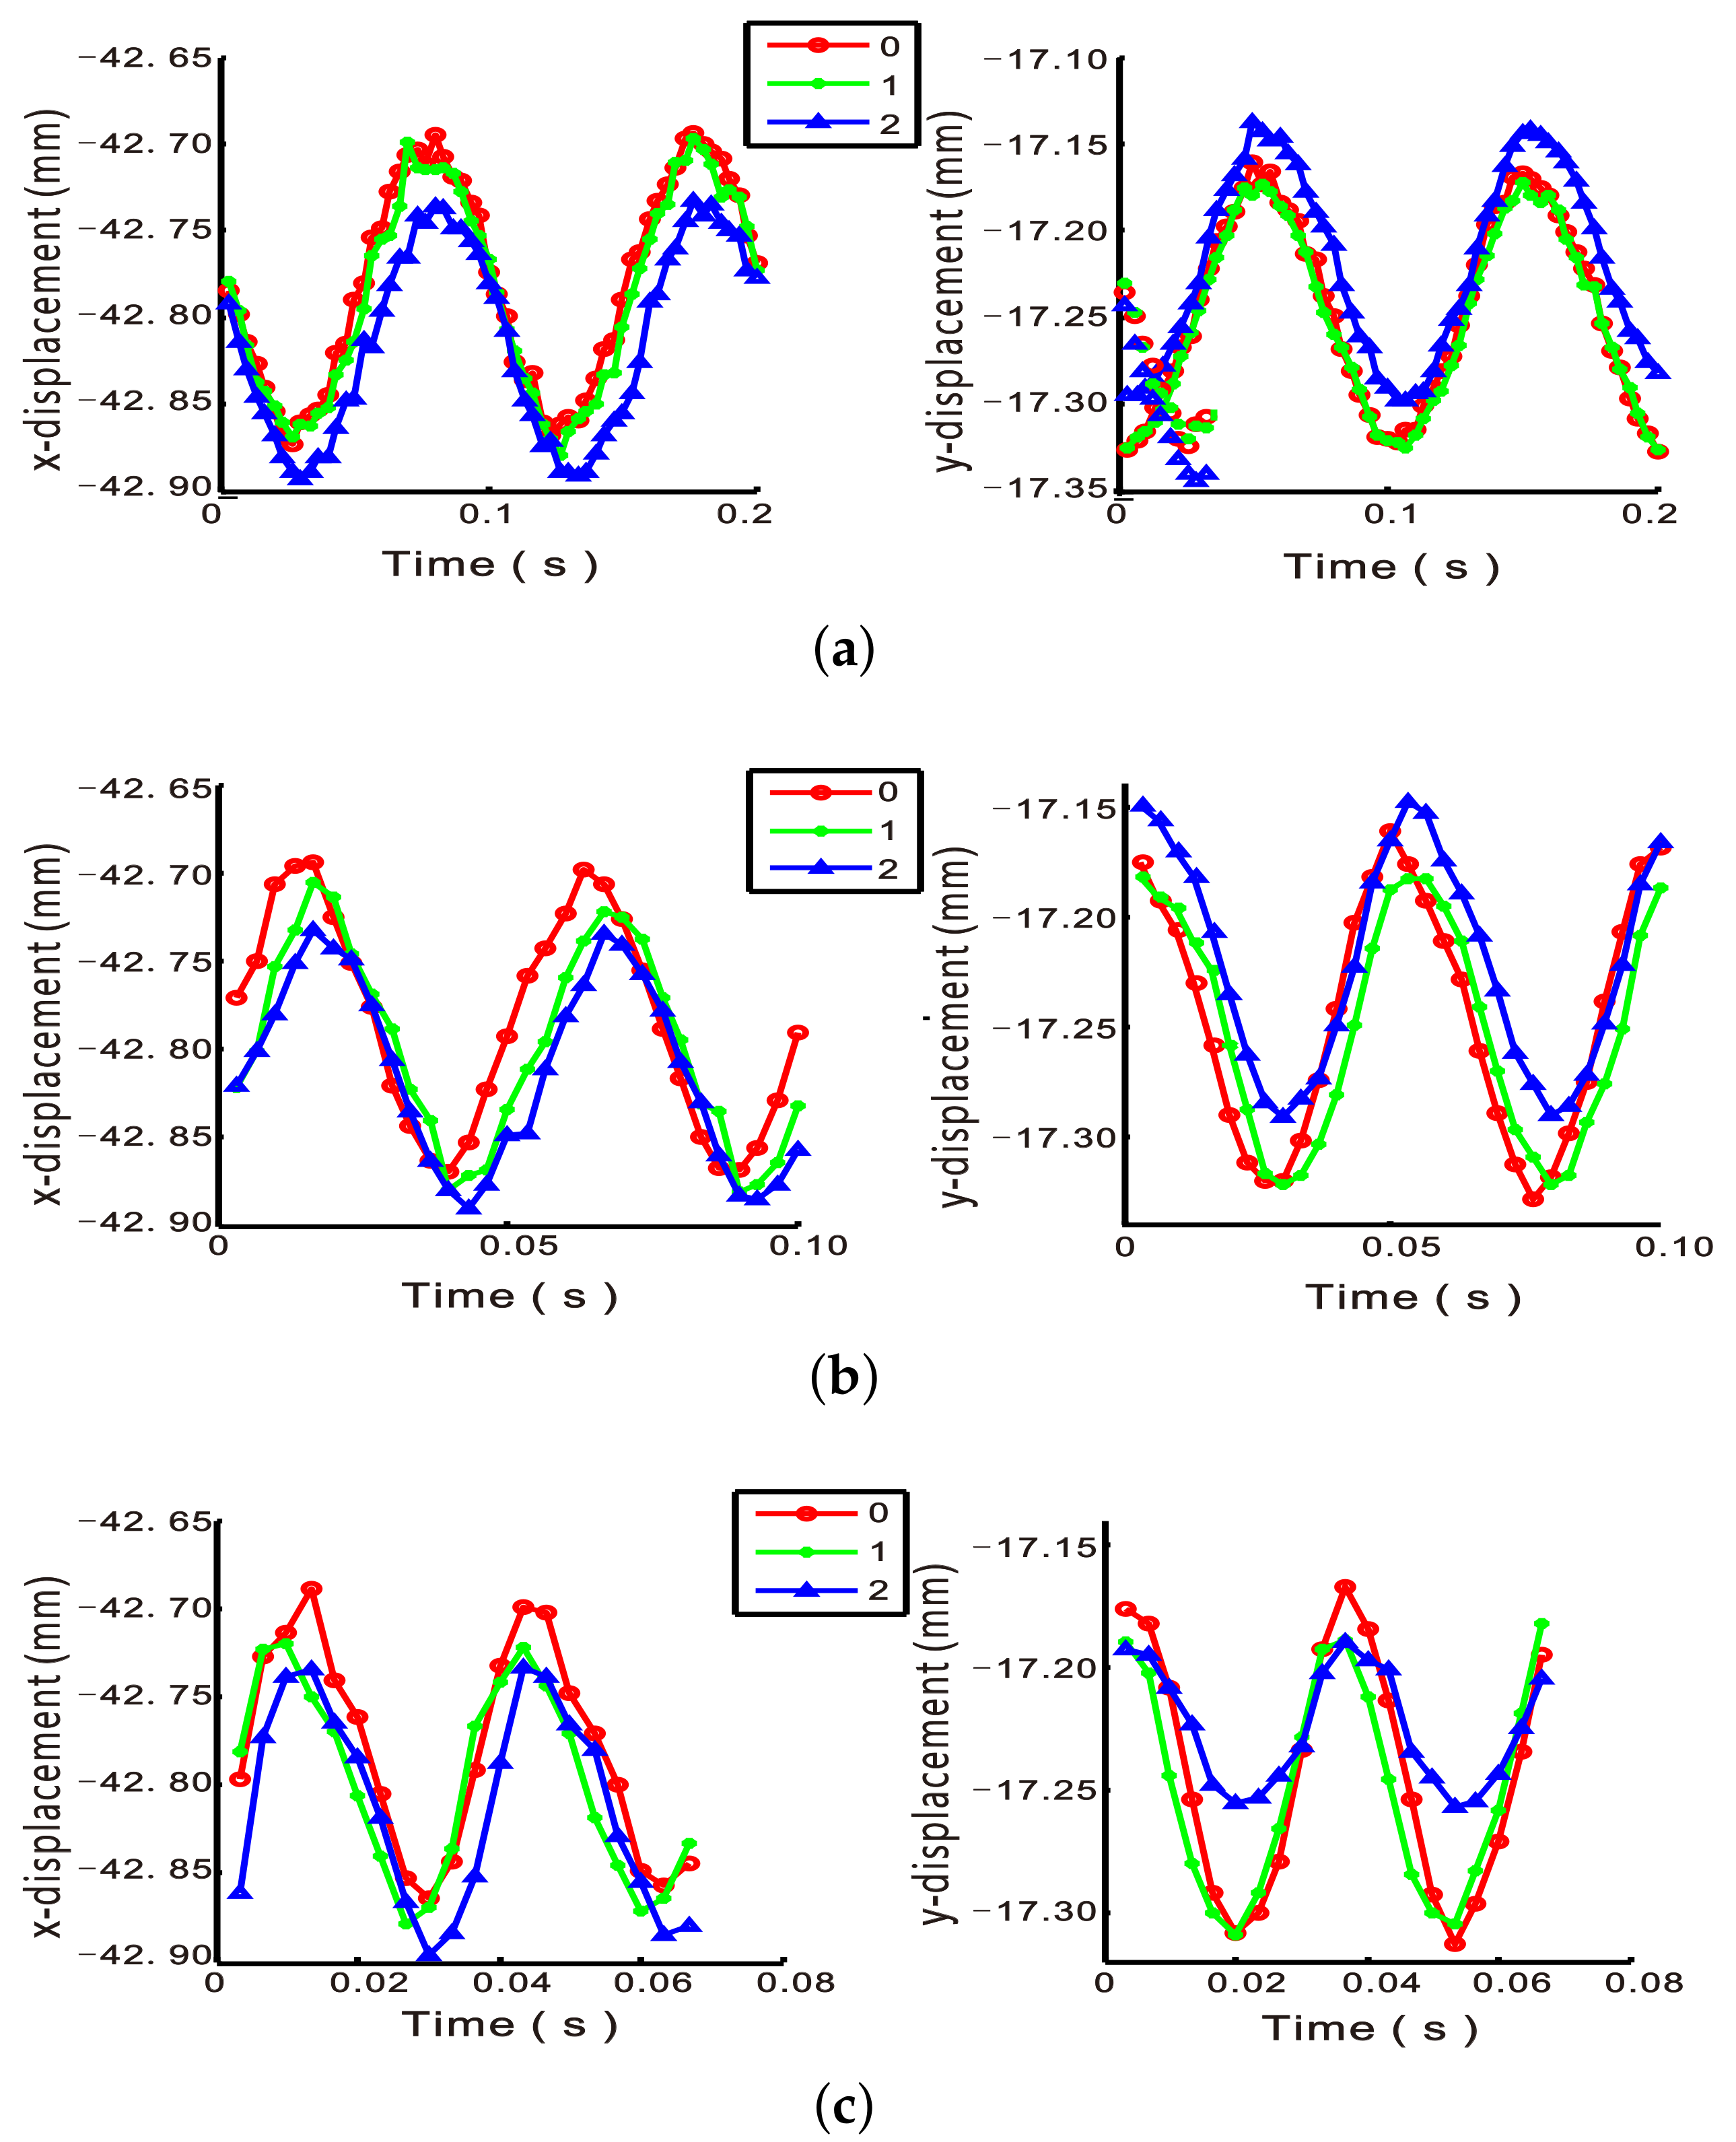
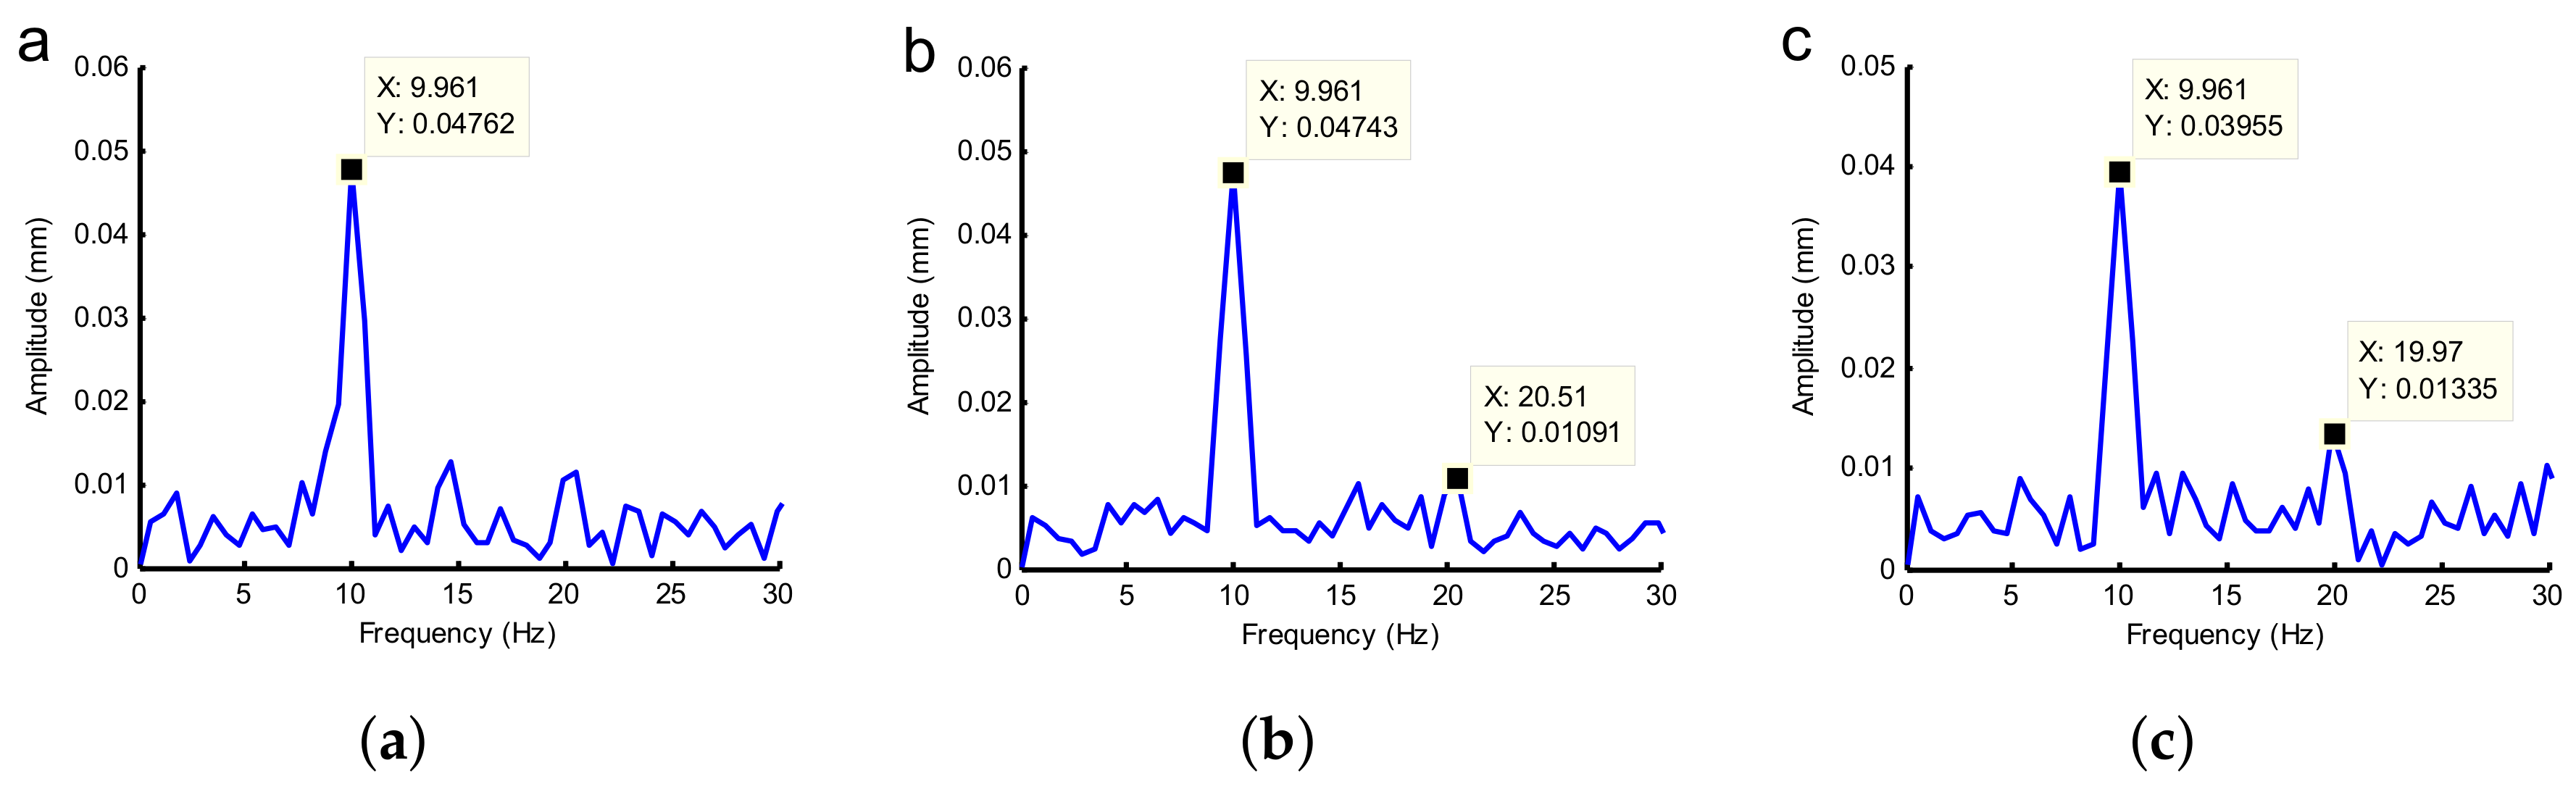
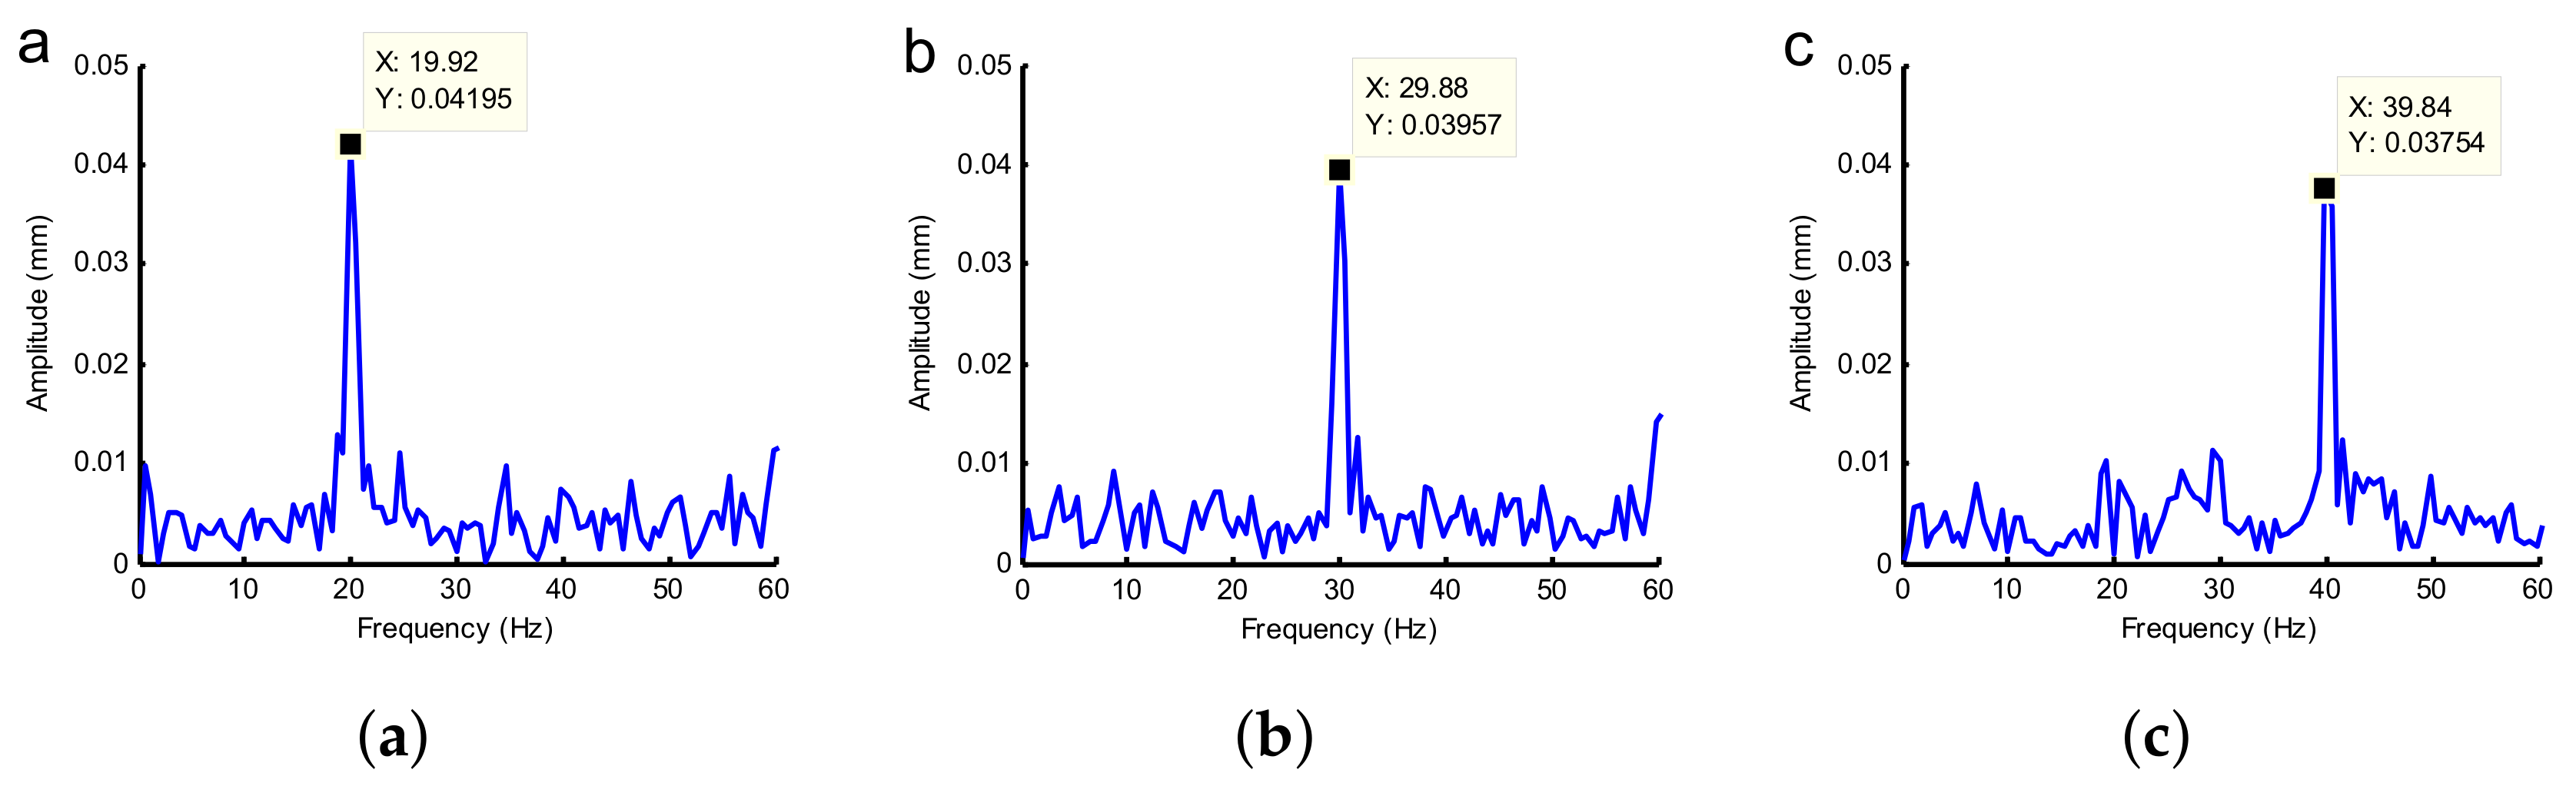
4.2. Different Unbalanced Mass Experiments

Different unbalanced mass is added to the rotor disk at a fixed angle for the detection experiments. Figure 8 indicates the in-plane displacement components with different additional weight varied with time and the corresponding rotation speeds are 600, 1200 and 1800 rpm, respectively.
During the experiments, the same feature point is accurately positioned repeatedly in dynamic sequential images due to stable performance of the algorithm. The dynamic responses of the unbalanced system are reflected by monitoring the changes of trajectories. The hollow points in Figure 8 correspond to the condition without additional weight, while the solid points are the results with 1 g additional weight and the triangle points are the results with 2 g unbalanced weight. Since the rotor shaft rotates at constant speeds, these plots are approximately sinusoidal curves which are consistent with the motion equations (Equations (11) and (12)). Moreover, the results illustrated that the coordinate values in x-direction tend to decrease with the increasing load, while the coordinate values in direction y have a tread to increase. In other words, the in-plane trajectories move to the upper left according to the definition of the word coordinate system. Meanwhile, the amplitude in horizontal direction appears larger with the increase of the unbalanced mass, similar to the right y-displacement of Figure 8c. The corresponding out-plane displacement components of the above experiments are compared in Figure 9. Unlike in-plane motions, the out-plane vibrations are no longer sinusoidal curves. However, from these curves, the vibration in the axial direction is periodic. The vibration amplitude increases significantly with the rising of the additional weight and speed. These vibrations in z-direction cannot be detected using traditional eddy current sensors. As shown in Figure 9, the out-of-plane motion is distinct from the other responses when the additional weight is 2 g and the rotating speed arrives 1800 rpm. This result agrees with the phenomena that the rotor can be treated as rigid at low rotating speed, and the flexibility such as the bending of the shaft cannot be ignored at high rotating speed. The measurement results also indicate that the proposed method has potential applications not only in the unbalanced mass identification, but also in the rotor bow and rotor misalignment estimation.
The comparison results for the measurements by laser displacement sensors, eddy current sensors and the proposed method are plotted in Figure 10, where the hollow points are the data of no additional weight, the asterisks represent the data at 1 g additional weight, and the triangle points correspond to 2 g additional weight. The trajectory of the feature point is approximately a circle when the disk is in ballast. Then, the trajectory gradually becomes an ellipse with the increase of the additional weights. By calculating Equations (11)–(13), the deflection angles and offsets caused by various loading mass in the plane are plotted in Figure 11. The arrow points to the phase of unbalance and the length of the lines indicate the weight of the unbalanced mass. These results are consistent with theoretical model in Equation (13) that the displacement response is an ellipse and the ellipticity increases with the adding unbalanced mass. The results by laser and eddy current methods are similar to the conventional unbalance estimation, which only detect 2D vibrations. Figure 10c and Figure 11c are the results of 3D trajectories by the proposed method. The changes in operating conditions of rotor shaft due to imbalance are contrasted more obviously. Figure 11a,b shows that there is almost no difference between deflection angles caused by different loading mass. The rotor bow is apparently not detectable by 2D measurements, which can be clearly identified in Figure 10c and Figure 11c.
To explain Figure 11 in more details, the eccentricity and balance accuracy of both 2D and 3D methods are calculated in Table 2. As the unbalanced mass increases, the eccentricity and balance accuracy increase. In comparison with 2D current eddy method and laser displacement method, the eccentricity of videometric method is closer to the ground truth, the same as the balance accuracy. Normally, according to ISO1940, the balance levels of small-motor rotor systems are G0.4, G1, and G2.5. The balance level of the rotor system is about G1.3, between G1 and G2.5, which is in an acceptable range. The comparison in Table 2 indicates that the average relative error of the videometric method is 2.2%, much lower than 30.6% of current eddy method and 41.3% of laser displacement method. The error of the measurement by laser displacement method is the largest of the three methods, which is because the laser measurement is very sensitive to the measurement environment. When the rotor systems are in operation, the measurement environment is not suitable for the laser displacement sensors.
Frequency analysis is essential in vibration analysis, and has the potential to deal with critical speed problems of rotor systems. Thus, to investigate the 3D dynamic performances of the established system, the out-plane displacement components are subject to Fourier transform. The frequency spectrum of out-plane displacement under 600 rpm rotating speed with different additional weights is in Figure 12. The dominant frequency components are marked and the results show that the amplitude of the marked peak decreases with the adding unbalanced mass. There is an increasing additional high-frequency harmonic component at the same time. Figure 12 and Figure 13 indicate that the amplitude of out-plane displacement components becomes smaller with the increasing speed. This illustrates that the rotor bearing systems are in a relatively stable running status before reaching natural frequency. Figure 14 gives the frequency spectrum in three directions with the rotating speed at 3000 rpm, which demonstrates that the proposed method is able to identify high frequency vibration. Only one major peak appears in the spectrum for the in-plane vibrations, which is due to the constant rotating motion of the shaft. The frequency components of out-plane displacement are more complex and the main frequency is the same as the in-plane vibrations. Monitoring the work condition of rotary structure is critical because rotating parts are the most vulnerable components subjected to the harsh working environment such as fluctuating loading, high pressure and high temperature. Therefore, the method proposed in this paper can be applied effectively in fault diagnosis. Notably, using sensors, such as eddy current sensors, can monitor the vibration of the rotating machinery in real time. The procedures of data collecting and data processing are nearly completed simultaneously. The proposed method can measure the vibration when the rotating machinery is in operation, but the data processing is off-line in the computer. The treatment time depends on the calculation ability of the computers, which is developing very fast these years.

5. Conclusions

In this work, a non-contact videometric measurement method is developed for identifying unbalanced mass of rotor bearing systems in operation. The trajectories of the feature point in 3D space are reconstructed when the rotor system is operating at 2400 rpm and it’s R-square value is about 0.9981, which indicates that the reconstruction accuracy is high enough. The direction and the weight of the unbalanced mass can be detected more easily by analyzing 3D trajectories compared with the traditional ellipse analysis in 2D plane. In comparison with sensors methods, the relative error of the proposed method decreases from 30.6% and 41.3% to 2.2%. Moreover, by processing the out-plane displacement components with Fourier transform, the videometric measurement method studies out-plane vibration performance for the rotating speed at 3000 rpm. It has been found that there is an increasing additional high-frequency harmonic component with the increase of the unbalanced mass. Overall, this paper proposed a non-contact method, which provides a solution for three-dimensional vibration detection for rotor machinery in operation and has the potential to be used for fault diagnosis for rotor machinery.

Acknowledgments

The authors appreciate the support of the National Natural Science Foundation of China (Nos. 51575156, 51675156, 51775164 and 51705122), and the Fundamental Research Funds for the Central Universities (No. JZ2017HGPA0165, PA2017GDQT0024).

Author Contributions

Huaxia Deng, Yifan Diao, Jin Zhang and Peng Zhang conceived the idea and conducted the experiments. All the authors including Huaxia Deng, Yifan Diao, Jin Zhang, Peng Zhang, Mengchao Ma, Xiang Zhong and Liandong Yu contributed to the discussion of the paper and approved the manuscript. Huaxia Deng directed the scientific research of this work.

Conflicts of Interest

The authors declare no conflict of interest.

References

  1. Wenhu, H.; Xinhua, W.; Yinghou, J. Review of Nonlinear Rotor Dynamics. J. Vib. Eng. 2000, 13, 5–17. [Google Scholar]
  2. Kim, K.; Lee, J.M.; Hwang, Y. Determination of engineering strain distribution in a rotor blade with fibre Bragg grating array and a rotary optic coupler. Opt. Lasers Eng. 2008, 46, 758–762. [Google Scholar] [CrossRef]
  3. Sharafi, M.M.; Nikravesh, M.Y.; Safarpour, P. Analytical approach to calculate bending, longitudinal and torsional local stiffness of an asymmetric circumferential crack with contact condition. Mech. Syst. Signal Process. 2017, 94, 448–463. [Google Scholar] [CrossRef]
  4. Gao, Z.; Cecati, C.; Ding, S.X. A Survey of Fault Diagnosis and Fault-Tolerant Techniques-Part I: Fault Diagnosis With Model-Based and Signal-Based Approaches. IEEE Trans. Ind. Electron. 2015, 62, 3757–3767. [Google Scholar] [CrossRef]
  5. Darlow, M.S. Balancing of high-speed machinery: Theory, methods and experimental results. Mech. Syst. Signal Process. 1987, 1, 105–134. [Google Scholar] [CrossRef]
  6. Moon, J.; Kim, B.; Lee, S. Development of the active balancing device for high-speed spindle system using influence coefficients. Int. J. Mach. Tools Manuf. 2006, 46, 978–987. [Google Scholar] [CrossRef]
  7. Smail, M.; Thomas, M.; Lakis, A. ARMA models for modal analysis: effect of model orders and sampling frequency. Mech. Syst. Signal Process. 1999, 13, 925–941. [Google Scholar] [CrossRef]
  8. Kirk, R.G.; Guo, Z. Expert System Source Identification of Excessive Vibration. Int. J. Rotating Mach. 2003, 9, 63–79. [Google Scholar] [CrossRef]
  9. Widodo, A.; Yang, B.S. Support vector machine in machine condition monitoring and fault diagnosis. Mech. Syst. Signal Process. 2007, 21, 2560–2574. [Google Scholar] [CrossRef]
  10. Lees, A.; Sinha, J.; Friswell, M. Model-based identification of rotating machines. Mech. Syst. Signal Process. 2009, 23, 1884–1893. [Google Scholar] [CrossRef]
  11. Wang, S.; Wang, Y.; Zi, Y.; He, Z. A 3D finite element-based model order reduction method for parametric resonance and whirling analysis of anisotropic rotor-bearing systems. J. Sound Vib. 2015, 359, 116–135. [Google Scholar] [CrossRef]
  12. Kammer, D.C. Sensor set expansion for modal vibration testing. Mech. Syst. Signal Process. 2005, 19, 700–713. [Google Scholar] [CrossRef]
  13. Rothberg, S.; Bell, J. On the application of laser vibrometry to translational and rotational vibration measurements on rotating shafts. Measurement 2004, 35, 201–210. [Google Scholar] [CrossRef] [Green Version]
  14. Borza, D.N. High-resolution time-average electronic holography for vibration measurement. Opt. Lasers Eng. 2004, 41, 515–527. [Google Scholar] [CrossRef]
  15. Xiang, L.; Yang, S.; Gan, C. Torsional vibration measurements on rotating shaft system using laser doppler vibrometer. Opt. Lasers Eng. 2012, 50, 1596–1601. [Google Scholar] [CrossRef]
  16. Orlowska-Kowalska, T.; Dybkowski, M. Stator-Current-Based MRAS Estimator for a Wide Range Speed-Sensorless Induction-Motor Drive. IEEE Trans. Ind. Electron. 2010, 57, 1296–1308. [Google Scholar] [CrossRef]
  17. Trebuňa, F.; Hagara, M. Experimental modal analysis performed by high-speed digital image correlation system. Measurement 2014, 50, 78–85. [Google Scholar] [CrossRef]
  18. Xie, H.; Kang, Y. Digital image correlation technique. Opt. Lasers Eng. 2015, 65, 1–2. [Google Scholar] [CrossRef]
  19. Orteu, J.J. 3-D computer vision in experimental mechanics. Opt. Lasers Eng. 2009, 47, 282–291. [Google Scholar] [CrossRef]
  20. Felipe-Sesé, L.; Siegmann, P.; Díaz, F.A.; Patterson, E.A. Simultaneous in-and-out-of-plane displacement measurements using fringe projection and digital image correlation. Opt. Lasers Eng. 2014, 52, 66–74. [Google Scholar] [CrossRef]
  21. Shi, H.; Ji, H.; Yang, G.; He, X. Shape and deformation measurement system by combining fringe projection and digital image correlation. Opt. Lasers Eng. 2013, 51, 47–53. [Google Scholar] [CrossRef]
  22. Wang, Z.; Kieu, H.; Nguyen, H.; Le, M. Digital image correlation in experimental mechanics and image registration in computer vision: Similarities, differences and complements. Opt. Lasers Eng. 2015, 65, 18–27. [Google Scholar] [CrossRef]
  23. Jiang, L.; Xie, H.; Pan, B. Speeding up digital image correlation computation using the integral image technique. Opt. Lasers Eng. 2015, 65, 117–122. [Google Scholar] [CrossRef]
  24. Kieu, H.; Pan, T.; Wang, Z.; Le, M.; Nguyen, H.; Vo, M. Accurate 3D shape measurement of multiple separate objects with stereo vision. Meas. Sci. Technol. 2014, 25, 035401. [Google Scholar] [CrossRef]
  25. He, T.; Chen, J.Y.; Hu, X.; Wang, X. A Study of 3d Coordinate Measuring Based on Binocular Stereo Vision. Appl. Mech. Mater. 2015, 740, 531–534. [Google Scholar] [CrossRef]
  26. Wang, Y.; Zhang, J.; Deng, H.; Fan, R. Three-dimensional Reconstruction Coordinate Error Induced by Asynchronous Cameras for Moving Objects. In Proceedings of the Sixth International Symposium on Precision Mechanical Measurements, Guiyang, China, 10 October 2013; Ye, S., Fei, Y., Eds.; Volume 8916, pp. 89160J–89160J-9. [Google Scholar]
  27. Zhang, J.; Zhang, P.; Deng, H.; Wang, J. High-accuracy three-dimensional reconstruction of vibration based on stereo vision. Opt. Eng. 2016, 55, 091410. [Google Scholar] [CrossRef]
  28. Baqersad, J.; Niezrecki, C.; Avitabile, P. Full-field dynamic strain prediction on a wind turbine using displacements of optical targets measured by stereophotogrammetry. Mech. Syst. Signal Process. 2015, 62–63, 284–295. [Google Scholar] [CrossRef]
  29. Yang, J.; Peng, C.; Xiao, J.; Zeng, J.; Yuan, Y. Application of videometric technique to deformation measurement for large-scale composite wind turbine blade. Appl. Energy 2012, 98, 292–300. [Google Scholar] [CrossRef]
  30. Zhang, Z. A flexible new technique for camera calibration. IEEE Trans. Pattern Anal. Mach. Intell. 2000, 22, 1330–1334. [Google Scholar] [CrossRef]
  31. Bay, H.; Ess, A.; Tuytelaars, T.; Gool, L.V. Speed up robust features (SURF). Comput. Vis. Image Underst. 2008, 110, 346–359. [Google Scholar] [CrossRef]
  32. Mikolajczyk, K.; Schmid, C. A performance evaluation of local descriptor. IEEE Trans. Pattern Anal. Mach. Intell. 2005, 27, 1615–1630. [Google Scholar] [CrossRef] [PubMed]
  33. Lee, J.R.; Kim, H.C. Feasibility of in situ blade deflection monitoring of a wind turbine using a laser displacement sensor within the tower. Smart Mater. Struct. 2012, 22, 027002. [Google Scholar] [CrossRef]
  34. Ciang, C.C.; Lee, J.R.; Bang, H.J. Structural health monitoring for a wind turbine system: a review of damage detection methods. Meas. Sci. Technol. 2008, 19, 122001. [Google Scholar] [CrossRef]
  35. Colin Ocampo, J.; Wing, E.S.G.; Ramirez Moroyoqui, F.J.; Abundez Pliego, A.; Blanco Ortega, A.; Mayen, J. A novel methodology for the angular position identification of the unbalance force on asymmetric rotors by response polar plot analysis. Mech. Syst. Signal Process. 2017, 95, 172–186. [Google Scholar] [CrossRef]
Figure 1. The procedure to identify 3D unbalance mass.
Applsci 08 00173 g001
Figure 2. Calibration setup based on vibration table.
Applsci 08 00173 g002
Figure 3. (a) 3D Reconstruction results; and (b) the projection in plane.
Applsci 08 00173 g003
Figure 4. Experiments setup: (a) laser displacement sensors; (b) photograph; (c) and schematic.
Applsci 08 00173 g004
Figure 5. The model of rotor bearing system.
Applsci 08 00173 g005
Figure 6. The raw images captured by binocular stereo video system: (a) left camera; and (b) right camera.
Applsci 08 00173 g006
Figure 7. The 3D motion trajectories of feature point at different rotation speed: (a) 600 rpm; (b) 1200 rpm; and (c) 1500 rpm.
Applsci 08 00173 g007
Figure 8. The in-plane motion with different additional weight (left: x direction; and right: y direction): (a) 600 rpm; (b) 1200 rpm; and (c) 1800 rpm.
Applsci 08 00173 g008
Figure 9. The out-plane motion at different rotation speed with different additional weight at different speed: (a) 600 rpm; (b) 1200 rpm; and (c) 1800 rpm.
Applsci 08 00173 g009
Figure 10. The trajectories of three methods with different additional weight at 2400 rpm rotating speed: (a) laser displacement method; (b) eddy current method; and (c) the proposed method.
Applsci 08 00173 g010
Figure 11. The comparison of three methods with unbalance schematic diagrams: (a) laser displacement method; (b) eddy current method; and (c) the proposed method.
Applsci 08 00173 g011
Figure 12. The frequency spectrum of out-plane displacement at rotation speed of 600 rpm: (a) without additional weight; (b) with 1g weight; and (c) with 2 g weight.
Applsci 08 00173 g012
Figure 13. The frequency spectrum of out-plane displacement at different rotation speed: (a) 1200 rpm; (b) 1800 rpm; and (c) 2400 rpm.
Applsci 08 00173 g013
Figure 14. The frequency spectrum at rotation speed of 3000 rpm: (a) x direction; (b) y direction; and (c) z direction.
Applsci 08 00173 g014
Table 1. Fitting evaluation parameters of reconstruction results.
Amplitude (mm)Frequency (Hz)SSER-SquareRMSE
Ground truth3.876---
Detection value3.9160.55100.99810.1029
The sum of squares due to error (SSE) and root mean squared error (RMSE) are all in an acceptable range; the R-square value is approximately equal to 1, indicating the fitting accuracy of reconstruction is very high.
Table 2. Accuracy comparison of three methods.
MethodsEccentricity (mm)Balance Accuracy (mm·s 1 )Relative Error
0 g1 g2 g0 g1 g2 g
Ground truth00.0490.098-1.9503.900-
Current eddy0.0390.0420.0521.5571.6742.06530.6%
Laser0.0110.0340.0470.4391.3671.86641.3%
Videometric0.0330.0510.0971.3272.0243.8722.2%

