IMU-Assisted 2D SLAM Method for Low-Texture and Dynamic Environments

1
School of Electronic Information and Engineering, Beijing Jiaotong University, Beijing 100044, China
2
Beijing Engineering Research Center of EMC and GNSS Technology for Rail Transportation, Beijing 100044, China
*
Author to whom correspondence should be addressed.
Appl. Sci. 2018, 8(12), 2534; https://doi.org/10.3390/app8122534
Submission received: 14 October 2018
/
Revised: 2 December 2018
/
Accepted: 4 December 2018
/
Published: 7 December 2018
(This article belongs to the Special Issue Advanced Mobile Robotics)
Abstract
:Featured Application
The work in this paper is about the core techniques of mobile robots, especially for the localization and navigation in indoor or structured environments, such as the home service robot, AGV in a factory, et al.
Abstract
Generally, the key issues of 2D LiDAR-based simultaneous localization and mapping (SLAM) for indoor application include data association (DA) and closed-loop detection. Particularly, a low-texture environment, which refers to no obvious changes between two consecutive scanning outputs, with moving objects existing in the environment will bring great challenges on DA and the closed-loop detection, and the accuracy and consistency of SLAM may be badly affected. There is not much literature that addresses this issue. In this paper, a mapping strategy is firstly exploited to improve the performance of the 2D SLAM in dynamic environments. Secondly, a fusion method which combines the IMU sensor with a 2D LiDAR, based on framework of extended Kalman Filter (EKF), is proposed to enhance the performance under low-texture environments. In the front-end of the proposed SLAM method, initial motion estimation is obtained from the output of EKF, and it can be taken as the initial pose for the scan matching problem. Then the scan matching problem can be optimized by the Levenberg–Marquardt (LM) algorithm. For the back-end optimization, a sparse pose adjustment (SPA) method is employed. To improve the accuracy, the grid map is updated with the bicubic interpolation method for derivative computing. With the improvements both in the DA process and the back-end optimization stage, the accuracy and consistency of SLAM results in low-texture environments is enhanced. Qualitative and quantitative experiments with open-loop and closed-loop cases have been conducted and the results are analyzed, confirming that the proposed method is effective in low-texture and dynamic indoor environments.
1. Introduction
Simultaneous localization and mapping (SLAM) provides the mobile robot the ability to set up a model of the working space and to localize itself, and it is the most important ability for a truly autonomous robot able to operate within real-world environments. There are several main kinds of sensors widely used for SLAM research or applications, such as cameras [1], RGBD sensors [2], LiDAR [3], and even the fusion of different kinds of sensors [4]. Each kind of sensor has its own advantages and limitations. The camera-based methods are easy to be affected by illumination or seasons changing. Comparatively, LiDAR has the advantages of high precision, good real-time performance, and strong anti-interference ability, so the LiDAR-based SLAM has been widely used in many practical applications, such as autonomous vehicles, home service robots, and automatic guided vehicles in civilian areas.
Generally, LiDAR-based SLAM can be separated into two stages according to the information processing: the front-end stage and the back-end stage.
In the front-end stage, currently observed scanning data is matched with the previously scanned one, which is the very fundamental step in SLAM—data association (DA). There are usually two strategies for data association: scan-to-scan matching-based [5,6] and scan-to-map matching-based [7]. Scan-to-scan matching-based DA is commonly used to compute the relative motion between two consecutive scanning results. The matching process is to adjust the pose of the current scan to make sure an overlap exists as much as possible between current scan and reference scan. For example, the HG-SLAM method in reference [8] adopts a scan-to-scan matching strategy and Iterative Closest Point (ICP) [9] is used to compute the rigid transformation between adjacent scanning frames. The advantage of scan-to-scan matching strategy is that it has a lower computational cost because only two frames are considered. However, due to the noise data and many other factors, the result is prone to quickly accumulating errors. On the other hand, scan-to-map matching-based DA is to align the current scan with the existing map. For example, Hector SLAM [7] takes a scan-to-map matching strategy to solve the data association problem, where the current frame is aligned with the entire map to achieve the rigid transformation from the current scanning set to the built map, which uses the Gauss–Newton method to solve the nonlinear optimization problems. Usually, to further improve the stability, the features extracted from scanned points can be used for matching [6]. The cumulative error is limited in this case and a higher precision mapping result can be achieved for small-scale environments. Because the current scan will be matched with the whole or part of the existing map, it has a higher computational cost compared with scan-to-scan matching.
Based on the initial pose estimation results obtained in the front-end stage, some optimization methods are applied to improve the accuracy and robustness of SLAM results in the back-end stage. Particle filter-based [10] or graph-based optimization are two popular methods used for nonlinear optimization in SLAM. The graph-based method [11,12] uses a collection of nodes to represent the poses and features; the edges in the graph are the results generated by DA from observations, also regarded as the constraints and different optimization methods can be applied to minimize the error expressed by the constraints. Loop closure detection (LCD) when a robot revisits a place plays a very important role in SLAM [13,14]. It will be used as a constraint for global optimization and can reduce the accumulated error. LCD is heavily dependent on the DA results. In HG-SLAM [8], a hierarchical loop closure method based on a local map [15,16,17] is proposed. The optimization in the back-end stage can usually enhance the results, but it needs a good initial value to start over, or it will fall into the local minimum or even be unable to converge.
Though the initial estimated pose can be optimized in the second stage (back-end stage), the accumulated errors of DA may give rise to big problems for the results of SLAM, and the accuracy and the stability will be badly affected, sometimes even failing to obtain the results. This is often the case in low-texture environments for a 2D scanner, for example, the mobile robot moves along the long corridor in an indoor environment, and due to the measuring limitation of the scanner, there may be no obvious changes between two consecutive scanning outputs, making the DA process difficult. Additionally, when there are moving objects in a dynamic environment, the scanned points located on the dynamic target are taken as noise data and badly impact the DA process. Both cases bring great challenges for the DA task. If a large error is generated in the early stage of the DA process, the following steps, including the LCD and the back-end optimization, will be affected. The closed-loop detection is actually a scan-to-map matching process, and can help to limit the error accumulation generated in the DA process. However, it needs a good initial pose estimate. Unfortunately, a good initial pose is hard to obtain in a low-texture or dynamic environment. From this point of view, the DA and LCD are still an open challenging problem.
To solve the aforementioned problems, some approaches based on sensor fusion are put forward for data association. With the particle filter (PF) framework [18,19], the GMapping approach [10] introduces the adaptive resampling technique, calculating the particle distribution not only relying on the current observation of the LiDAR, but also the odometry information; the uncertainty of the robot pose is reduced and the particle dissipation problem is minimized. But no LCD is included in their method. The IMU sensor in the Hector SLAM method [7] can provide an initial pose estimation to solve the least squares problems. By making use of the extended Kalman filter (EKF) framework, Hector SLAM uses the rigid transformation from the current point cloud to the existing map as input to update the pose. Marco Baglietto [20] integrated a 6DOF IMU with a 2D LiDAR to explore the rescue scene and to find a safe route. Jian [21] uses IMU data to project the single-line LiDAR data to the horizontal plane to achieve the purpose of drawing the tree distribution map in the forest. However, in this method, IMU is only used to assist in mapping, and is not involved in positioning, so is not suitable for low-texture environments. Hesch [22] and others connect a single-line LiDAR with an inertial measurement unit. The system can provide real-time, complex 3D indoor environment tracking. However, the implementation of the method is based on the assumption that all vertical walls are orthogonal to each other.
All the above methods are based on the assumption of a static environment, however, this comes into conflict with the real applications because there are always other moving objects around, such as people moving around, or even other moving robots. Dynamic environments will inevitably affect the reliability of data association, which results in inaccurate maps. Currently, there are two ways to deal with the dynamic environment. One way is integrating the moving object detecting and tracking with the traditional SLAM method, finally building a dynamic map and static map to provide comprehensive information of the whole environment. Another way is to detect and eliminate the observed information caused by dynamic objects. Holz [23] decomposes the task into the SLAM problem in the static environment and the navigation problem of the dynamic environment in the known map. Li [24] proposes a mapping strategy for occupancy grid map in the dynamic environment. Montemerlo [25] and others identify the moving human body in the process of positioning, thus improving the robustness of pose estimation. Hahnel [26] uses a probabilistic model to describe the movement of human bodies, and the observation data caused by the human body are ignored during the map building. Avots [27] and others estimate the state of the door in the environment through a particle filter. Duckett [28] uses a special map representation to merge changes in the map. Wang [29] proposes a method to track and predict dynamic obstacles.
Motivated by the existing fusion methods, in this paper, a fusion-based method which combines an IMU sensor with 2D LiDAR for low-texture and dynamic environments is proposed. Compared with existing literature, the main contributions of this work include:
- (1)
- Based on EKF framework, the information from the IMU sensor is integrated with the 2D LiDAR sensor, and an initial motion estimation can be obtained by the fusion, which can be taken as the initial pose for the scan matching problem. This greatly improves the accuracy and stability of the DA results under the low-texture and dynamic environment.
- (2)
- By generating static local maps, a map-updating strategy is exploited to improve the accuracy of DA and closed-loop detection in the dynamic environment.
- (3)
- With scan-to-map matching methods and periodic back-end optimization with the sparse pose adjustment (SPA) method, the accuracy and stability of the SLAM are improved obviously for the low-texture environment. Furthermore, quantitative experiments are conducted to evaluate the proposed method.
2. The Proposed Method
The data flow diagram of the proposed method is illustrated in Figure 1; the rectangle box in the graph represents the data, and the oval box represents the operation. The data flow is as follows:
- (1)
- Based on previously estimated pose at time T-1, which is obtained by the fusion of 6DOF IMU data and LiDAR, and the current output of IMU sensor, the initial pose of LiDAR at time T is estimated based on EKF estimation. The output of EKF is then forwarded to participate in scan matching. The results of the scan matching can be involved in the EKF prediction at the next time. Here, a scan-to-submap strategy is employed to greatly reduce the time consumption.
- (2)
- After a scan matching, the system will carry out a closed-loop detection. If a loop closure is found by a suitable matching, the result will be added as a constraint to the back-end optimizer. The back-end optimizer will run one time every 5 s, and output the LiDAR pose at all moments. We can get all optimized static maps by making use of all point cloud data.
- (3)
- The scan-to-submap matching strategy is used to solve the data association problem. A local map (submap) is composed by a number of consecutive LiDAR data frames. When a frame is inserted into the corresponding local map, we will estimate the best LiDAR pose with the existing frames in the local map. The estimation is actually to align the current point cloud with the local map to find the optimal matching, which is a nonlinear least squares problem. To solve the problem, the occupancy grid map is continuous with the bicubic interpolation method.
- (4)
- To further improve the map accuracy, a sparse pose adjustment (SPA) algorithm [30] is periodically activated for the back-end optimization. Owing to the merits of the SPA algorithm, for example, it is robust and tolerant to initialization value, with very low failure rates (getting stuck in local minima) for both incremental and batch processing, and the convergent rate is very fast as it requires only a few iterations of the LM method (this is one of the key factors in our application). With the periodic optimization process, the accumulated error can be limited. It can improve the success rate of closed-loop detection in low-texture environments.
2.1. Mapping
We use the grid map to represent the environment, which has been first proposed by Elfes and Moravec [31,32,33] in the 1980s, and further extended by Elfes [34,35] later. Their fundamental works established the theoretical framework of the grid map. As shown in Figure 2, it is a 2D occupancy grid map, and the value of the cell in the map represents the possibility of being occupied with the objects/obstacles and ranges from −1 to 1. The value −1 means the cell is empty or has available space, and is indicated as white cells in the grid map. The value 1 means the cell is an obstacle or has no available space, and is indicated as black. The value 0 usually represents an unknown area and is indicated as the gray in the map. The map is intuitive, with easy maintenance and an easy introduction to navigation algorithm. How to choose a suitable grid size is empirically determined, which should balance the map accuracy and computational cost. According to the environment scale of the application, the size of the grid is set to 5 cm in this paper.
The updating model of the grid map can be expressed as follows:
In Equation (1), Mnew(pm)∈[−1,1] represents the grid value that has been updated by the point cloud, Mold(pm) represents the previous value that has not been updated, lomeas represents the measured value. There are two cases when a grid map is updated by a point cloud. The first is the laser point falls on the grid, and the grid can be regarded as occupied with lomeas = 0.3. The second is the laser beam can pass through the grid, and the grid can be regarded as free with lomeas = −0.3. Based on Equation (1), a modified updating strategy is used to improve the accuracy of scan matching and closed-loop detection for dynamic environments.
For the first case, the updating strategy can be expressed in Equation (2), it can restrict the updating of the free grid to eliminate the impact of the arrival of the dynamic target.
For the second case, the updating strategy can be expressed in Equation (3). The updating strategy can accelerate the updating process of the occupied grid to eliminate the effect of the departure of the moving target.
Figure 3 is the simulation comparison between the proposed updating strategy and the existing method. In this figure, the upper three from left to right are the grid maps at time T, T+1, and T+2 using the proposed updating strategy. The bottom row is the results from the existing method. The red point in each figure represents the LiDAR, which goes straight along a corridor. Two dynamic targets enter into the LiDAR scanning range from the unknown area. One target is approaching the LiDAR, and the other one crosses the corridor from left to right. We can find that in the map of the existing method, a trajectory of a moving target is left, although this trajectory will slowly become shallower with the continuous updating, but it will affect the accuracy of scan matching, especially in a low-texture environment. On the contrary, in the map generated by the proposed updating strategy, there is no moving target trajectory left, which eliminates the effects of the dynamic target.
The grid map is processed with the bicubic interpolation method for derivative computing. As shown in Figure 4, Pm(x,y) is the target point to be estimated, and there are sixteen grid points Pij(i = 0, 1, …, 3, j = 0, 1, …, 3) around Pm. The main idea is to calculate the probability of target point Pm through the probability of the 16 grid points with a weighted sum strategy. The weight is expressed with and defined in Equation (4); it is a bicubic function used here, and z is the distance from the current point to the target Pm.
The grid at line i and column j is expressed as:
The value of Pm is defined as:
Then we can calculate the derivative of M(pm) relative to x or y.
2.2. Coordinate Transformation
To improve the success rate of closed-loop detection, a local map which is composed of the latest 10 continuous frames is defined. A coordinate XRORYR is defined for the local map. The scanned points are represented in LiDAR coordinates and defined as:
The pose of the LiDAR at the time n related to the local map coordinate of m is expressed as:
The pose of the local map m related to the world coordinate system is defined as:
Then the transformation from the LiDAR coordinate to the local map coordinate is expressed as:
The transformation between the pose of LiDAR from the local map coordinate to the world coordinate system is defined as:
2.3. EKF-Based Sensor Fusion
The 6DOF pose of the mobile robot can be expressed as x = [pT, ΩT, vT]T where p = (px, py, pz)T denotes the position information of the mobile robot, Ω = (ϕ, θ, ψ)T denotes orientation in roll, pitch, and yaw, v = (vx, vy, vz)T denotes the velocity. The output information of IMU is expressed as u = [ɷT, aT]T, as ɷ = (ɷx, ɷy, ɷz)T is the angular velocity, and a = (ax, ay, az)T is the acceleration. Then, the state transition of the 6-DOF motion estimation system can be expressed as:
where RΩ denotes cosine matrix vector from mobile robot to global coordinate, EΩ transform angle velocity into the derivative of Euler angle derivative, and g is gravity constant. Since a low-cost IMU sensor is used, the effect of the earth rotation is not considered.
The prediction model of EKF is provided by the output of the IMU sensor. In order to alleviate the error caused by the IMU drift, additional preprocessing or correction is necessary. The observation model of the EKF-based system is the pose information of the 3-DOF in the plane provided by the 2D SLAM system. The error of the IMU is corrected using the 3-DOF pose information, and the pose of the 6-DOF is updated. The process of prediction and update of EKF is shown as follows:
where ξ* represents 3-DOF pose information provided by the 2D SLAM system, k represents weight coefficient of updating pose, the 6-DOF pose information generated by EKF is reduced dimension by projection matrix C, and the result is used as the initial pose of the 2D SLAM system.
2.4. Data Association
For the low-texture environment, such as in a corridor, it is possible to get several adjacent frames which are almost the same. If there is no assistance from other information, the scan matching may cause a large error. Therefore, the output of EKF is taken to participate in the scan matching. When a LiDAR frame is inserted into the corresponding local map, we will estimate the best LiDAR pose in the local map based on the previous frames in the local map. The method is to find the LiDAR pose to make sure the total probability of the point cloud in the local map is large enough, a nonlinear least square method can be used.
The goal is to solve ξn* with the cost function as follows:
The function M(.) defines the probability value in the local submap. The function G(.) is a coordinate transformation. The above optimization function can be rewritten as:
With the first-order Taylor expansion of the above equation, we can get:
With the initial pose = Cx, taking derivative of the above equation with respect to , then we have
Because LM optimization introduces a damping coefficient in the Gauss–Newton method here, it is used to control the step to prevent divergence. We can tune the dynamic damping coefficient by LM algorithm. In each iteration step, the error caused by new change will be monitored. If the new error is smaller than before, λ will decrease in the next iteration, otherwise, it will increase.
2.5. Closed-Loop Detection and Back-End Optimization
Though a scan-to-map matching strategy is used which can limit the accumulated error, with the continuous movement of the robot, the error will still continue to accumulate. Moreover, in order to reduce the error of closed-loop detection in the low-texture environment, the local map is applied to eliminate the accumulated error. The sparse pose adjustment (SPA) [30] method for back-end optimization is used. When a new frame is added to the local map, a 3D search window along the direction of x, y, and θ around the estimated LiDAR pose is defined first. Then, searching the window step by step is carried out in the local map by calculating the total probability of all points in the frame. If the total probability exceeds the threshold, then it is regarded as a successful closed-loop detection. The relative pose between the LiDAR and the corresponding local map is used as a constraint to optimize pose. When a constraint is added, the pose in the trajectory of LiDAR and all local maps are optimized.
The optimization is formulated as a nonlinear least square problem; we can add constraints to it at any moment.
where
These constraints have the form of relative poses ξmn and associated covariance matrices Ʃmn−1 which can be estimated by [37]. The final step is to estimate the local map pose Ψ set and LiDAR pose set Ω. Considering the low-texture environment may give rise to very similar scanning data, which may lead to a mismatch and result in a large error, Huber loss function is introduced to reduce the influence of outliers in the quadratic term of the objective function.
3. Experiments
3.1. The Platform
The mobile robot platform used in the experiments is shown in Figure 5. Though the embedded controller can get the IMU and odometry data simultaneously, only IMU data is currently considered in the experiment. A 2D LiDAR sensor UTM-30LX-EW was used [38]. The IMU used in the experiments is an ADIS16365 from Analog Device, which contains a three-axis gyroscope and a three-axis accelerometer. Each sensor has its own dynamic compensation equation, and can provide accurate measurement. The sampling frequency of IMU is 500 HZ. We ran the algorithm under ubuntu14.04 with ROS Indigo [39], with a processor Intel (R) Core (TM) i7-6700HQ @ 2.60 GHZ and 8 GB memory.
To verify the performance of the proposed method, we conducted some quantitative and qualitative experiments. For the quantitative comparison, because of the limitation of ground truth data, we conducted the experiments in the constrained environment, where we could measure the length with an accurate handheld laser range finder. The comparison was made among the Cartographer (LiDAR-only) [40] and Cartographer with IMU fusion-based method, and the proposed fusion-based method, which is discussed in Section 3.2.
There are some state-of-the-art 2D LiDAR-based SLAM methods, such as Hector SLAM [7], GMapping [10], KartoSLAM [41], CoreSLAM [42], LagoSLAM [43], and Cartographer [40], which have been proposed, and some papers on the performance evaluation are published [44,45,46,47]. As mentioned in reference [44], among the former five methods (Cartographer was proposed later), KartoSLAM, GMapping, and HectorSLAM show better performance than the other two methods. Both KartoSLAM and LagoSLAM are graph-based optimizations, but the computation load of LagoSLAM is higher than that of KartoSLAM. In particular, KartoSLAM showed the best performance in the real world because the SPA solver is employed and it is a full SLAM approach. In this paper, we focus on the accuracy of the map and real-time application, so the methods including KartoSLAM and Cartographer are used for the evaluation. Since Cartographer is the most state-of-the-art method, we take it as the baseline method in this paper. The experiment results will be introduced in Section 3.3.
The dataset used in Section 3.3 are from reference [48,49,50]. The performance of the algorithms can be evaluated by the accuracy of the map, which is usually defined by the distance between the obtained map and ground truth map or the accuracy of the robot trajectory, but it is usually difficult to generate the ground truth. Additionally, many open standard datasets were recorded with only one sensor. All these factors make the comparison a little hard. In this paper, we apply the proportion of occupied and free cells to the quantitative comparison, which has been proposed in reference [44] for quality evaluation. As shown in Figure 6, the perceptible feature of the picture of a map is the accuracy of the walls or edges. That is, for two maps which are similar in most of the areas, the more blurs in a map means the lower its quality. It is obviously straightforward and no ground truth is needed.
3.2. Quantitative Evaluation
In order to verify the performance of the proposed method in the low-texture environment with dynamic target interference, we elaborately selected two low-texture scenes: the first one was an open-loop scene, the other one was a closed-loop scene. The open-loop scene was a classroom corridor in our university. As shown in Figure 7, the corridor was 35.3 m long and 2.8 m wide. The closed-loop experiment was carried out in a looped classroom corridor 65 m long and 3.9 m wide, which is presented in Figure 8.
We operated the mobile robot along a predefined trajectory to build the map. At the same time, some students moved around the robot elaborately to simulate the interference of moving obstacles. We carried out three kinds of experiments in the open-loop and closed-loop environment.
Figure 7 shows the mapping results with the open-loop scene. The first map was built by Cartographer with LiDAR only [40]. The second map was built by Cartographer with LiDAR+IMU fusion. The third map was built by the proposed method. The results of the open-loop scenes are shown in Figure 7. The results for the closed-loop scene are shown in Figure 8.
As shown in Figure 7, the experiments in the open-loop scene show that though the map built with LiDAR and IMU is improved, because of the existence of the moving obstacles, there are still many noise data in the final map. However, with the proposed method, these noise data are removed. In order to compare the accuracy of three maps for the open-loop scene, we measured the length of the same segment in the corridor, and the estimated lengths with three methods are shown in Table 1. We can see from Figure 7 and Table 1 that the accuracy and stability of the map are greatly improved with the proposed method.
The experiments for the closed-loop scene in Figure 8 show the performances of the three methods (Cartographer without IMU, Cartographer with IMU, and the proposed). In Figure 8a, because the low texture of the environment leads to large error drifting in the front-end stage, after the optimization in the back-end stage, the result map still has inconsistencies. There are also many blurs inside the corridor caused by the moving persons during the experiments. Because the LiDAR-only method cannot recognize the moving objects, it takes all the data for scan matching, then the points located on the moving objects are noise data, which lead to the DA error and map updating error too. Comparatively, as shown in Figure 8b, by fusing with IMU, the fusion-based Cartographer method improves the DA error greatly, but it still cannot remove the moving object effectively, which leads to the blurs inside the corridor of the map. For the proposed method, benefiting from the prediction of IMU and SPA algorithm in the front-end stage, the closed-loop optimization, and large error removing in the back-end stage, the proposed method outperformed the others, as illustrated in Figure 8c. In order to make a quantitative comparison in this case, we selected six segments with different lengths in the closed-loop scene, which are marked as segments A to F, as shown in Figure 9, and the estimated results with three methods are shown in Table 2.
We can see the accuracy is improved by the proposed method in Table 2. This trend will be more obvious with longer segments, as for the segments B and E. We also found that the lengths of the segments estimated by Cartographer with the LiDAR-only method are often shorter than the actual lengths in both open-loop and closed-loop scenes, which is caused by the similarity of two adjacent frames in the low-texture environment. That means that because there are not many differences between two frames in a low-texture environment, for the optimization process, the LiDAR-only method does the scan matching around the previous pose, and it tends to converge earlier to the error tolerance. However, the fusion-based method does the scan matching with the initial pose estimated by the fusion of IMU and the previous pose, and the result is closer to the actual value. The gap between the two kinds of methods (with IMU or not) will be greater if a low-frequency output of LiDAR is used.
3.3. Qualitive Evaluation
In this section, some state-of-the-art 2D LiDAR-based SLAM, such as HectorSLAM and Cartographer, are evaluated qualitatively with the proposed method.
Figure 10 shows the maps of Cartographer (LiDAR-only) and the proposed fusion methods in the outdoor environment, which were conducted at the outdoor square road behind the Siyuan building in the university. The left is the map with LiDAR-only used, the right is obtained with the fusion-based method. Figure 11 shows the maps with Cartographer; the experiments were conducted on the first floor of teaching buildings No. 9 and No. 1. There were some persons passing by during the experiment process, which led to the blurs in the result map. As aforementioned in Figure 6, many blurs remain in the map with LiDAR-only; comparatively, the map generated by the proposed method is sharper and clearer.
We used some open datasets [48] to evaluate the proposed fusion-based method, and the results are presented in Figure 12, Figure 13 and Figure 14. In all these three figures, the left one shows the results with Cartographer of LiDAR only, and the right one shows the results with the proposed method. In Figure 12 the left map shows larger accumulated error indicated by large ellipse. In Figure 12, there is more blurriness in the map generated by Cartographer of LiDAR only. In Figure 13, the map generated by the proposed method is sharp with less blurriness.
Figure 15 shows the experiment results obtained by HectorSLAM, Cartographer (LiDAR-only), and the proposed method with “Team_Hector_MappingBox_Dagstuhl_Neubau.bag” (first raw in the figure) and “Team_Hector_MappingBox_L101_Building.bag” (second raw in the figure) respectively; other datasets obtained the same results. In these experiments, the map with HectorSLAM seems not convergent and leads to inconsistencies. On the other hand, the maps built by Cartographer (LiDAR only) (Figure 15e) and the proposed method (Figure 15f) show not much difference in this case. This is because the environment is not a low-texture one.
4. Conclusions
In this paper, a mapping strategy is firstly exploited to improve the performance of the 2D SLAM in dynamic and low-texture environments, and a fusion method which combines the IMU sensor with a 2D LiDAR is used. The initial motion estimation obtained from the output of EKF is used as the initial pose for the scan matching. Some measurements are taken to remove the noise or large error data during the matching process. The optimization with sparse pose adjustment (SPA) method is adopted at the back-end stage. With the cooperation of both the front-end and back-end, the accuracy and stability of SLAM in low-texture and dynamic environments are greatly improved. The experiments with both open-loop and closed-loop scenes have been conducted, which demonstrated the performance of the proposed method. The evaluation experiments with some state-of-the-art methods show the improvement of the proposed method.
Though there are many excellent works on evaluation of the 2D LiDAR SLAM, such as the references [44,45,46,47], to name a few, and some open datasets for the evaluation are presented, we found that, because the ground truth is limited, and many datasets recorded only one sensor, some differences of the input data format make the dataset not able to run on all state-of-the-art methods. All these factors make the evaluation still a challenging work. The next works include the evaluation framework for the state-of-the-art methods and the dataset with ground truth, and making the proposed method run on an embedded hardware platform and applying it to real applications.
Author Contributions
The work presented here was carried out in collaboration with all authors. Z.W. made the research theme, designed the methods, and wrote the paper. Y.C., Y.M. and K.Y. carried out the experiments, analyzed the data, interpreted the results, and prepared the draft. B.C. worked on reviewing the manuscript.
Funding
This work was supported in part by the Natural Science Foundation of China under Grant No.61573057, partly by the Fundamental Research Funds of BJTU (2017JBZ002), and partly by National Natural Science Foundation of China under Grant 61702032.
Conflicts of Interest
The authors declare no conflict of interest.
References
- Valiente, D.; Payá, L.; Jiménez, L.M.; Sebastián, J.M.; Reinoso, Ó. Visual information fusion through Bayesian inference for adaptive probability-oriented feature matching. Sensors 2018, 18, 2041. [Google Scholar] [CrossRef] [PubMed]
- Meng, X.; Gao, W.; Hu, Z. Dense RGB-D SLAM with multiple cameras. Sensors 2018, 18, 2118. [Google Scholar] [CrossRef] [PubMed]
- Christopher, G.; Matthew, D.; Christopher, R.H.; Daniel, W.C. Enabling off-road autonomous navigation-simulation of LIDAR in dense vegetation. Electronics 2018, 7, 154. [Google Scholar]
- Qian, C.; Liu, H.; Tang, J.; Chen, Y.; Kaartinen, H.; Kukko, A.; Zhu, L.; Liang, X.; Chen, L.; Hyyppä, J. An integrated GNSS/INS/LiDAR-SLAM positioning method for highly accurate forest stem mapping. Remote Sens. 2016, 9, 3. [Google Scholar] [CrossRef]
- Olson, E. M3RSM: Many-to-many multi-resolution scan matching. In Proceedings of the IEEE International Conference on Robotics and Automation (ICRA), Seattle, WA, USA, 26–30 May 2015. [Google Scholar]
- Martin, F.; Triebel, R.; Moreno, L.; Siegwart, R. Two different tools for three-dimensional mapping: DE-based scan matching and feature-based loop detection. Robotica 2014, 32, 19–41. [Google Scholar] [CrossRef]
- Kohlbrecher, S.; Meyer, J.; von Stryk, O.; Klingauf, U. A flexible and scalable SLAM system with full 3D motion estimation. In Proceedings of the IEEE International Symposium on Safety, Security and Rescue Robotics (SSRR), Kyoto, Japan, 1–5 November 2011. [Google Scholar]
- Ratter, A.; Sammut, C. Local Map Based Graph SLAM with Hierarchical Loop Closure and Optimization. In Proceedings of the Australasian Conference on Robotics and Automation (ACRA), Canberra, Australia, 2–4 December 2015. [Google Scholar]
- Zhang, Z. Iterative point matching for registration of free-form curves and surfaces. Int. J. Comput. Vis. 1994, 13, 119–152. [Google Scholar] [CrossRef] [Green Version]
- Grisetti, G.; Stachniss, C.; Burgard, W. Improved techniques for grid mapping with rao-blackwellized particle filters. IEEE Trans. Robot. 2007, 23, 34–46. [Google Scholar] [CrossRef]
- Grisetti, G.; Kummerle, R.; Stachniss, C.; Burgard, W. A Tutorial on Graph-Based SLAM. Intell. Transp. Syst. Mag. IEEE 2010, 2, 31–43. [Google Scholar] [CrossRef]
- Latif, Y.; Cadena, C.; Neira, J. Robust loop closing over time for pose graph SLAM. Int. J. Robot. Res. 2013, 32, 1611–1626. [Google Scholar] [CrossRef] [Green Version]
- Lourakis, M.; Argyros, A. SBA: A software package for generic sparse bundle adjustment. ACM Trans. Mathe. Softw. (TOMS) 2009, 36, 2. [Google Scholar] [CrossRef]
- Kummerle, R.; Grisetti, G.; Strasdat, H.; Konolige, K.; Burgard, W. g2o: A general framework for graph optimization. In Proceedings of the IEEE International Conference on Robotics and Automation, Shanghai, China, 9–13 May 2011; pp. 3607–3613. [Google Scholar]
- Bosse, M.; Zlot, R. Map matching and data association for large-scale two dimensional laser scan-based slam. Int. J. Robot. Res. 2008, 27, 667–691. [Google Scholar] [CrossRef]
- Ratter, A.; Sammut, C.; McGill, M. GPU accelerated graph SLAM and occupancy voxel based ICP for encoder-free mobile robots. In Proceedings of the International Conference on Intelligent Robots and Systems, Tokyo, Japan, 3–7 November 2013; pp. 540–547. [Google Scholar]
- Olson, E.B. Real-time correlative scan matching. In Proceedings of the IEEE International Conference on Robotics and Automation (ICRA’09), Kobe, Japan, 12–17 May 2009; pp. 4387–4393. [Google Scholar]
- Doucet, A.; de Freitas, J.; Murphy, K.; Russel, S. Rao-Blackwellized particle filtering for dynamic Bayesian networks. In Proceedings of the 16th Conference on Uncertainty in Artificial Intelligence, Stanford, CA, USA, 30 June–3 July 2000; pp. 176–183. [Google Scholar]
- Murphy, K. Bayesian map learning in dynamic environments. In Proceedings of the 12th International Conference on Neural Information Processing Systems, Denver, CO, USA, 29 November–4 December 1999; pp. 1015–1021. [Google Scholar]
- Baglietto, M.; Sgorbissa, A.; Verda, D.; Zaccaria, R. Human navigation and mapping with a 6DOF IMU and a laser scanner. Robot. Autonom. Syst. 2011, 59, 1060–1069. [Google Scholar] [CrossRef]
- Tang, J.; Chen, Y.; Kukko, A.; Kaartinen, H.; Jaakkola, A.; Khoramshahi, E.; Hakala, T.; Hyyppä, J.; Holopainen, M.; Hyyppä, H. SLAM-Aided Stem Mapping for Forest Inventory with Small-Footprint Mobile LiDAR. Forests 2015, 6, 4588–4606. [Google Scholar] [CrossRef] [Green Version]
- Hesch, J.A.; Mirzaei, F.M.; Mariottini, G.L.; Roumeliotis, S.I. A Laser-Aided Inertial Navigation System (L-INS) for Human Localization in Unknown Indoor Environments. In Proceedings of the IEEE International Conference on Robotics and Automation, Anchorage, AK, USA, 3–7 May 2010; pp. 5376–5382. [Google Scholar]
- Holz, D.; Lorken, C.; Surmann, H. Continuous 3D sensing for navigation and SLAM in cluttered and dynamic environments. In Proceedings of the International Conference on Information Fusion, Cologne, Germany, 30 June–3 July 2008; pp. 1–7. [Google Scholar]
- Li, L.; Yao, J.; Xie, R.; Tu, J.; Feng, C. Laser-Based Slam with Efficient Occupancy Likelihood Map Learning for Dynamic Indoor Scenes. ISPRS Ann. Photogramm. Remote Sens. Spat. Inf. 2016, III-4, 119–126. [Google Scholar] [CrossRef]
- Montemerlo, M.; Thrun, S.; Whittaker, W. Conditional particle filters for simultaneous mobile robot localization and people-tracking. In Proceedings of the IEEE International Conference on Robotics & Automation, Washington, DC, USA, 11–15 May 2002; Volume 1, pp. 695–701. [Google Scholar]
- Hahnel, D.; Schulz, D.; Burgard, W. Map building with mobile robots in populated environments. In Proceedings of the IEEE/RSJ International Conference on Intelligent Robots & Systems, Lausanne, Switzerland, 30 September–4 October 2002; Volume 1, pp. 496–501. [Google Scholar]
- Avots, D.; Lim, E.; Thibaux, R.; Thrun, S. A probabilistic technique for simultaneous localization and door state estimation with mobile robots in dynamic environments. In Proceedings of the IEEE/RSJ International Conference on Intelligent Robots & Systems, Lausanne, Switzerland, 30 September–4 October 2002; Volume 1, pp. 521–526. [Google Scholar]
- Duckett, T. Dynamic maps for long-term operation of mobile service robots. In Proceedings of the Robotics: Science and Systems, Massachusetts Institute of Technology, Cambridge, MA, USA, 8–11 June 2005; pp. 17–24. [Google Scholar]
- Wang, C.C.; Thorpe, C.; Thrun, S. Online Simultaneous Localization and Mapping with Detection and Tracking of Moving Objects: Theory and Results from a Ground Vehicle in Crowded Urban Areas. In Proceedings of the IEEE International Conference on Robotics & Automation, Taipei, Taiwan, 14–19 September 2003; Volume 1, pp. 842–849. [Google Scholar]
- Konolige, K.; Grisetti, G.; Kummerle, R.; Burgard, W.; Limketkai, B.; Vincent, R. Sparse pose adjustment for 2D mapping. In Proceedings of the IROS, Taipei, Taiwan, 18 October 2010. [Google Scholar]
- Moravec, H.P.; Elfes, A. High resolution maps from wide angle sonar. In Proceedings of the 1985 IEEE International Conference on Robotics and Automation, St. Louis, MO, USA, 25–28 March 1985; IEEE Comput. Soc. Press: Silver Spring, MD, USA, 1985; pp. 116–121. [Google Scholar]
- Elfes, A. Sonar-based real-world mapping and navigation. IEEE J. Robot. Autom. 1987, 3, 249–265. [Google Scholar] [CrossRef] [Green Version]
- Moravec, H.P. Sensor fusion in certainty grids for mobile robots. Ai Mag. 1988, 9, 14. [Google Scholar]
- Elfes, A. Occupancy Grids: A Stochastic Spatial Representation for Active Robot Perception. In Proceedings of the Sixth Conference Annual Conference on Uncertainty in Artificial Intelligence, Cambridge, MA, USA, 27–29 July 1990; Morgan Kaufmann: San Francisco, CA, USA, 1990; pp. 136–146. [Google Scholar]
- Elfes, A. Dynamic control of robot perception using multi-property inference grids. In Proceedings of the 1992 IEEE International Conference on Robotics and Automation, Nice, France, 12–14 May 1992; IEEE Comput. Soc. Press: Los Alamitos, CA, USA, 1992; pp. 2561–2567. [Google Scholar]
- Moré, J.J. The Levenberg-Marquardt algorithm: Implementation and theory. Numer. Anal. 1978, 630, 105–116. [Google Scholar]
- Olson, E.; Leonard, J.; Teller, S. Fast iterative alignment of pose graphs with poor initial estimates. In Proceedings of the IEEE International Conference on Robotics and Automation, Orlando, FL, USA, 15–19 May 2006. [Google Scholar]
- HOKUYO. Available online: https://www.hokuyo-aut.jp/search/single.php?serial=170 (accessed on 29 October 2018).
- Indigo. Available online: http://wiki.ros.org/indigo (accessed on 29 October 2018).
- Hess, W.; Kohler, D.; Rapp, H.; Andor, D. Real-time loop closure in 2D LIDAR SLAM. In Proceedings of the IEEE International Conference on Robotics & Automation, Stockholm, Sweden, 16–21 May 2016. [Google Scholar]
- Vincent, R.; Limketkai, B.; Eriksen, M. Comparison of indoor robot localization techniques in the absence of GPS. In Proceedings of the SPIE: Detection and Sensing of Mines, Explosive Objects, and Obscured Targets XV of Defense, Security, and Sensing Symposium, Orlando, FL, USA, 5–9 April 2010. [Google Scholar]
- Steux, B.; El Hamzaoui, O. tinySLAM: A SLAM algorithm in less than 200 lines C-language program. In Proceedings of the International Conference on Control Automation Robotics & Vision (ICARCV), Singapore, 7–10 December 2010. [Google Scholar]
- Carlone, L.; Aragues, R.; Castellanos, J.A.; Bona, B. A linear approximation for graph-based simultaneous localization and mapping. In Proceedings of the International Conference Robotics: Science and Systems, Los Angeles, CA, USA, 27–30 June 2011. [Google Scholar]
- Filatov, A.; Filatov, A.; Krinkin, K.; Chen, B.; Molodan, D. 2D SLAM Quality Evaluation Methods. Available online: https://arxiv.org/pdf/1708.02354.pdf (accessed on 26 November 2018).
- Santos, J.M.; Portugal, D.; Rocha, R.P. An evaluation of 2D SLAM techniques available in Robot Operating System. In Proceedings of the 2013 IEEE International Symposium on Safety, Security, and Rescue Robotics (SSRR), Linkoping, Sweden, 21–26 October 2013. [Google Scholar]
- Rainer, K.; Steder, B.; Dornhege, C.; Ruhnke, M.; Grisetti, G.; Stachniss, C.; Kleiner, A. On measuring the accuracy of SLAM algorithms. Auton. Robots 2009, 27, 387–407. [Google Scholar] [Green Version]
- Markus, K.; Rainer, K.; Martin, F.; Stefan, M. Benchmarking the Pose Accuracy of Different SLAM Approaches for Rescue Robotics. Available online: https://www.ultrakoch.org/Work/Publications/arc15.pdf (accessed on 28 November 2018).
- Cartographer ROS. Available online: https://google-cartographer-ros.readthedocs.io/en/latest/data.html# (accessed on 10 November 2018).
- tu-darmstadt-ros-pkg. Available online: http://code.google.com/p/tu-darmstadt-ros-pkg/downloads/list (accessed on 25 November 2018).
- slam benchmarking. Available online: http://ais.informatik.uni-freiburg.de/slamevaluation/datasets.php (accessed on 25 November 2018).
Figure 1.
The data flow diagram of the proposed method.
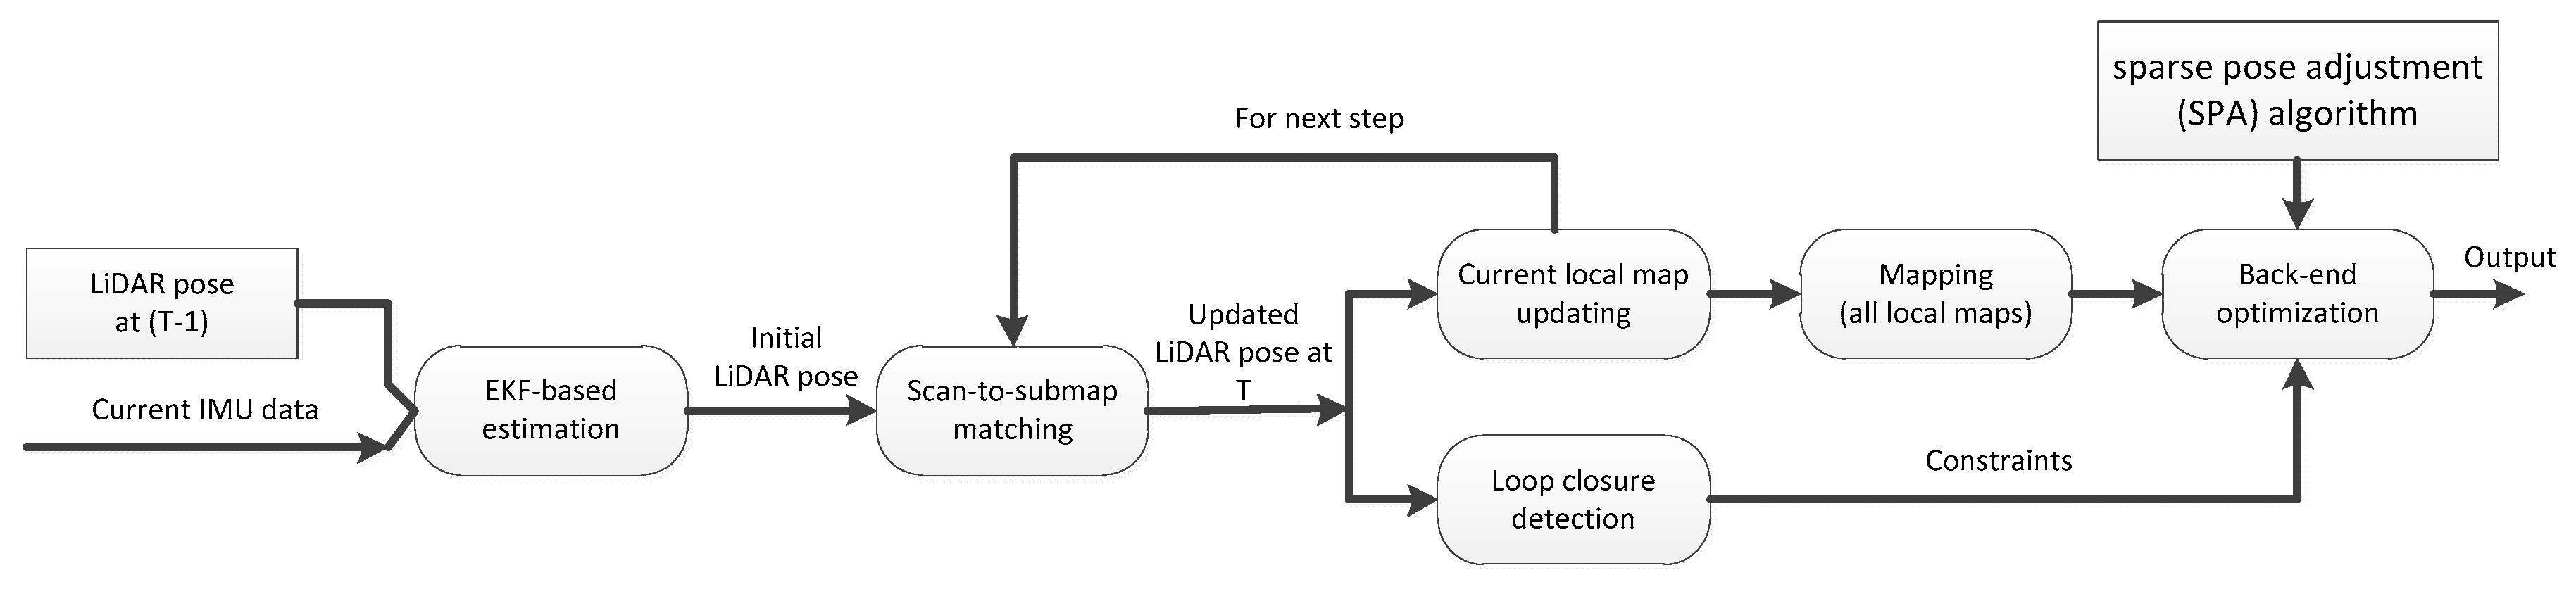
Figure 2.
2D grid-based map of occupancy.

Figure 3.
Simulation comparisons of map updating between the proposed strategy and the existing one.
Figure 3.
Simulation comparisons of map updating between the proposed strategy and the existing one.

Figure 4.
The bicubic interpolation of the grid map.

Figure 5.
The mobile robot used for the experiment and its architecture. (a) The mobile robot used for the experiments; (b) The architecture of the mobile robot.
Figure 5.
The mobile robot used for the experiment and its architecture. (a) The mobile robot used for the experiments; (b) The architecture of the mobile robot.

Figure 6.
The edge and wall representation in a grid map (the more blurriness in a map, the lower quality it is). (a) A submap with more blurries (lower quality); (b) A submap with less blurries (higher quality).
Figure 6.
The edge and wall representation in a grid map (the more blurriness in a map, the lower quality it is). (a) A submap with more blurries (lower quality); (b) A submap with less blurries (higher quality).

Figure 7.
Maps built in open-loop scene (inside the corridor area, the darker the area was, the more blurry it was, that is, the lower quality it will be). (a) A map built with Cartographer with LiDAR only; (b) a map built with Cartographer with LiDAR+IMU fusion; (c) a map built with the proposed method.

Figure 8.
Evaluation experiments in closed-loop scene. (a) A map created by Cartographer with LiDAR only; (b) a map created by Cartographer with LiDAR+IMU fusion; (c) a map created by the proposed method.
Figure 8.
Evaluation experiments in closed-loop scene. (a) A map created by Cartographer with LiDAR only; (b) a map created by Cartographer with LiDAR+IMU fusion; (c) a map created by the proposed method.

Figure 9.
The selected segments in closed-loop scene.

Figure 10.
Closed-loop experiment in outdoor environment. (a) Cartographer (LiDAR only); (b) the proposed method.
Figure 10.
Closed-loop experiment in outdoor environment. (a) Cartographer (LiDAR only); (b) the proposed method.

Figure 11.
The map generated with the proposed method in indoor environment. (a) mapping result of first floor of teaching building No. 9; it is a closed-loop classroom corridor, but we deliberately arranged to not use the last section data, and the mapping result is acceptable. (b) mapping results of the first floor of teaching building No.1.

Figure 12.
Map built by Cartographer (LiDAR only) (a) and the proposed method (b) with file b0-2014-07-21-12-42-53.bag [48].
Figure 12.
Map built by Cartographer (LiDAR only) (a) and the proposed method (b) with file b0-2014-07-21-12-42-53.bag [48].

Figure 13.
Map built by Cartographer (LiDAR only) (a) and the proposed method (b) with file b0-2014-10-07-12-43-25.bag [48].
Figure 13.
Map built by Cartographer (LiDAR only) (a) and the proposed method (b) with file b0-2014-10-07-12-43-25.bag [48].
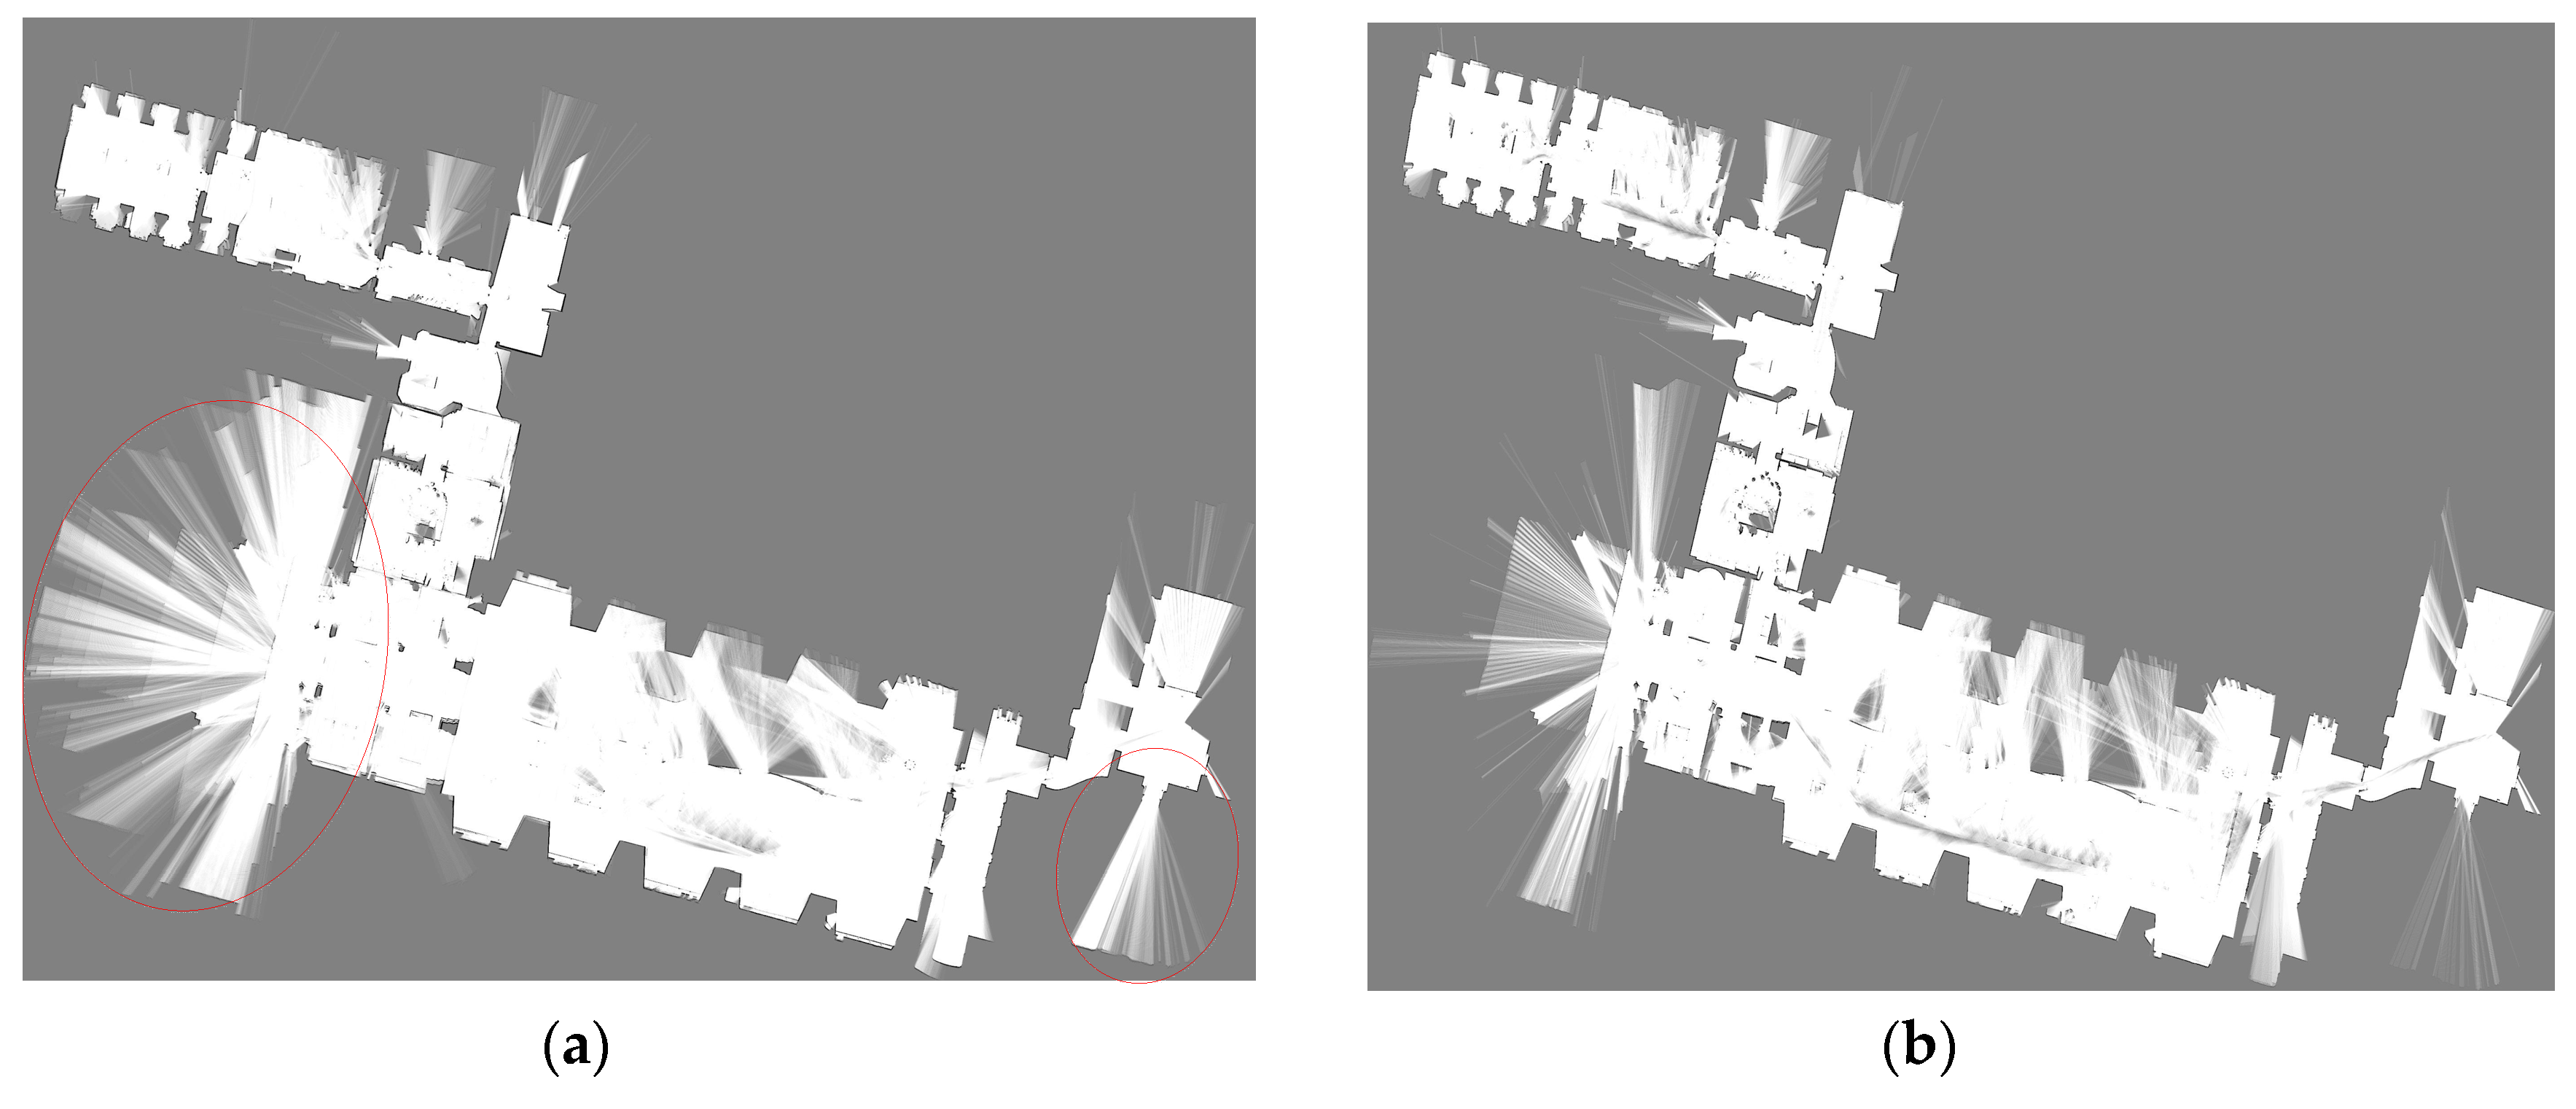
Figure 14.
Map built by Cartographer (LiDAR only) (a) and the proposed method (b) with file b0-2014-08-14-13-36-48.bag [48].
Figure 14.
Map built by Cartographer (LiDAR only) (a) and the proposed method (b) with file b0-2014-08-14-13-36-48.bag [48].

Figure 15.
Evaluation results with HectorSLAM, Cartographer (LiDAR only) and the proposed method. The first raw is the generated maps with “Team_Hector_MappingBox_Dagstuhl_Neubau.bag” file. They are (a) HectorSLAM; (b) Cartographer (LiDAR only); (c) the proposed method respectively. The second raw is the generated maps with “Team_Hector_MappingBox_L101_Building.bag” file. They are (d) HectorSLAM; (e) Cartographer (LiDAR only); (f) the proposed method respectively.


Table 1.
Error Comparison in Open Loop.
| Real Length of the Corridor (m) | Length Obtained by LiDAR-Only Method | Relative Error | Length Obtained by LiDAR & IMU Fusion Method | Relative Error | Length Obtained by the Proposed Method | Relative Error |
|---|---|---|---|---|---|---|
| 28.9 | 26.5 | −8.3% | 27.1 | −6.2% | 27.8 | −3.8% |
Table 2.
Error Comparison in Closed Loop.
| Segment | Actual Value | LiDAR | Relative Error (LiDAR) | LiDAR & IMU | Relative Error (LiDAR & IMU) | LiDAR & IMU & Static Map/ Proposed Method | Relative Error (LiDAR & IMU & Static Map) |
|---|---|---|---|---|---|---|---|
| A | 11.0 | 10.4 | −5.5% | 10.8 | −1.8% | 11.1 | +0.9% |
| B | 42.8 | 38.3 | −10.5% | 42.9 | +0.2% | 42.9 | +0.2% |
| C | 1.8 | 1.6 | −11.1% | 1.7 | −5.6% | 1.7 | −5.6% |
| D | 12.4 | 12 | −3.2% | 11.5 | −7.3% | 12.1 | −2.4% |
| E | 42.8 | 38.3 | −10.5% | 40 | −6.5% | 43.1 | +0.7% |
| F | 2.4 | 2.6 | +8.3% | 2.5 | +4.2% | 2.6 | +8.3% |
© 2018 by the authors. Licensee MDPI, Basel, Switzerland. This article is an open access article distributed under the terms and conditions of the Creative Commons Attribution (CC BY) license (http://creativecommons.org/licenses/by/4.0/).
Share and Cite
MDPI and ACS Style
Wang, Z.; Chen, Y.; Mei, Y.; Yang, K.; Cai, B. IMU-Assisted 2D SLAM Method for Low-Texture and Dynamic Environments. Appl. Sci. 2018, 8, 2534. https://doi.org/10.3390/app8122534
AMA Style
Wang Z, Chen Y, Mei Y, Yang K, Cai B. IMU-Assisted 2D SLAM Method for Low-Texture and Dynamic Environments. Applied Sciences. 2018; 8(12):2534. https://doi.org/10.3390/app8122534
Chicago/Turabian StyleWang, Zhongli, Yan Chen, Yue Mei, Kuo Yang, and Baigen Cai. 2018. "IMU-Assisted 2D SLAM Method for Low-Texture and Dynamic Environments" Applied Sciences 8, no. 12: 2534. https://doi.org/10.3390/app8122534
Note that from the first issue of 2016, this journal uses article numbers instead of page numbers. See further details here.