Impact of Pore Geometry and Water Saturation on Gas Effective Diffusion Coefficient in Soil


1
Hubei Key Laboratory of Theory and Application of Advanced Materials Mechanics, School of Science, Wuhan University of Technology, Wuhan 430070, China
2
Key Laboratory of Mountain Hazards and Earth Surface Processes, CAS/Institute of Mountain Hazards and Environment, CAS, Chengdu 610041, China
3
University of Chinese Academy of Sciences, No.19(A) Yuquan Road, Shijingshan District, Beijing 100049, China
4
School of Environmental Science and Engineering, Tsinghua University, Beijing 100084, China
5
Department of Civil and Environmental Engineering, The Hong Kong University of Science and Technology, Hong Kong SAR 999077, China
*
Author to whom correspondence should be addressed.
Appl. Sci. 2018, 8(11), 2097; https://doi.org/10.3390/app8112097
Submission received: 9 September 2018
/
Revised: 15 October 2018
/
Accepted: 23 October 2018
/
Published: 31 October 2018
(This article belongs to the Section Nanotechnology and Applied Nanosciences)
Abstract
:Gas flow in soil plays a crucial role in terrestrial ecosystems, and numerical simulation of their movement needs to know their effective diffusion coefficients. How pore structure influences the effective diffusion coefficient has been studied intensively for dry porous media, but much remains unknown for unsaturated soils. Here, we employed the X-ray tomography technique at the pore scale to directly obtain the soil structures, the geometry of their pores and the water distribution under different water saturation levels were calculated using a morphological model. The results show that pore structures including porosity, interface area of gas–solid–water and pore diameter are closely related to water saturation. The increase of mean pore diameter with gas saturation can be fitted into a power law. We also investigated the impact of pore geometry and water saturation on the effective diffusion coefficients, which is independent of the molecular mass of gas after normalization. As the normalized effective Knudsen diffusion coefficient increases with average pore diameter following a power law, with the scaling factor related to pore geometry and the exponent is a constant, we explained and proved that the Knudsen diffusion coefficient increases with gas saturation, also following a power law.
1. Introduction
Understanding the movement of gas in soil is of great importance in many fields, such as estimating the environmental effect of gas spills [1,2,3], designing engineering projects to inject and store CO2 [4,5,6,7,8], treatments of volatile constituents of hazardous wastes in landfills and disposal sites [9,10,11]. Owing to the intrinsic complexity of soil structure, the practical study of gas transport in soil is generally based on macroscopic approaches, wherein the microscopic features are volumetrically averaged by omitting the pore geometry [11,12,13]. Because only the void space allows gas to diffuse, gas diffusive flow in soil mainly depends on pore geometry and water saturation [14,15,16].
In the literature, the gas effective diffusion coefficient (Deff) in soil is usually assumed to be proportional to their bulk diffusion coefficient (d) in free air. For example, Marshall [17] and Millington [18], respectively, proposed a power-law, Deff/d = εn, with n being a fitting parameter. Considering the connectivity of pores, Penman [19,20] proposed an improved model, Deff/d = (1/k)ε, with k being the tortuosity factor. Several similar models have been proposed [21,22,23,24], but these models are inadequate for calculating the impact of pore geometry and water saturation on the effective diffusion coefficient. Furthermore, in small pores when the Knudsen effect has to be considered, the diffusion will be much more complicated [14,15,25].
Soils are usually aggregated with a hierarchical structure in which the pores inside the aggregates are much smaller than that between the aggregates. Several methods can be employed to measure the porosity of soil, such as water saturation method [26], water evaporation method [26], mercury intrusion [27,28] and gas absorption [28,29]. All the above methods can achieve a precise porosity and mercury intrusion, and gas absorption can also get the pore size distribution, but these methods cannot acquire the pore structure features, including pore space distribution, pore shape, isolated pores, and also they cannot rebuild 3D pore structure [30,31]. The evolution of tomography, particularly the X-ray tomography technique and focused ion beam/scanning electron microscopy (FIB/SEM), has revealed the interior microstructure of porous media visible at resolutions less than 1 μm [32,33,34]. This, together with pore-scale modelling method, could substantially improve our understanding of certain fundamental processes occurring in porous media [35,36,37,38].
In this paper, we calculated the void structure and the effective diffusion coefficient of soils under different saturations using pore-scale modelling and computed tomography, and to investigate the impact of pore geometry and water saturation on gas effective diffusion coefficient in soil. Firstly, we calculated water distribution by a morphological model [38,39], and to extrapolate the impact of saturation on void structure, i.e., pore geometry including porosity, pore diameter, connectivity and interfacial area. The pore geometry varies with saturation; therefore, we simulated gas diffusion under different saturation conditions to explore the influence of pore geometry on gas diffusion. Secondly, we directly calculated the effective diffusion coefficient by a pore-scale model [15], and to deduce the impact of pore diameter and saturation on effective diffusion coefficient. As studies on how the effective Knudsen diffusion coefficient changes with mean pore diameter and water saturation in porous media is limited in the literature, we attempted to address this using the pore-scale model.
2. Materials and Methods
2.1. Materials
Two soils were investigated in this paper, and they were excavated from two different construction sites in Wuhan, China. The sand:silt:clay ratios for the two soils were 10.9:21.8:67.3 and 29.2:20.3:50.5, respectively. The soil images were acquired using X-ray tomography in Ocean Science and Technology Division, Graduate School at Shenzhen, Tsinghua University. As an illustrative example, Figure 1a shows the 3D image of one soil with voxel size of 6 μm. Because of the limitation of computational capability, we trimmed a cube from the cylinder image, as shown in Figure 1b, and all the simulations and analyses were based on this cube. The dimensions of the cube are 300 × 300 × 300 in terms of voxels, and the porosity is 0.338. The apparent porosity calculated from the image is lower than that measure by gas absorption because X-ray tomography only images pores larger than the voxel size and does not capture microporosity smaller than the image resolution [30].
2.2. Pore Diameter and Water Distribution
We quantified the pore size distribution and connectivity of the soil using a morphological model as that in Hu, Huang and Zhang [38] and Hu, Liu and Zhang [39]. In the morphological model, the void space is assumed to be an assembly of overlapped spheres of different diameters and the diameter of each pore is defined as the diameter of the largest sphere that can occupy the pore. For each void voxel shown in Figure 1b, we first calculated its shortest distance to the solid walls and then, we started from the pore voxel that is most distant from the solid walls and sign it as the center of a sphere. The sphere is then expanded until it touches a solid wall; the void voxels within this expanded sphere are together defined as a temporary pore, and its diameter is defined as the temporary diameter of the sphere. We then repeated the above procedures to all the pore voxels and progressively updated their temporary diameters. For overlapped spheres, the pore voxels in the overlapped zone were assigned to the diameter of the largest sphere that covered the voxels. Figure 1c shows the pore-diameter distribution of the soil, and the mean pore diameter was 5.26 voxels.
We used the method as used in Hu et al. [38,39] to determine the distribution of water in the soil. In this method we assumed that soils are hydrophobic and water distribution in the soil is regulated by capillary pressure which depends on the pore diameter δ. The associated capillary pressure with the pore was assumed to be p = σ/δ, where p is capillary pressure, σ is the air–water surface tension, as the air–water interface is part of a sphere with diameter δ and all pores smaller than δ are filled by water. Water distribution in soil is hysteretic and here we just calculated it under wetting processes as shown in Figure 2.
Due to the technical limitations and computational reasons, the achievable voxel size by current tomography devices is limited by the sample size, which means that if we needed a good representativeness of the soil sample, we would sacrifice the resolution of 3D soil image [31] and all pores which are smaller than the voxel size cannot be explicitly resolved. To investigate the gas diffusion coefficient in a wild range of scales and avoid taking small sub-samples, we shrunk the voxel size of the soil image from 10−1 nm to 103 nm to obtain a series of soil samples with same geometry as shown in Figure 1b. The mean pore diameter of these samples ranged approximately from 0.5 nm to 5 μm.
2.3. The Pore-Scale Model
Gas diffusion in a pore need to overcome the resistance caused both by molecule–wall collision and molecule–molecule collision [40,41,42]. The relative dominance of one type of collision over another depends on the ratio of the mean free path λ to the pore diameter δ, known as Knudsen number Kn = λ/δ. When the Knudsen number is less than 0.01, the gas flow is continuum [42,43,44] and the gas transport can be described by the bulk diffusion coefficient. In contrast, if the pore diameter is much smaller than the mean free path, the gas transport is considered in the Knudsen regime and could be described by the Knudsen diffusion coefficient.
In a single pore, the effective diffusion coefficient can be described by the dusty gas model as follows, in terms of diffusion coefficients [42,44,45,46,47,48,49]:
where deff is the effective diffusion coefficient of the pore; d and dkn are the bulk and Knudsen diffusion coefficient, respectively. Each pore is associated with a bulk diffusion coefficient d and a Knudsen diffusion coefficient dkn, with the former being a constant and the latter calculated as follows [41,42,43,44]:
where T is the temperature, k is the Boltzmann number, m is the molecular mass of the gas and δ is the pore diameter.
In the pore-scale simulation of gas diffusion in soil, we assumed that the system is isothermal and isobaric. We used a constant gas concentration (c1) on the top and a lower concentration (c2) on the bottom of the image to impel the gas flow in the soil, and the other four vertical sides were considered as impermeable boundaries. The gas diffusion through the pore geometry of the image is described by the flowing equation [15,42]:
where c is the gas concentration at each pore voxel in the soil image and t is the time. deff is the effective diffusion coefficient associated with each pore, which can be calculated from Equation (1).
Under a specified temperature and pressure, the bulk diffusion coefficient is constant and equal in all the pores, while the Knudsen diffusion coefficient varies spatially depending on the pore diameter; therefore, the effective diffusion coefficient deff is spatially variable. We solved Equation (3) numerically using the finite volume method developed by Zhang and Gao [50] under the imposed boundary conditions mentioned above. Once the gas diffusion was considered to have attained a steady state, the diffusive flux in each pore voxel was calculated as follows [14,42]:
where qi is the diffusive flux at the pore voxel centered at xi, is the effective diffusion coefficient of the pore voxel calculated from Equation (1) and is the local gas concentration gradient.
We calculated the gas concentration and flux at each voxel and then volumetrically averaged them over the whole image. The average diffusive flux and the concentration gradient are assumed to be described by the following equation [14,42]:
where Q is the average diffusive flux, Deff is the effective diffusion coefficient of the whole soil and is the average gas concentration gradient. As a result, the effective diffusion coefficient can be calculated as follows based on the simulated diffusive flux at each voxel [42]:
Each simulation was carried out for a water distribution calculated from a specific capillary pressure as described above, and the water-gas interface was treated as an impermeable boundary as the solid-gas interface. The water was static and the void structure remained unchanged during the simulation. As a trade-off between computational costs and sample representation, we directly used the voxels in the X-ray image as the FVM element and such treatments did not lead to considerable errors [39].
3. Results and Discussions
3.1. Impact of Saturation on Pore Structure
Figure 3 shows the changes of porosities for total, connected and unconnected pores with water saturation. As water saturation increased, the porosity of the total pores and connected pores decreased, while the unconnected pores increased. When water saturation was less than 0.4, the connected pore porosity was approximately equal to the total pore porosity, indicating that under low water saturations, a smaller fraction of the pores is occupied by water. This is in stark contrast to when saturation is higher than 0.5.
As mentioned before, each pore voxel is associated with a pore diameter. The volume of pores for each diameter under different saturations is shown in Figure 4. The curve shapes for total and connected pores were similar, and the volume of pores decreased with increasing water saturation except for small pores (diameter < 2 voxels), which increased with water saturation in the initial stage and decreased later. This is because water entering pores in the hydrophobic soil reduced the diameters of the large pores. The mean pore diameters decreased with water saturation. If S is water saturation, then (1 − S) denote gas saturation, and the normalized mean pore diameter increases with gas saturation, as shown in Figure 5. The increase can be fitted into a power law, δ′ = α(1 − S)β, where δ′ is the normalized mean pore diameter. As an illustration, Figure 5 shows the comparison between the calculated mean pore diameter and that estimated by δ′ = α(1 − S)β. To test that the formula was valid for other soils, we calculated the normalized mean pore diameter under different saturations in another soil sample with contrasting pore geometrical shape and pore size distribution, as shown in Figure 6. The results (not presented) show that the relationship between average pore diameter and gas saturation can be fitted into a power-law.
As most biogeochemical processes in soil occur at the interface of water, air and solid [51], we calculated the interface areas of gas–water, gas–solid and water–solid under different water saturations. For convenient analysis, we normalized all the interface areas by A0, where A0 is the interface area of gas–solid when water saturation is 0. Figure 7 shows the changes of interface areas A/A0 with water saturation. Swelling of water saturation decreased the interface area of gas–solid exponentially, concurrent with exponentially increasing the interface area of water–solid, and the interface area of gas–water increased with water saturation in early stages and decreased with an increasing rate in later stages.
3.2. Impact of Saturation on Effective Diffusion Coefficient
We first simulated carbon dioxide diffusion in soil as shown in Figure 1. Since gas diffusion is dependent on temperature and pressure [52], a temperature 300 K and pressure 1 bar and a bulk diffusion coefficient d = 0.16 cm2/s were used in the simulations. For each image, we calculated its effective bulk diffusion coefficient (Db), omitting the Knudsen diffusion, the effective Knudsen diffusion coefficient (Dkn), omitting the bulk diffusion and the overall effective diffusion coefficient (Deff) considering both the bulk and Knudsen diffusions. For convenient analysis, we normalized all the effective diffusion coefficients by the bulk diffusion coefficient d.
Figure 8 shows the changes of effective diffusion coefficient (Deff/d) with mean pore diameter in comparison with the effective bulk diffusion coefficient (Db/d) and the effective Knudsen diffusion coefficient (Dkn/d), under saturations 0, 0.267 and 0.825. For all three water saturations, the patterns of the effective diffusion coefficient changes with pore diameter were similar, the effective diffusion coefficient increased with mean pore diameter as the effective Knudsen diffusion coefficient in the Knudsen regime, and asymptotically approached the value of the effective bulk diffusion coefficient in the continuum regime. As shown in Figure 8, the effective diffusion coefficient decreased with increasing water saturation. This is mainly because the swelling of water saturation decreases the porosity and mean pore diameter of soil as illustrated before, and hence, the soil becomes less diffusible.
To prove the above impact of water saturation on the gas diffusion coefficient is a general principle, we simulated oxygen diffusion in the two soil samples with bulk diffusion coefficient d = 0.20 cm2/s [43]. The simulated results are shown in Figure 9. The curves of effective diffusion coefficient with pore diameter are similar to those of carbon dioxide, and the effective diffusion coefficients also decrease with water saturation increasing.
Under certain water saturation, the values of the effective diffusion coefficients (Deff) of carbon dioxide and oxygen, as well as their changes with mean pore diameter differ considerably (not presented). However, after normalization, the values of Deff/d were approximately equal, particularly when the mean pore diameter was relatively large, as shown in Figure 8 and Figure 9a, indicating that Deff/d depends only on the pore geometry and not on the molecular mass of gas. To prove this, we simulated the effective diffusion coefficient of methane and hydrogen in the soil in Figure 1; and the results also show that the normalized effective diffusion coefficient is independent of the molecular mass of gas as shown in Figure 9c,d.
3.3. Effective Knudsen Diffusion Coefficient
The effective diffusion coefficient for gas transport in soil can be calculated by the dusty gas formula when the accuracy requirement is not too strict [15]. However, the dusty gas model requires the effective bulk and effective Knudsen diffusion coefficients, which cannot be directly measured and should be estimated indirectly. Different empirical formulas are available to estimate the effective bulk diffusion coefficient [18,21,53] by porosity and tortuosity. However, study on the effective Knudsen diffusion coefficient is limited. As the effective Knudsen diffusion coefficient mainly depends on pore diameter and the molecular mass of gas, we calculated the effective Knudsen diffusion coefficient of oxygen and hydrogen in the two soil samples using the pore-scale method. Figure 10 shows the changes of normalized effective Knudsen diffusion coefficient (Dkn/d) with a mean pore diameter. The simulated effective Knudsen diffusion coefficients of oxygen and hydrogen in soil sample 1 were very close, and this further proves that the normalized effective Knudsen diffusion coefficient depends only on the pore geometry, and not on the molecular mass of gas. At pore scale, the Knudsen diffusion coefficient increased linearly with pore diameter as Equation (2); but after a volumetric average, this linear dependence is broken and becomes a power law. The increase of the normalized effective Knudsen diffusion coefficient with the mean pore diameter can be described by the following equation:
where η is a parameter related to pore geometry, and γ is a constant with the value equal to 0.99. The comparison between the normalized effective Knudsen diffusion coefficients is estimated by Equation (7), with that calculated from pore-scale simulations showing a good agreement as shown in Figure 10, with η = 0.0027 for soil sample 1 and η = 0.001 for soil sample 2.
As mentioned before, the mean pore diameter increases with gas saturation following a power law δ′ = α(1 − S)β, and the increase of the effective Knudsen diffusion coefficient with mean pore diameter can be described by the power law Dkn/d = ηδ′γ; we can easily draw out the effective Knudsen diffusion coefficient with gas saturation following a power law Dkn/d = m(1 − S)n. To prove the validity of this equation, we simulated the effective Knudsen diffusion coefficient of different gases in the two soil samples under various saturations and the results show that the effective Knudsen diffusion coefficient increased with gas saturation following a power law as shown in Figure 11.
4. Conclusions
In this paper, two 3D images and simulations were used to evaluate the effect of saturation on pore structure and on the effective diffusion coefficient of soil. The simulations show that:
- (1)
- The pore geometry including porosity, connectivity, pore size and interface strongly depend on water distribution and saturation, and the relationship between average pore diameter and gas saturation can be fitted into a power-law;
- (2)
- The present approach can be used to calculate the effective diffusion coefficient, but needs to know the pore structure;
- (3)
- The effective diffusion coefficient in the Knudsen region and in the continuum region approximates the effective Knudsen diffusion coefficient and the effective bulk diffusion coefficient, respectively. In the transition region, it can be calculated by the dusty-gas model under certain accuracy.
- (4)
- Pore diameter is essential in calculating the effective Knudsen diffusion coefficient which increases with gas saturation following a power-law.
Author Contributions
W.H. and D.C. provided the experiments resources; W.H. conceived the methodology and software and wrote the original draft; Y.J., Y.L., Q.H. and Y.C. reviewed and edited the manuscript; datasets were prepared and visualized by Y.J.; supervision, D.C.; funding acquisition, W.H. and Y.J.
Funding
This research was funded by the National Natural Science Foundation of China (grant number 11602180, 41790432) and the Fundamental Research Funds for the Central Universities (grant numbers WUT: 2017IVA064, WUT: 2017IVB058). Yao Jiang acknowledges support from CAS Pioneer Hundred Talents Program.
Conflicts of Interest
The authors declare no conflicts of interest.
References
- Vidic, R.D.; Brantley, S.L.; Vandenbossche, J.M.; Yoxtheimer, D.; Abad, J.D. Impact of shale gas development on regional water quality. Science 2013, 340, 1235009. [Google Scholar] [CrossRef] [PubMed]
- Stamford, L.; Azapagic, A. Life cycle environmental impacts of UK shale gas. Appl. Energy 2014, 134, 506–518. [Google Scholar] [CrossRef]
- Zavalaaraiza, D.; Alvarez, R.A.; Lyon, D.R.; Allen, D.T.; Marchese, A.J.; Zimmerle, D.J.; Hamburg, S.P. Super-emitters in natural gas infrastructure are caused by abnormal process conditions. Nat. Commun. 2017, 8, 14012. [Google Scholar] [CrossRef] [PubMed]
- Bjørnarå, T.I.; Nordbotten, J.M.; Park, J. Vertically integrated models for coupled two-phase flow and geomechanics in porous media. Water Resour. Res. 2016, 52, 1398–1417. [Google Scholar] [CrossRef] [Green Version]
- Chalbaud, C.; Robin, M.; Lombard, J.M.; Martin, F.; Egermann, P.; Bertin, H. Interfacial tension measurements and wettability evaluation for geological CO2 storage. Adv. Water Resour. 2009, 32, 98–109. [Google Scholar] [CrossRef]
- Obi, E.O.I.; Blunt, M.J. Streamline-based simulation of carbon dioxide storage in a North Sea aquifer. Water Resour. Res. 2006, 42, 1–13. [Google Scholar] [CrossRef]
- Juanes, R.; Spiteri, E.J.; Orr, F.M., Jr.; Blunt, M.J. Impact of relative permeability hysteresis on geological CO2 storage. Water Resour. Res. 2006, 42, 1–13. [Google Scholar] [CrossRef]
- Kim, T.H.; Cho, J.; Lee, K.S. Evaluation of CO2 injection in shale gas reservoirs with multi-component transport and geomechanical effects. Appl. Energy 2017, 190, 1195–1206. [Google Scholar] [CrossRef]
- Xu, Z.; Zhao, M.; Miao, H.; Huang, Z.; Gao, S.; Ruan, W. In situ volatile fatty acids influence biogas generation from kitchen wastes by anaerobic digestion. Bioresour. Technol. 2014, 163, 186–192. [Google Scholar] [CrossRef] [PubMed]
- Komilis, D.P.; Ham, R.K.; Park, J.K. Emission of volatile organic compounds during composting of municipal solid wastes. Water Res. 2004, 38, 1707–1714. [Google Scholar] [CrossRef] [PubMed]
- Reinecke, S.A.; Sleep, B.E. Knudsen diffusion, gas permeability, and water content in an unconsolidated porous medium. Water Resour. Res. 2002, 38. [Google Scholar] [CrossRef]
- Blunt, M.J.; Bijeljic, B.; Dong, H.; Gharbi, O.; Iglauer, S.; Mostaghimi, P.; Paluszny, A.; Pentland, C. Pore-scale imaging and modelling. Adv. Water Resour. 2013, 51, 197–216. [Google Scholar] [CrossRef] [Green Version]
- Raoof, A.; Hassanizadeh, S.M. Saturation-dependent solute dispersivity in porous media: Pore-scale processes. Water Resour. Res. 2013, 49, 1943–1951. [Google Scholar] [CrossRef] [Green Version]
- Mu, D.; Liu, Z.S.; Huang, C.; Djilali, N. Determination of the effective diffusion coefficient in porous media including knudsen effects. Microfluid. Nanofluid. 2008, 4, 257–260. [Google Scholar] [CrossRef]
- Li, Z.; Zhang, X.; Liu, Y. Pore-scale simulation of gas diffusion in unsaturated soil aggregates: Accuracy of the dusty-gas model and the impact of saturation. Geoderma 2017, 303, 196–203. [Google Scholar] [CrossRef]
- Edwards, R.W.J.; Doster, F.; Celia, M.A.; Bandilla, K.W. Numerical modeling of gas and water flow in shale gas formations with a focus on the fate of hydraulic fracturing fluid. Environ. Sci. Technol. 2017, 51, 13779–13787. [Google Scholar] [CrossRef] [PubMed]
- Marshall, T.J. The diffusion of gases through porous media. J. Soil Sci. 1959, 10, 79–82. [Google Scholar] [CrossRef]
- Millington, R.J. Gas diffusion in porous media. Science 1959, 130, 100–102. [Google Scholar] [CrossRef] [PubMed]
- Penman, H.L. Gas and vapour movements in the soil: I. The diffusion of vapours through porous solids. J. Agric. Sci. 1940, 30, 437–462. [Google Scholar] [CrossRef]
- Penman, H.L. Gas and vapour movements in the soil: II. The diffusion of carbon dioxide through porous solids. J. Agric. Sci. 1940, 30, 570–581. [Google Scholar] [CrossRef]
- Deepagoda, T.K.K.C.; de Jonge, L.W.; Kawamoto, K.; Komatsu, T.; Moldrup, P. The water-induced linear reduction gas diffusivity model extended to three pore regions. Vadose Zone J. 2015, 14, 1–9. [Google Scholar]
- Deepagoda, T.K.K.C.; Moldrup, P.; Schjønning, P.; Kawamoto, K.; Komatsu, T.; de Jonge, L.W. Variable pore connectivity model linking gas diffusivity and air-phase tortuosity to soil matric potential. Vadose Zone J. 2012, 11, 120–128. [Google Scholar] [CrossRef]
- Moldrup, P.; Deepagoda, T.K.K.C.; Hamamoto, S.; Komatsu, T.; Kawamoto, K.; Rolston, D.E.; de Jonge, L.W. Structure-dependent water-induced linear reduction model for predicting gas diffusivity and tortuosity in repacked and intact soil. Vadose Zone J. 2013, 12, 1–11. [Google Scholar] [CrossRef]
- Thorbjørn, A.; Moldrup, P.; Blendstrup, H.; Komatsu, T.; Rolston, D.E. A gas diffusivity model based on air, solid, and water-phase resistance in variably saturated soil. Vadose Zone J. 2008, 7, 1230–1240. [Google Scholar] [CrossRef]
- Zhang, X.; Gao, Y.; Ostadi, H.; Jiang, K.; Chen, R. Modelling water intrusion and oxygen diffusion in a reconstructed microporous layer of pem fuel cells. Int. J. Hydrog. Energy 2014, 39, 17222–17230. [Google Scholar] [CrossRef] [Green Version]
- Dullien, F.A.L. Porous Media: Fluid Transport and Pore Structure; Academic Press: Cambridge, MA, USA, 1992. [Google Scholar]
- Gomez-Soberon, J.M.V. Porosity of recycled concrete with substitution of recycled concrete aggregate—An experimental study. Cem. Concr. Res. 2002, 32, 1301–1311. [Google Scholar] [CrossRef]
- Gomez-Soberon, J.M.V. Relationship between gas adsorption and the shrinkage and creep of recycled aggregate concrete. Cem. Concr. Aggreg. 2003, 25, 42–48. [Google Scholar]
- Miguel Mendivil-Escalante, J.; Manuel Gomez-Soberon, J.; Luis Almaral-Sanchez, J.; Guadalupe Cabrera-Covarrubias, F. Metamorphosis in the porosity of recycled concretes through the use of a recycled polyethylene terephthalate (PET) additive. Correlations between the porous network and concrete properties. Materials 2017, 10, 176. [Google Scholar] [CrossRef] [PubMed]
- Andrew, M.; Bijeljic, B.; Blunt, M.J. Pore-scale imaging of geological carbon dioxide storage under in situ conditions. Geophys. Res. Lett. 2013, 40, 3915–3918. [Google Scholar] [CrossRef] [Green Version]
- Cnudde, V.; Boone, M.N. High-resolution X-ray computed tomography in geosciences: A review of the current technology and applications. Earth Sci. Rev. 2013, 123, 1–17. [Google Scholar] [CrossRef] [Green Version]
- Thiele, S.; Zengerle, R.; Ziegler, C. Nano-morphology of a polymer electrolyte fuel cell catalyst layer-imaging, reconstruction and analysis. Nano Res. 2011, 4, 849–860. [Google Scholar] [CrossRef]
- Wildenschild, D.; Sheppard, A.P. X-ray imaging and analysis techniques for quantifying pore-scale structure and processes in subsurface porous medium systems. Adv. Water Resour. 2013, 51, 217–246. [Google Scholar] [CrossRef]
- Saif, T.; Lin, Q.; Butcher, A.R.; Bijeljic, B.; Blunt, M.J. Multi-scale multi-dimensional microstructure imaging of oil shale pyrolysis using X-ray micro-tomography, automated ultra-high resolution SEM, maps mineralogy and fib-sem. Appl. Energy 2017, 202, 628–647. [Google Scholar] [CrossRef]
- Zaretskiy, Y.; Geiger, S.; Sorbie, K.; Förster, M. Efficient flow and transport simulations in reconstructed 3d pore geometries. Adv. Water Resour. 2010, 33, 1508–1516. [Google Scholar] [CrossRef]
- Singh, K.; Bijeljic, B.; Blunt, M.J. Imaging of oil layers, curvature and contact angle in a mixed-wet and a water-wet carbonate rock. Water Resour. Res. 2016, 52, 1716–1728. [Google Scholar] [CrossRef] [Green Version]
- Raeini, A.Q.; Blunt, M.J.; Bijeljic, B. Direct simulations of two-phase flow on micro-CT images of porous media and upscaling of pore-scale forces. Adv. Water Resour. 2014, 74, 116–126. [Google Scholar] [CrossRef]
- Hu, W.L.; Huang, N.; Zhang, X.X. Impact of saturation on mass transfer rate between mobile and immobile waters in solute transport within aggregated soils. J. Hydrol. 2014, 519, 3557–3565. [Google Scholar] [CrossRef]
- Hu, W.; Liu, G.; Zhang, X. A pore-scale model for simulating water flow in unsaturated soil. Microfluid. Nanofluid. 2018, 22, 71. [Google Scholar] [CrossRef]
- Cunningham, R.E.; Williams, R.J.J. Diffusion in Gases and Porous Media; Springer: New York, NY, USA, 1980. [Google Scholar]
- Mason, E.A.; Malinauskas, A.P. Gas Transport in Porous Media: The Dusty-Gas Model; Elsevier: Amsterdam, The Netherlands, 1983. [Google Scholar]
- Hu, W. The Research of Fluid Migration in Soil Using the Pore-Scale Modelling Method. Ph.D. Thesis, Lanzhou University, Lanzhou, China, 1 October 2015. [Google Scholar]
- Becker, J.; Wieser, C.; Fell, S.; Steiner, K. A multi-scale approach to material modeling of fuel cell diffusion media. Int. J. Heat Mass Transf. 2011, 54, 1360–1368. [Google Scholar] [CrossRef]
- Phattaranawik, J.; Jiraratananon, R.; Fane, A.G. Effect of pore size distribution and air flux on mass transport in direct contact membrane distillation. J. Membr. Sci. 2003, 215, 75–85. [Google Scholar] [CrossRef]
- Mason, E.A.; Evans, R.B., III. Graham’s laws: Simple demonstrations of gases in motion part 1, theory. J. Chem. Educ. 1969, 46, 358–364. [Google Scholar] [CrossRef]
- Fernandez-Pineda, C.; Izquierdo-Gil, M.A.; Garcia-Payo, M.C. Gas permeation and direct contact membrane distillation experiments and their analysis using different models. J. Membr. Sci. 2002, 198, 33–49. [Google Scholar] [CrossRef]
- Martínez, L.; Florido-Díaz, F.J.; Hernández, A.; Prádanos, P. Characterisation of three hydrophobic porous membranes used in membrane distillation: Modelling and evaluation of their water vapour permeabilities. J. Membr. Sci. 2002, 203, 15–27. [Google Scholar] [CrossRef]
- Evans, R.B., III; Watson, G.M.; Mason, E.A. Gaseous diffusion in porous media at uniform pressure. J. Chem. Phys. 1961, 35, 2076–2083. [Google Scholar] [CrossRef]
- Thorstenson, D.C.; Pollock, D.W. Gas transport in unsaturated zones multicomponent systems and the adequacy of fick’s laws. Water Resour. Res. 1989, 25, 477–507. [Google Scholar] [CrossRef]
- Zhang, X.; Gao, Y. Impact of liquid water on oxygen reaction in cathode catalyst layer of proton exchange membrane fuel cell: A simple and physically sound model. J. Power Sources 2016, 318, 251–263. [Google Scholar] [CrossRef]
- Young, I.M.; Ritz, K. Tillage, habitat space and function of soil microbes. Soil Tillage Res. 2000, 53, 201–213. [Google Scholar] [CrossRef]
- Cui, X.; Bustin, R.M.; Dipple, G. Selective transport of CO2, CH4, and N2 in coals: Insights from modeling of experimental gas adsorption data. Fuel 2004, 83, 293–303. [Google Scholar] [CrossRef]
- Moldrup, P.; Olesen, T.; Yoshikawa, S.; Komatsu, T.; Rolston, D.E. Three-porosity model for predicting the gas diffusion coefficient in undisturbed soil. Soil Sci. Soc. Am. J. 2004, 68, 750–759. [Google Scholar] [CrossRef]
Figure 1.
(a) 3D image of soil, acquired using X-ray tomography, with the pores in black and solid in grey; (b) the cube (sample 1) trimmed from the soil; (c) pore-size distribution.
Figure 1.
(a) 3D image of soil, acquired using X-ray tomography, with the pores in black and solid in grey; (b) the cube (sample 1) trimmed from the soil; (c) pore-size distribution.
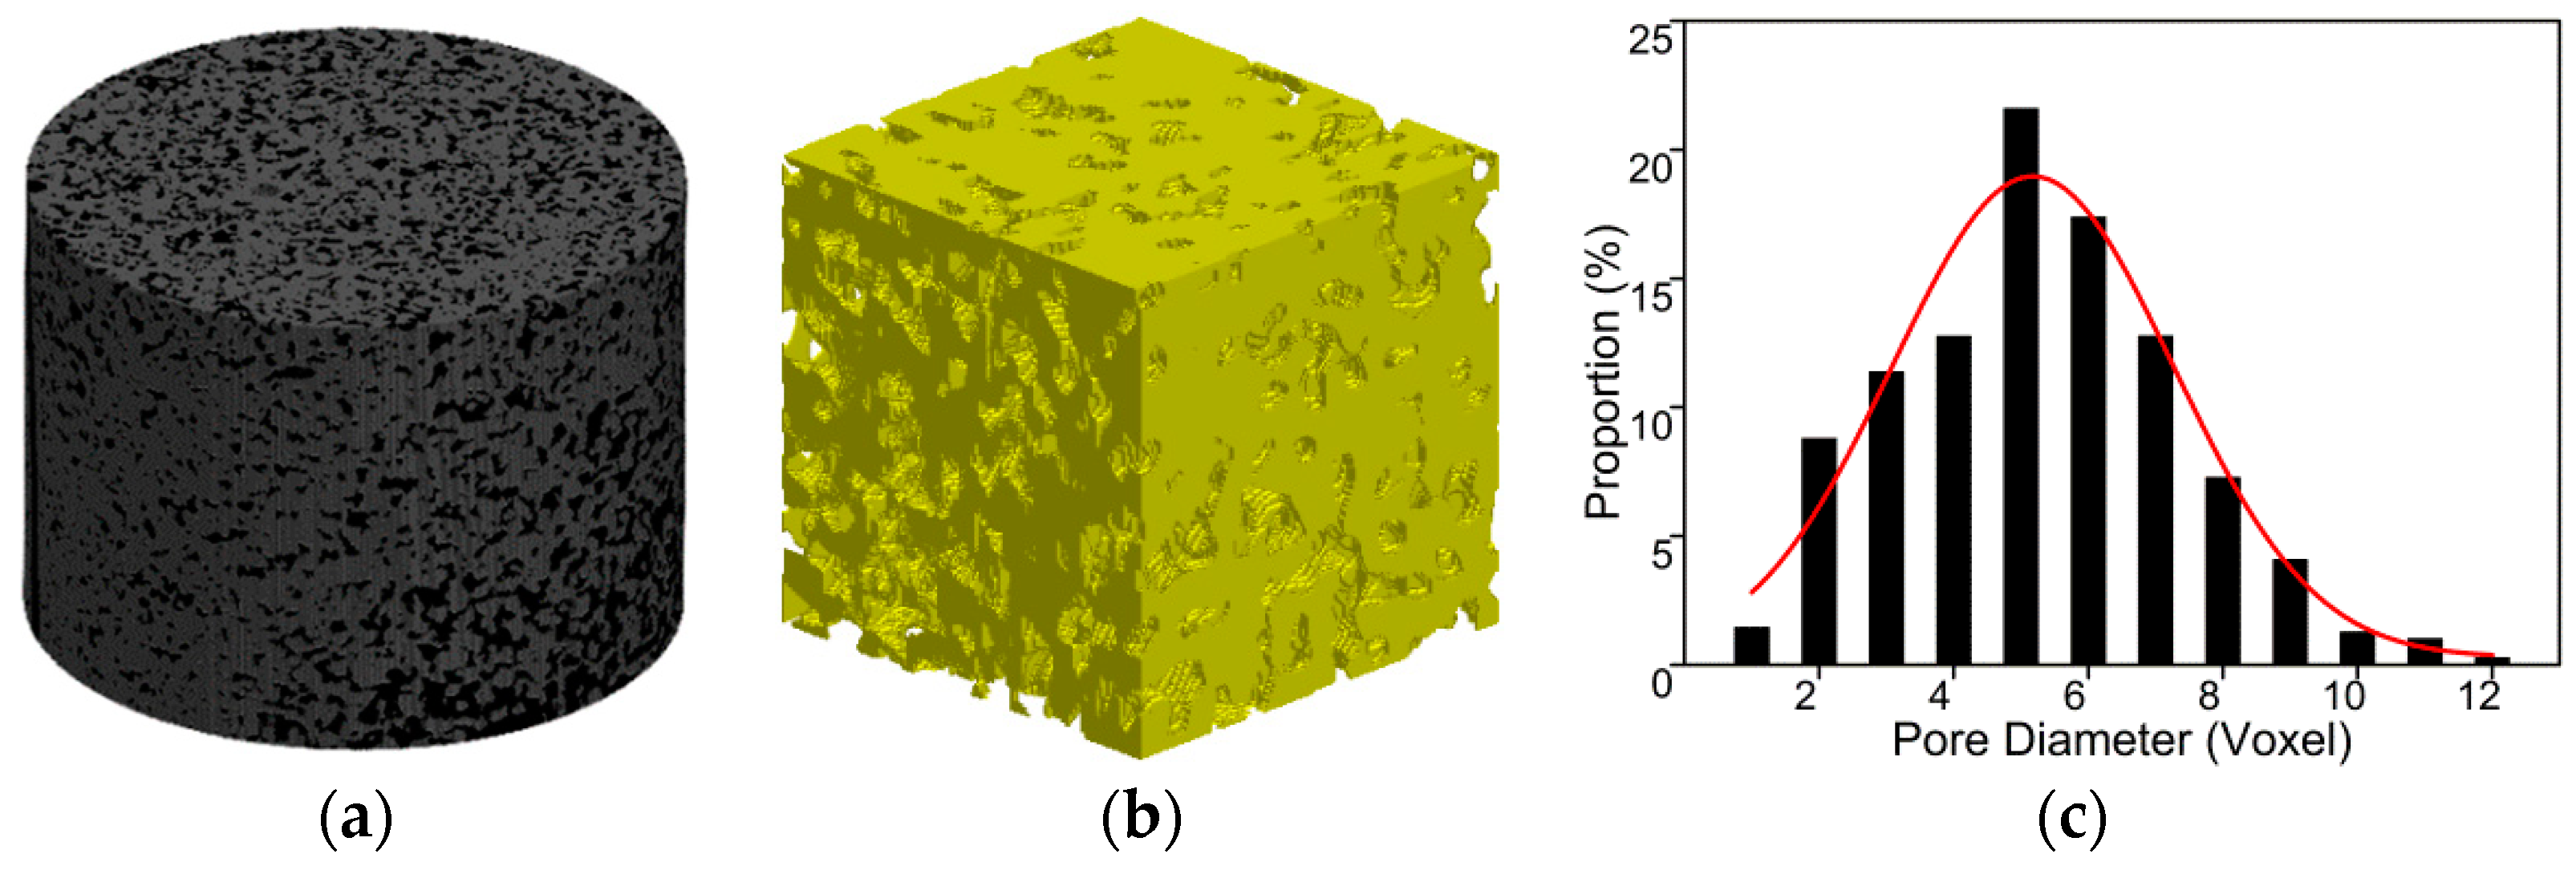
Figure 2.
Image illustrations of water and pore distributions in the soil (sample 1) under different water saturations S, The left column images show the solid (brown), water (red) and pore (yellow) distributions; the middle column images show the water distribution (red); the right column images show the connected pores (yellow) and unconnected pores (purple): (a) S = 0.825; (b) S = 0.527; (c) S = 0.267.

Figure 3.
Changes of porosity (Vgas/V) with water saturation. Here, porosity is the volume ratio of void voxels to the whole soil sample in Figure 1b.
Figure 3.
Changes of porosity (Vgas/V) with water saturation. Here, porosity is the volume ratio of void voxels to the whole soil sample in Figure 1b.
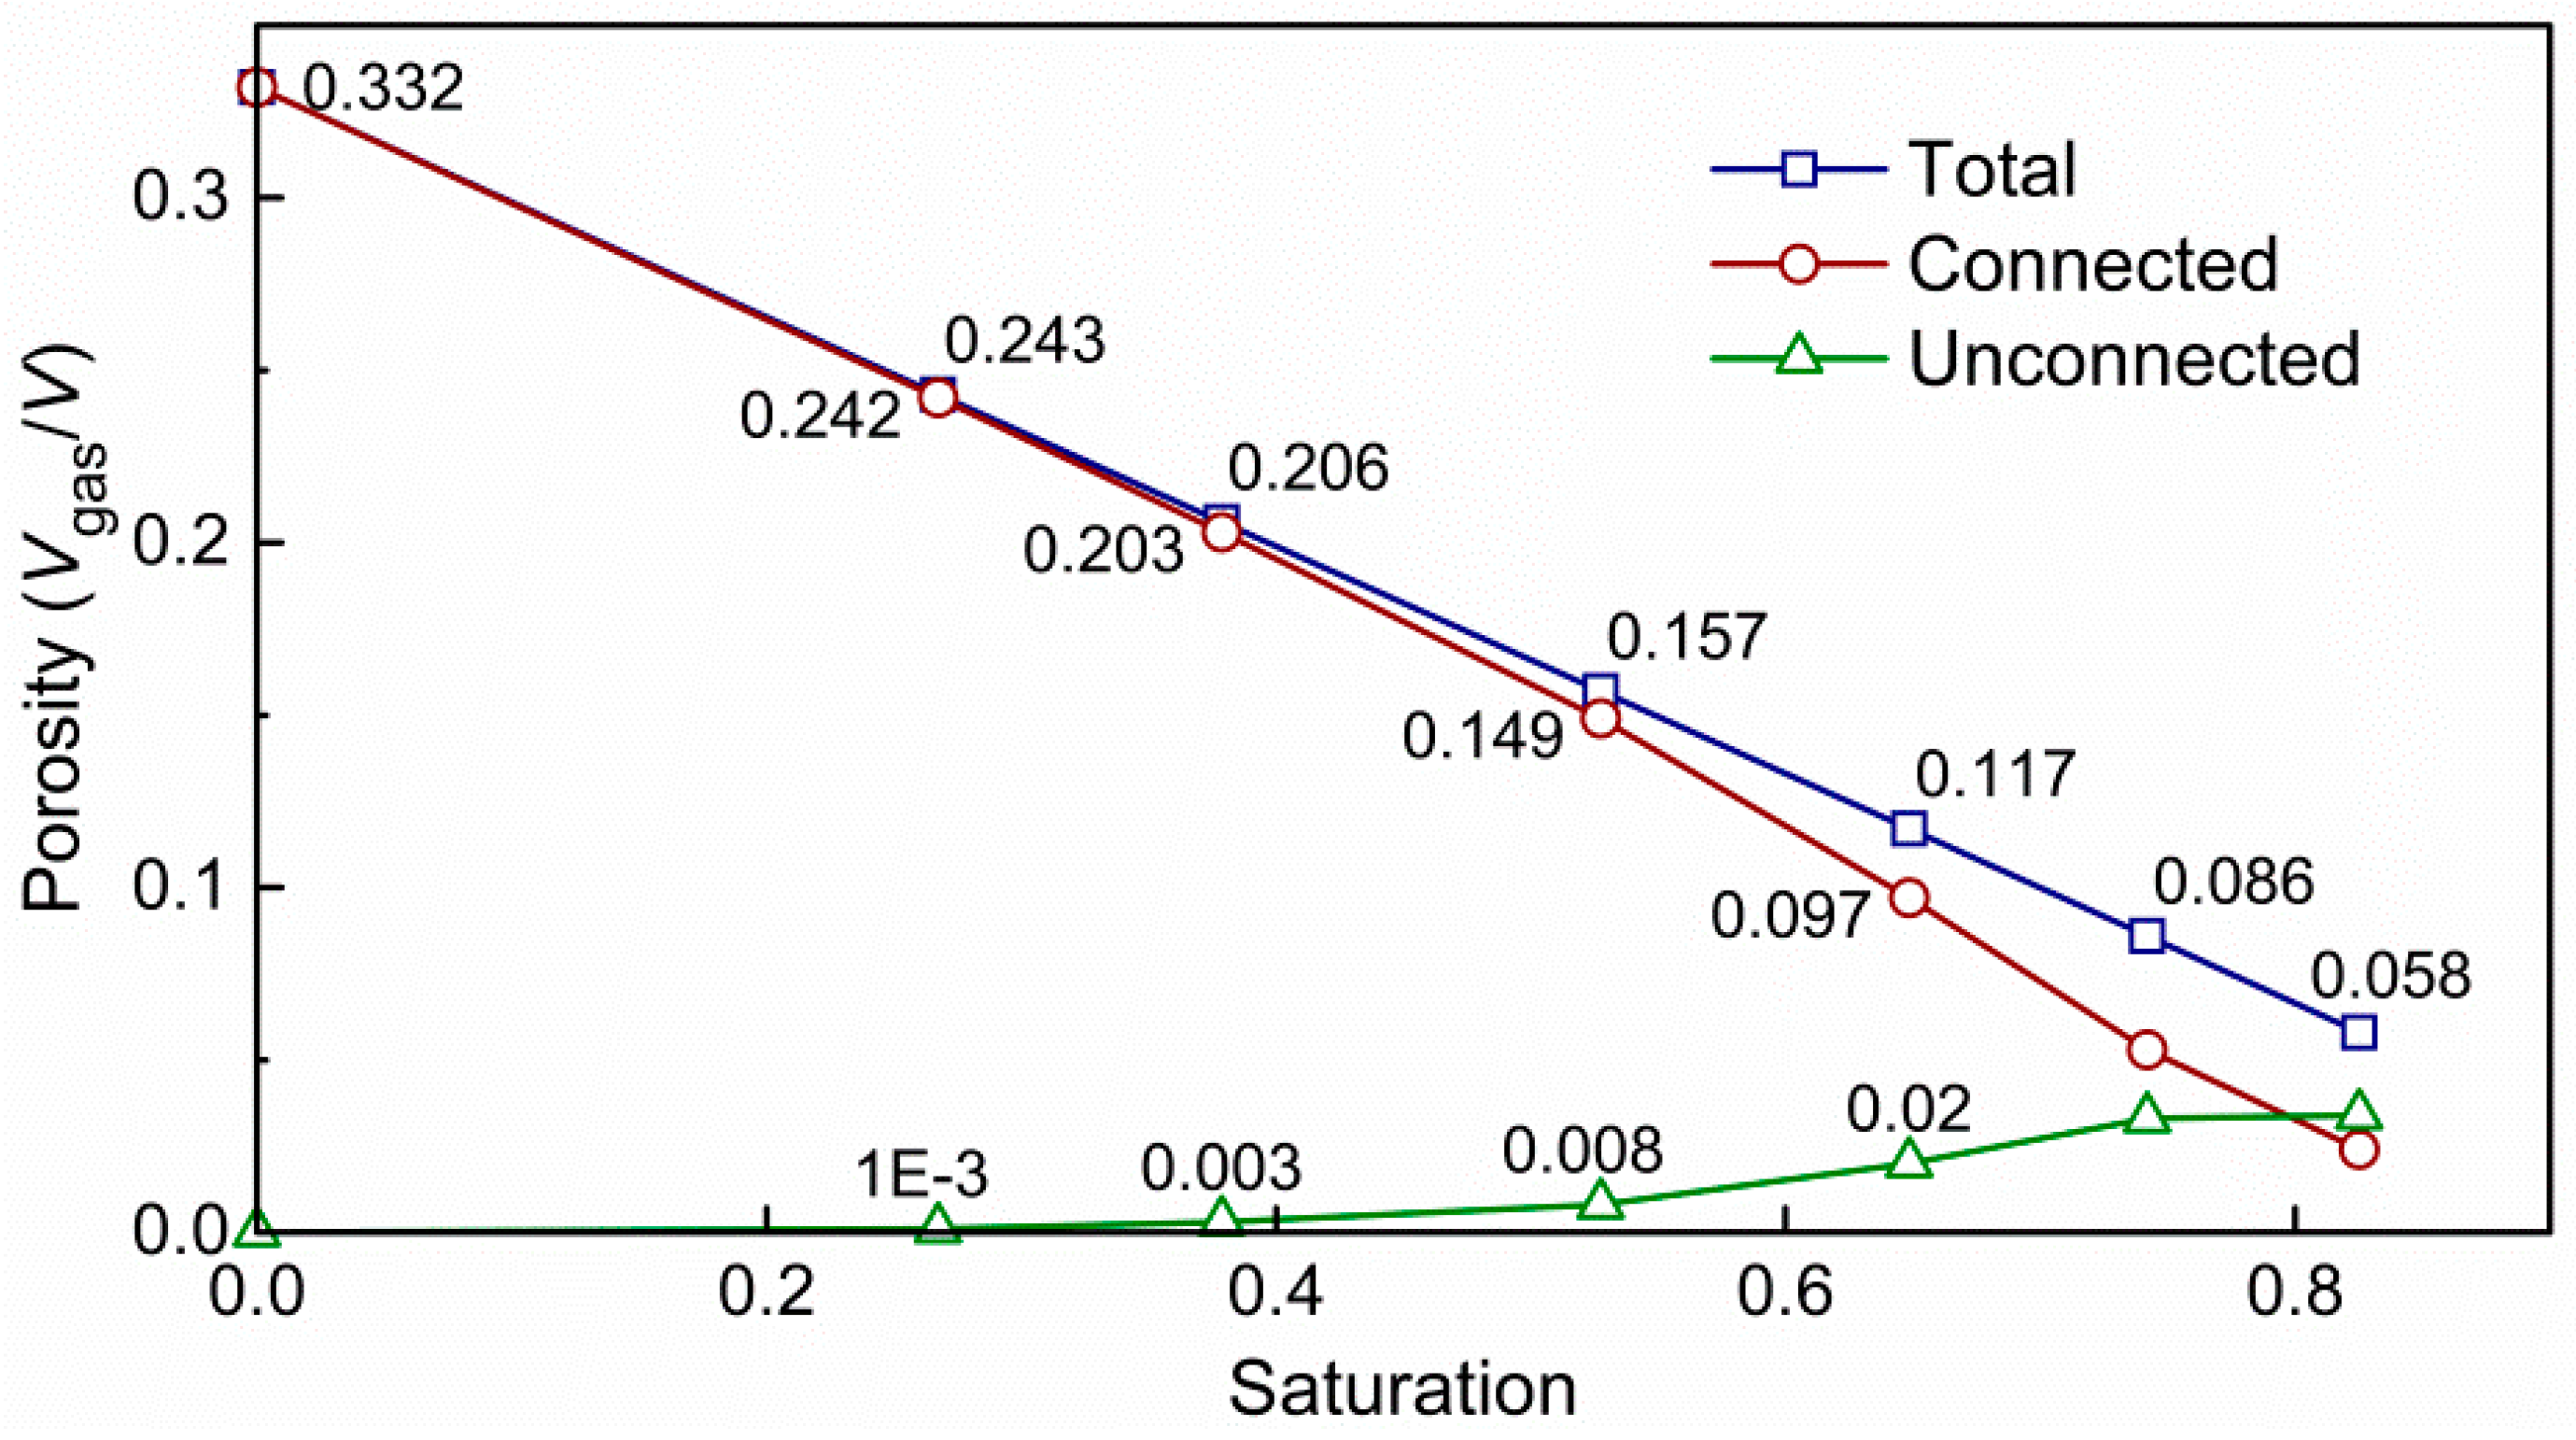
Figure 4.
Volume of pores for different diameters under various saturations: (a) Total pores. (b) Connected pores.
Figure 4.
Volume of pores for different diameters under various saturations: (a) Total pores. (b) Connected pores.
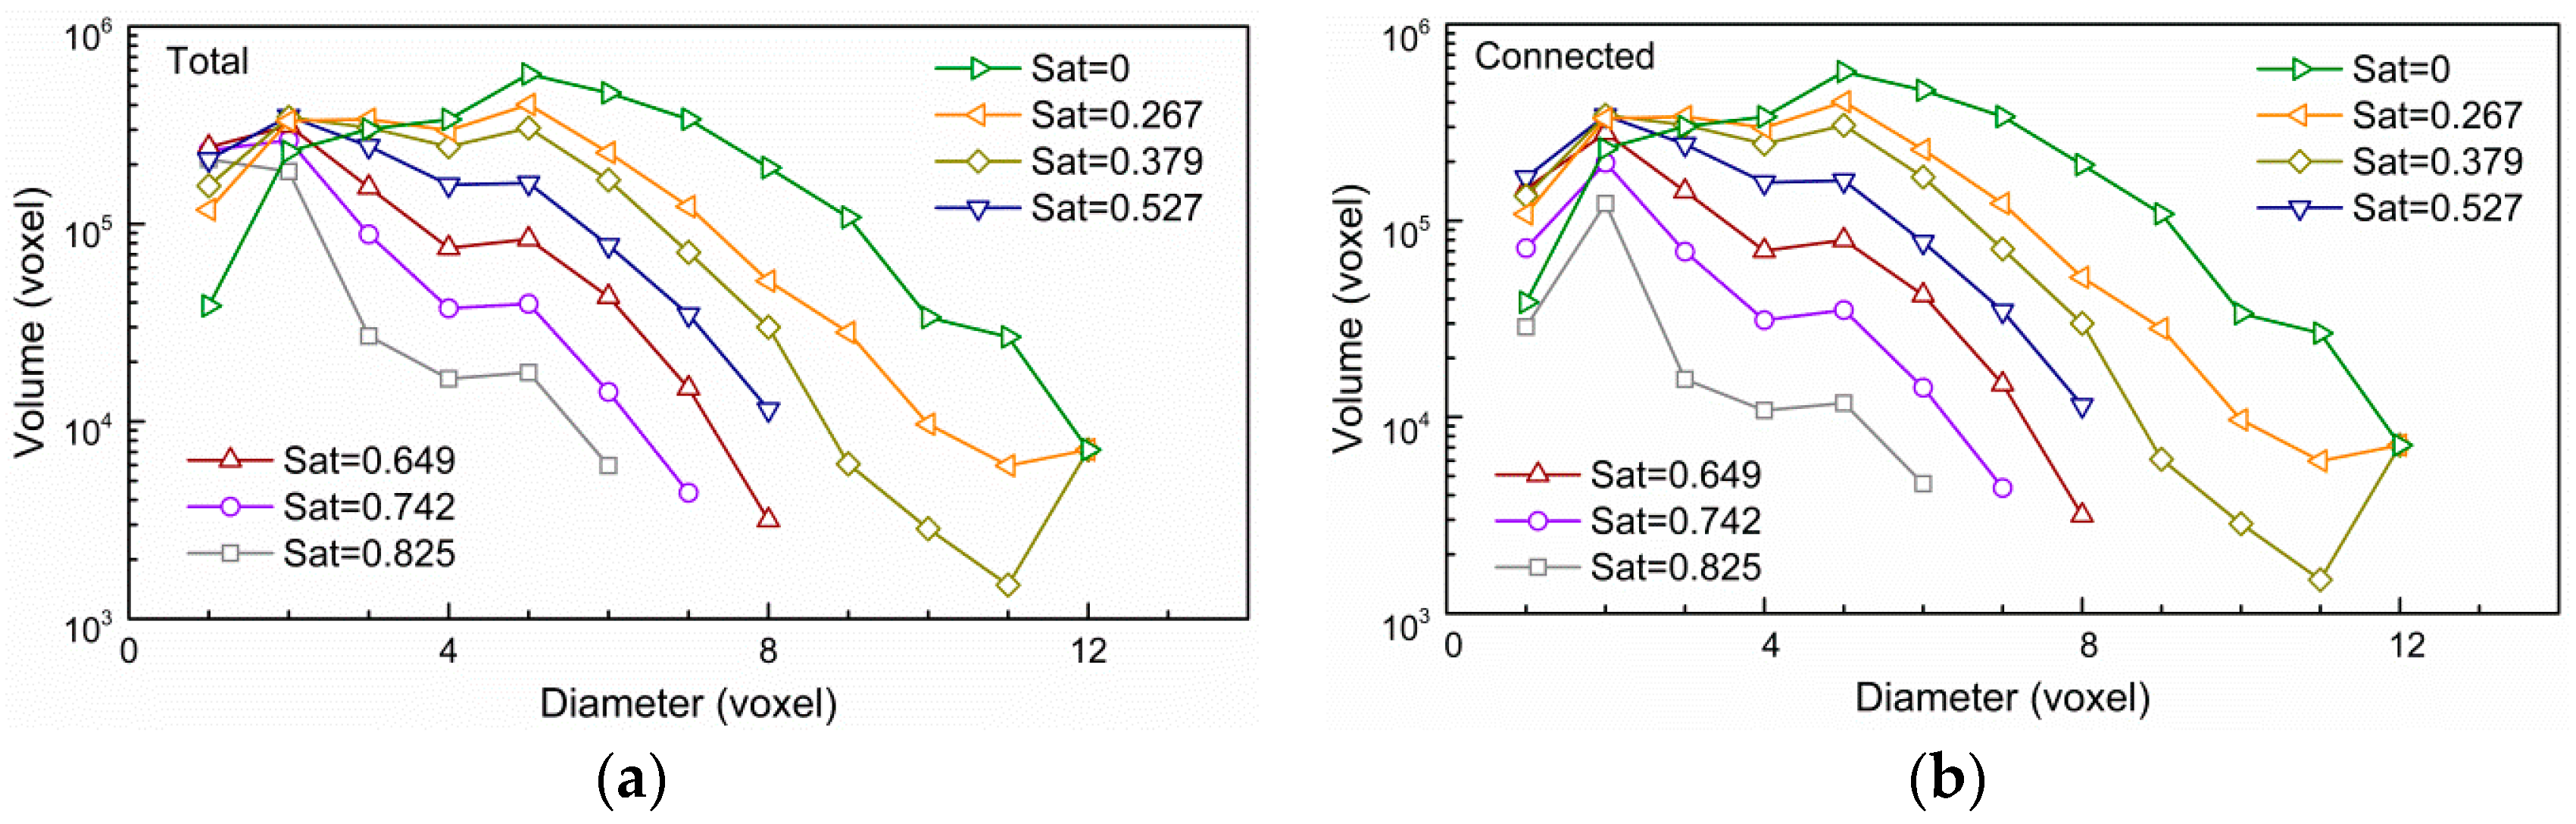
Figure 5.
Comparison between calculated mean pore diameter δ′ and that estimated by δ′ = α(1 − S)β. Here, δ′ is normalized by δ0 which is the mean pore diameter when water saturation is 0.
Figure 5.
Comparison between calculated mean pore diameter δ′ and that estimated by δ′ = α(1 − S)β. Here, δ′ is normalized by δ0 which is the mean pore diameter when water saturation is 0.

Figure 6.
The soil (sample 2) used for testing (a); the spatial distribution of soil pores (b); pore-size distribution (c).
Figure 6.
The soil (sample 2) used for testing (a); the spatial distribution of soil pores (b); pore-size distribution (c).
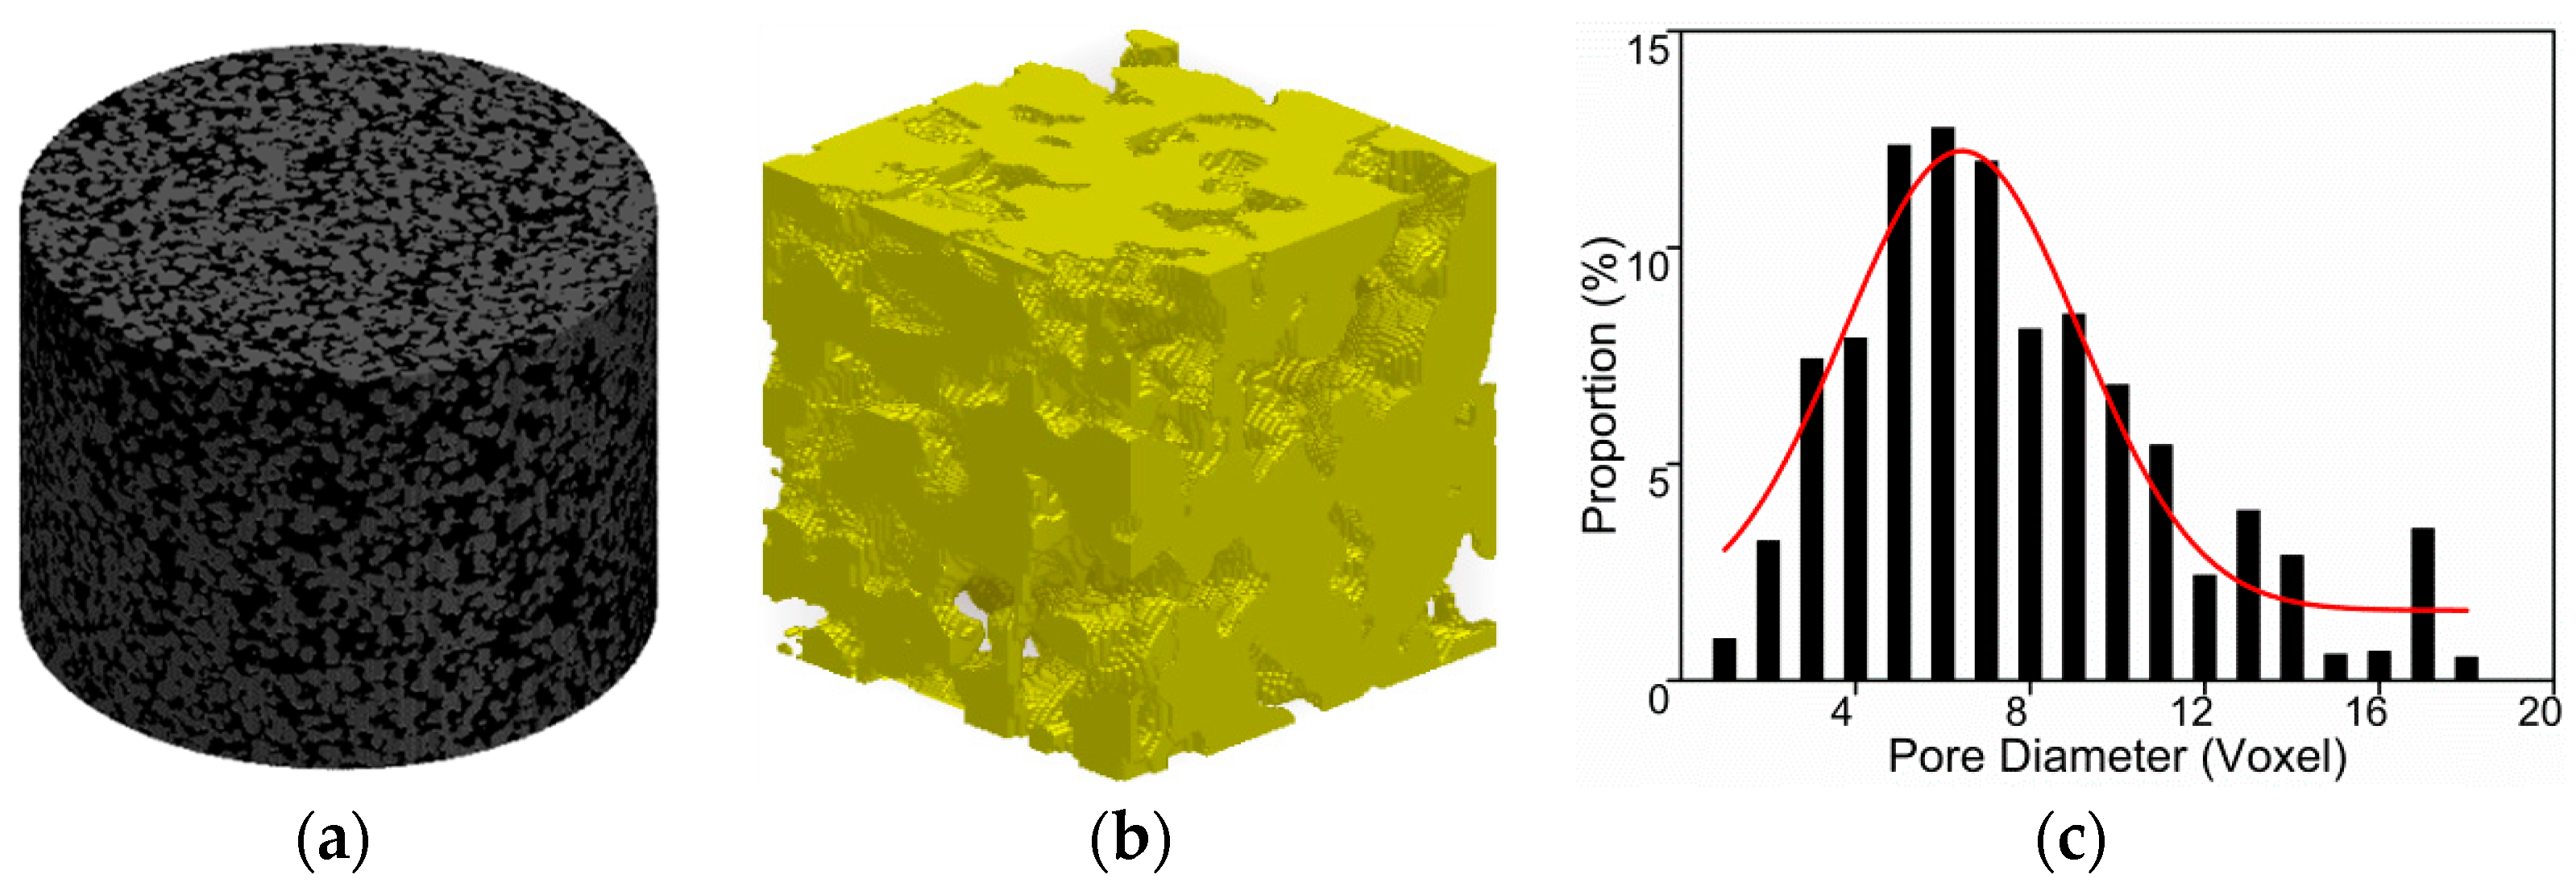
Figure 7.
Changes of interface areas A/A0 for water–solid, gas–water and gas–solid with water saturation.
Figure 7.
Changes of interface areas A/A0 for water–solid, gas–water and gas–solid with water saturation.
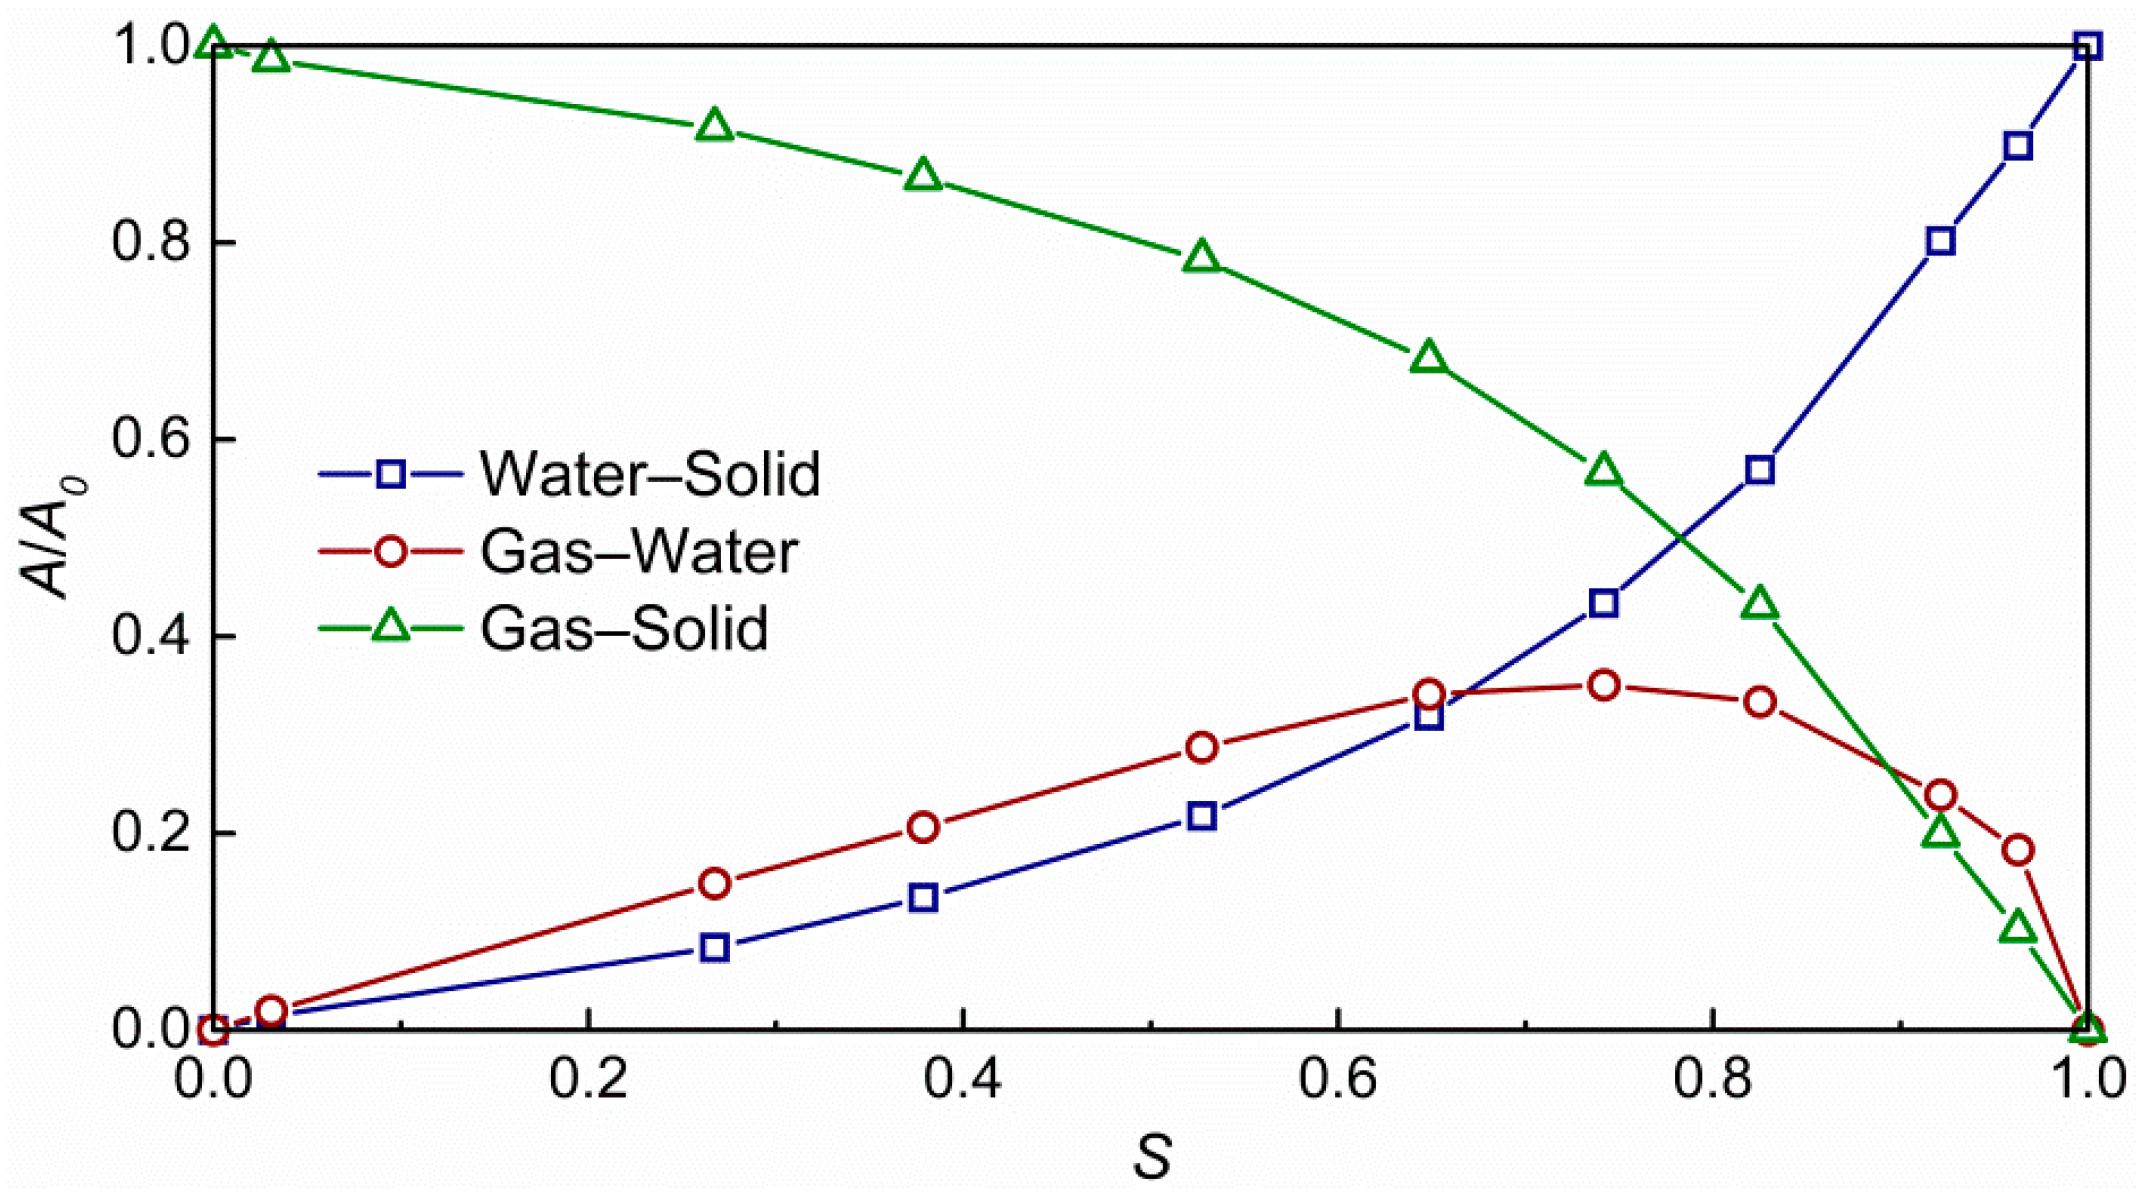
Figure 8.
Changes of effective diffusion coefficient Deff/d (solid line) of carbon dioxide under three saturations (0.825, 0.267 and 0) with mean pore diameter, compared with those of effective bulk diffusion coefficient Db/d (dotted) and effective Knudsen diffusion coefficient Dkn/d (short dash). The dark green, dark blue and dark red colors represent the saturation of 0, 0.267 and 0.825, respectively.

Figure 9.
(a) Oxygen diffusion in sample 1. (b) Oxygen diffusion in sample 2. (c) Methane diffusion in sample 1. (d) Hydrogen diffusion in sample 1.
Figure 9.
(a) Oxygen diffusion in sample 1. (b) Oxygen diffusion in sample 2. (c) Methane diffusion in sample 1. (d) Hydrogen diffusion in sample 1.

Figure 10.
The comparison between the normalized effective Knudsen diffusion coefficients calculated from pore-scale simulations with that estimated by Equation (7).
Figure 10.
The comparison between the normalized effective Knudsen diffusion coefficients calculated from pore-scale simulations with that estimated by Equation (7).
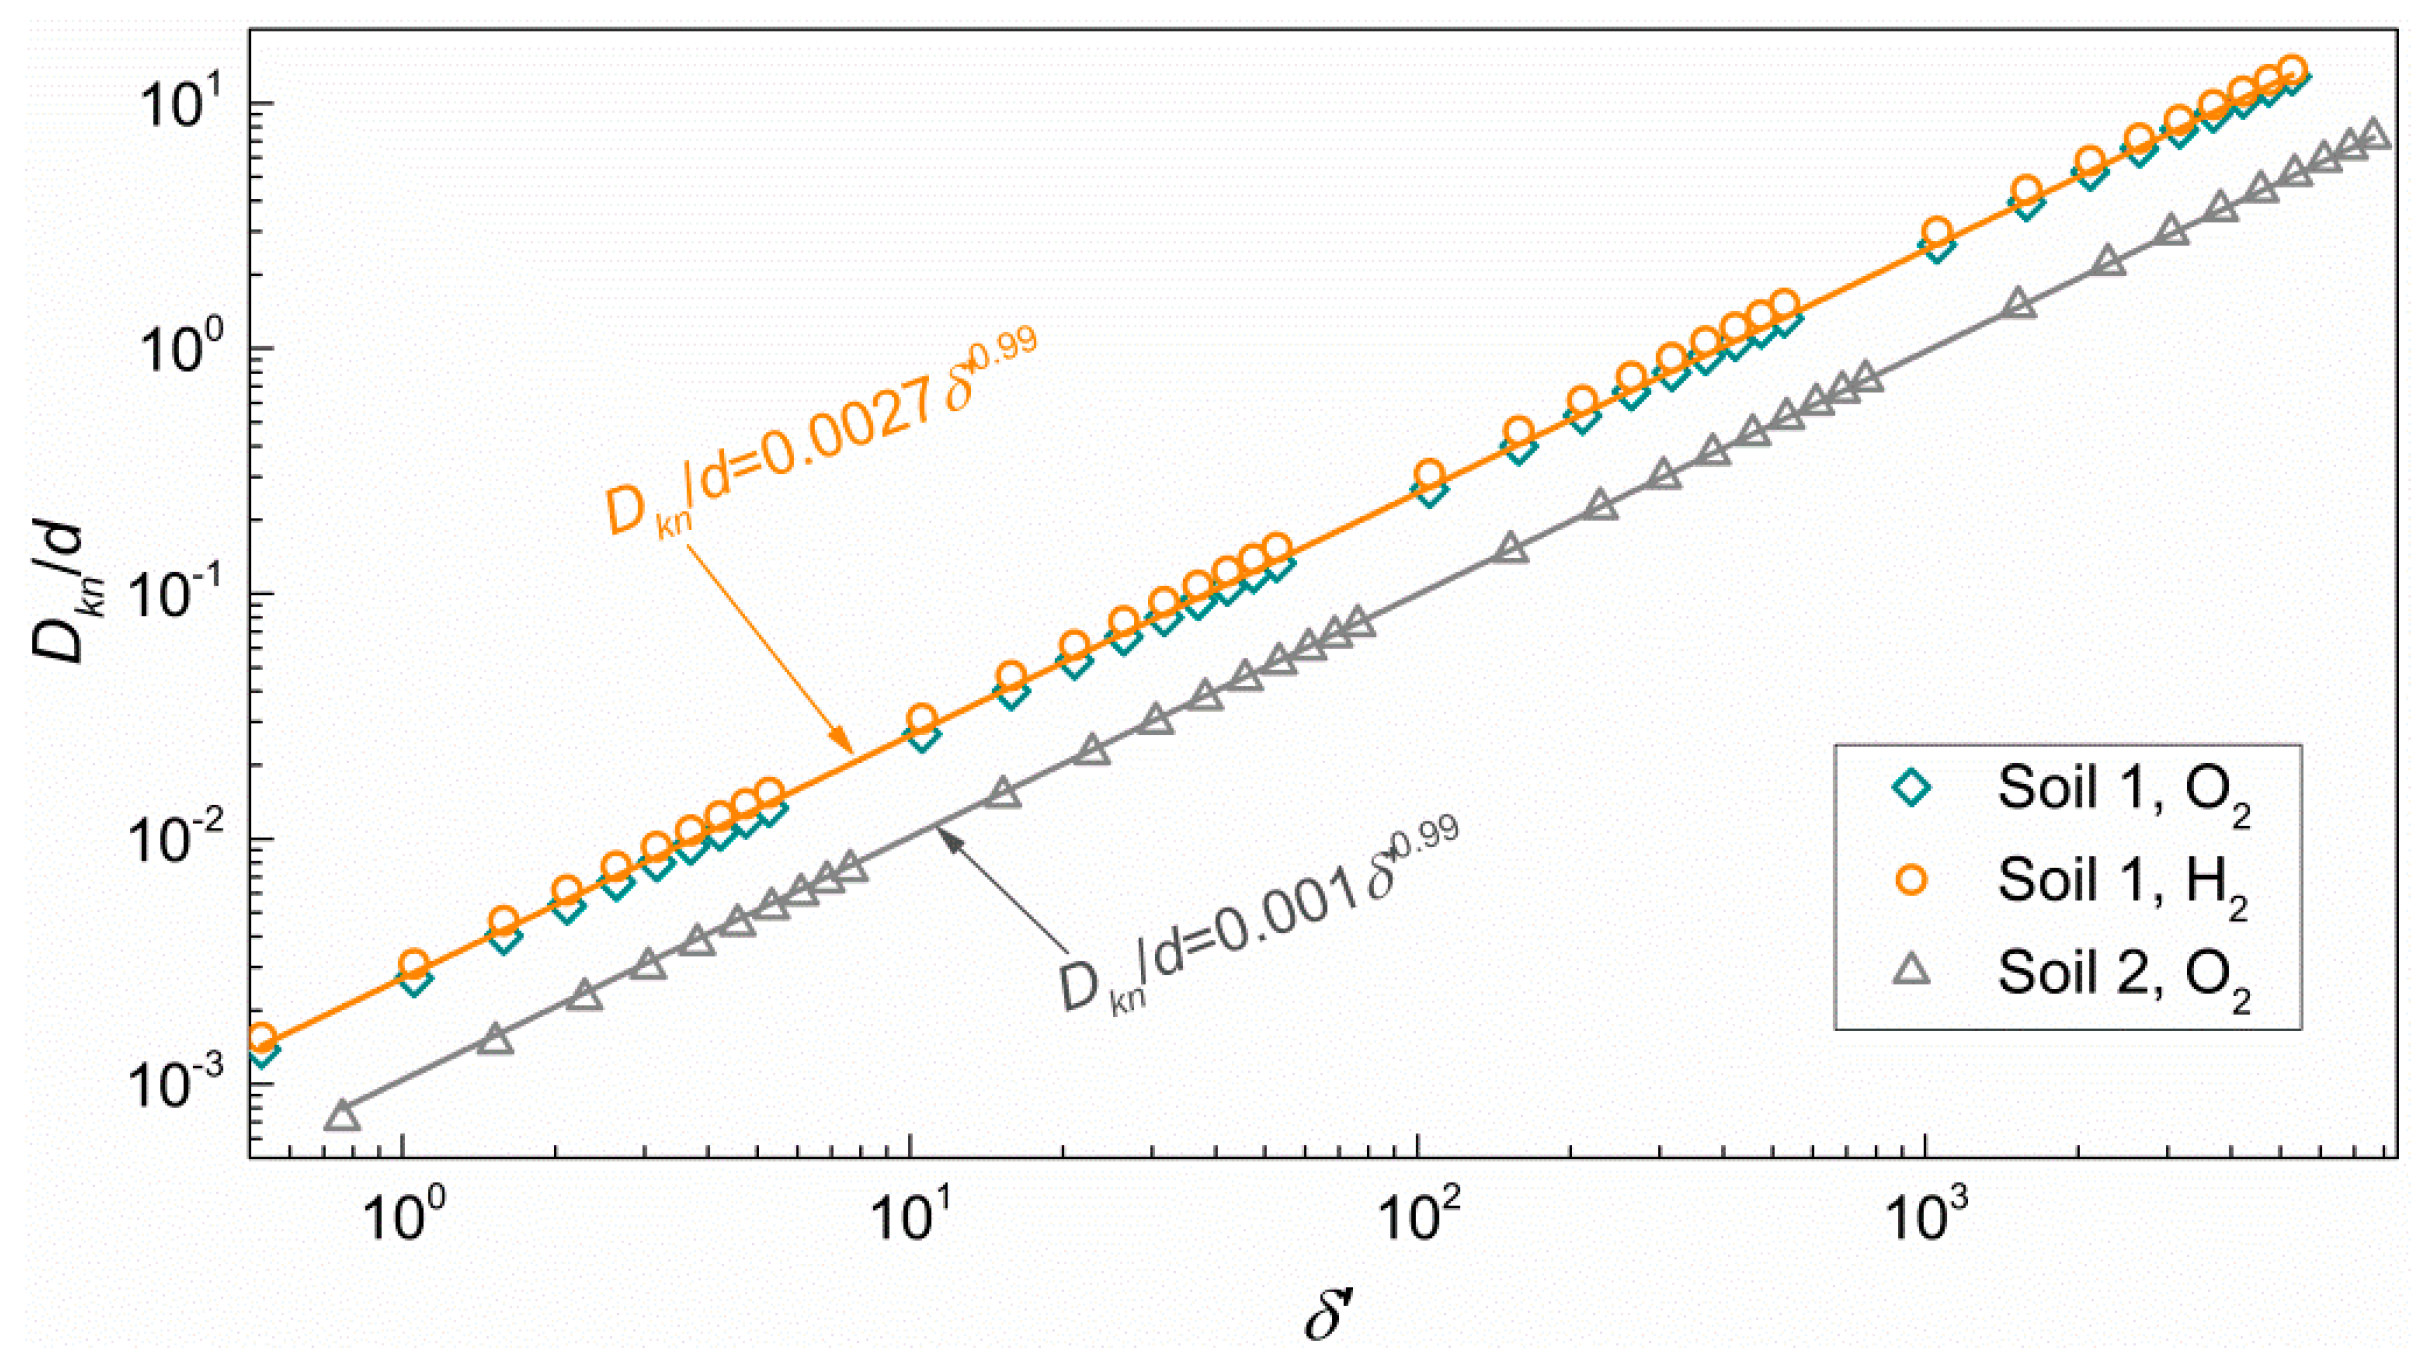
Figure 11.
Increase of the normalized effective diffusion coefficient with gas saturation follows a power law.
Figure 11.
Increase of the normalized effective diffusion coefficient with gas saturation follows a power law.

© 2018 by the authors. Licensee MDPI, Basel, Switzerland. This article is an open access article distributed under the terms and conditions of the Creative Commons Attribution (CC BY) license (http://creativecommons.org/licenses/by/4.0/).
Share and Cite
MDPI and ACS Style
Hu, W.; Jiang, Y.; Chen, D.; Lin, Y.; Han, Q.; Cui, Y. Impact of Pore Geometry and Water Saturation on Gas Effective Diffusion Coefficient in Soil. Appl. Sci. 2018, 8, 2097. https://doi.org/10.3390/app8112097
AMA Style
Hu W, Jiang Y, Chen D, Lin Y, Han Q, Cui Y. Impact of Pore Geometry and Water Saturation on Gas Effective Diffusion Coefficient in Soil. Applied Sciences. 2018; 8(11):2097. https://doi.org/10.3390/app8112097
Chicago/Turabian StyleHu, Wulong, Yao Jiang, Daoyi Chen, Yongshui Lin, Qiang Han, and Yifei Cui. 2018. "Impact of Pore Geometry and Water Saturation on Gas Effective Diffusion Coefficient in Soil" Applied Sciences 8, no. 11: 2097. https://doi.org/10.3390/app8112097
Note that from the first issue of 2016, this journal uses article numbers instead of page numbers. See further details here.