Impact of Combination Therapy with Ezetimibe/Simvastatin Treatment on the Neointimal Response to Biodegradable Polymer Biolimus-Eluting Stent Implantation in Patients with Acute Myocardial Infarction: Serial Assessment with Optical Coherence Tomography

 ,
,
Abstract
:1. Introduction
2. Methods
2.1. Study Design and Study Population
2.2. Interventional Procedures
2.3. Procedures for OCT Image Acquisition
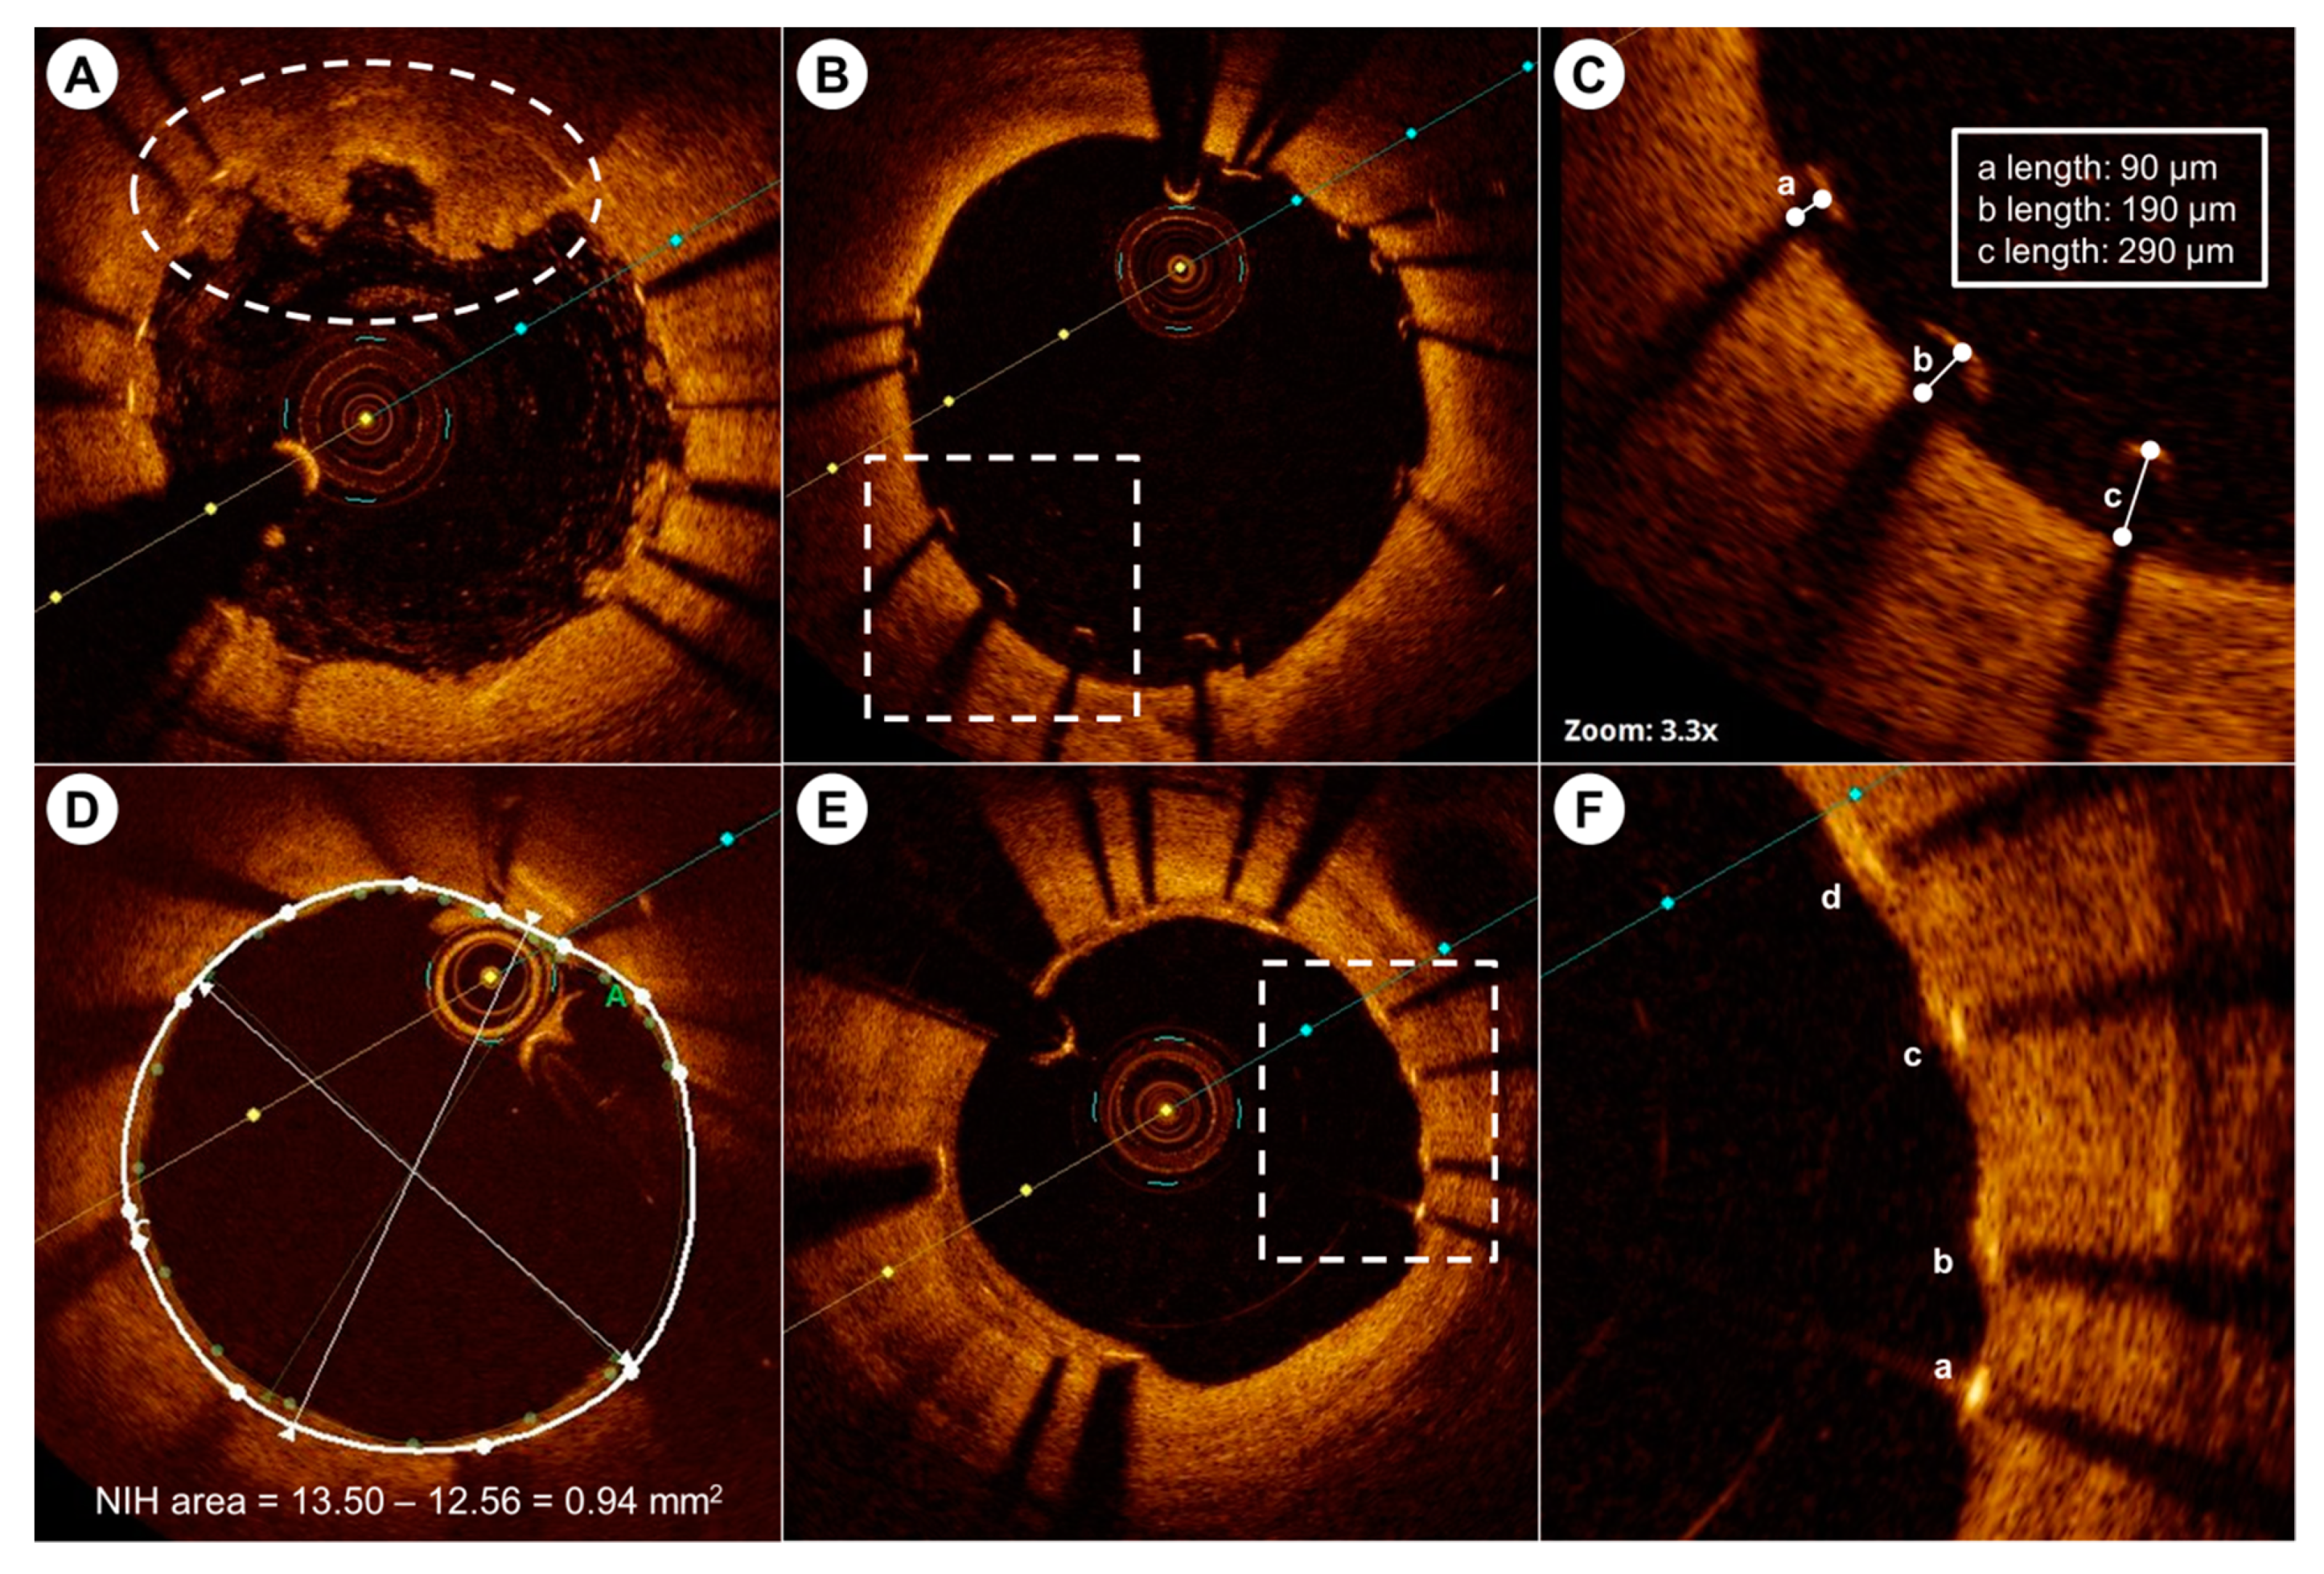
2.4. OCT Image Analysis
2.5. Study Endpoints
2.6. Statistical Analysis
3. Results
3.1. Statistical Analysis
3.2. Initial and Follow-Up Laboratory Findings
3.3. OCT Analysis at the Index Procedure and Follow-Up
4. Discussion
5. Conclusions
Author Contributions
Funding
Acknowledgments
Conflicts of Interest
References
- Fajadet, J.; Morice, M.C.; Bode, C.; Barragan, P.; Serruys, P.W.; Wijns, W.; Constantini, C.R.; Guermonprez, J.L.; Eltchaninoff, H.; Blanchard, D.; et al. Maintenance of long-term clinical benefit with sirolimus-eluting coronary stents: Three-year results of the RAVEL trial. Circulation 2005, 111, 1040–1044. [Google Scholar] [CrossRef] [PubMed]
- Ong, A.T.; van Domburg, R.T.; Aoki, J.; Sonnenschein, K.; Lemos, P.A.; Serruys, P.W. Sirolimus-eluting stents remain superior to bare-metal stents at two years: Medium-term results from the Rapamycin-Eluting Stent Evaluated at Rotterdam Cardiology Hospital (RESEARCH) registry. J. Am. Coll. Cardiol. 2006, 47, 1356–1360. [Google Scholar] [CrossRef] [PubMed]
- Takahashi, S.; Kaneda, H.; Tanaka, S.; Miyashita, Y.; Shiono, T.; Taketani, Y.; Domae, H.; Matsumi, J.; Mizuno, S.; Minami, Y.; et al. Late angiographic stent thrombosis after sirolimus-eluting stent implantation. Circ. J. 2007, 71, 226–228. [Google Scholar] [CrossRef] [PubMed]
- Kastrati, A.; Mehilli, J.; Pache, J.; Kaiser, C.; Valgimigli, M.; Kelbaek, H.; Menichelli, M.; Sabate, M.; Suttorp, M.J.; Baumgart, D.; et al. Analysis of 14 trials comparing sirolimus-eluting stents with bare-metal stents. N. Engl. J. Med. 2007, 356, 1030–1039. [Google Scholar] [CrossRef] [PubMed]
- Finn, A.V.; Kolodgie, F.D.; Harnek, J.; Guerrero, L.J.; Acampado, E.; Tefera, K.; Skorija, K.; Weber, D.K.; Gold, H.K.; Virmani, R. Differential response of delayed healing and persistent inflammation at sites of overlapping sirolimus- or paclitaxel-eluting stents. Circulation 2005, 112, 270–278. [Google Scholar] [CrossRef] [PubMed]
- Finn, A.V.; Joner, M.; Nakazawa, G.; Kolodgie, F.; Newell, J.; John, M.C.; Gold, H.K.; Virmani, R. Pathological correlates of late drug-eluting stent thrombosis: Strut coverage as a marker of endothelialization. Circulation 2007, 115, 2435–2441. [Google Scholar] [CrossRef]
- Taniwaki, M.; Radu, M.D.; Zaugg, S.; Amabile, N.; Garcia-Garcia, H.M.; Yamaji, K.; Jorgensen, E.; Kelbaek, H.; Pilgrim, T.; Caussin, C.; et al. Mechanisms of Very Late Drug-Eluting Stent Thrombosis Assessed by Optical Coherence Tomography. Circulation 2016, 133, 650–660. [Google Scholar] [CrossRef] [PubMed]
- Adriaenssens, T.; Joner, M.; Godschalk, T.C.; Malik, N.; Alfonso, F.; Xhepa, E.; De Cock, D.; Komukai, K.; Tada, T.; Cuesta, J.; et al. Optical Coherence Tomography Findings in Patients With Coronary Stent Thrombosis: A Report of the PRESTIGE Consortium (Prevention of Late Stent Thrombosis by an Interdisciplinary Global European Effort). Circulation 2017, 136, 1007–1021. [Google Scholar] [CrossRef] [PubMed]
- Cannon, C.P.; Blazing, M.A.; Giugliano, R.P.; McCagg, A.; White, J.A.; Theroux, P.; Darius, H.; Lewis, B.S.; Ophuis, T.O.; Jukema, J.W.; et al. Ezetimibe Added to Statin Therapy after Acute Coronary Syndromes. N. Engl. J. Med. 2015, 372, 2387–2397. [Google Scholar] [CrossRef] [PubMed]
- Catapano, A.L.; Graham, I.; De Backer, G.; Wiklund, O.; Chapman, M.J.; Drexel, H.; Hoes, A.W.; Jennings, C.S.; Landmesser, U.; Pedersen, T.R.; et al. 2016 ESC/EAS Guidelines for the Management of Dyslipidaemias. Eur. Heart J. 2016, 37, 2999–3058. [Google Scholar] [CrossRef] [PubMed] [Green Version]
- Lloyd-Jones, D.M.; Morris, P.B.; Ballantyne, C.M.; Birtcher, K.K.; Daly, D.D., Jr.; DePalma, S.M.; Minissian, M.B.; Orringer, C.E.; Smith, S.C., Jr. 2017 Focused Update of the 2016 ACC Expert Consensus Decision Pathway on the Role of Non-Statin Therapies for LDL-Cholesterol Lowering in the Management of Atherosclerotic Cardiovascular Disease Risk: A Report of the American College of Cardiology Task Force on Expert Consensus Decision Pathways. J. Am. Coll. Cardiol. 2017, 70, 1785–1822. [Google Scholar] [CrossRef] [PubMed]
- Grube, E.; Buellesfeld, L. BioMatrix Biolimus A9-eluting coronary stent: A next-generation drug-eluting stent for coronary artery disease. Expert Rev. Med. Devices 2006, 3, 731–741. [Google Scholar] [CrossRef] [PubMed]
- Huang, D.; Swanson, E.A.; Lin, C.P.; Schuman, J.S.; Stinson, W.G.; Chang, W.; Hee, M.R.; Flotte, T.; Gregory, K.; Puliafito, C.A.; et al. Optical coherence tomography. Science 1991, 254, 1178–1181. [Google Scholar] [CrossRef] [PubMed] [Green Version]
- Choma, M.; Sarunic, M.; Yang, C.; Izatt, J. Sensitivity advantage of swept source and Fourier domain optical coherence tomography. Opt. Express 2003, 11, 2183–2189. [Google Scholar] [CrossRef] [PubMed] [Green Version]
- Kim, Y.; Johnson, T.W.; Akasaka, T.; Jeong, M.H. The role of optical coherence tomography in the setting of acute myocardial infarction. J. Cardiol. 2018, 72, 186–192. [Google Scholar] [CrossRef] [PubMed]
- Kim, Y.; Deharo, P.; Adlam, D.; Baumbach, A.; Johnson, T.W. The role of optical coherence tomography in decision making during the acute phase of spontaneous coronary artery dissection. Int. J. Cardiol. Heart Vasc. 2017, 14, 6–7. [Google Scholar] [CrossRef] [PubMed]
- Kim, Y.; Gnanadesigan, M.; van Soest, G.; Johnson, T.W. A new technique for lipid core plaque detection by optical coherence tomography for prevention of peri-procedural myocardial infarction: A case report. Medicine 2017, 96, e7125. [Google Scholar] [CrossRef] [PubMed]
- Kim, Y.; Jeong, M.H.; Kim, M.C.; Sim, D.S.; Hong, Y.J.; Kim, J.H.; Ahn, Y. Assessment for ambiguous angiographic finding in patient with acute myocardial infarction by optical coherence tomography. Cardiol. J. 2018, 25, 536–537. [Google Scholar] [CrossRef] [PubMed]
- Kim, Y.; Jeong, M.H.; Kim, M.C.; Sim, D.S.; Hong, Y.J.; Kim, J.H.; Ahn, Y. Very late stent thrombosis derived from thin-cap neoatheroma and fibroatheroma with plaque rupture assessed by optical coherence tomography. Cardiol. J. 2017, 24, 704–705. [Google Scholar] [CrossRef] [PubMed] [Green Version]
- Tearney, G.J.; Regar, E.; Akasaka, T.; Adriaenssens, T.; Barlis, P.; Bezerra, H.G.; Bouma, B.; Bruining, N.; Cho, J.M.; Chowdhary, S.; et al. Consensus standards for acquisition, measurement, and reporting of intravascular optical coherence tomography studies: A report from the International Working Group for Intravascular Optical Coherence Tomography Standardization and Validation. J. Am. Coll. Cardiol. 2012, 59, 1058–1072. [Google Scholar] [CrossRef] [PubMed] [Green Version]
- Nakatani, S.; Sotomi, Y.; Ishibashi, Y.; Grundeken, M.J.; Tateishi, H.; Tenekecioglu, E.; Zeng, Y.; Suwannasom, P.; Regar, E.; Radu, M.D.; et al. Comparative analysis method of permanent metallic stents (XIENCE) and bioresorbable poly-L-lactic (PLLA) scaffolds (Absorb) on optical coherence tomography at baseline and follow-up. EuroIntervention 2016, 12, 1498–1509. [Google Scholar] [CrossRef] [PubMed]
- Barlis, P.; Regar, E.; Serruys, P.W.; Dimopoulos, K.; van der Giessen, W.J.; van Geuns, R.J.; Ferrante, G.; Wandel, S.; Windecker, S.; van Es, G.A.; et al. An optical coherence tomography study of a biodegradable vs. durable polymer-coated limus-eluting stent: A LEADERS trial sub-study. Eur. Heart J. 2010, 31, 165–176. [Google Scholar] [CrossRef] [PubMed]
- Gutierrez-Chico, J.L.; Juni, P.; Garcia-Garcia, H.M.; Regar, E.; Nuesch, E.; Borgia, F.; van der Giessen, W.J.; Davies, S.; van Geuns, R.J.; Secco, G.G.; et al. Long-term tissue coverage of a biodegradable polylactide polymer-coated biolimus-eluting stent: Comparative sequential assessment with optical coherence tomography until complete resorption of the polymer. Am. Heart J. 2011, 162, 922–931. [Google Scholar] [CrossRef] [PubMed]
- Kala, P.; Cervinka, P.; Jakl, M.; Kanovsky, J.; Kupec, A.; Spacek, R.; Kvasnak, M.; Poloczek, M.; Cervinkova, M.; Bezerra, H.; et al. OCT guidance during stent implantation in primary PCI: A randomized multicenter study with nine months of optical coherence tomography follow-up. Int. J. Cardiol. 2018, 250, 98–103. [Google Scholar] [CrossRef] [PubMed]
- Souteyrand, G.; Amabile, N.; Mangin, L.; Chabin, X.; Meneveau, N.; Cayla, G.; Vanzetto, G.; Barnay, P.; Trouillet, C.; Rioufol, G.; et al. Mechanisms of stent thrombosis analysed by optical coherence tomography: Insights from the national PESTO French registry. Eur. Heart J. 2016, 37, 1208–1216. [Google Scholar] [CrossRef] [PubMed]
- Stefanini, G.G.; Kalesan, B.; Serruys, P.W.; Heg, D.; Buszman, P.; Linke, A.; Ischinger, T.; Klauss, V.; Eberli, F.; Wijns, W.; et al. Long-term clinical outcomes of biodegradable polymer biolimus-eluting stents versus durable polymer sirolimus-eluting stents in patients with coronary artery disease (LEADERS): 4 year follow-up of a randomised non-inferiority trial. Lancet 2011, 378, 1940–1948. [Google Scholar] [CrossRef] [Green Version]
- Gutierrez-Chico, J.L.; van Geuns, R.J.; Regar, E.; van der Giessen, W.J.; Kelbaek, H.; Saunamaki, K.; Escaned, J.; Gonzalo, N.; di Mario, C.; Borgia, F.; et al. Tissue coverage of a hydrophilic polymer-coated zotarolimus-eluting stent vs. a fluoropolymer-coated everolimus-eluting stent at 13-month follow-up: An optical coherence tomography substudy from the RESOLUTE All Comers trial. Eur. Heart J. 2011, 32, 2454–2463. [Google Scholar] [CrossRef] [PubMed]
- Kim, J.S.; Kim, B.K.; Jang, I.K.; Shin, D.H.; Ko, Y.G.; Choi, D.; Hong, M.K.; Cho, Y.K.; Nam, C.W.; Hur, S.H.; et al. Comparison of neointimal coverage between zotarolimus-eluting stent and everolimus-eluting stent using Optical Coherence Tomography (COVER OCT). Am. Heart J. 2012, 163, 601–607. [Google Scholar] [CrossRef] [PubMed]


| Variables | Vytorin 10/10 mg (n = 9) | Vytorin 10/40 mg (n = 9) | p Value |
|---|---|---|---|
| Demographic | |||
| Age, mean ± SD, y | 57.0 (8.3) | 63.4 (11.5) | 0.222 |
| Male | 8 (88.9) | 7 (77.8) | 0.527 |
| Cardiovascular risk factors | |||
| Hypertension | 3 (33.3) | 6 (66.7) | 0.157 |
| Diabetes mellitus | 2 (22.2) | 4 (44.4) | 0.317 |
| Current smoking | 7 (77.8) | 4 (44.4) | 0.147 |
| STEMI | 4 (44.4) | 2 (22.2) | 0.317 |
| Culprit lesion | 0.513 | ||
| LAD | 5 (55.6) | 7 (77.8) | |
| LCx | 1 (11.1) | 1 (11.1) | |
| RCA | 3 (33.3) | 1 (11.1) | |
| Baseline QCA data, mean ± SD | |||
| Reference vessel diameter, mm | 3.40 ± 0.42 | 3.37 ± 0.38 | 0.931 |
| Minimum lumen diameter, mm | 0.12 ± 0.13 | 0.23 ± 0.21 | 0.297 |
| Diameter stenosis, % | 96.7 ± 3.5 | 92.8 ± 6.7 | 0.222 |
| Implanted stent, median (IQR) | |||
| No. of stents | 1.0 (1.0–1.0) | 1.0 (1.0–1.0) | 0.730 |
| Stent diameter, mm | 3.5 (3.0–3.6) | 3.5 (3.3–3.5) | 1.000 |
| Stent length, mm | 24 (18–28) | 18 (18–26) | 0.340 |
| Medication at discharge | |||
| Aspirin | 9 (100) | 9 (100) | |
| Clopidogrel | 1 (11.1) | 3 (33.3) | 0.257 |
| Ticagrelor | 4 (44.4) | 4 (44.4) | |
| Prasugrel | 4 (44.4) | 2 (22.2) | 0.317 |
| ACEi/ARB | 8 (88.9) | 9 (100) | 0.303 |
| Beta-blocker | 7 (77.8) | 7 (77.8) |
| Laboratory Findings | Vytorin 10/10 mg (n = 9) | Vytorin 10/40 mg (n = 9) | p Value |
|---|---|---|---|
| Total cholesterol, mg/dL | 184 (160–223) | 174 (145–206) | 0.605 |
| Triglyceride, mg/dL | 103 (75–178) | 112 (78–162) | 0.931 |
| HDL-cholesterol, mg/dL | 33 (30–35) | 40 (35–49) | 0.014 |
| LDL-cholesterol, mg/dL | 123 (88–143) | 122 (85–138) | 0.730 |
| Apolipoprotein B, mg/dL | 89 (82–107) | 97 (0.8–1.1) | 0.340 |
| Apolipoprotein A1, mg/dL | 114 (105–119) | 126 (114–135) | 0.040 |
| Apolipoprotein B/Apo A1 | 0.74 (0.72–0.93) | 0.79 (0.66–0.91) | 0.666 |
| hsCRP, mg/dl | 0.50 (0.43–0.72) | 0.61 (0.14–1.20) | 0.863 |
| Peak CK-MB, ng/ml | 54 (12–154) | 21 (10–189) | 0.387 |
| Peak troponin-I, ng/ml | 12.1 (8.8–47.3) | 9.3 (4.8–40) | 0.546 |
| Laboratory Finding | Vytorin 10/10 mg (n = 9) | Vytorin 10/40 mg (n = 9) | p Value |
|---|---|---|---|
| Total cholesterol, mg/dL | 126 (106–151) | 117 (95–133) | 0.387 |
| Triglyceride, mg/dL | 178 (137–414) | 112 (59–137) | 0.008 |
| HDL-cholesterol, mg/dL | 33 (27–37) | 44 (40–47) | 0.004 |
| LDL-cholesterol, mg/dL | 61 (53–70) | 55 (41–75) | 0.489 |
| Δ LDL-cholesterol, mg/dL | 55.7 ± 25.0 | 61.7 ± 22.6 | 0.605 |
| Degree of change of LDL-cholesterol, % | 46.0 ± 10.7 | 50.5 ± 13.7 | 0.387 |
| Variables | OCT Analysis Immediately after PCI | Follow-Up OCT Analysis | ||||
|---|---|---|---|---|---|---|
| Vytorin 10/10 mg (n = 9) | Vytorin 10/40 mg (n = 9) | p Value | Vytorin 10/10 mg (n = 9) | Vytorin 10/40 mg (n = 9) | p Value | |
| Time interval to OCT (month) | 12.3 ± 4.4 | 17.6 ± 11.6 | 0.489 | |||
| Number of total cross sections | 222 | 208 | 200 | 212 | ||
| Analysis of all cross sections | ||||||
| Number of total struts | 2251 | 2077 | 2101 | 2123 | ||
| Mean lumen area (mm2) | 8.17 ± 2.39 | 8.49 ± 2.28 | 0.666 | 9.11 ± 3.36 | 8.43 ± 2.03 | 0.863 |
| Mean stent area (mm2) | 8.40 ± 2.47 | 8.50 ± 1.98 | 0.730 | 9.75 ± 3.62 | 9.01 ± 1.99 | 0.730 |
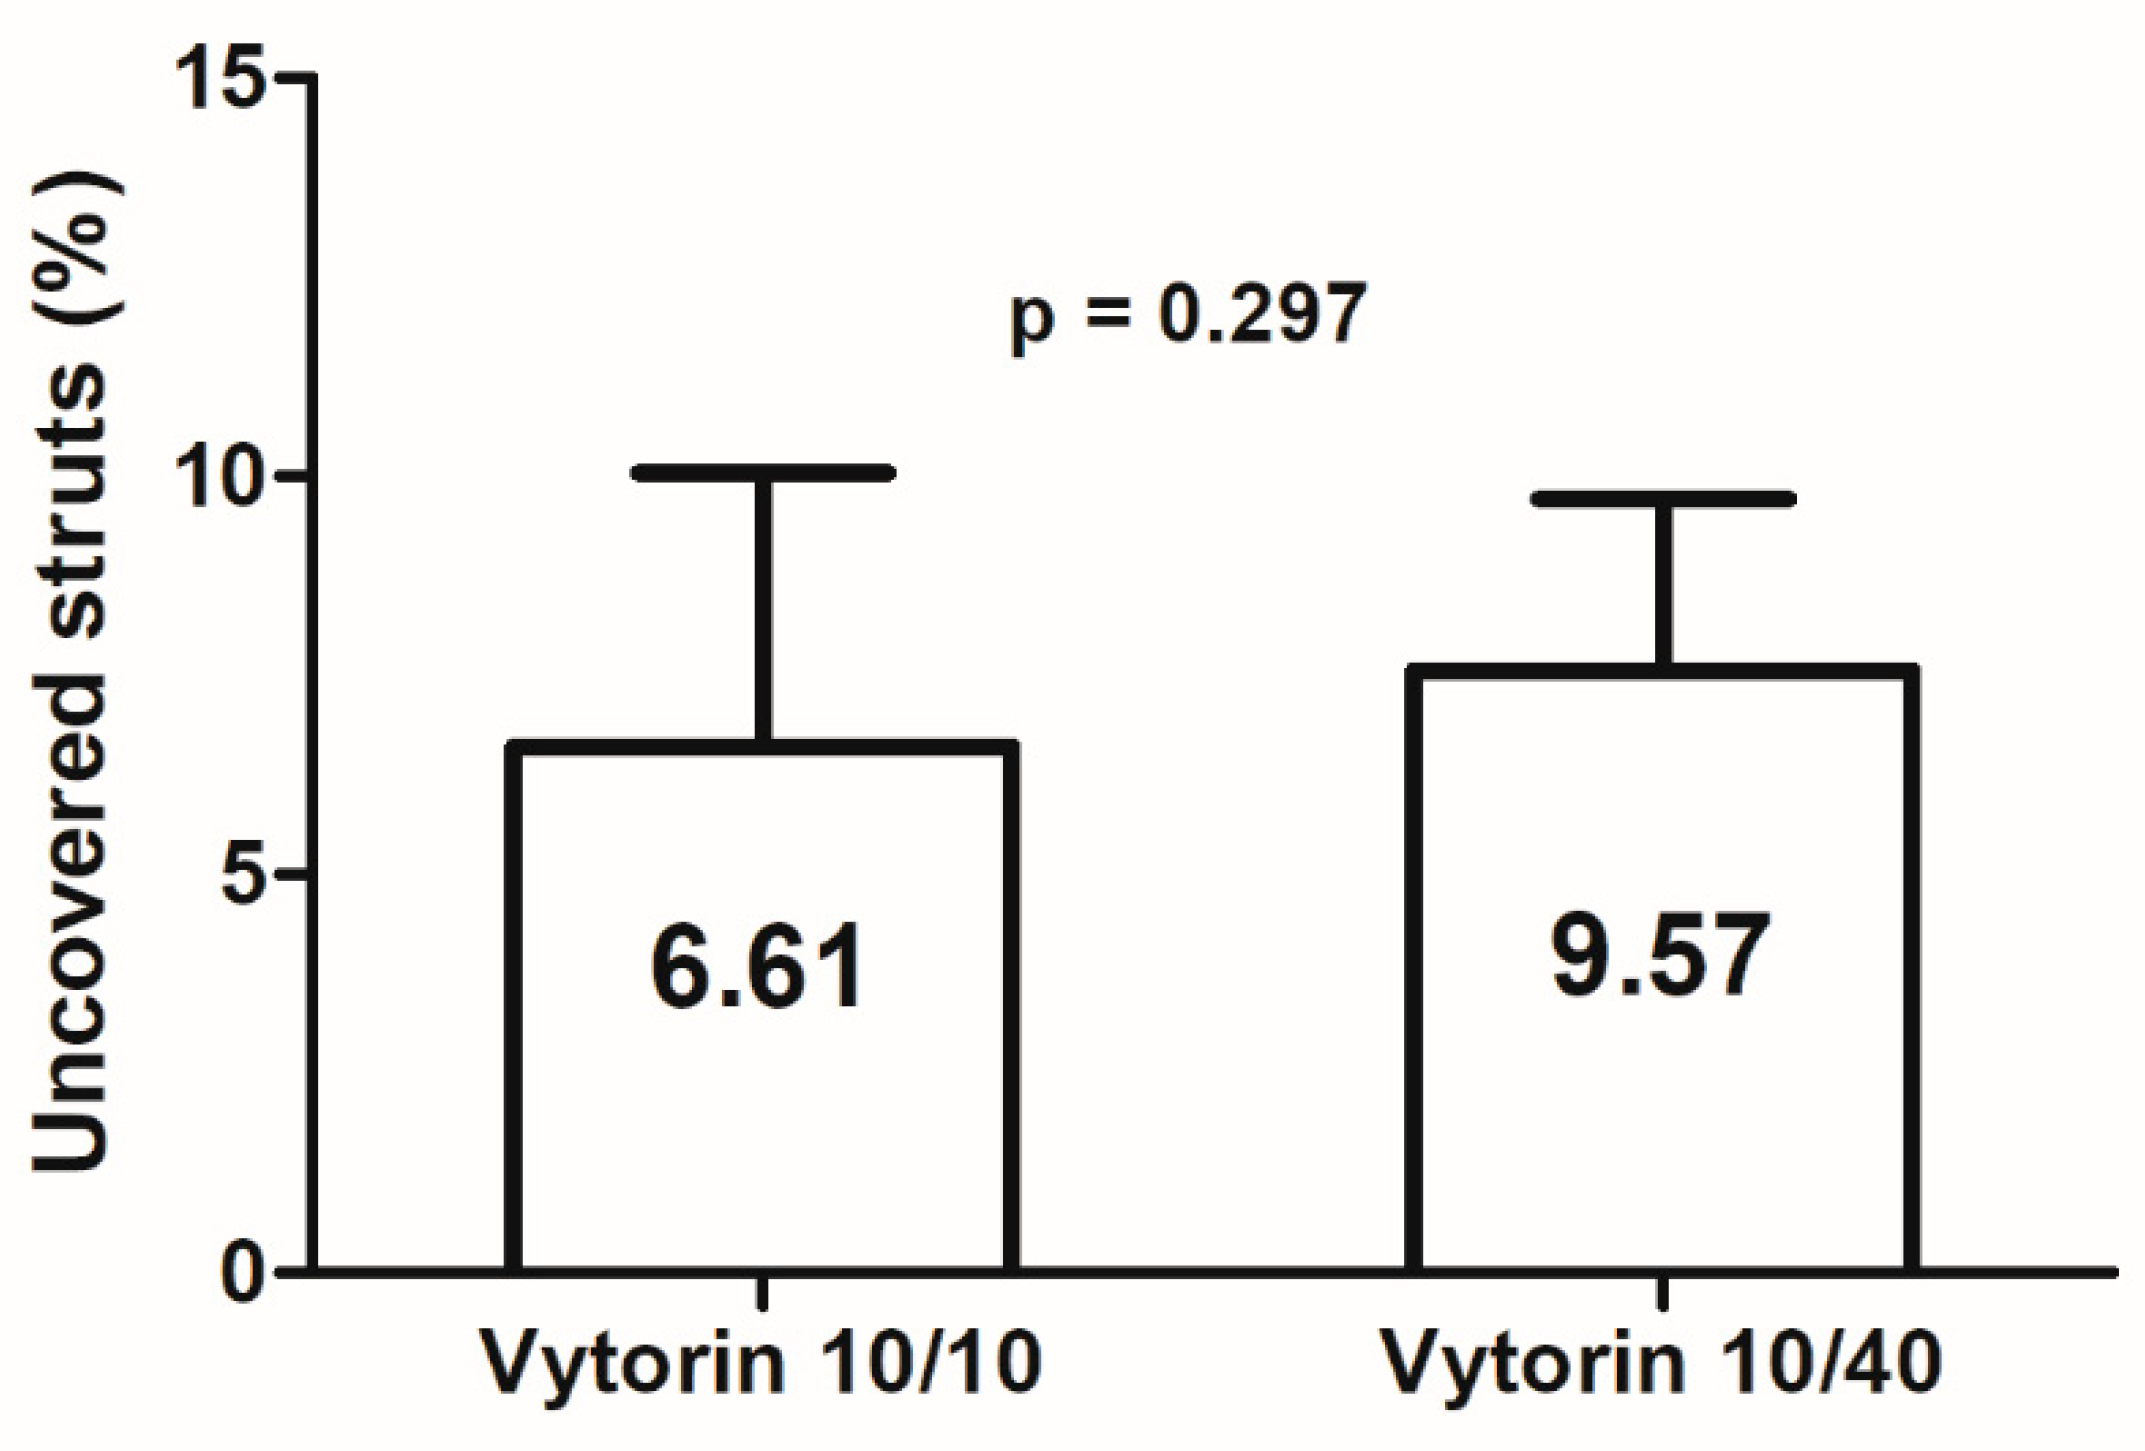
| Percentage of uncovered struts (%) | 87.53 ± 10.98 | 91.34 ± 8.86 | 0.387 | 6.61 ± 10.29 | 7.57 ± 6.45 | 0.297 |
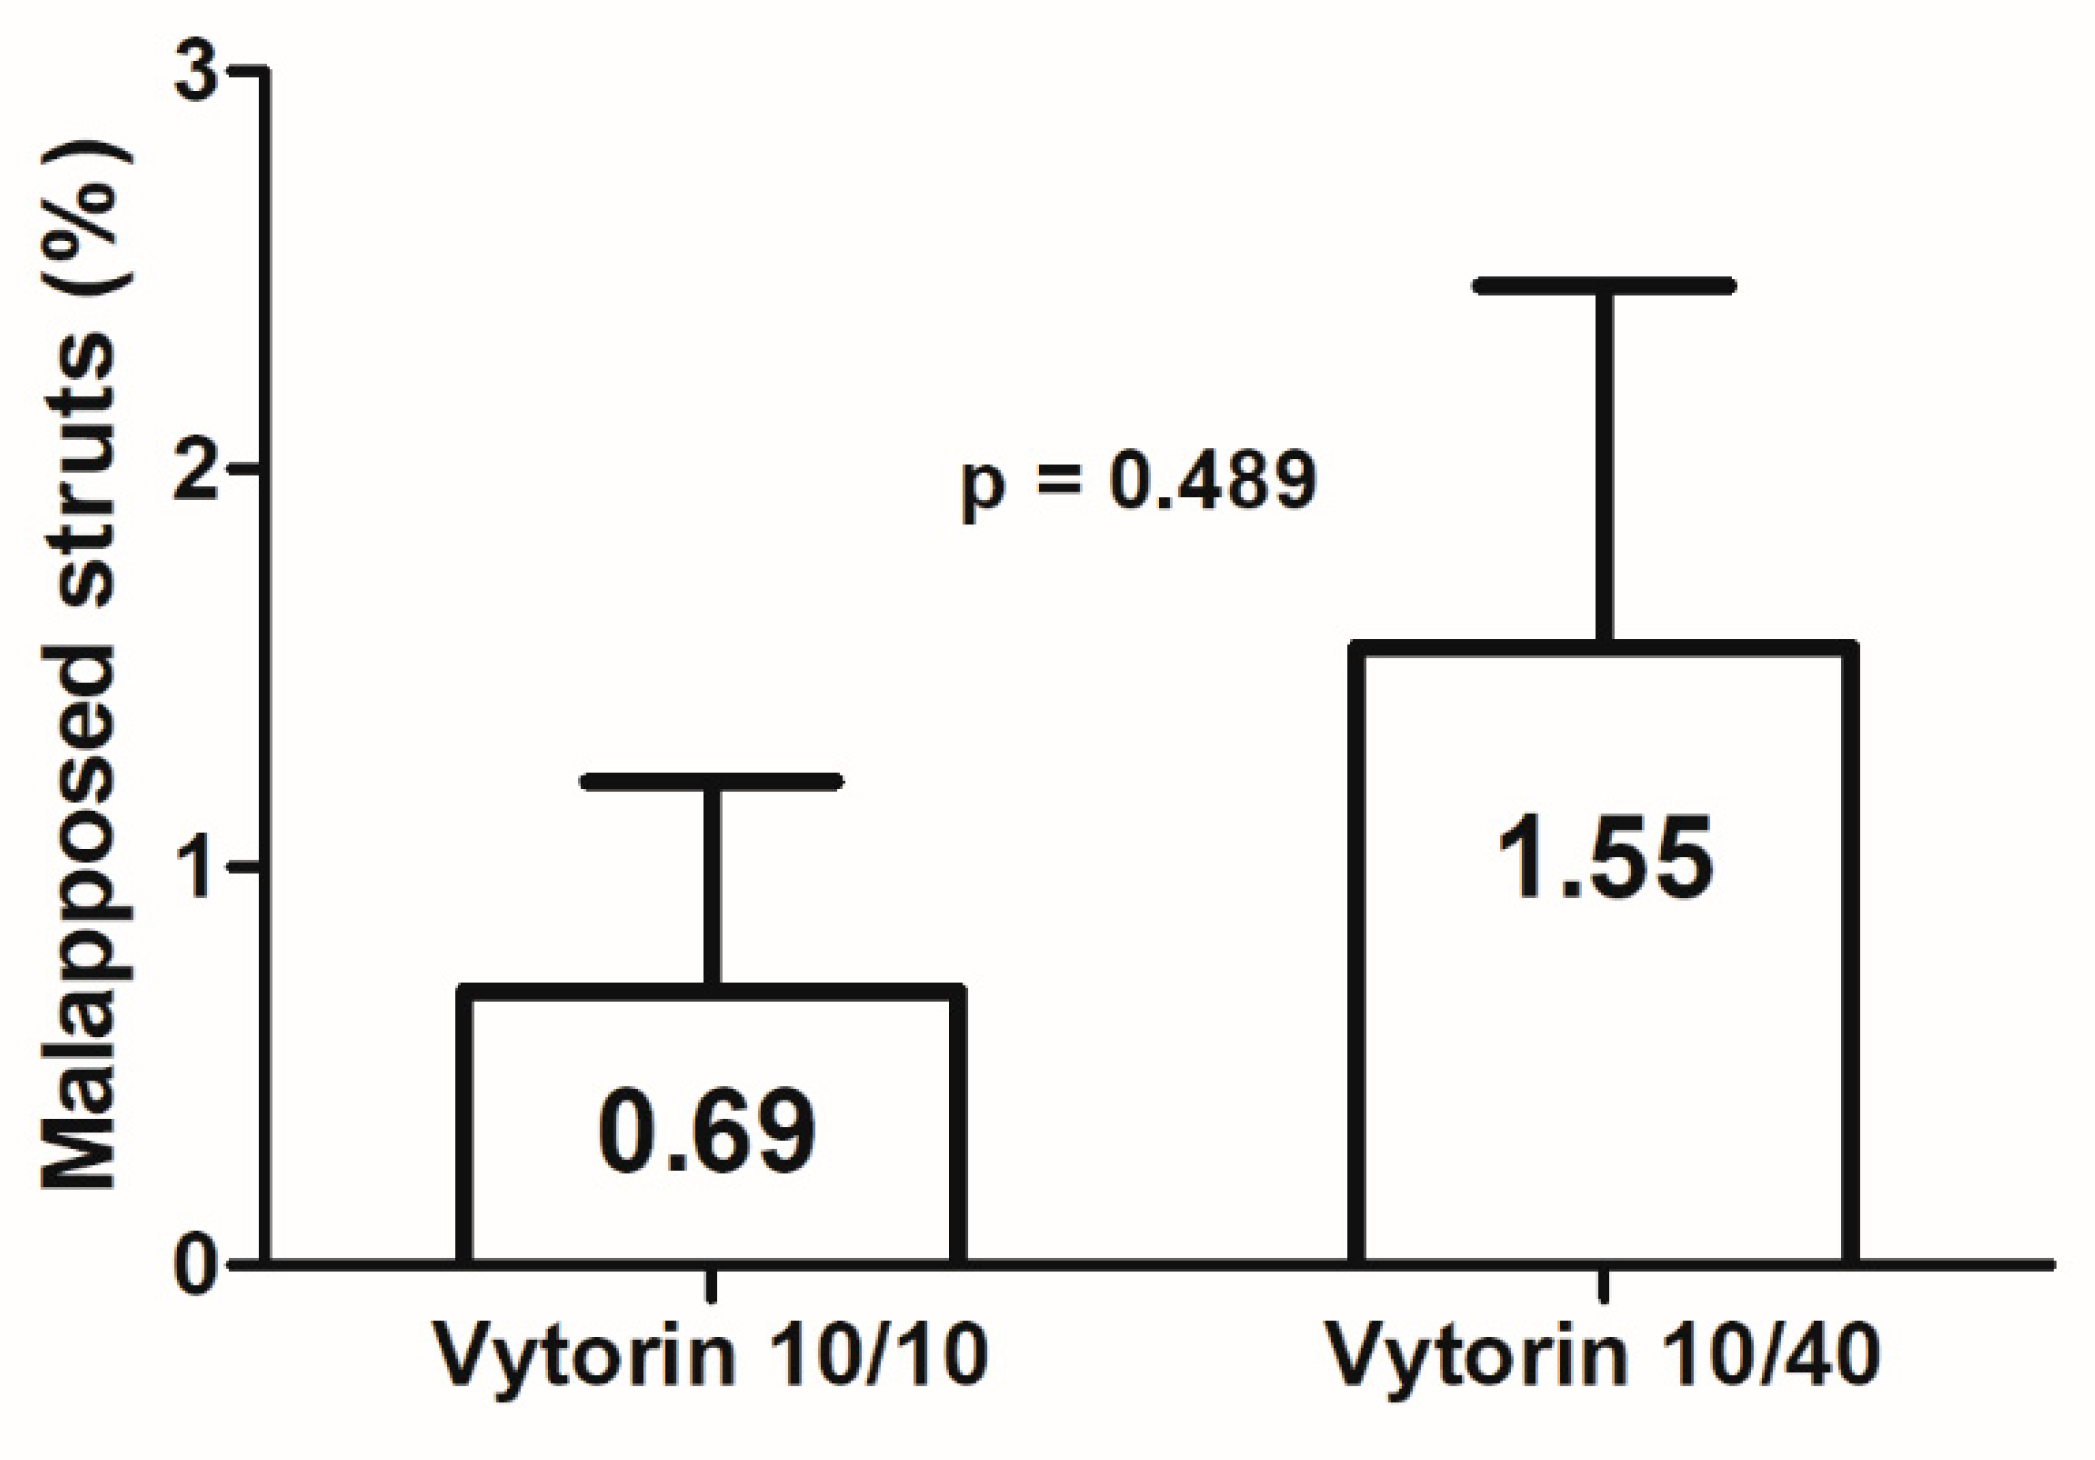
| Percentage of malapposed struts (%) | 3.88 ± 2.79 | 7.32 ± 7.32 | 0.387 | 0.69 ± 1.58 | 1.55 ± 2.72 | 0.489 |
| Presence of intra-stent thrombus | 9 (100%) | 6 (66.7%) | 0.058 | 2 (22.2%) | 0 (0%) | 0.134 |
| Mean NIH area (mm2) | 1.41 ± 2.28 | 0.65 ± 0.76 | 0.297 | |||
| Mean percent NIH area (%) | 6.53 ± 3.26 | 6.37 ± 8.96 | 0.190 | |||
| Mean NIH thickness (µm) | 47 ± 29 | 56 ± 103 | 0.190 | |||
© 2018 by the authors. Licensee MDPI, Basel, Switzerland. This article is an open access article distributed under the terms and conditions of the Creative Commons Attribution (CC BY) license (http://creativecommons.org/licenses/by/4.0/).
Share and Cite
Kim, Y.; Hong, Y.J.; Kim, S.W.; Kim, M.C.; Sim, D.S.; Kim, J.H.; Ahn, Y.; Jeong, M.H. Impact of Combination Therapy with Ezetimibe/Simvastatin Treatment on the Neointimal Response to Biodegradable Polymer Biolimus-Eluting Stent Implantation in Patients with Acute Myocardial Infarction: Serial Assessment with Optical Coherence Tomography. Appl. Sci. 2018, 8, 1968. https://doi.org/10.3390/app8101968
Kim Y, Hong YJ, Kim SW, Kim MC, Sim DS, Kim JH, Ahn Y, Jeong MH. Impact of Combination Therapy with Ezetimibe/Simvastatin Treatment on the Neointimal Response to Biodegradable Polymer Biolimus-Eluting Stent Implantation in Patients with Acute Myocardial Infarction: Serial Assessment with Optical Coherence Tomography. Applied Sciences. 2018; 8(10):1968. https://doi.org/10.3390/app8101968
Chicago/Turabian StyleKim, Yongcheol, Young Joon Hong, Sang Wook Kim, Min Chul Kim, Doo Sun Sim, Ju Han Kim, Youngkeun Ahn, and Myung Ho Jeong. 2018. "Impact of Combination Therapy with Ezetimibe/Simvastatin Treatment on the Neointimal Response to Biodegradable Polymer Biolimus-Eluting Stent Implantation in Patients with Acute Myocardial Infarction: Serial Assessment with Optical Coherence Tomography" Applied Sciences 8, no. 10: 1968. https://doi.org/10.3390/app8101968