Improved Human Detection with a Fusion of Laser Scanner and Vision/Infrared Information for Mobile Applications


Institute of Automatic Control, Silesian University of Technology, Akademicka 16, 44-100 Gliwice, Poland
*
Author to whom correspondence should be addressed.
Appl. Sci. 2018, 8(10), 1967; https://doi.org/10.3390/app8101967
Submission received: 31 August 2018
/
Revised: 12 October 2018
/
Accepted: 15 October 2018
/
Published: 18 October 2018
(This article belongs to the Special Issue Laser Scanning)
Abstract
:This paper presents a method for human detection using a laser scanner with vision or infrared images. Mobile applications require reliable and efficient methods for human detection, especially as a part of driver assistance systems, including pedestrian collision systems. The authors propose an efficient method for multimodal human detection based on a combination of the features and context information. Strictly, the human is detected in the vision/infrared images using a combination of local binary patterns and histogram of oriented gradients features with a neural network in a cascade manner. Next, using coordinates of detected humans from the vision system, the moving trajectory is predicted until the scanner working distance is reached by the individual human. Then the segmentation of data from the laser scanner is further carried out with respect to the predicted trajectory. Finally, human detection in the laser scanner working distance is performed based on modelling of the human legs. The modelling is based on the adaptive breakpoint detection algorithm and proposed improved polylines definition and fitting algorithm. The authors conducted a set of experiments in predefined scenarios, discussed the identified weakness and advantages of the proposed method, and outlined detailed future work, especially for night-time and low-light conditions.
1. Introduction
Real scene understanding for general object detection and recognition is one of the most challenging computer vision problems in terms of real-time processing, especially from different types of sensor modalities. In the recent literature, numerous applications can be found such as pedestrian detection [1], obstacle detection in a real environment [2], scene parsing of 3-D-LiDaR (light detection and ranging) and camera data [3], image-based vehicle detection [4], object detection in an urban environment [5], and many others.
One of the greatest areas of growth in object detection, recognition, and classification is human detection, especially when we take into account the large range of applications where the human detection can be applied. Human detection is used in various areas [6] and applications such as simple traffic counting pedestrians passing [7], in autonomous and intelligent vehicles, or advanced robots to detect and avoid collisions with humans [8], sport activities for player detection [9,10], gait analysis [11], human tracking in different systems [12], modelling the human body [13], and gesture analysis [14]. The most demanding tasks for algorithms regarding recognizing and detecting people are those related to complex security applications. One of the most representative examples of improving safety is pedestrian detection with collision avoiding systems [15], which are increasingly used by well-known manufacturers of the automotive industry. Generally, these types of the methods are categorized as advanced driver assistance systems (ADAS) [16], which, in general, try to warn the driver in case of hazardous situations by stopping the car or only warning the driver about a probable near collision with a pedestrian or group of pedestrians in stationary or in a moving behavior. Information about some usage of pedestrian detection systems (PDS) in ADAS systems can be found in References [17,18]. In some cases, PDS systems are equipped with a collision prediction module that is based on the analysis of pedestrian behavior. Finally, the aim of the pedestrian detection system is to help drivers in making the decision or eventually autonomously counteracting possible collisions or even potential injuries.
Based on References [19,20], research in 2015 found that 5376 pedestrians were killed in traffic crashes in the United States. This averages to one crash-related pedestrian death every 1.6 h. Moreover, almost 129,000 pedestrians were treated in hospitals for non-fatal crash injuries in 2015. Pedestrians are 1.5 times more likely than passenger vehicle occupants to be killed in a car crash on each trip. In general, the number of accidents between a driver and a pedestrian only gives way to the number of accidents between two or more cars, in particular, when it comes to side impact crashes. In consequence, the system can only function properly if it has a set of reliable and accurate sensors which increases the accuracy of each sensor independently and can be used in the fusion process. The rapid evolution of digital devices, such as smartphones, real-time processors, computer vision systems, laser scanners, infrared cameras, and 3-D cameras, is another reason for the rapidly growing interest in human detection systems.
The real human detection systems are sensitive to different components that can impact the final results. First, pedestrian attributes, such as shape, height, dressing style, appearance, pose, stationary or moving behavior, and single or group, should be taken into account. Second, environmental attributes, such as different weather conditions, background, variable lighting, day/night time, and obstacles, should also be taken into account. Finally, factors connected with acquiring devices, such as resolution, sensor noise, distance, scale, detection performance, vibrations, calibration, occlusions, and perspective, should also be considered. In order to overcome the problems mentioned above, numerous algorithms and methods have been proposed in recent years. These methods are based mostly on low-level features, body parts detection, gait analysis, and geometric matching. On the other hand, different fusion techniques between different modality sensors have been developed such as LIDAR scanners, 2-D cameras, depth sensors, infrared cameras, and day/night cameras.
The paper proposes the following novel contributions:
- A cascade fusion strategy based on the usage of information from a vision system in laser range data processing in real scenarios in a separate manner;
- A combination of HOG (Histogram of Oriented Gradients) features and LBP (Local Binary Patterns) descriptor with neural network cascade classifier for human detection
- Segmentation of laser data that is based on a predicted trajectory from the vision system
- A method of leg detection in the scanner laser data based on an improved polylines definition.
The paper is organized as follows: Section 2 presents a detailed description of the state-of-the-art methods in hardware and algorithm points of view, whereas Section 3 reports all the proposed and used system modules in cascade form such as hardware, calibration process, human detection, trajectory prediction, laser scanner data segmentation, and leg detection methods. Section 4 presents discussion, authors’ remarks, and results. Conclusions and future works have been drawn in Section 5.
2. Related Work
Generally, methods of human detection can be categorized into a few ways: First is the processing of individual images or image sequences. The second involves utilizing different acquisition devices such as a visible camera, thermal camera, 2-D laser scanner, or a 3-D laser scanner. The third involves methods of processing the data such as low-level features, shapelet features, detection of the body parts, distance transform, gait analysis, background modelling, convolutional neural network, or deep learning. Finally, with acquired data, such as images, scans can be processed separately or in a fusion way, based on well-known scenarios such as pixel-level, feature, or decision fusion. In most cases, the human detection process has a variety of techniques and features that focus on increasing the speed and accuracy of detection [21,22,23].
P. Viola and M. Jones [24] in their work used Haar features to build a cascade classifier, based on the AdaBoost boosting algorithm. The method was originally developed for face detection in the images, but G. Monteiro, et al. [25] adapted the P. Viola and M. Jones methodology for human detection. The human detection method is based on processing data in the 15 × 37-pixel detection window where classification is performed by calculating simple features called the Haar features. Feature extraction of the human body has been used in one of the fundamental methods in human detection, which was proposed by N. Dalal and B. Triggs [26]. Their algorithm focuses on features described as HOG (histogram of oriented gradients), which uses the information of the gradient for the featured nine directions in angle range 0–180°. It is possible to analyze local histograms of all predefined gradient directions over all pixels in the certain cell. The image for the analysis is searched by the window of detection with size 64 × 128 pixels, which are in the next steps divided for square cells with size 8 × 8 pixels. Cells are grouped in 2 × 2 systems into blocks with size 16 × 16 pixels. Next, for each cell, the value and orientation of the gradients are calculated and used for the histogram of oriented gradients generation and, finally, the features vector. Another method, based on the HOG algorithm, was developed by T. Watanabe, S. Ito, and K. Yokoi [27]. The authors propose a method for extracting feature descriptors consisting of co–occurrence histograms of oriented gradients (CoHOG). For each block, distribution of the gradient orientation in block (co-occurrence matrix) is calculated. Next, features are calculated as a sum of instances of all gradient orientation pairs in the collected cells in blocks. Finally, the created features vector is used as input information to the support vector machine (SVM) classifier. The proposed method is not efficient in terms of processing time; it is also sensitive to a difference in size and orientation of a human pose in the image. To improve the processing time, a linear SVM classifier has been replaced by, e.g., a cascade classifier [28], in which one classifier has been replaced by the set of weak classifiers. The authors applied blocks of variable size and proportion as a more accurate description of the human pose. In the early stages of the cascade, classifiers are learned on the basis of larger blocks. Local binary patterns (LBP) have been used to improve HOG in different ways. One is a classic two–stage cascade where, on the first stage, the features of all regions are extracted with special consideration regions with pedestrians only [29]. The idea of LBP extraction is to calculate the “binary” derivative of each pixel and give it a label in the form of a code. The code can be calculated in a different manner, e.g., classic [30], centered [31], or non-redundant LBP [32]. In this way, a statistical description of the image content is obtained, which can be used in the subsequent classification process [33] with simultaneous simplicity, rapid calculation, and robustness to illumination changes.
Another group of methods is based on modelling of the human body in body parts definition. The final results depend on correct detection of the individual body parts such as head, hands, trunk, and legs. Authors of Reference [34] proposed an approach with a combination of the body prior and the generalized earth mover’s distance. The human body is divided into three parts: legs, trunk, and head. Next, each body part is weighted and the distance to the middle of the body is calculated. A different approach, based on the assumption that an individual’s walking style is unique, can be used for gait analysis [35]. The proposed method characterizes gait in terms of a gait signature computed directly from the sequence of silhouettes. The moving objects are segmented using the background subtraction algorithm and the morphological skeleton operator is used to track the moving silhouettes of a walking figure. The approach, based on the processing of laser scanner data and computer vision information, has been presented in Reference [36]. Authors proposed a method of fusion data with human gait modelling by using context information, and also by providing danger estimation for the pedestrians detected.
Some of the methods have been adapted to the infrared images, where human detection is based mainly on the localization of warm symmetrical objects with a specific aspect ratio and size. The infrared analysis of the human pose should deal with low image resolution, low contrast, and the large noises of thermal images; it should also deal with the influence of the high temperature of backgrounds during the day. The detection and tracking algorithm in real–time has been presented in Reference [37]. The foreground segmentation with a Gaussian background model and tracking step based on connected components intersections is performed. Classification is based on the cascade of boosted classifiers based on Haar wavelets. A method of night-time pedestrian detection using far–infrared camera has been presented in Reference [38]. The proposed method consists of regions of interest generation and pedestrian recognition in a cascade with modified HOG for more effective pedestrian representations by capturing both the local object shape and its pyramid spatial layout. Authors of Reference [39] presented a robust approach using a shape distribution histogram feature and modified sparse representation classification. First, the candidate regions are detected based on the contour saliency map. Then distances between random points on the thinned contour map of objects in the candidate regions are applied to acquire the shape distribution histogram feature.
In recent years, the fast-growing market of the graphical processing unit and acquisition devices, such as laser scanners, is the reason for using deep learning methods and some laser scanners and vision-based method fusion. The method proposed in Reference [40] achieves high accuracy by automatically optimizing the feature representation to the detection task and regularizing the convolutional neural network. In Reference [41], a robust multiple cameras pedestrian detection approach with a multi-view Bayesian network model has been presented. A unified deep model to jointly learn features, saliency maps, and mixture representations of the whole body and different body parts in a hierarchy have been presented in Reference [22]. Authors refined the classic convolutional neural network by introducing a switchable layer built with a new switchable restricted Boltzmann machine.
Human detection processes commonly consist of a few well-known phases, such as preprocessing, calibration, feature extraction, detection, and classification for vision-based solutions, along with preprocessing, segmentation, feature extraction, detection, and classification for laser data methods. In most cases, vision-based solutions based on feature extraction demands significant time-processing; the number of feature spaces is quite high, and methods are sensitive to the environmental conditions such as sunlight, rain, fog, etc. Whereas, laser scanner solutions are usually faster because of the wide range of possible distances. Laser scanners can be found in numerous recent solutions connected with human detection and tracking [42], road and lane detection, and description [43] or automotive applications for vehicle motion controlling [44]. Depth information sensors are very accurate, especially for short distances, where vision-based solutions produce poor results. As a consequence, fusion of information from different sensor modalities is a proper way to improve the final detection result. Several methods have been proposed to detect or track people by fusing the laser and vision-based approaches [45,46]. In a feature vector, fusion features are extracted for each sensor independently and a new data set is created [47]. A decentralized fusion approach based on performing detection and classification for each sensor independently and next results from sensors are combined according to the certainty of the independent results and sensors parameters. The sample of this type of fusion has been presented in Reference [48] where authors use AdaBoost for vision-based classification and Gaussian mixture models for laser data.
3. Materials and Methods
Generally, in recent years, the application of computer vision for human detection and classification is the most reliable, especially including pedestrian detection for road safety applications and mobile applications. Many solutions based on the vision sensors have limited acquisition frequency, as well as an inappropriate field of view (FOV); furthermore, they are strongly affected by weather conditions, obstacles, and occlusions. Of course, some of the disadvantages can be reduced in the software way, by using robust algorithms or combining with another modalities sensor. Infrared imaging has a key advantage when used at night, and also increases the effectiveness of the detection process by reducing false positives detection when a human can be mistaken with other objects such as a lamppost or trees. ADAS systems and robots’ mobile systems require fast and reliable information about pedestrians’ possible appearance in the scene in front of the vehicle in far and near distances with the same accuracy. Data acquired by laser scanner are less sensitive to changes in illumination or texture; they are also an attractive source of data in view of their dense and accurate sampling. The real-time processing requires that the measurement system should be explicit, robust, and accurate. In Reference [36], authors proposed the method with laser scanning in a long distance and vision camera for short distances based on a problem of possible faults in human detection out of the camera’s FOV.
Thus, authors proposed a method of improving the vision approach by the laser scanning method in a novel manner. Human detection is performed using the two types of sensor vision, or infrared camera and a laser scanner. Of course, the mentioned sensors have different FOVs, different accuracy, and finally different types of data. Authors developed a method with the usage of two different types of sensors the first stage of an algorithm, which can be swapped based on the weather conditions. For night-time and low-light conditions, an infrared camera will be a more effective solution. The proposed method is based on the detection of people in the vision or infrared images and tracking each human individually. Next, in the laser working distance, human leg detection processes are performed. This process is based on polylines fitting and trajectory information of each human. The trajectory is determined based on data from the vision system, which facilitates the classification of data from the laser scanner into human legs and other objects such as obstacles, background, and other. This approach can be used especially for mobile applications (ADAS and robots) where a decision about a human presence must be processed with high speed and reliability. The system can be categorized as a decentralized-cascaded fusion technique, because data from different sources have been processed individually. The information from long-distance vision sensors is used in the second stage of the method, when processing laser scanner data for short distances. Then the camera FOV makes human detection impossible, while usage of the laser scanner increases the number of proper detections. In Figure 1, a series of indoor acquired images are presented. For far distances, a human pose can be recognized effectively, especially for infrared images, where human pose temperatures differ from any other objects in the scene. Most of the recent algorithms and databases use images of a human pose in low resolution, e.g., 32 × 64. On the one hand, images registered with high speed and high quality are a good base for processing steps, especially when we take into account GPU (graphical processing unit) usage in real-time applications. On the other hand, for short distances, vision and infrared sensors produce poor results, mainly due to the narrow FOV. In our case, reliable detection was done at a minimal distance of 5 m. Thus, we decided to combine existing methods with an accurate laser scanner, working over a short distance. Obviously, our method can be adapted for any other laser scanners, especially with a larger working distance.
Based on the above observation, the authors proposed an algorithm that consists of a few steps (see Figure 2). First, all the sensors must be calibrated using a method based on the chessboard where the camera distortion model is included. The laser scanner sensor is also calibrated with a chessboard based on the assumption that the mobile platform moves at a known velocity, also the pitch of the platform is constant. In this case, switching between images and scans can be done with high accuracy and speed. The human detection for far vision and infrared images is based on the combination of the histogram of oriented gradients (HOG) and local binary patterns (LBP) with a neural network. From the results, we get coordinates from each series image of the detected human. Next, based on the extracted coordinates, a trajectory of the human movement has been calculated using the well-known Kalman filter. The result of trajectory prediction has been used as an input to the segmentation of the laser scanner data, which consists of a clusters generation process based on an adaptive breakpoint detector and human legs appearance confirmation, which, in turn, is based on the polylines fitting.
3.1. Hardware
All the experiments were carried out using the autonomous mobile platform equipped with three-scene acquisition sensors such as the SICK LMS 400 laser scanner, infrared thermal camera ThermoPro TP8 (Wuhan Guide) and vision camera from Microsoft Kinect (see Figure 3). As part of the experimental work, tests have been carried out using a sensor system consisting of a 2-D SICK LMS400 laser scanner with a 60° viewing angle, a 0.2° angle resolution, a working distance of 3 m, a frequency of 370 Hz, and 300 points for each scanned line. Next, MS Kinect with an RGB-D camera and vision camera, but during experiments, authors used only a vision camera with a resolution of 640 × 480 pixels and a 62° × 48.6° viewing angle. The infrared camera was the last acquisition device. The camera was equipped with a 384 × 288 pixel uncooled FPA (Focal Plane Array) microbolometre. Its spectral range was 8–14 μm and thermal sensitivity 0.08 °C. A short-range scanner has been used, specifically for the purpose of better human leg modelling, it gives a larger number of points per scanline in comparison to a long-range scanner. However, without any limitations, the developed method can be transferred to a long-range scanner or even to a 3-D scanner. Besides, due to the scanner’s maximum working range, a decision should be made regarding the distance limit, above which the analysis is based on a vision/infrared, and below on the laser scanner. In the proposed method, working spaces of the laser scanner and vision system have been separated according to the manner of data acquisition; however, the information from the vision system is used in a second one.
3.2. Calibration of the Sensors
Each sensor can be characterized by its intrinsic and extrinsic parameters. These parameters describe the shape of the camera lens, along with its geometrical features. In the calibration process, an estimation of these parameters must be achieved, in most of the cases, using chessboard patterns as a reference. Generally, the current method is used frequently in stereovision for calibration of two cameras, but they can also be used for decreasing the distortion of the lenses in one camera and for calibration between the camera and laser scanner. The method is based on presenting a chessboard calibration pattern at multiple orientations. In our case, we directly used the dots pattern (see Figure 4) with a predefined distance between dots that represents the corners of the chessboard. The chessboard has been registered in 10 different angles and rotations in a 3-D space. Finally, dots were localized with high-pixel accuracy using a strong contrast between them and the background. A similar method was applied to the infrared camera with a different individual corner board, and also placed at different angles and rotations in 3-D space.
The calibration that was carried out in this paper was based on the camera distortion model [49,50]. This approach included a transformation from a 3-D world coordinate system to the 3-D coordinate system of the camera and a projective transformation from the 3-D coordinates of the camera into the 2-D image coordinates. The method requires, in most cases, at least five images of calibration objects, e.g., chessboard, which is a consequence of the proposed model and a number of coefficients including three radial distortion coefficients for the lens and two tangential distortion coefficients for the lens. There are a few practical comments such as having fewer lenses means greater distortion; the distortion cannot be removed completely because the quality of reducing depends on the types of distortion that have been included in the model. Results of a correctly performed calibration are presented in Figure 5. The blackened areas visible on the edges of the images were created after correction of the geometric distortion and have a non-linear character.
The laser scanner calibration was required, in most cases, for the proper transition between the laser data and the image space. In the recent literature, a few solutions can be found for 2-D and 3-D scanner calibration [51,52]. The authors decided to use a similar method for vision and infrared cameras that required a collection of a few laser–camera acquisitions where the calibration chessboard was shown at different positions and orientations. The process of acquiring data from the scanner was synchronized with vision and infrared images acquisition. In Figure 6, some of the results before and after calibration with merged data for vision camera and laser scanner (yellow marks) are presented. The advantage of calibration can be seen especially for calibration of the vision camera and laser scanner. This is because the vision camera has the larger value of distortions compared with the infrared camera. The calibration makes the laser data more accurately matched to the pixels in the image instead of the non-calibrated ones.
3.3. Human Detection in Vision and Infrared Images with Trajectory Prediction
The complexity of the human detection problem depends on a variety of weather conditions, environmental conditions, pedestrian appearance, other objects, changing background, and occlusions. The authors proposed a method of human detection in two levels. In the first level, objects for a large detection distance in vision or infrared images have been processed. The objects in the near distance from laser scanner data processing was processed in the second level. Based on the authors’ experience [53], a method based on classic HOG features produces an inappropriate result, especially for occluded people, e.g., a crowd in which individual humans are treated as one human by the detection algorithm, or ambiguous detections such as trees. Furthermore, the HOG method complexity was the reason for significant time processing. In other words, HOG produces many false detections of candidates, but with quite a good accuracy for positive detections. One of the solutions for this problem is a combination between HOG and LBP features with some simple neural networks cascade classifiers [54].
The proposed method is a compromise between speed and accuracy. The combination will include features of gradient information from HOG and local structures of pixel intensity from LBP. Of course, the set of features is only a description of the human candidates, which must be classified as positive or negative. In recent literature, many classifiers can be found such as decision trees, Bayesian, AdaBoost, and support vector machines. Classic HOG produces 3780 features in a vector based strictly on the definition of Dalal and Trigs [26], which is the reason for the generation of many false positive candidates. There are two ways improve this step: reduction of the feature vector or speed up a candidate-removing process. The calculated vector of HOG-LBP features was used as an input to the neural networks. Authors used a cascade classifier of 15–20 weak and strong classifiers based on neural networks as a more reliable method in comparison to the SVM method or a classic HOG. Our method uses an original feedforward neural network in perceptron version with a sigmoidal activation function. The learning process of the network was done with a backpropagation method. The proposed detection method generated numbers of overlapping areas with a possible detected human. In this case, the number of areas is decreased by grouping with a non-maximum suppression algorithm. This method was based on a calculation number of overlapping ROIs (Region of Interest) with highest common areas.
In Figure 7, a comparison of the proposed method and classic HOG-SVM is presented. Three different quality measures have been used such as true positive rate (TPR), error rate (ERR), and accuracy (ACC). The TPR is a measure of correctly classifying an object in the case the object belongs to a class of people, ERR is a measure of incorrect classification, and ACC is a measure of correct classification. For all three measures calculated for a well-known INRIA dataset, the proposed method obtained better results compared with the HOG-SVM method, especially for the TPR method, which obtained a pronounced growth. The combination of HOG features with a neural network produced better results in comparison to HOG-SVM, especially in TPR and ACC measures.
Some sample results for our data have been presented in Figure 8. Of course, there is no possibility to correctly detect all the people in a crowd from a long distance, for which, in most cases, recognized human ROIs will be overlapped. On the other hand, our idea is based on the usage of the ROI coordinates to find and track different individual humans until they will be out of the FOV of the camera. Thus, overlapped ROIs does not change expected trajectory because the ROI has been created individually each time. The data of ROIs are used especially only for laser scanner data processing for the working distance. Our method was based on the observation of ROI coordinates’ changes through the reached distance. The results obtained with the proposed method are satisfactory for different scenarios: one human, group of people, also using infrared images.
Our method is based on the assumption that during the reached distance, the width and height of the detected ROI of the individual human will increase. As it can be seen in Figure 9a, in near distance to the camera, parameters change rapidly. This is information about possible human presence in the working distance of the laser scanner. In Figure 9b, trajectories on the X-axis through the distance is presented for a human walking straight ahead to the test platform. The obtained value is then used to predict human trajectory in a laser scanner working space.
The pedestrian path prediction is still a challenging problem due to the dynamic behavior of pedestrians in real environments. In the recent literature, numerous methods can be found focused on tracking and sensing human movement [55,56], predicting human path trajectories [57], or human detection with background subtraction [58] used for trajectory determination. Most of the proposed methods are based on model fitting for the specific scenario with a moving human. Humans in a crowd can adapt their moving path due to other pedestrians in the crowd. On the other hand, generation of the short prediction of the trajectories can be done only for some parts of a pedestrian’s trajectory. In real environments, people’s trajectories are often partially occluded. In this case, an improved motion model can be used to achieve lost pedestrians. The proposed method is based on the modelling of the human path individually, with the assumption that pedestrians tend to follow their trajectories through environments rather than random paths. The authors used a Kalman filtering procedure [59], which is a classic feedback algorithm. The filter estimates the process state at the predefined time and then obtains the feedback. The tracking algorithm estimates the position and velocities of the pedestrian from current observation. Our prediction is based on the assumption that people are moving on the strictly linear way with a constant velocity, also for prediction purposes, only vision images have been used on which people are within 5–40 m from a mobile platform. Quality of the prediction depend on calculation of R and Q matrices. The R matrix expresses how accurate the vision camera is, as opposed to Q, which is responsible for modelling uncertainty. Both of the matrices are diagonal and based on the state of the art methods where they should be initiated and tuned intuitively. Strictly, values on the diagonal of R were calculated as variance values from the measurements, and the diagonal of Q has small values for people moving at constant velocity. Of course, values of both matrices should be carried out for an individual camera and dataset combination.
Furthermore, the proposed method strictly calculates the prediction trajectory in image space, but this prediction is used to limit the processing laser range data with assumption that velocity and acceleration are constant. In Figure 10, estimated trajectories for simple straight-ahead walking of the pedestrian is presented. The resultant x-position prediction is a probable path of pedestrian moving, and the other two trajectories predict the right and left position of the pedestrian ROI. Of course, predicted values for left and right position should be approaching the minimum and maximum value of the vertical resolution of the camera. This prediction is recalculated from the image space into a laser scanner space. The yellow color marks the predicted trajectories for one detected human. In summary, prediction was performed based on vision system information, and the trajectory is predicted in accordance with the laser scanner working distance, where it will be used in the process of laser scanner data segmentation as borders of clusters in registered data.
3.4. Laser Scanner Data Segmentation and Legs Detection
The segmentation of the laser scanner data is a crucial task, especially when we take into account the number of points, different shapes of the objects, and some noise. The proposed segmentation procedure consisted of clustering data into separate segments with use of an adaptive breakpoint detector [60], and the legs modelling stage was based on context information about the characteristic shape of two legs.
In Figure 11, the complex scene with two people has been presented. One of them (left one) was standing when the second one moved from the right to left side. The blue plot on the graph corresponds to yellow dots in the vision image. The acquired data also contained some structural objects, thus based only on a laser scanner, it was hard to recognize only human legs. First, based only on the laser scanner information, small parts of data, such as individual points or short two to three point lines, must be removed as noise. The remaining points must be clustered into separate clusters that were supposed to belong to the same object. The segmentation was based on a simple distance-based method in which the calculated Euclidean distance between the next two points, such as Pn and Pn−1, was compared to the predefined threshold distance:
where λ corresponds to the worst case of the incidence angle of the laser scanline with respect to a line for which the scan points are still reliable and it is chosen based on user experience, θ denotes the angular resolution of the laser scanner, and 3σr is a residual variance. The used detector sample generates a threshold circle centered at Pn−1 with radius DTHD. If the next laser scanner point Pn is outside this circle, points Pn and Pn−1 are marked as breakpoints. Generally, breakpoints are associated with discontinuities in the scanning process such as the absence of obstacles in the scanning direction, or change of the surface being scanned by the sensor.
In Figure 12, the clustered data is presented. The presented scanline includes a few clusters with legs and other objects. Typically, simple line parts of the clusters corresponded to the flat, planar surfaces, not to human body parts. The leg clusters could be recognized using a modelling procedure, which is based on the contextual information. We combined in a fusion manner a predicted trajectory from vision/infrared images with the method proposed in Reference [36], but adapted it according to the resolution of our data. First, borders of the human pose have been added to the scanner data (Figure 13) based on predicted trajectory. Based on the last step, all the clusters that exceed borders (red lines) were removed from the data.
Next, using only clusters after segmentation, human legs must be confirmed. We used the two-stage confirmation method. In the first stage, the distance between clusters in one candidate must be calculated and compared to the size of a typical human; all the clusters that do not fulfill this requirement were removed and all the others were tested on the second stage. At this stage of examination, we used predefined polylines, created in accordance with the typical human gait, based on the definition of human leg patterns as a combination of three parts with two angles between them in one individual cluster. In Figure 14, the complex registered legs ROIs are presented.
The method proposed in Reference [36] has been limited to the main observation that most of the patterns shared a common feature. Unfortunately, their method ignored small steps, when one leg is occluded by the second one or another object. Also, there is a problem with having a larger number of the points in the data, such as in our case where the cluster with two legs contained even 60 points, which is a natural situation for scanning in the near field. Thus, in the proposed method, we used a combination of two predefined polylines in each cluster. After fitting data with two polylines, all the angles must be calculated and the decision about the legs’ appearance was made using the rule-based procedure. As presented in Figure 14c, six angles were defined: two for each polyline (leg) and two for a common part. Strictly, some limitations for the angles were defined where only one of the angles in pair α and β could be equal to zero, and angles δ1 and δ2 should be as similar as possible, and all the angles should be greater than π/2. The first limitation is caused by the complexity of the data structure, e.g., left leg can be registered as a simple shape, but the data for the right one includes the shape of pants. This assumption also helped to process information from data with a small number of points. Only in this case, our method will be reduced to the method in Reference [36]. Furthermore, limitations were responsible for removing non-leg objects. Based on the discussion above, the final results of detection of the people are presented in Figure 15. The proposed method was useful, especially for clusters, such as the second one in Figure 15, where the cluster was short-sized due to the pedestrian position related to the laser (high angle); as such, one leg was not scanned properly.
4. Results and Discussion
As part of the research, the most common scenarios of human movement have been simulated due to applications in pedestrian detection and human detection for mobile applications. Thus, the authors made an assumption in the experiments that the model trajectory is linear, because in most common cases, pedestrians move in straight lines, even walking in a group of people. Of course, otherwise more complicated trajectories should be analyzed, which can be implemented in our method at the stage of creating a trajectory of human movement, before it will be used in segmentation of the scanlines from the scanner. Studies were carried out to check the use of a vision–scanner combination and demonstrate how the scanner improved detection, as well as to show the advantages and disadvantages of this approach based on different scenarios. A set of different scenarios have been proposed and tested, taking into account one person and a group of people, both when there were occlusions caused by other people, objects, and the situation typical for urban traffic, when the person was registered individually, and other objects in the scene were in far distance relative to the human. We used also used an external database to evaluate the overall quality of the proposed method.
As part of the work, an application for the acquisition of data from vision sensors and a laser scanner was created. The developed application included all the mentioned modules of the proposed algorithm such as acquisition of the data and images, human detection in images, calculation of the predicted trajectories, data fusion, segmentation, and human detection in data from the scanner via leg modelling. The main application was created in the LabVIEW—the National Instruments programming environment, except for the part related to human detection and trajectories prediction, which was created in C and used after compilation into the main application. The software for the laser scanner data processing enables browsing of the list of files with data obtained from the scanner, as well as scan-related images acquired with a vision camera. The software provided basic data processing from the scanner, such as clustering of objects and their preliminary classification as pedestrians (Figure 16a). Many objects similar in shape to the legs in the scanner field situation could be acquired, and the pattern for obstacles was very different than it was for pedestrians. However, these were classified as pedestrians in preliminary classifications based on breakpoint clustering. For this purpose, an additional software module was built (Figure 16b) in the LabVIEW environment to take a closer look at this problem and develop an algorithm for removing such clusters at the preliminary classification stage.
In Table 1, selected scenarios for our dataset are presented. The main goal of such selection scenarios was to show the advantages and weaknesses of the algorithm caused by the detection of people in images, trajectory prediction, and segmentation with detection of legs in data from the laser scanner.
In the recent literature, what can often be found is a typical cooperation fusion that implies the need for various sensors in the assumed areas, e.g., a known distance from the vehicle. The proposed solution was focused on improving the efficiency of the vision/infrared solution and the use of information from this system in the analysis of data from the laser scanner. On the other hand, the use of a laser scanner allowed more reliable data analysis, especially in the area where the camera FOV was unable to correct detection. One of the most common problems in computer vision/infrared human detection is a significant occlusion when some of the pedestrians overlap each other. Thus, in consequence, high effectivity of the detection could not be achieved. Depending on the application, sometimes it is possible to change camera position, such as for crowd analysis in workspaces or general city environment, in order to minimize this problem. In other cases, such as pedestrian detection for ADAS systems, we should consider a limited FOV and predefined angle and position of the camera in the vehicle. The computational cost, which was mostly given as a weakness of the computer-vision-based solutions, is currently not a problem because GPU processing decreases time constraints dramatically. In addition, computer vision algorithms have been optimized, including neural networks. The advantage of using the data from the scanner in relation to the vision methods is particularly noticeable in situations when there are disturbances such as the so-called occlusions produced by a group of people physically in the scene where some of them overlap others. On the other hand, some disadvantages can also be determined such as weak resolution, viewing angle, and the amount of data. Some of the applications require laser data with a low resolution, such as human detection for far distances.
Based on the above observation, the proposed method is a good example of cooperation between different sensors and processing methods. Since some of the results have been presented in detail in the previous section, the authors later focused on a few aspects, such as occlusions and human leg modelling, in different scenarios and possible applications.
In Figure 17, a simplified data flow diagram is presented. The red lines correspond to the levels of the processing type. The level of the vision/infrared sensor includes the acquisition of the images, calibration, human detection, and prediction of the individual people’s trajectory based on the human’s trajectories and a predefined distance for which the laser scanner starts acquisition. The breakpoint generation for all the data was performed in the next level. In the last level, using the range of trajectories, some clusters of the segmented data were removed. Clusters with a possible human were limited to the breakpoints, and then the human leg detection process was performed. Finally, the position and distance of all the detected people was determined.
In Figure 18, one of the tested scenarios with two people walking straight ahead is presented. The human detection algorithm generated two regions, given by red ROIs, with detected people, although the ROIs are overlapped. This is a classic problem when detection is performed on the group of people. The occlusion problem is presented in Figure 18b, where vision image includes a first scanned line, given by the yellow dotted lines, after crossing the distance between two levels (vision/infrared and laser scanner). Generally, in Figure 19, the main idea of the processing of the laser scanner data was presented. The raw data included all the registered information without knowledge about types of the object and uniformity of the data in individual objects. Next, each cluster of data was marked with two breakpoints, namely the starting and ending ones.
Of course, created clusters included additional points that are going out of the objects; thus the fusion with information about trajectories was required and is presented in Figure 19c. Predicted values of the possible position of the people were created during trajectory prediction, and the first human was marked with red lines, while the second human was marked with green lines. It was obvious that the position on the next scan data was different regarding the trajectory model.
The reliable human detection system should deal with different directions, also called the path, toward where a human is moving. In this paper, the authors assumed that people could only walk on straight lines; they can even be short, but still straight. Thus, some paths could be merged as a few straight ones with different angles. Often in real, city environments, the pedestrian walks through the street or crossing. In this case, depending on the distance between vehicles and pedestrians, a computer vision/infrared system will produce information about detected pedestrians that helps to prepare in advance a laser scanner; otherwise, the system will not detect even one pedestrian, especially when the FOV is too small. In the first case, the proposed system will work exactly, such as a normal straight-ahead walking version, because the proposed classification procedure is not sensitive to changes in the human pose. In the second case, a vision/infrared system will produce wrong information or eventually nothing.
The main advantage of the laser scanner processing is insensitivity for overlapping ROIs such as in the presented example. Even when trajectories overlap each other, breakpoint generation will correctly separate these two clusters. Moreover, human detection in laser data uses only a few points. In the proposed solution, the scanner generates 300 points for each time scan, and approximately no more than 30 points belong to the individual human legs. The final classification is presented in Figure 19d where red color points are classified as human legs based on the leg modelling.
In Figure 20, the next two frames from the one registered path are presented. In this case (Figure 20a), the computer vision system generated incorrect results: one detected a pedestrian. Also, the laser scanner segmentation procedure generated two clusters limited to the breakpoints, which seemed to be a single human based on the modelling legs procedure. However, the distance on the vertical axis between these two clusters indicated the occurrence of two pedestrians because it was not possible that one pedestrian could walk with such a distance between legs. In this and similar cases, pedestrian detection in laser scanner data could only be done in two ways: by tracking pedestrians on a previous frame from the scanner or by checking the next few frames. In the developed method, the authors proposed processing of the next three frames to confirm the presence of a pedestrian. In Figure 20b, exactly one next frame in reference to Figure 20a is presented. The small change in the pedestrian’s position in vision images results in significant changes in the laser scanner data. In this case, both pedestrians have been properly detected based on the legs recognition.
In Figure 21a, the occlusion problem is presented. A set of five frames from the laser scanner included paths of two pedestrians walking with different velocities from the right to the left side. Only in scanline 2 (red color) does the occlusion problem occur. Thus, processing of scanlines 3 and 4 reduced this problem and pedestrians could be detected correctly. The occlusion problem for pedestrians walking straight ahead to the test platform occurred, in most cases, only for vision/infrared cameras instead of the laser scanner. However, as it can be seen in Figure 21b, for pedestrians walking side-by-side close to each other, there were enough scanlines to correct detection and separation into two individual pedestrians. Of course, for a large group of pedestrians walking side-by-side, the occlusion problem can be similar such as in the mentioned situation in Figure 21a. The proposed method in this case will carry out this problem by using more than one scanline for processing, also by using human pose detection from vision/infrared images to increase the overall detection effectiveness.
The author’s observation showed that most of the patterns shared a common feature, consisting of two different 90° angles. The process followed to match the found pattern, including rotation, consisting of a first segmentation according to the obstacle’s size, and a final matching based on the polylines’ shape. Segmentation computed the size of the polyline and checked that the detected obstacle had a size proportional to a human being. An obstacle that fulfilled the size requirements was marked the candidate as being a pedestrian.
In Figure 22, a few samples of the detected human legs are presented. In the top row, leg data for people walking straight ahead to the laser is shown, and the bottom row has been created based on the alongside walking. This pattern was checked under different conditions and movements, including the test for standing pedestrians facing the laser and lateral standing pedestrians. Regarding lateral standing pedestrians, the test showed that the pattern given by the laser included the two mentioned angles by getting the whole shape of a leg; however, in some cases, this method produced a false negative. Thus, in the proposed method, we used a combination of two predefined polylines in each cluster. This increased the number of angles that must be calculated, but it strictly improved the quality of removing false negative detections. We also identified one disadvantage of the polylines-based method. For clusters with irregular data corresponding to the legs with trousers (Figure 22d), the proposed method gave false information based on three angles in the cluster instead of two. This situation could only happen for a laser scanner with high resolution. The solution to the problem could be based on the examination, not only of one scanline, but the next three, and confirmation of the left and right leg appearance in a minimum of two scanlines. Based on our experiments, a similar situation was uncommon, but possible.
The proposed method should be used in situations where the working ranges of the used sensors are separable by the distance to the human. As a consequence, we created our database with different scenarios, namely indoor vision and thermal images, and also laser scanner data. We also performed experiments on the external dataset such as INRIA to strictly evaluate the human detection method for vision images. Our approach was based on the assumption that the vision and IR camera, as well as the laser scanner, operate independently, so we did not have a situation in which we have data from all sensors synchronized. In our case, the proposed method made the detection of people in the near distance possible, because when the FOV of the camera was exceeded, the human was out of camera FOV and thus the effectiveness of the vision method dropped to 0%. The evaluated results for our dataset with a different combination of modalities are presented in Table 2. Results for vision and infrared cameras were quite similar, which was predictable based on the assumption that our dataset has been acquired indoors. On the other hand, the laser scanner results were poor as a result of detecting human legs in the data without any other information. The improvement of the laser scanner with information from the computer vision/infrared camera with trajectory prediction and a leg modelling procedure improved all the quality measures, especially when we took into account the laser-only method and fused ones.
Because our method is developed specifically for ADAS systems, the LIPD (Laser and Image Pedestrian Detection) dataset [61] with 4823 frames was used in our experiments. The LIPD dataset was collected in an urban environment in the Coimbra University campus zone, under daylight conditions, using a vehicle moving with a low speed. The data could be calibrated using additional information available with a dataset; then we have corresponding data in the image and laser spaces. This dataset unfortunately contained only corresponding data: pairs of image–laser scanner data, not a laser data after the human would be out of the FOV, where the laser scanner was still able to collect data. We detected a human pose in the images strictly as in our method; however, in the last five images before, the human exceeded the FOV of the camera and was not seen on the images that the trajectory prediction predicted and where the laser scanner data was used to perform segmentation and human leg detection.
In Figure 23, two of the registered frames are presented regarding the main steps and two typical situations, i.e., one pedestrian and a large group of pedestrians. Figure 23c is especially interesting because it contains information about the bounding box from the human detection algorithm and corresponding laser data points after segmentation and leg detection. Based on Figure 23b, and by removing the proposed method of the leg confirmation method, we got an increased false detection percentage (about 19.2%) in the laser scanner data for the above dataset because there were many objects with a similar shape to the legs. What was most important, the TPR determined for the overall system increased to 0.923, and the FPR (false positive rate) decreased to 0.015 in comparison to the vision-only system, where it was respectively 0.901 and 0.024. The proposed system architecture, based on defined and described methods, presented one significant advantage: detection of a human pose could be properly processed for separate sensor’s modalities, especially when they were registered in separate distances between a human and a vehicle.
On the other hand, testing the proposed method for images with groups of pedestrians showed that despite effective the detection from images, the overall algorithm could give incomplete information about the number of pedestrians in a situation where it will be based on only one scanline. Using images only three pedestrians were detected (Figure 23f), when based only on the scanner laser, two pedestrians were detected. It was caused by too small of a number of points in the scanline, as well as the height at which the scan was made; for some heights, two legs of one pedestrian could be registered as one. The described situation was usually described by a decrease in the TPR value without a significant change in the FPR value. Therefore, the proposed optimization of the method based on the use of three subsequent scanlines increased the TPR from 0.082 to the previously mentioned 0.923. The issue of large groups was also important due to the strong dependence on the resolution of the laser scanner itself, which was compensated in proposed method by fusing the laser scanner with the vision system, determining the pedestrian trajectory, checking the number of people, and the parameters typical for the description of the human body.
5. Conclusions
The idea of human detection in real scenarios with a fusion of different modalities has been presented. The authors described in detail the process of human detection in different modalities by focusing on fusion methods. The proposed method consisted of well-defined modules such as detection of a human pose from vision/infrared images based on a combination of HOG and LBP features with neural network; prediction of the individual human trajectory with a Kalman filter; segmentation of the laser scanlines using an adaptive breakpoint detector with distance-based measures; and also leg modelling using a predefined combination of polylines. The use of the human tracking we proposed with the vision system simplified the segmentation of data from the laser scanner, narrowing the area of the detection of legs.
The presented work gives a solution for an intelligent application in advanced driver assistance systems, collision avoidance systems, danger estimation, and other road safety systems. In our research, equipment allowed the authors to obtain the high-quality data adequate for proper evaluation of the proposed method, and allowed for greater flexibility in the context of the configuration of the acquisition system, where hardware was equipped with standard interfaces for personal computer communication, software drivers, and SDK (Software Development Kit) libraries. Considering the significant increase in interest in the subject of advanced driver assistance and autonomous cars, the use of acquisition systems based on video cameras, laser scanners, and radars is becoming more common, which reduces the cost of hardware in real-world applications. In addition, the hardware used in real-world applications is equipped with dedicated interfaces, such as typical CAN, or MIPI interfaces (mobile industry processor interface), for communication with embedded platforms in cars.
Future work will be concentrated on a few well-recognized problems. First, the proposed system was developed for two combinations: a vision camera with a laser scanner and an infrared camera with a laser scanner. Most of the detection algorithms did not consider night-time and low-light images. In poor lightning conditions, the amount of light reaching from the pedestrian to the camera detector is much smaller than when the lighting conditions are good. The signal-to-noise ratio is then reduced, which in turn, results in a decrease of the pedestrian detection efficiency. For night-time and low-light conditions, the vision system will then produce poor results because the contrast between pedestrians and the background will be insufficient, thus the human detection part will generate wrong pedestrian candidates and an inappropriate trajectory. In real ADAS applications, vision cameras are more susceptible to disturbing light, such as oncoming vehicle headlights, than infrared cameras. Therefore, we proposed infrared cameras as an effective solution for non-contrast conditions because it allows for a clear visualization of the temperature difference between the pedestrian and the surroundings in poor light conditions, e.g., at night. In the proposed solution, we used vision and IR images independently in conjunction with a laser scanner. There are solutions based on vision and IR image fusion, where information from both modalities are combined with different weights, depending on lighting conditions. The IR features experiments with different weather conditions will be performed in the future, especially by testing the proposed system in various external conditions, i.e., night-time, low-light, fog, rain, and snow.
Second, the processing of such large volumes of data requires highly efficient processing units, such as a graphical processing unit (GPU), especially when the method combines such different sensor modalities and processing algorithms, including, e.g., neural networks. Third, the prediction of the trajectory should be investigated regarding the non-linear characteristic of the movement and velocity of the human, especially for ADAS applications. Next, the legs modelling method should take into account the number of points in the scan that depends on distance to the object. Finally, the use of neural networks and methods of deep learning in the future will allow reliable detection of pedestrians using images and data fusion from a laser scanner.
Author Contributions
S.B. designed the main idea and manuscript, designed the proposed methods and algorithms, wrote the manuscript; designed the human detection and trajectory prediction software, conceived and performed experiments, and corrected and revised the paper. R.W. designed the laser scanner acquisition and processing software, discussed the main idea; co-wrote the Results and Discussion section, performed experiments, and corrected and revised the paper. W.I. performed experiments, discussed the trajectory prediction methods, and revised the paper.
Funding
This research and the APC was funded by the Polish Ministry of Science and Higher Education grant number 02/010/BK_17/0060.
Conflicts of Interest
The authors declare no conflict of interest.
References
- Yuan, Y.; Lu, X.; Chen, X. Multi-spectral pedestrian detection. Signal Process. 2015, 110, 94–100. [Google Scholar] [CrossRef]
- Gharani, P.; Karimi, H.A. Context-aware obstacle detection for navigation by visually impaired. Image Vis. Comput. 2017, 64, 103–115. [Google Scholar] [CrossRef]
- Zhao, G.; Xiao, X.; Yuan, J.; Wah, G. Fusion of 3-D-LIDAR and camera data for scene parsing. J. Vis. Commun. Image R. 2014, 25, 165–183. [Google Scholar] [CrossRef]
- Arrspide, J.; Salgado, L.; Camplani, M. Image-based on-road vehicle detection using cost-effective Histograms of Oriented Gradients. J. Vis. Commun. Image Represent. 2013, 24, 1182–1190. [Google Scholar] [CrossRef]
- Zhou, D.; Frémont, V.; Quost, B.; Dai, Y.; Li, H. Moving object detection and segmentation in urban environments from a moving platform. Image Vis. Comput. 2017, 68, 76–87. [Google Scholar] [CrossRef] [Green Version]
- Ouyang, Y.; Zhang, S.; Zhang, Y. Based on cluster tree human action recognition algorithm for monocular video. J. Comput. Inf. Syst. 2011, 7, 4082–4089. [Google Scholar]
- He, G.; Chen, Q.; Jiang, D.; Lu, X.; Yuan, Y. A double-region learning algorithm for counting the number of pedestrians in subway surveillance videos. Eng. Appl. Artif. Intell. 2017, 64, 302–314. [Google Scholar] [CrossRef]
- Enzweiler, M.; Gavrila, D.M. Monocular pedestrian detection: Survey and experiments. IEEE Trans. Pattern Anal. Mach. Intell. 2009, 31, 2179–2195. [Google Scholar] [CrossRef] [PubMed]
- Parisot, P.; De Vleeschouwer, C. Scene-specific classifier for effective and efficient team sport players detection from a single calibrated camera. Comput. Vis. Image Underst. 2017, 159, 74–88. [Google Scholar] [CrossRef] [Green Version]
- Mrazova, I.; Hrincar, M. Fast and reliable detection of hockey players. Procedia Comput. Sci. 2013, 20, 121–127. [Google Scholar] [CrossRef]
- Zaki, M.H.; Sayed, T. Using automated walking gait analysis for the identification of pedestrian attributes. Trans. Res. Part C Emerg. Technol. 2014, 48, 16–36. [Google Scholar] [CrossRef]
- Ali, I.; Dailey, M.N. Multiple human tracking in high-density crowds. Image Vis. Comput. 2012, 30, 966–977. [Google Scholar] [CrossRef]
- Moutzouris, A.; Martinez-del-Rincon, J.; Nebel, J.-C.; Makris, D. Efficient tracking of human poses using a manifold hierarchy. Comput. Vis. Image Underst. 2015, 132, 75–86. [Google Scholar] [CrossRef] [Green Version]
- Ibañez, R.; Soria, A.; Teyseyre, A.; Campo, M. Easy gesture recognition for Kinect. Adv. Eng. Softw. 2014, 76, 171–180. [Google Scholar] [CrossRef]
- Cosma, C.; Brehar, R.; Nedevschi, S. Pedestrians detection using a cascade of LBP and HOG classifiers. In Proceedings of the IEEE International Conference on ICCP, Cluj-Napoca, Romania, 5–7 September 2013; pp. 69–75. [Google Scholar]
- Ziebinski, A.; Cupek, R.; Grzechca, D.; Chruszczyk, L. Review of advanced driver assistance systems (ADAS). AIP Conf. Proc. 2017, 1906, 120002. [Google Scholar]
- Gandhi, T.; Trivedi, M. Pedestrian protection systems: Issues, survey, and challenges. IEEE Trans. Intell. Transp. Syst. 2007, 8, 413–430. [Google Scholar] [CrossRef]
- Geronimo, D.; Lopez, A.M.; Sappa, A.D.; Graf, T. Survey on pedestrian detection for advanced driver assistance systems. IEEE Trans. Pattern Anal. Mach. Intell. 2010, 32, 1239–1258. [Google Scholar] [CrossRef] [PubMed]
- National Highway Traffic Safety Administration. Traffic Safety Facts 2015 Data—Pedestrians; Publication No. DOT-HS-812-375; US Department of Transportation: Washington, DC, USA, 2015. Available online: https://crashstats.nhtsa.dot.gov/Api/Public/ViewPublication/812375 (accessed on 20 December 2017).
- Centers for Disease Control and Prevention. WISQARS (Web-Based Injury Statistics Query and Reporting System); US Department of Health and Human Services, CDC: Atlanta, GA, USA, 2015. Available online: http://www.cdc.gov/injury/wisqars (accessed on 20 December 2017).
- Benenson, R.; Matthias, M.; Tuytrlaars, T.; Van Gool, L. Seeking the strongest rigid detector. In Proceedings of the IEEE Conference on Computer Vision and Pattern Recognition, Portland, Oregon, 25–27 June 2013; pp. 3666–3673. [Google Scholar]
- Luo, P.; Tian, Y.; Wang, X.; Tang, X. Switchable deep network for pedestrian detection. In Proceedings of the 2014 IEEE Conference on Computer Vision and Pattern Recognition, Columbus, OH, USA, 23–28 June 2014; pp. 899–906. [Google Scholar]
- Zhang, S.; Bauckhage, C.; Cremers, A. Informed haar-like features improve pedestrian detection. In Proceedings of the 2014 IEEE Conference on Computer Vision and Pattern Recognition, Columbus, OH, USA, 23–28 June 2014; pp. 947–954. [Google Scholar]
- Viola, P.; Jones, M. Rapid object detection using a boosted cascade of simple features. In Proceedings of the IEEE Conference on Computer Vision and Pattern Recognition, Kauai, HI, USA, 8–14 December 2001; pp. 511–518. [Google Scholar]
- Monteiro, G.; Peixoto, P.; Nunes, U. Vision-based pedestrian detection using Haar-like features. Robotica 2007, 24, 46–50. [Google Scholar]
- Dalal, N.; Triggs, B. Histograms of oriented gradients for human detection. In Proceedings of the IEEE Computer Society Conference on Computer Vision and Pattern Recognition, San Diego, CA, USA, 20–25 June 2005; pp. 1–8. [Google Scholar]
- Watanabe, T.; Ito, S.; Yokoi, K. Co–occurrence histograms of oriented gradients for pedestrian detection. IPSJ Trans. Comput. Vis. Appl. 2010, 2, 39–47. [Google Scholar] [CrossRef]
- Zhu, Q.; Avidan, S.; Yeh, M.; Cheng, K. Fast Human Detection Using a Cascade of Histograms of Oriented Gradients. In Proceedings of the IEEE Conference Computer Vision and Pattern Recognition (CVPR), New York, NY, USA, 17–22 June 2006; pp. 1491–1498. [Google Scholar]
- Park, W.-J.; Kim, D.-H.; Suryanto; Lyuh, C.-G.; Roh, T.M.; Ko, S.-J. Fast human detection using selective block-based HOG-LBP. In Proceedings of the IEEE International Conference on Image Processing, Orlando, FL, USA, 30 September–3 October 2012; pp. 601–604. [Google Scholar]
- Hussain, S.; Triggs, B. Feature sets and dimensionality reduction for visual object detection. In Proceedings of the British Machine Vision Conference, Dundee, UK, 29 August–2 September 2010; pp. 1–10. [Google Scholar]
- Zheng, Y.; Shen, C.; Huang, X. Pedestrian detection using center-symmetric local binary patterns. In Proceedings of the IEEE International Conference on Image Processing, Hong Kong, China, 26–29 September 2010; pp. 3497–3500. [Google Scholar]
- Nguyen, D.T.; Zong, Z.; Li, W.; Ogunbona, P. Object detection using non-redundant local binary patterns. In Proceedings of the IEEE International Conference on Image Processing, Hong Kong, China, 26–29 September 2010; pp. 4609–4612. [Google Scholar]
- Huang, D.; Shan, C.; Ardabilian, W.; Wang, Y.; Chen, L. Local Binary Patterns and Its Application to Facial Image Analysis: A Survey. IEEE Trans. Syst. Man Cybern. Part C 2011, 41, 765–781. [Google Scholar] [CrossRef]
- Ma, L.; Yang, X.; Xu, Y.; Zhu, J. Human Identification Using Body Prior and Generalized EMD. In Proceedings of the 18th IEEE International Conference Image, Brussels, Belgium, 11–14 September 2011; pp. 1441–1444. [Google Scholar]
- Rani, M.P.; Arumugam, G. An efficient gait recognition system for human identification using modified ICA. Int. J. Comput. Sci. Inf. Technol. 2010, 2, 55–67. [Google Scholar]
- García, F.; García, J.; Ponz, A.; de la Escalera, A.; Armingol, J.M. Context aided pedestrian detection for danger estimation based on laser scanner and computer vision. Expert Syst. Appl. 2014, 41, 6646–6661. [Google Scholar] [CrossRef] [Green Version]
- Benezeth, Y.; Emile, B.; Laurent, H.; Rosenberger, C. A real time human detection system based on far infrared vision. Lecture Notes Comput. Sci. 2008, 5099, 76–84. [Google Scholar]
- Liu, Q.; Zhuang, J.; Ma, J. Robust and fast pedestrian detection method for far–infrared automotive driving assistance systems. Infrared Phys. Technol. 2013, 60, 288–299. [Google Scholar] [CrossRef]
- Zhao, X.; He, Z.; Zhang, S.; Liang, D. Robust pedestrian detection in thermal infrared imagery using a shape distribution histogram feature and modified sparse representation classification. Pattern Recognit. 2015, 48, 1947–1960. [Google Scholar] [CrossRef]
- Szarvas, M.; Yoshizawa, A.; Yamamoto, M.; Ogata, J. Pedestrian detection with convolutional neural networks. In Proceedings of the IEEE Intelligent Vehicles Symposium, Las Vegas, NV, USA, 6–8 June 2005; pp. 224–229. [Google Scholar]
- Peng, P.; Tian, Y.; Wang, Y.; Li, J.; Huang, T. Robust multiple cameras pedestrian detection with multi-view Bayesian network. Pattern Recognit. 2015, 48, 1760–1772. [Google Scholar] [CrossRef]
- Cui, J.; Zha, H.; Zhao, H.; Shibasaki, R. Laser-based detection and tracking of multiple people in crowds. Comput. Vis. Image Underst. 2007, 106, 300–312. [Google Scholar] [CrossRef]
- Tsogas, M.; Floudas, N.; Lytrivis, P.; Amditis, A.; Polychronopoulos, A. Combined lane and road attributes extraction by fusing data from digital map, laser scanner and camera. Inf. Fusion 2011, 12, 28–36. [Google Scholar] [CrossRef]
- Drage, T.H.; Kalinowski, J.; Braunl, T. Development of an Autonomous Formula SAE Car with Laser Scanner and GPS. In Proceedings of the IFAC, Cape Town, South Africa, 24–29 August 2014; Volume 47, pp. 2652–2657. [Google Scholar]
- Ozaki, M.; Kakimuma, K.; Hashimoto, M.; Takahashi, K. Laser-Based Pedestrian Tracking in Outdoor Environments by Multiple Mobile Robots. Sensors 2012, 12, 14489–14507. [Google Scholar] [CrossRef] [PubMed] [Green Version]
- Kawarazaki, N.; Tetsuya Kuwae, L.; Yoshidome, T. Development of Human Following Mobile Robot System Using Laser Range Scanner. Procedia Comput. Sci. 2015, 76, 455–460. [Google Scholar] [CrossRef]
- Premebida, C.; Ludwig, O.; Silva, M.; Nunes, U. A cascade classifier applied in pedestrian detection using laser and image-based features. In Proceedings of the IEEE Intelligent Transportation Systems Conference on ITSC, Madeira Island, Portugal, 19–22 September 2010; pp. 1153–1159. [Google Scholar]
- Spinello, L.; Siegwart, R. Human detection using multimodal and multidimensional features. In Proceedings of the 2008 IEEE International Conference on Robotics and Automation, Pasadena, CA, USA, 19–23 May 2008; pp. 3264–3269. [Google Scholar]
- Weng, J.; Cohen, P.; Herniou, M. Camera calibration with distortion models and accuracy evaluation. IEEE Trans. Pattern Anal. Mach. Intell. 1992, 14, 965–980. [Google Scholar] [CrossRef]
- Zhang, Z. A Flexible New Technique for Camera Calibration. IEEE Trans. Pattern Anal. Mach. Intell. 2000, 22, 1330–1334. [Google Scholar] [CrossRef]
- Zhang, Q.; Pless, R. Extrinsic Calibration of a Camera and Laser Range Finder (improves camera intrinsic calibration). In Proceedings of the IEEE International Conference on Intelligent Robots and Systems, Sendai, Japan, 28 September–2 October 2004; pp. 2301–2306. [Google Scholar]
- Scaramuzza, D.; Harati, A.; Siegwart, R. Extrinsic self-calibration of a camera and a 3-D laser range finder from natural scenes. In Proceedings of the IEEE/RSJ International Intelligent Robots and Systems, San Diego, CA, USA, 29 October–2 November 2007; pp. 4164–4169. [Google Scholar]
- Budzan, S. Human detection in low resolution thermal images based on combined HOG classifier. Computer vision and graphics. In Proceedings of the International Conference, ICCVG, Lecture Notes in Computer Science, Warsaw, Poland, 19–21 September 2016; Volume 9972, pp. 304–315. [Google Scholar]
- Ojala, T.; Pietikäinen, M.; Mäenpää, T. Multiresolution gray-scale and rotation invariant texture classification with local binary patterns. IEEE Trans. Pattern Anal. Mach. Intell. 2002, 24, 971–987. [Google Scholar] [CrossRef] [Green Version]
- Luber, M.; Stork, J.; Tipaldi, G.; Arras, K. People Tracking with Human Motion Predictions from Social Forces. In Proceedings of the IEEE International Conference on Robotics and Automation (ICRA), Anchorage, AK, USA, 3–7 May 2010; pp. 464–469. [Google Scholar]
- Kratz, L.; Nishino, K. Tracking pedestrians using local spatio-temporal motion patterns in extremely crowded scenes. IEEE Trans. Pattern Anal. Mach. Intell. 2011, 34, 967–1002. [Google Scholar] [CrossRef] [PubMed]
- Hakura, T.; Yurozu, A.; Takahashi, M. Model-based pedestrian trajectory prediction using environmental sensor for mobile robots navigation. Int. J. Adv. Comput. Sci. Appl. 2017, 8, 95–101. [Google Scholar]
- Bouwmans, T. Recent advanced statistical background modeling for foreground detection: A systematic survey. Recent Pat. Comput. Sci. 2011, 4, 147–176. [Google Scholar]
- Welch, G.; Bishop, G. An introduction to the Kalman filter. In Proceedings of the ACM SIGGRAPH, Los Angeles, CA, USA, 12–17 August 2001; pp. 1–16. [Google Scholar]
- Borges, G.A.; Aldon, M.J. Line extraction in 2-D range images for mobile robotics. J. Intell. Robot. Syst. 2004, 40, 267–297. [Google Scholar] [CrossRef]
- Premebida, C.; Nunes, U. Laser and Image Pedestrian Detection Dataset—LIPD. Available online: http://www2.isr.uc.pt/~cpremebida/dataset (accessed on 27 August 2018).
Figure 1.
Series of sample acquired images: (a) vision images, and (b) infrared images.

Figure 2.
Block diagram of the proposed method.

Figure 3.
Test platform equipped with vision camera, infrared camera, and laser scanner.

Figure 4.
Calibration chessboard different position images: (a,b) vision images, and (c) infrared image.
Figure 4.
Calibration chessboard different position images: (a,b) vision images, and (c) infrared image.

Figure 5.
Images after calibration process: (a,b) vision images, and (c) infrared image.

Figure 6.
Images before and after the calibration process: (a,d) before calibration of vision camera and laser, (b,e) zoom of the legs region before calibration, and (c,f) zoom of the legs region after calibration.
Figure 6.
Images before and after the calibration process: (a,d) before calibration of vision camera and laser, (b,e) zoom of the legs region before calibration, and (c,f) zoom of the legs region after calibration.

Figure 7.
Selected quality measures for HOG-SVM, HOG-neural networks, and the proposed method.

Figure 8.
Images with checked ROIs: (a) vision images, and (b) infrared images.

Figure 9.
Results for human pose ROI presented on Figure 9a: (a) height and width of ROI, and (b) position on X of the ROI.
Figure 9.
Results for human pose ROI presented on Figure 9a: (a) height and width of ROI, and (b) position on X of the ROI.

Figure 10.
Predicted human movement trajectory.

Figure 11.
Raw measurements and corresponding image of a complex scene.

Figure 12.
The clustered laser scanner data. Green dots represent the start of the cluster, black dots represent the end of the cluster, and blue plots represent clusters from laser data.
Figure 12.
The clustered laser scanner data. Green dots represent the start of the cluster, black dots represent the end of the cluster, and blue plots represent clusters from laser data.

Figure 13.
The scanline with added human pose borders are represented by red lines. Green dots represent the start of the cluster, black dots represent the end of the cluster, and blue plots represent clusters from laser data.
Figure 13.
The scanline with added human pose borders are represented by red lines. Green dots represent the start of the cluster, black dots represent the end of the cluster, and blue plots represent clusters from laser data.

Figure 14.
Samples of the legs scanline (a) left leg, (b) right leg, and (c) polylines definition.

Figure 15.
The scanline with marked human legs clusters. Red lines represent human pose borders, and blue plots represent segmented laser data.
Figure 15.
The scanline with marked human legs clusters. Red lines represent human pose borders, and blue plots represent segmented laser data.

Figure 16.
Main application window (a) and software module for scan pattern analysis and scan to image data fusion (b).
Figure 16.
Main application window (a) and software module for scan pattern analysis and scan to image data fusion (b).

Figure 17.
Simplified data flow diagram.

Figure 18.
Processed images: (a) after human detection, and (b) merged vision and laser data.

Figure 19.
The processed laser scanner data: (a) raw, (b) after breakpoint generation, (c) fused with ROIs, (d) after classification, (e) removed obstacles, and (f) rescaled final result with breakpoints. Dots represent the beginning and end of the cluster, blue plots represent clustered laser data, red and green lines represent pedestrians’ poses, and red plots represent detected pedestrians in the laser data.

Figure 20.
Raw scanner data with corresponding vision image, (a) first frame, (b) second frame.

Figure 21.
Extracted trajectories of two pedestrians walking (a) straight-ahead, and (b) alongside.


Figure 22.
Scans of the detected leg region for: (a–d) walking straight-ahead, and (e–h) walking alongside.
Figure 22.
Scans of the detected leg region for: (a–d) walking straight-ahead, and (e–h) walking alongside.

Figure 23.
Sample of the LIPD images: (a,d) original frame, (b,e) calibrated image with laser scanner data (green points), and (c,f) detected human and corresponding laser data points in a cluster.
Figure 23.
Sample of the LIPD images: (a,d) original frame, (b,e) calibrated image with laser scanner data (green points), and (c,f) detected human and corresponding laser data points in a cluster.


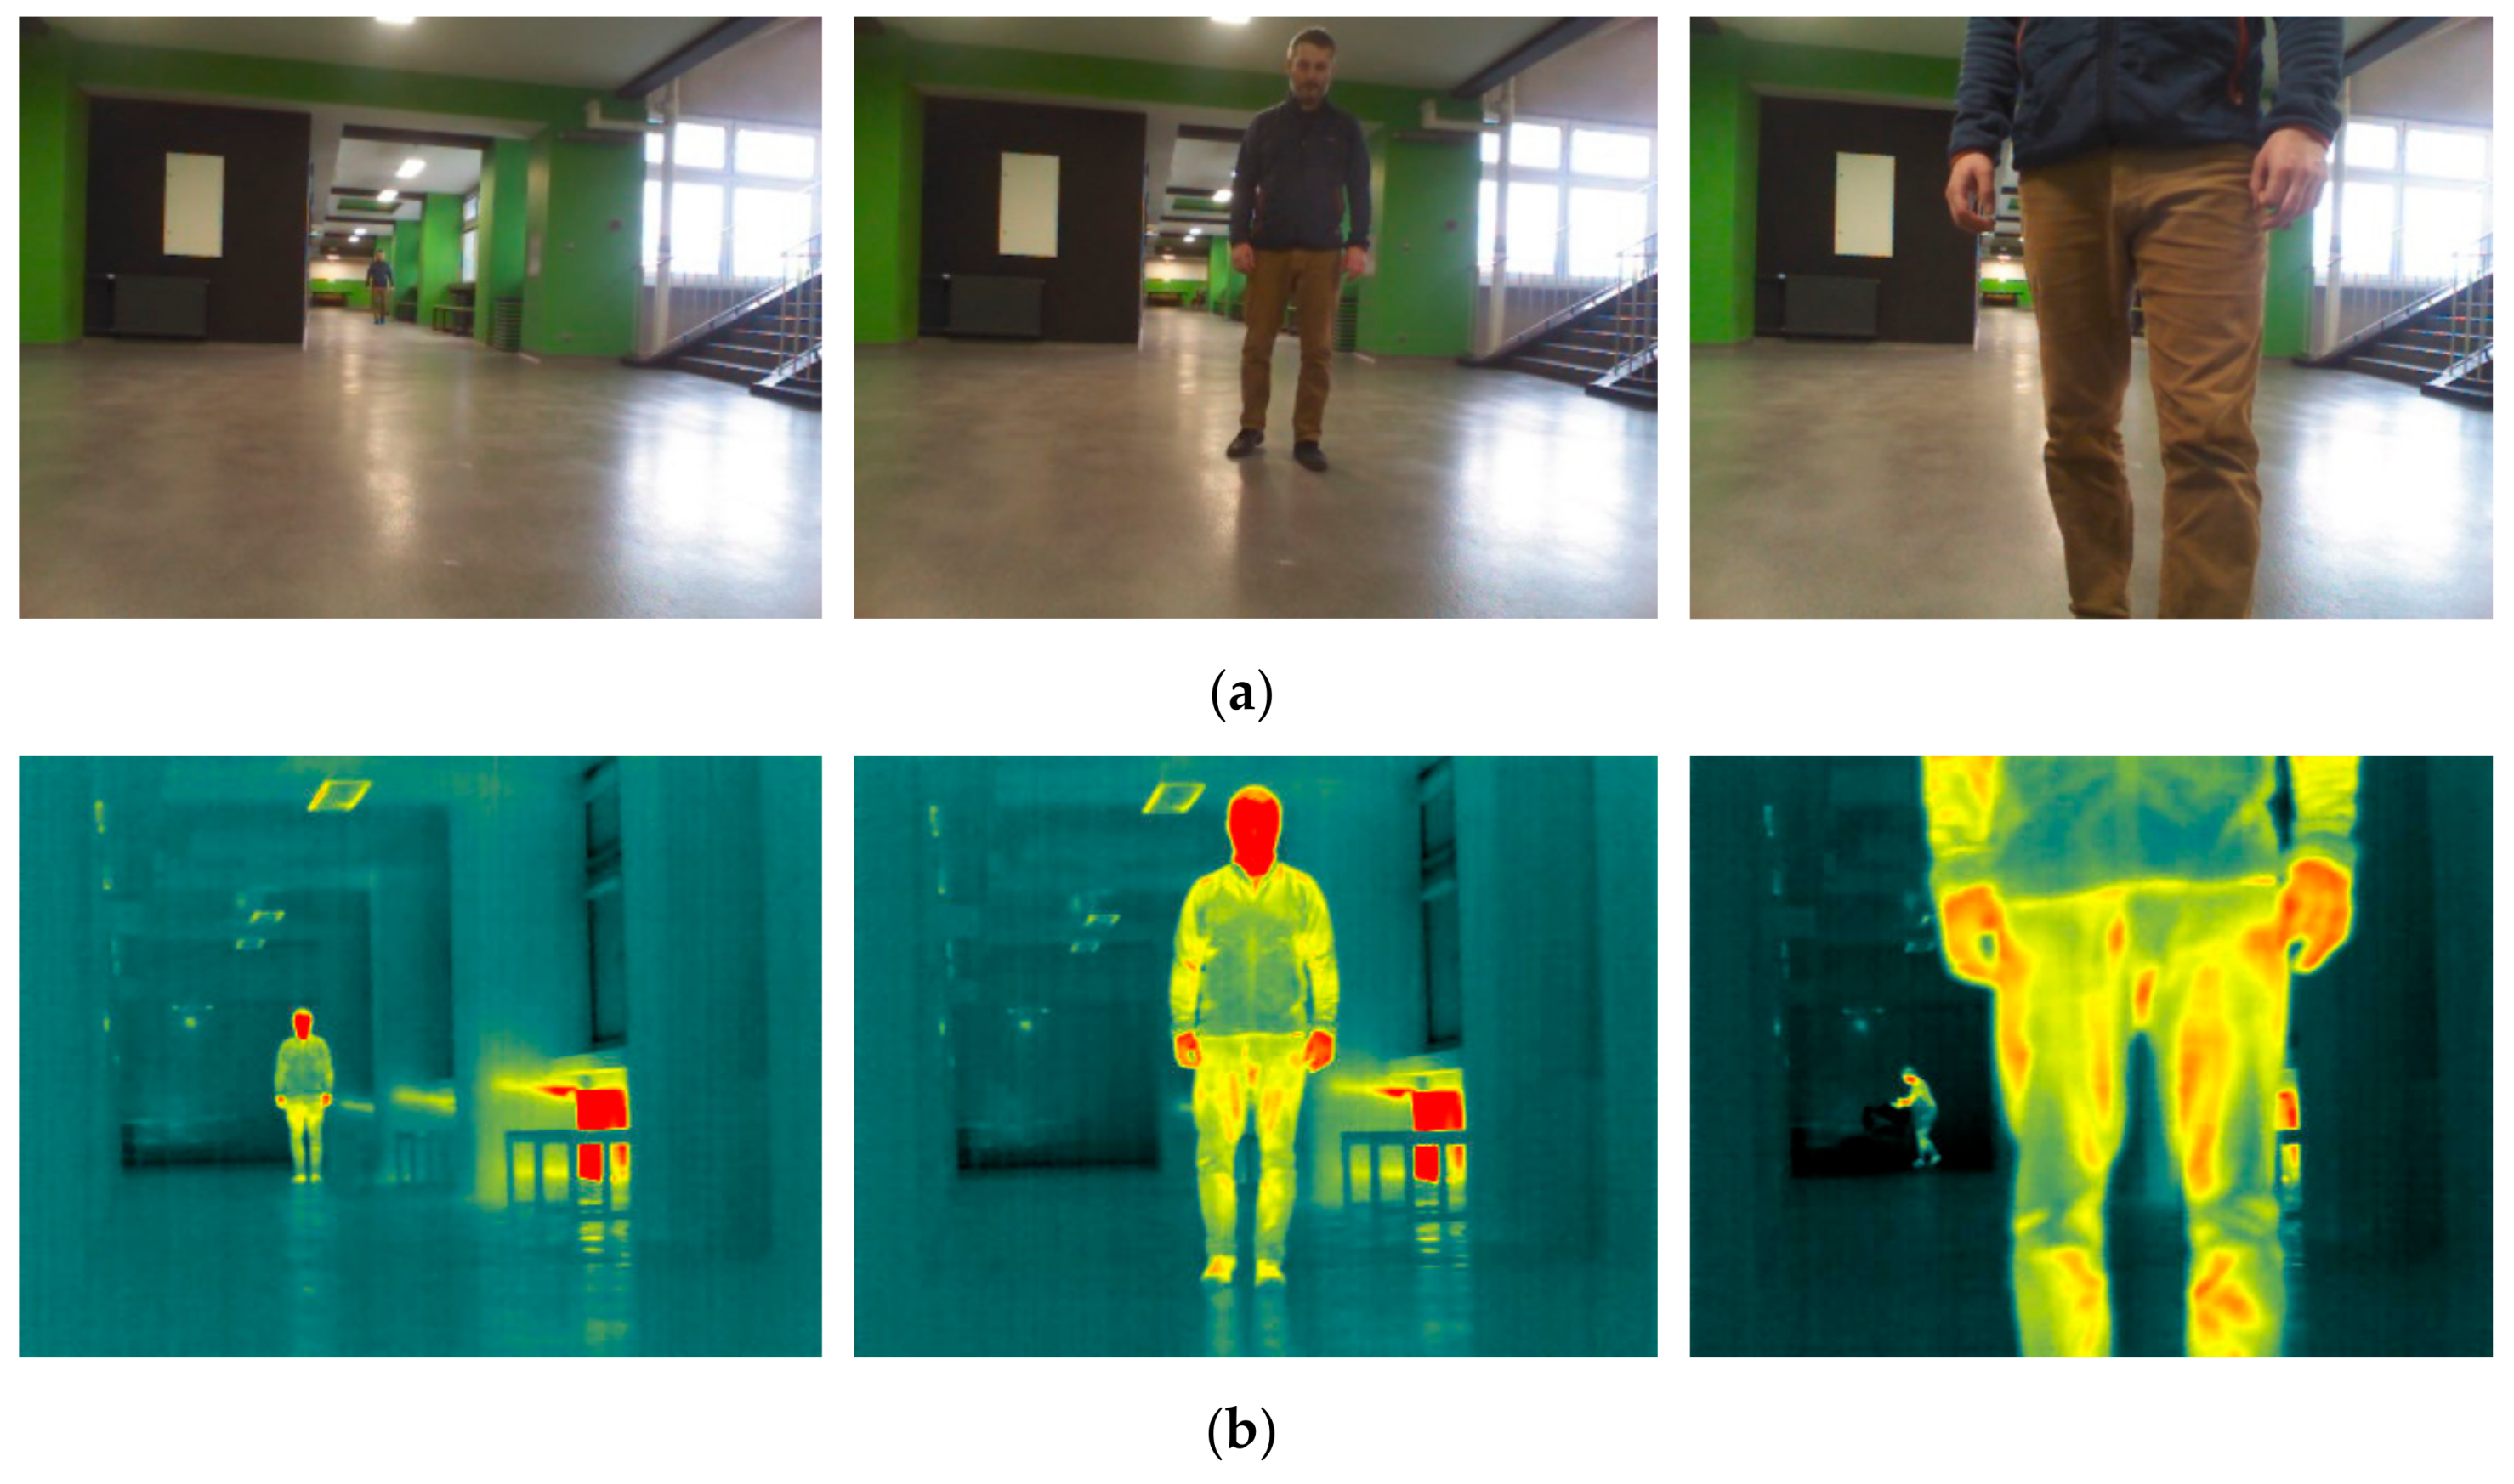
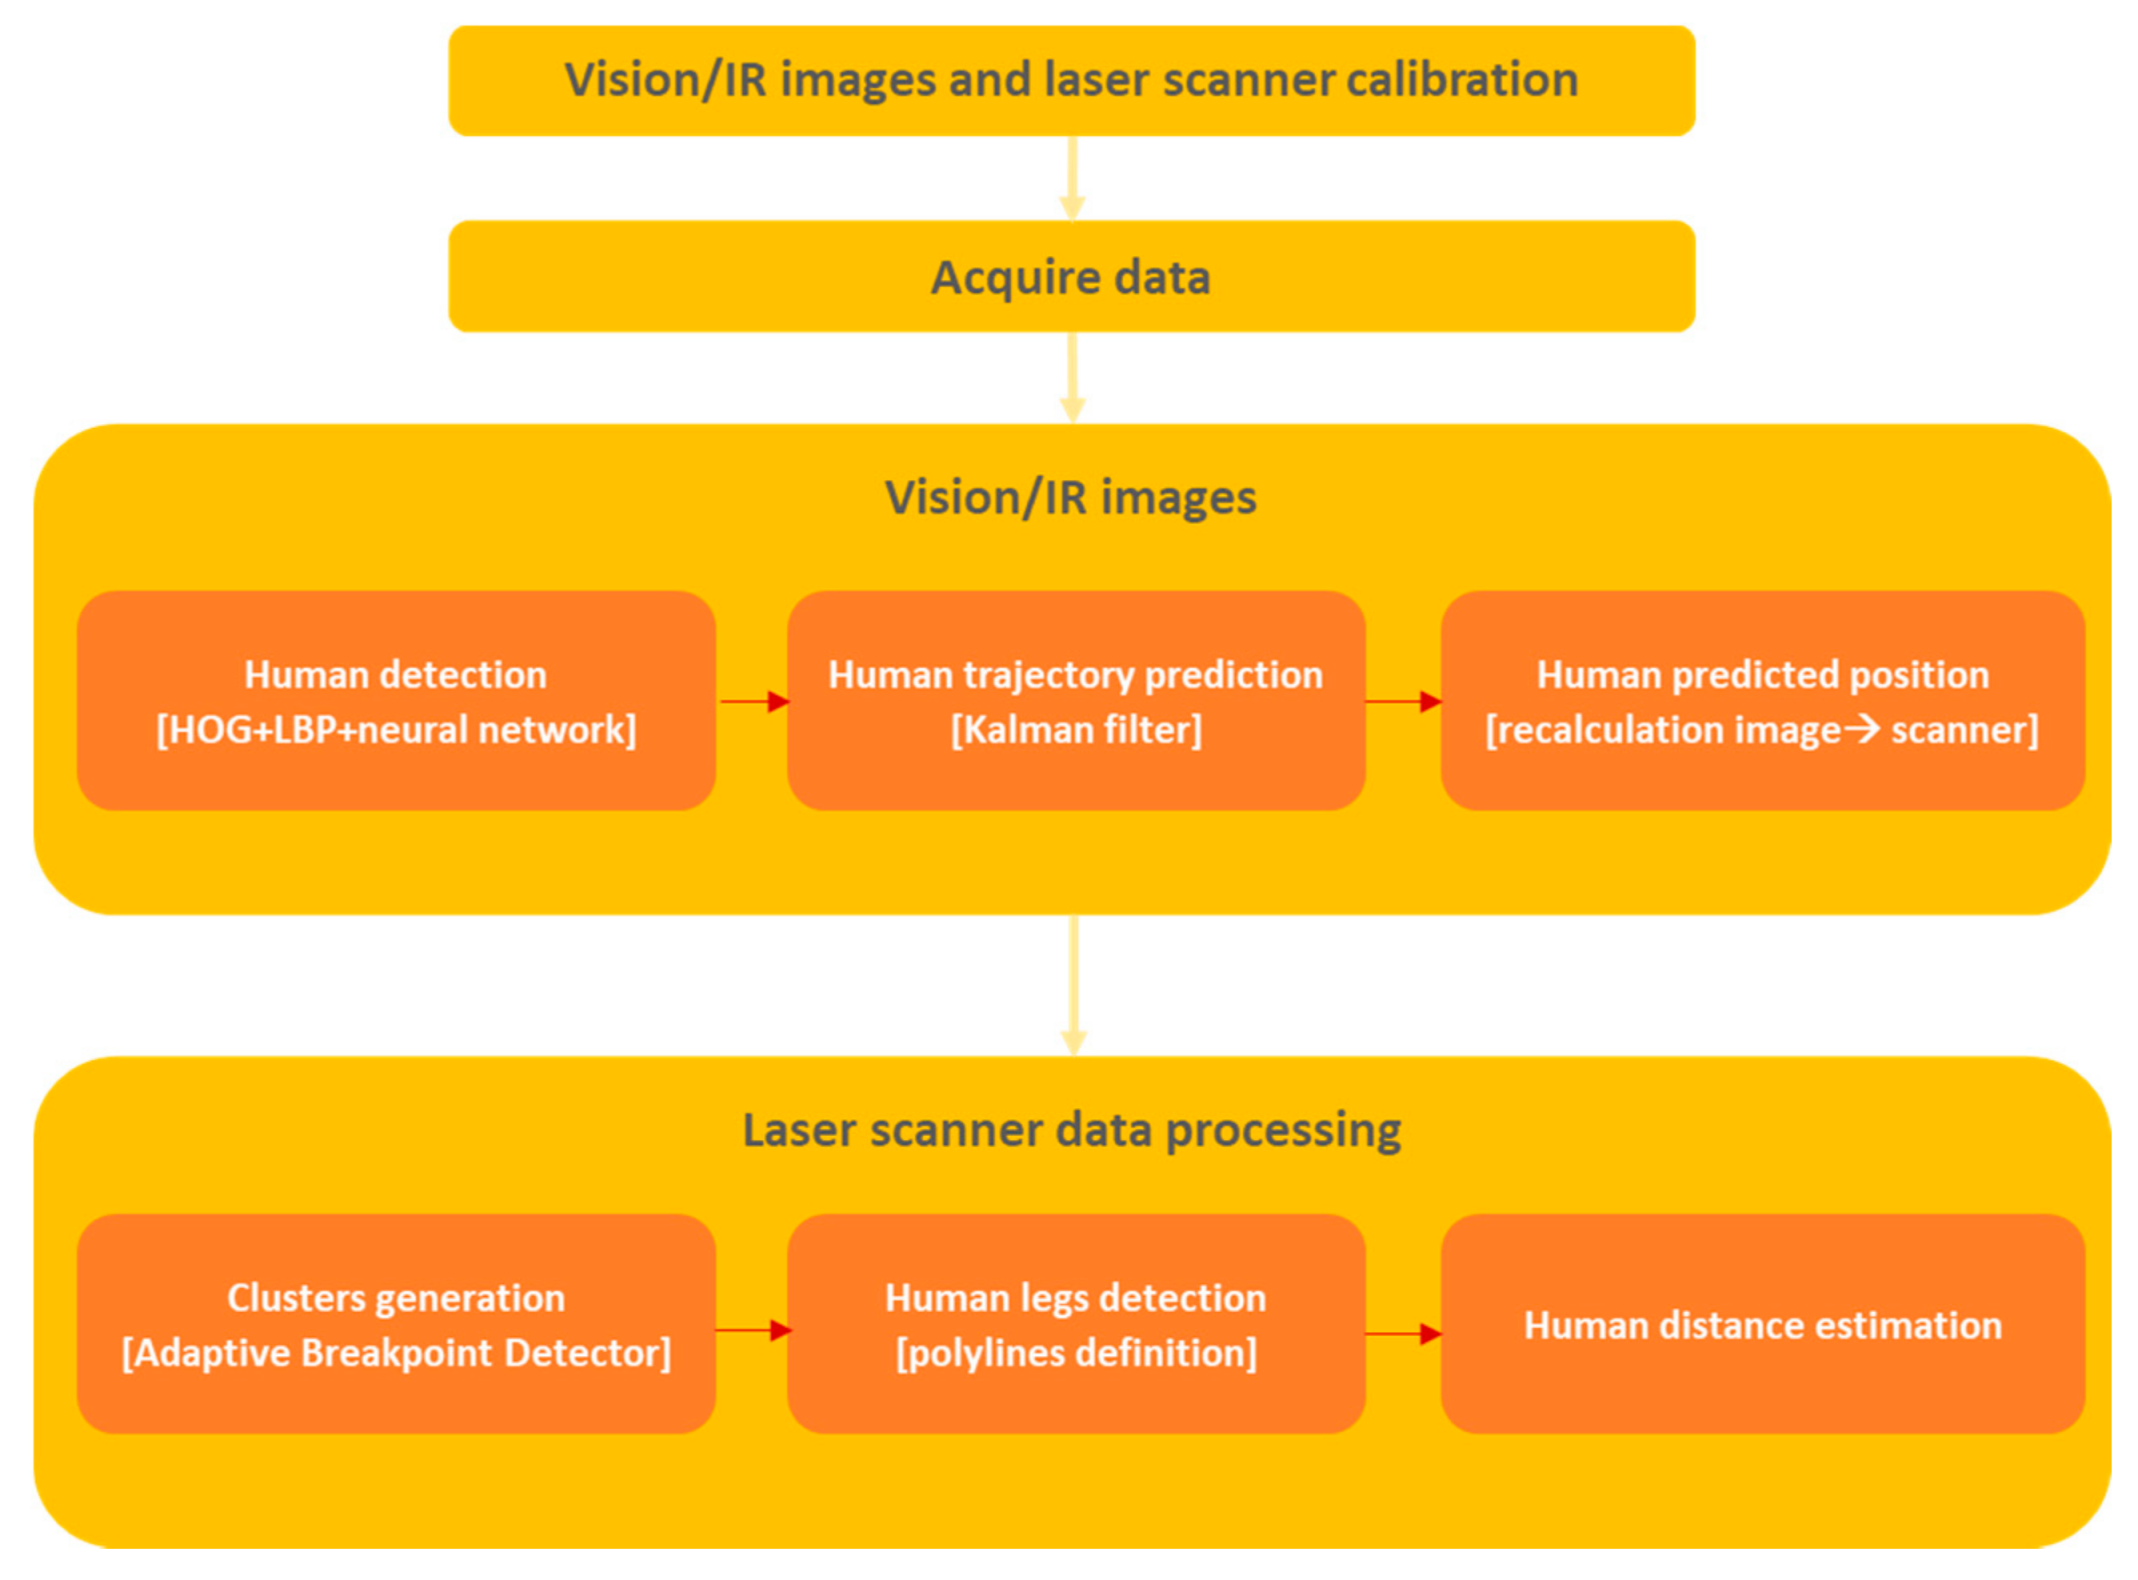
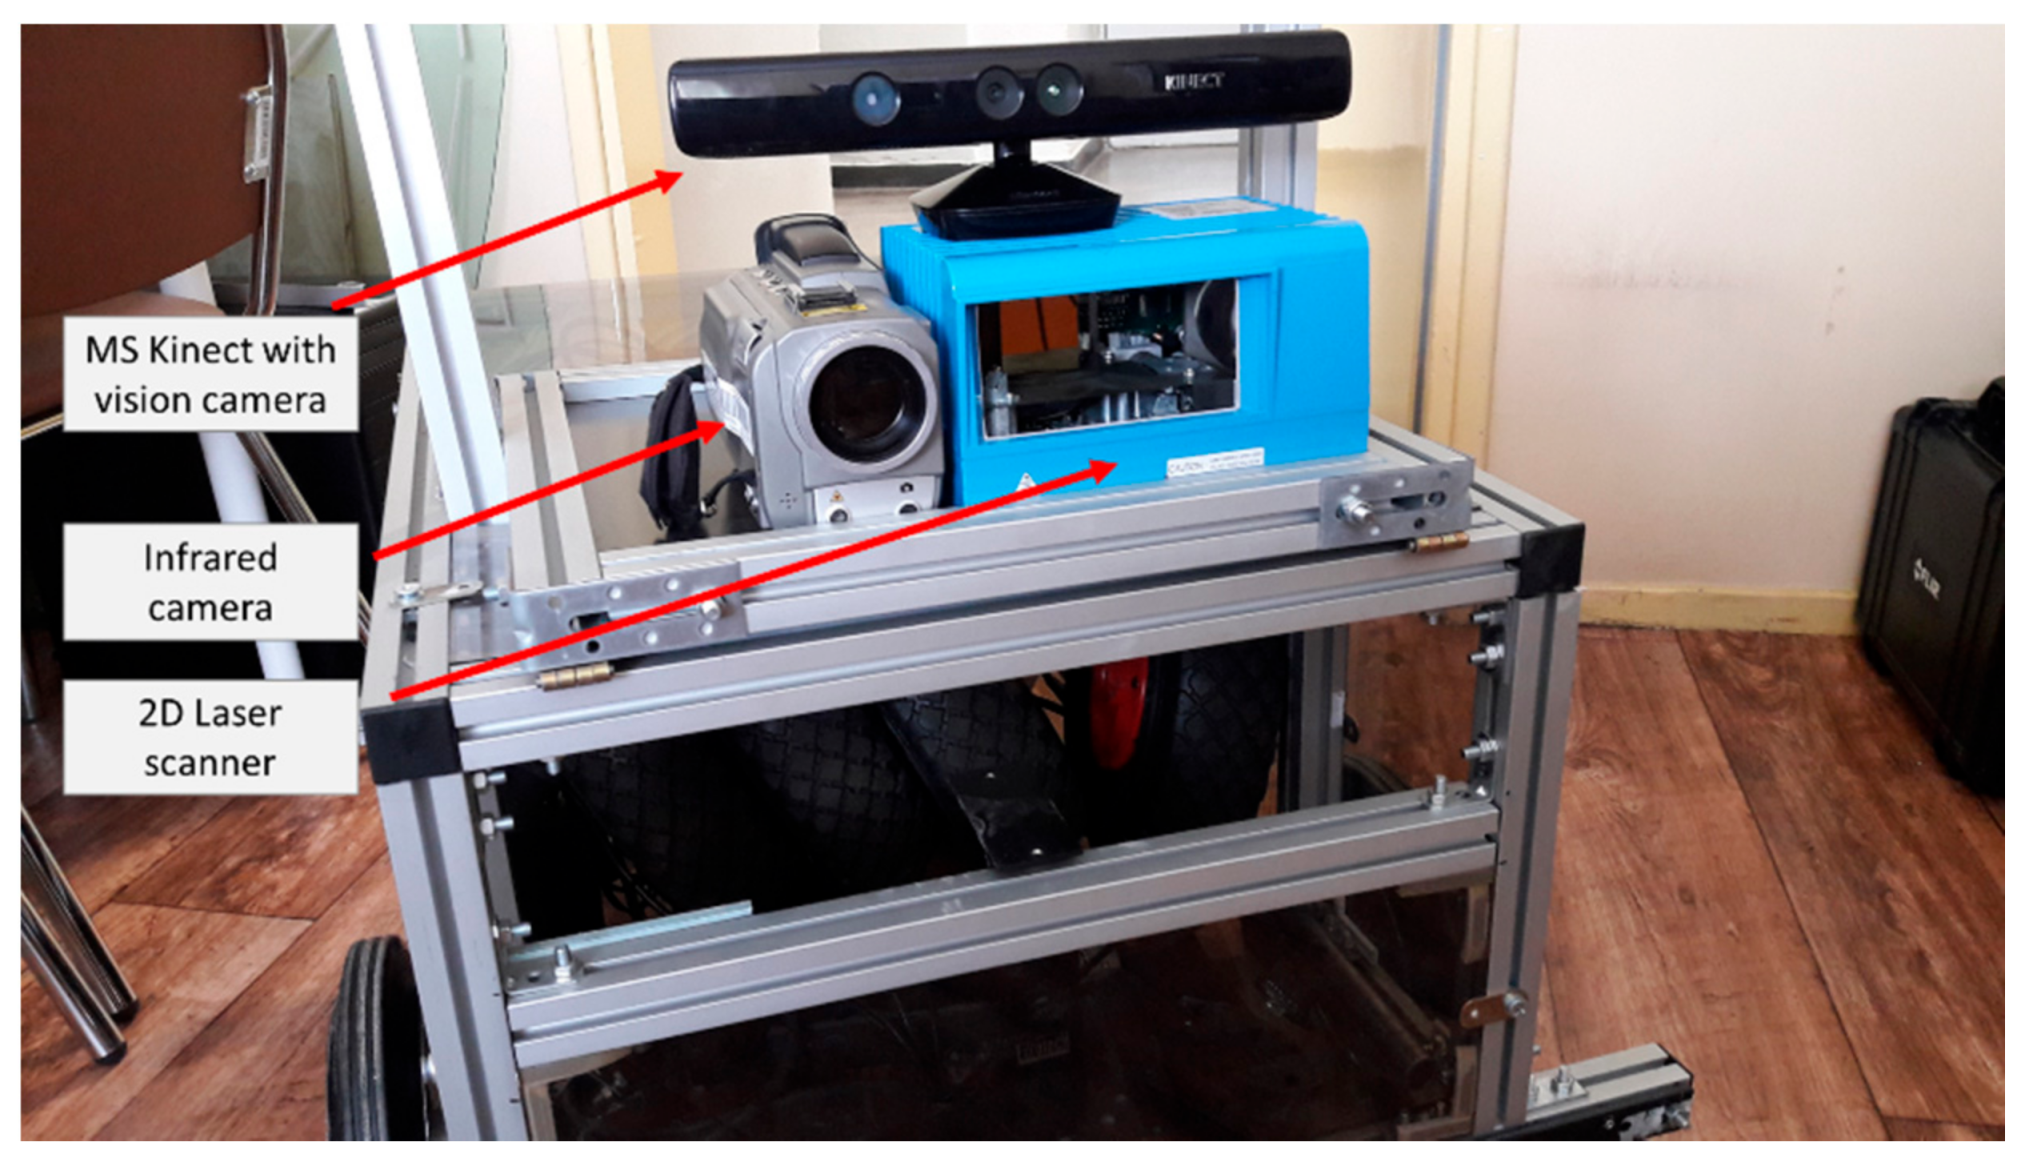
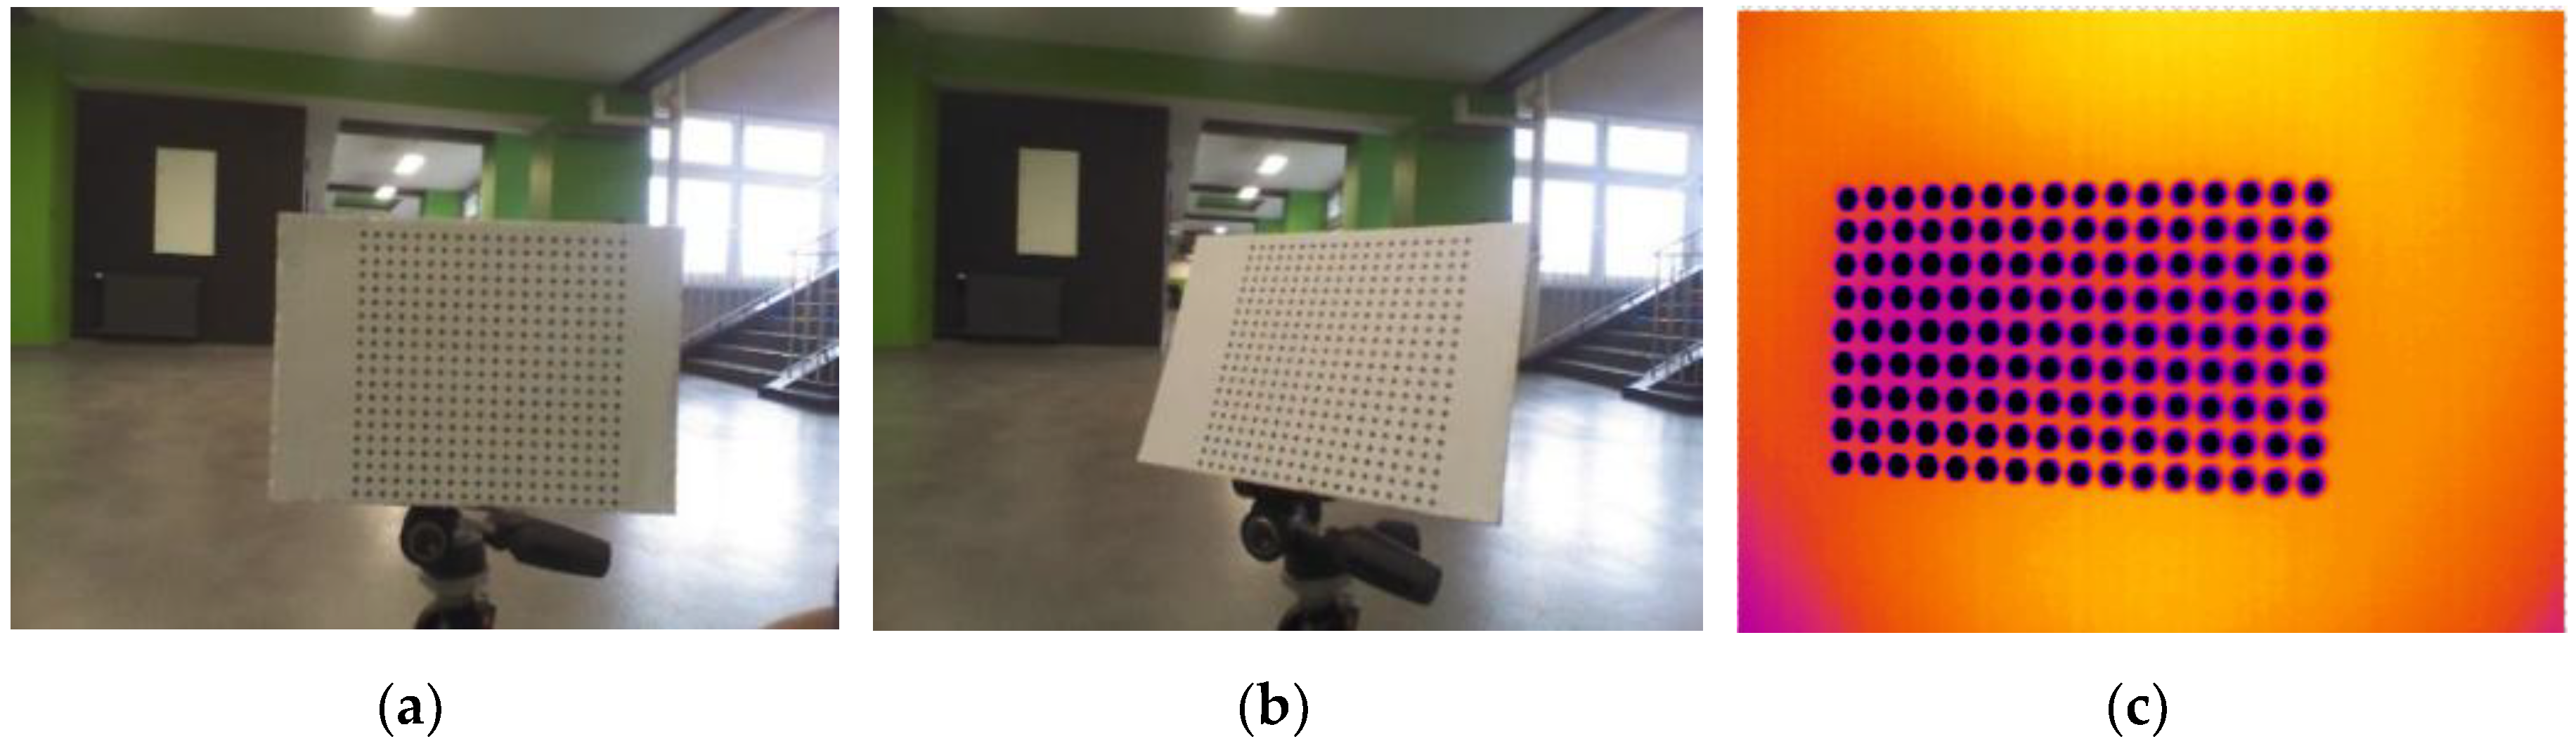
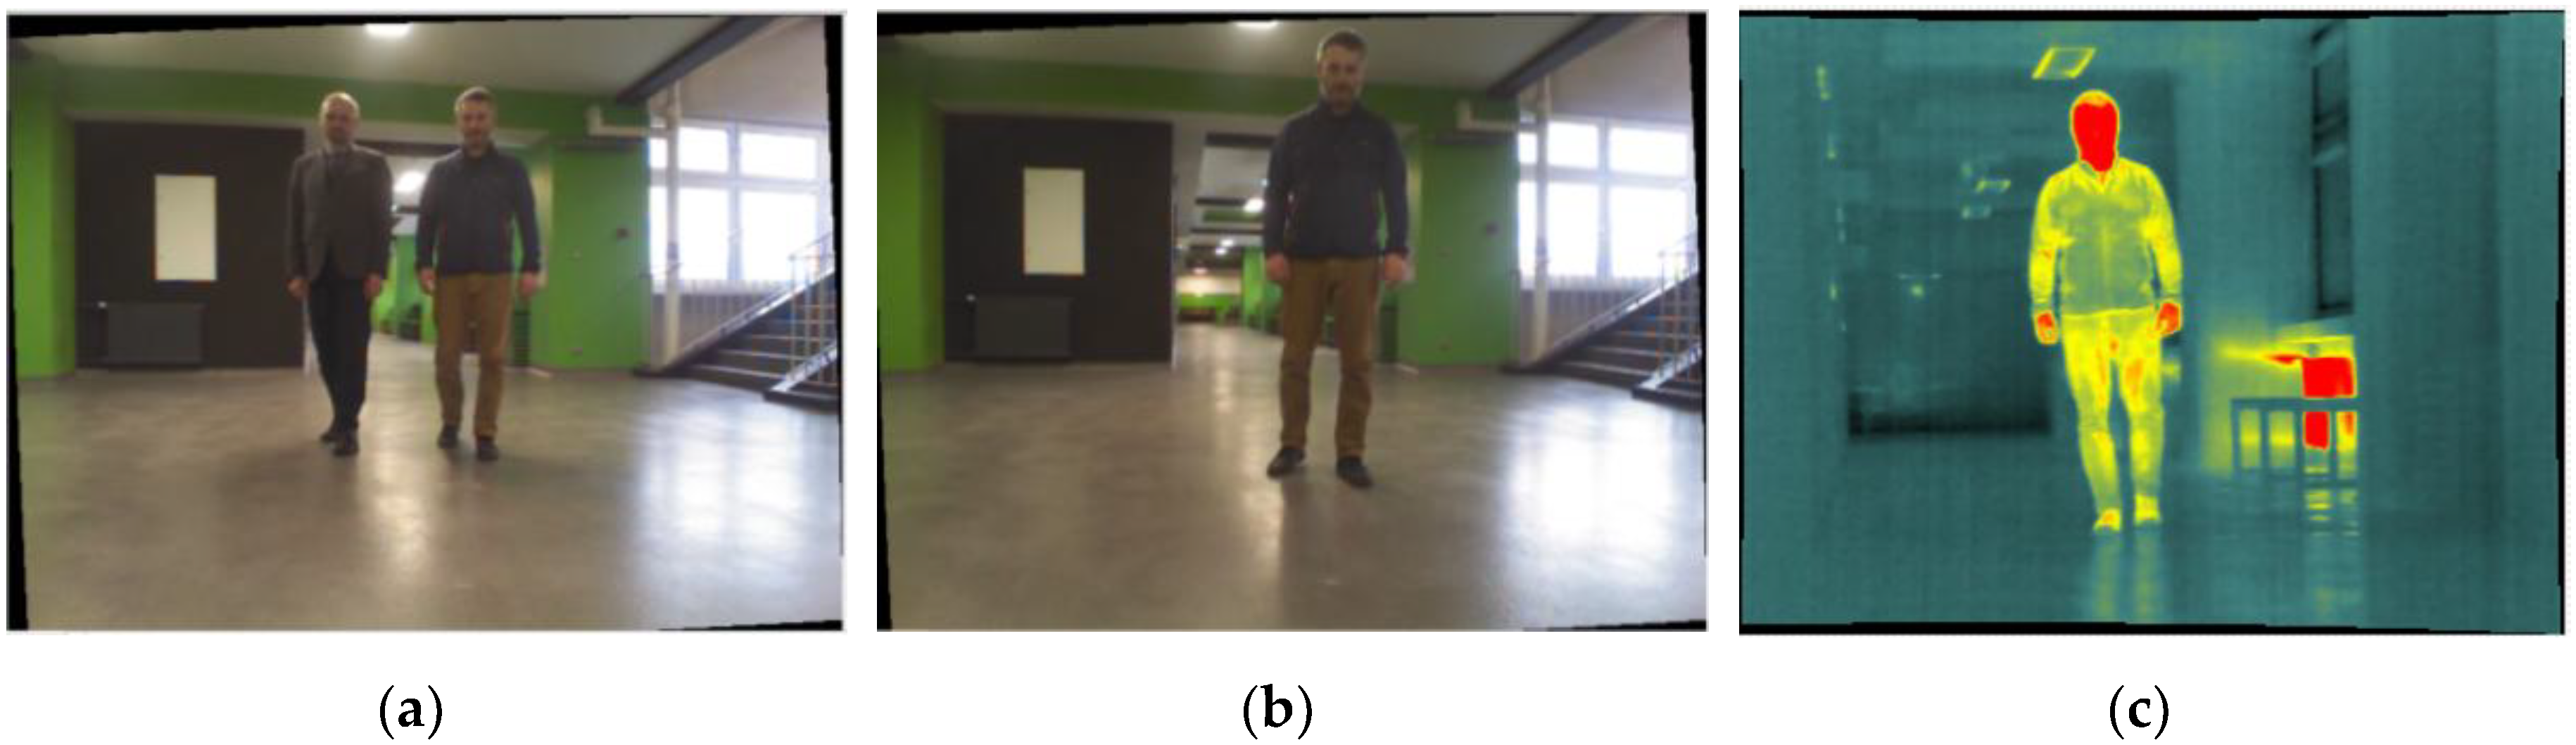
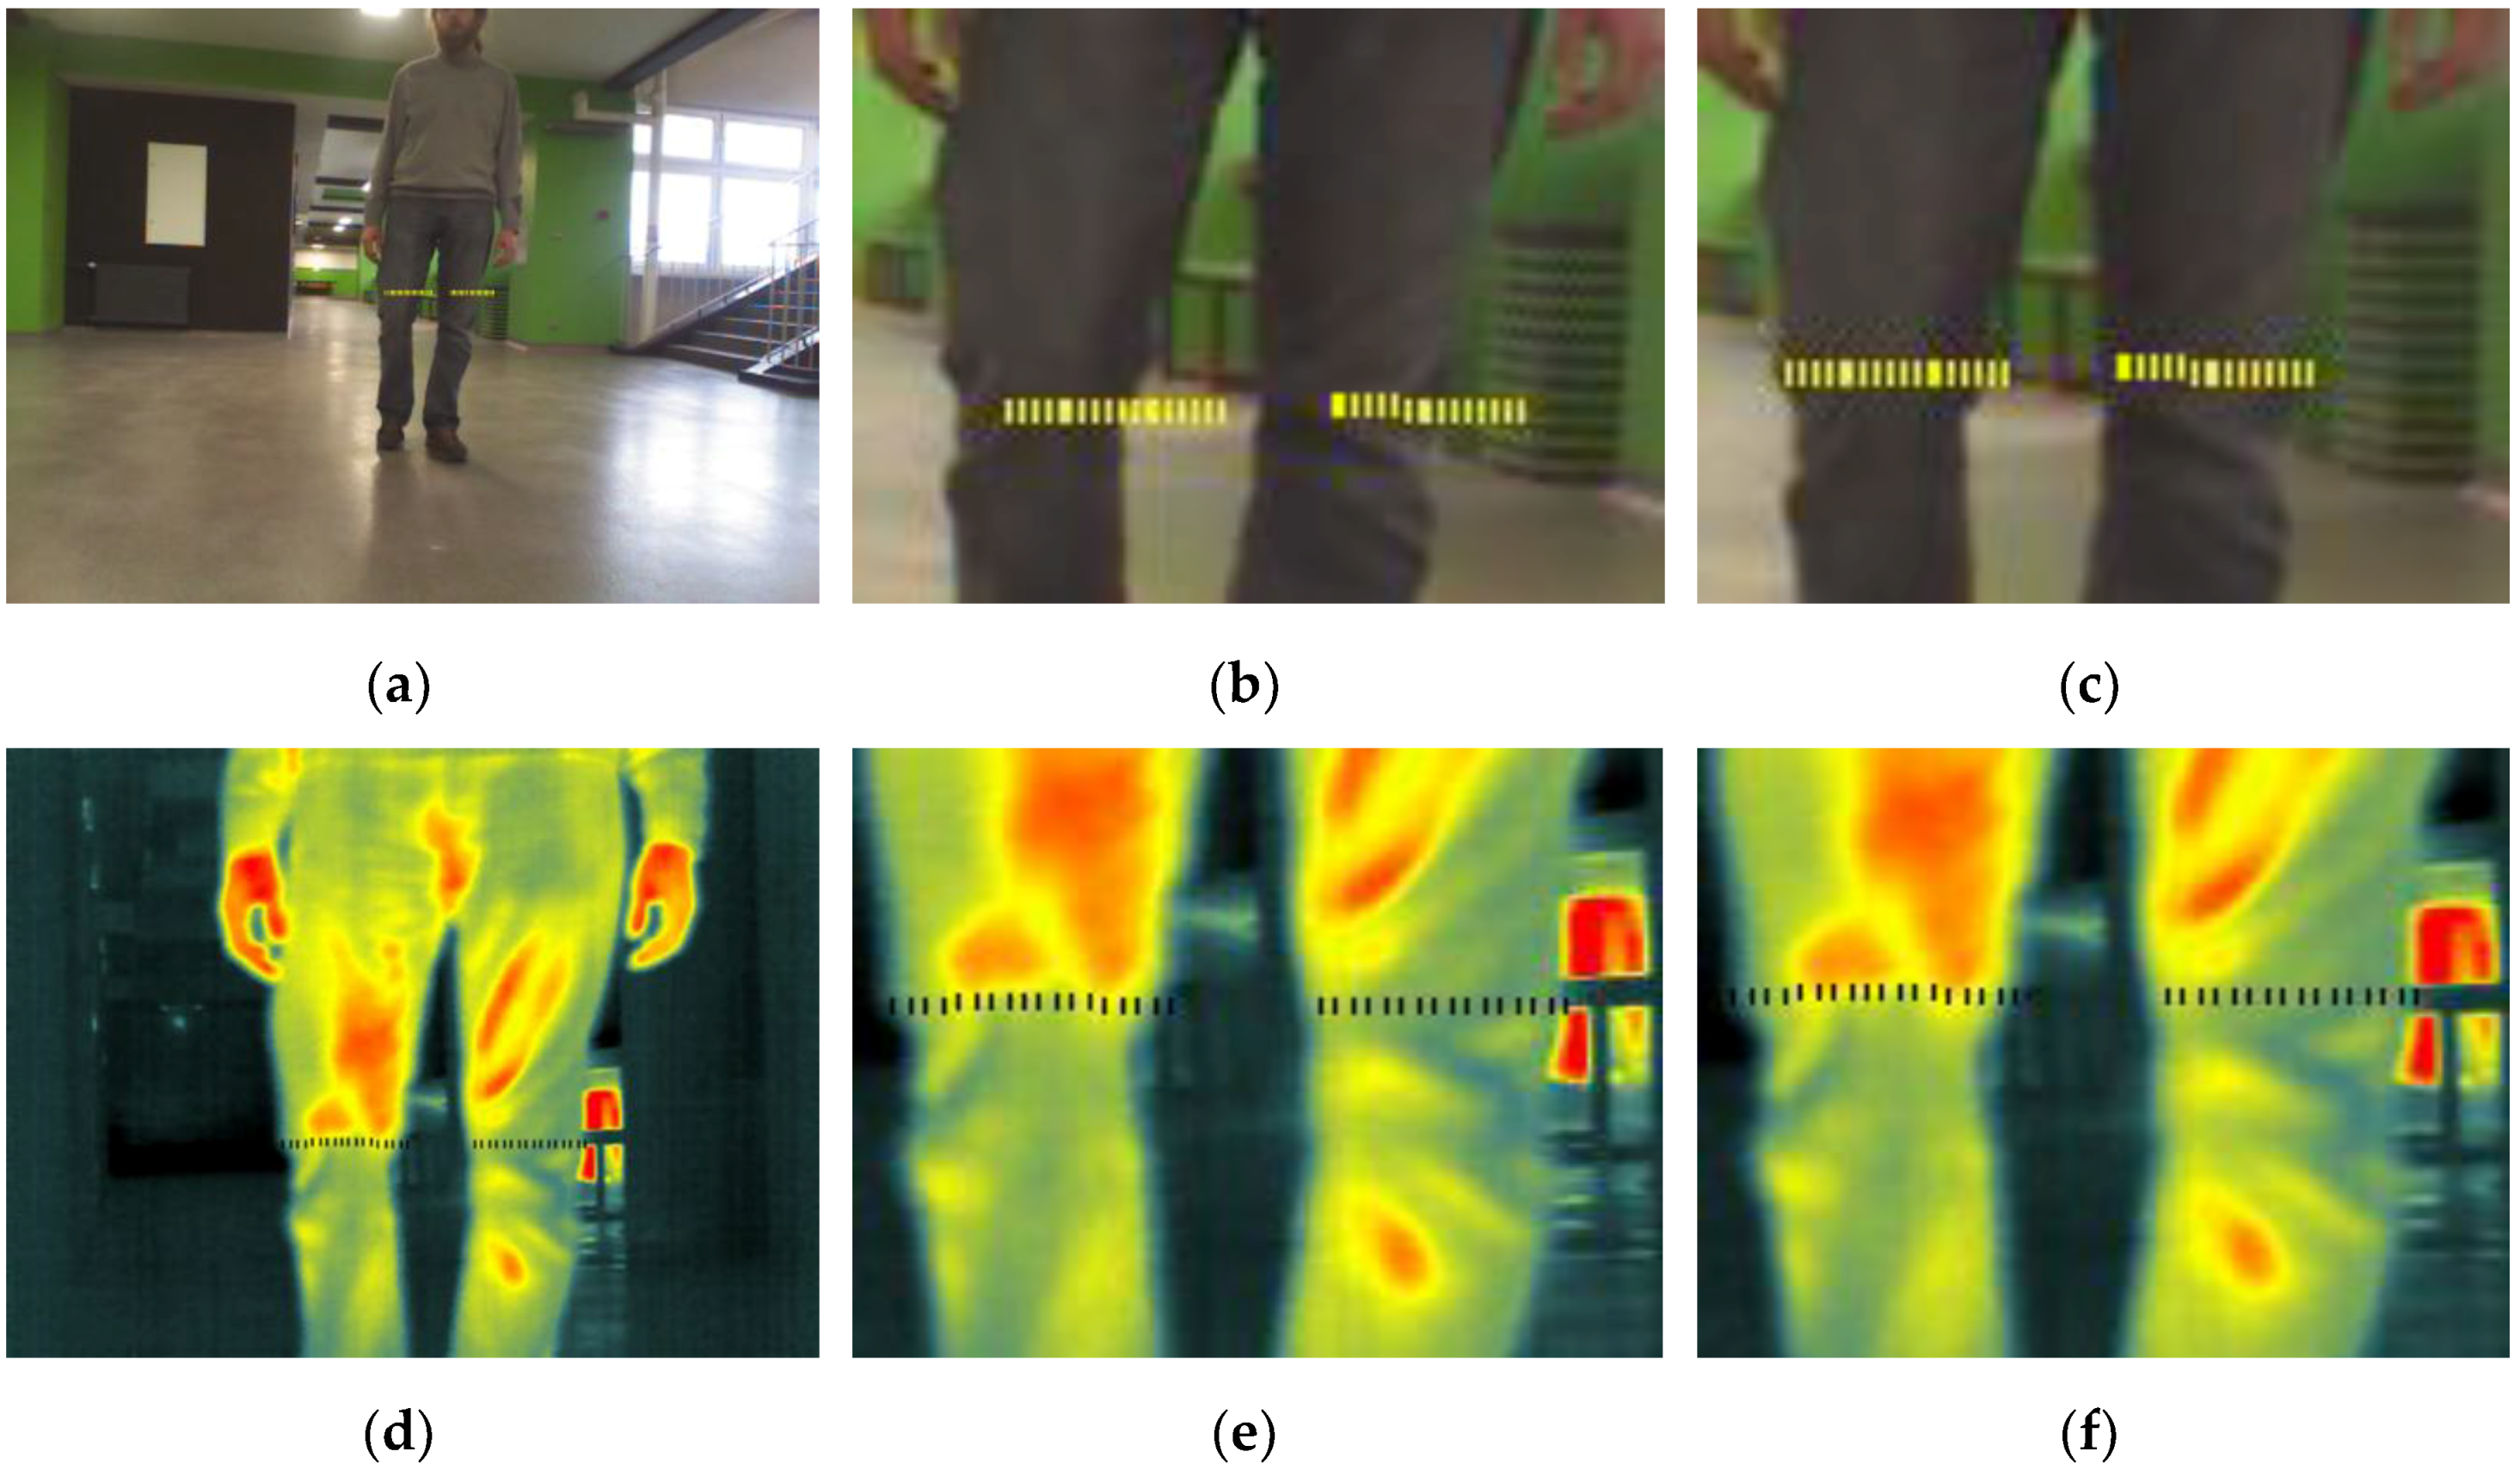
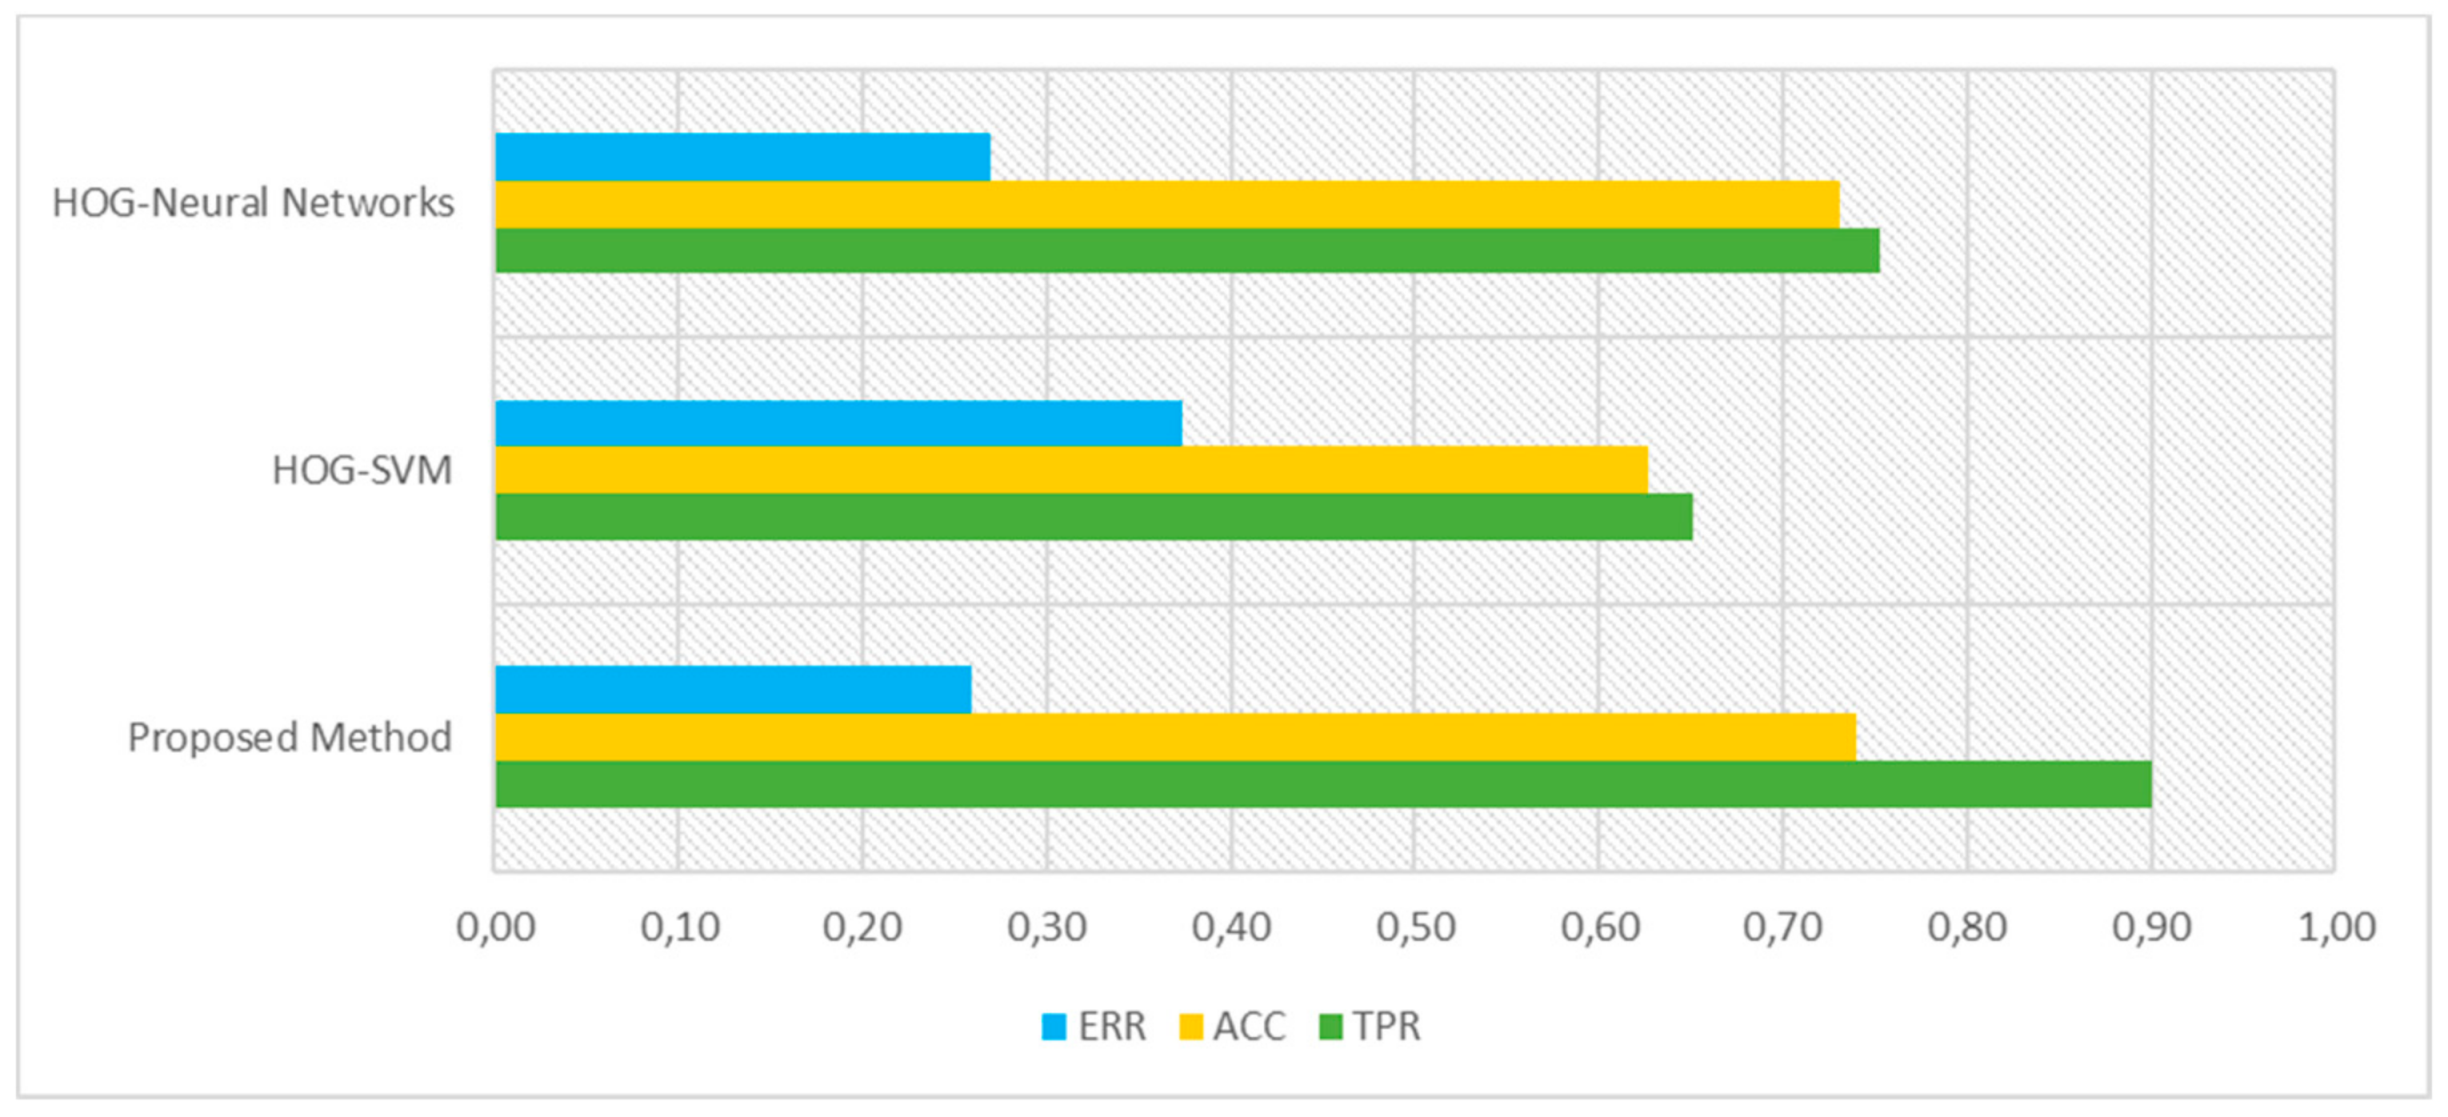
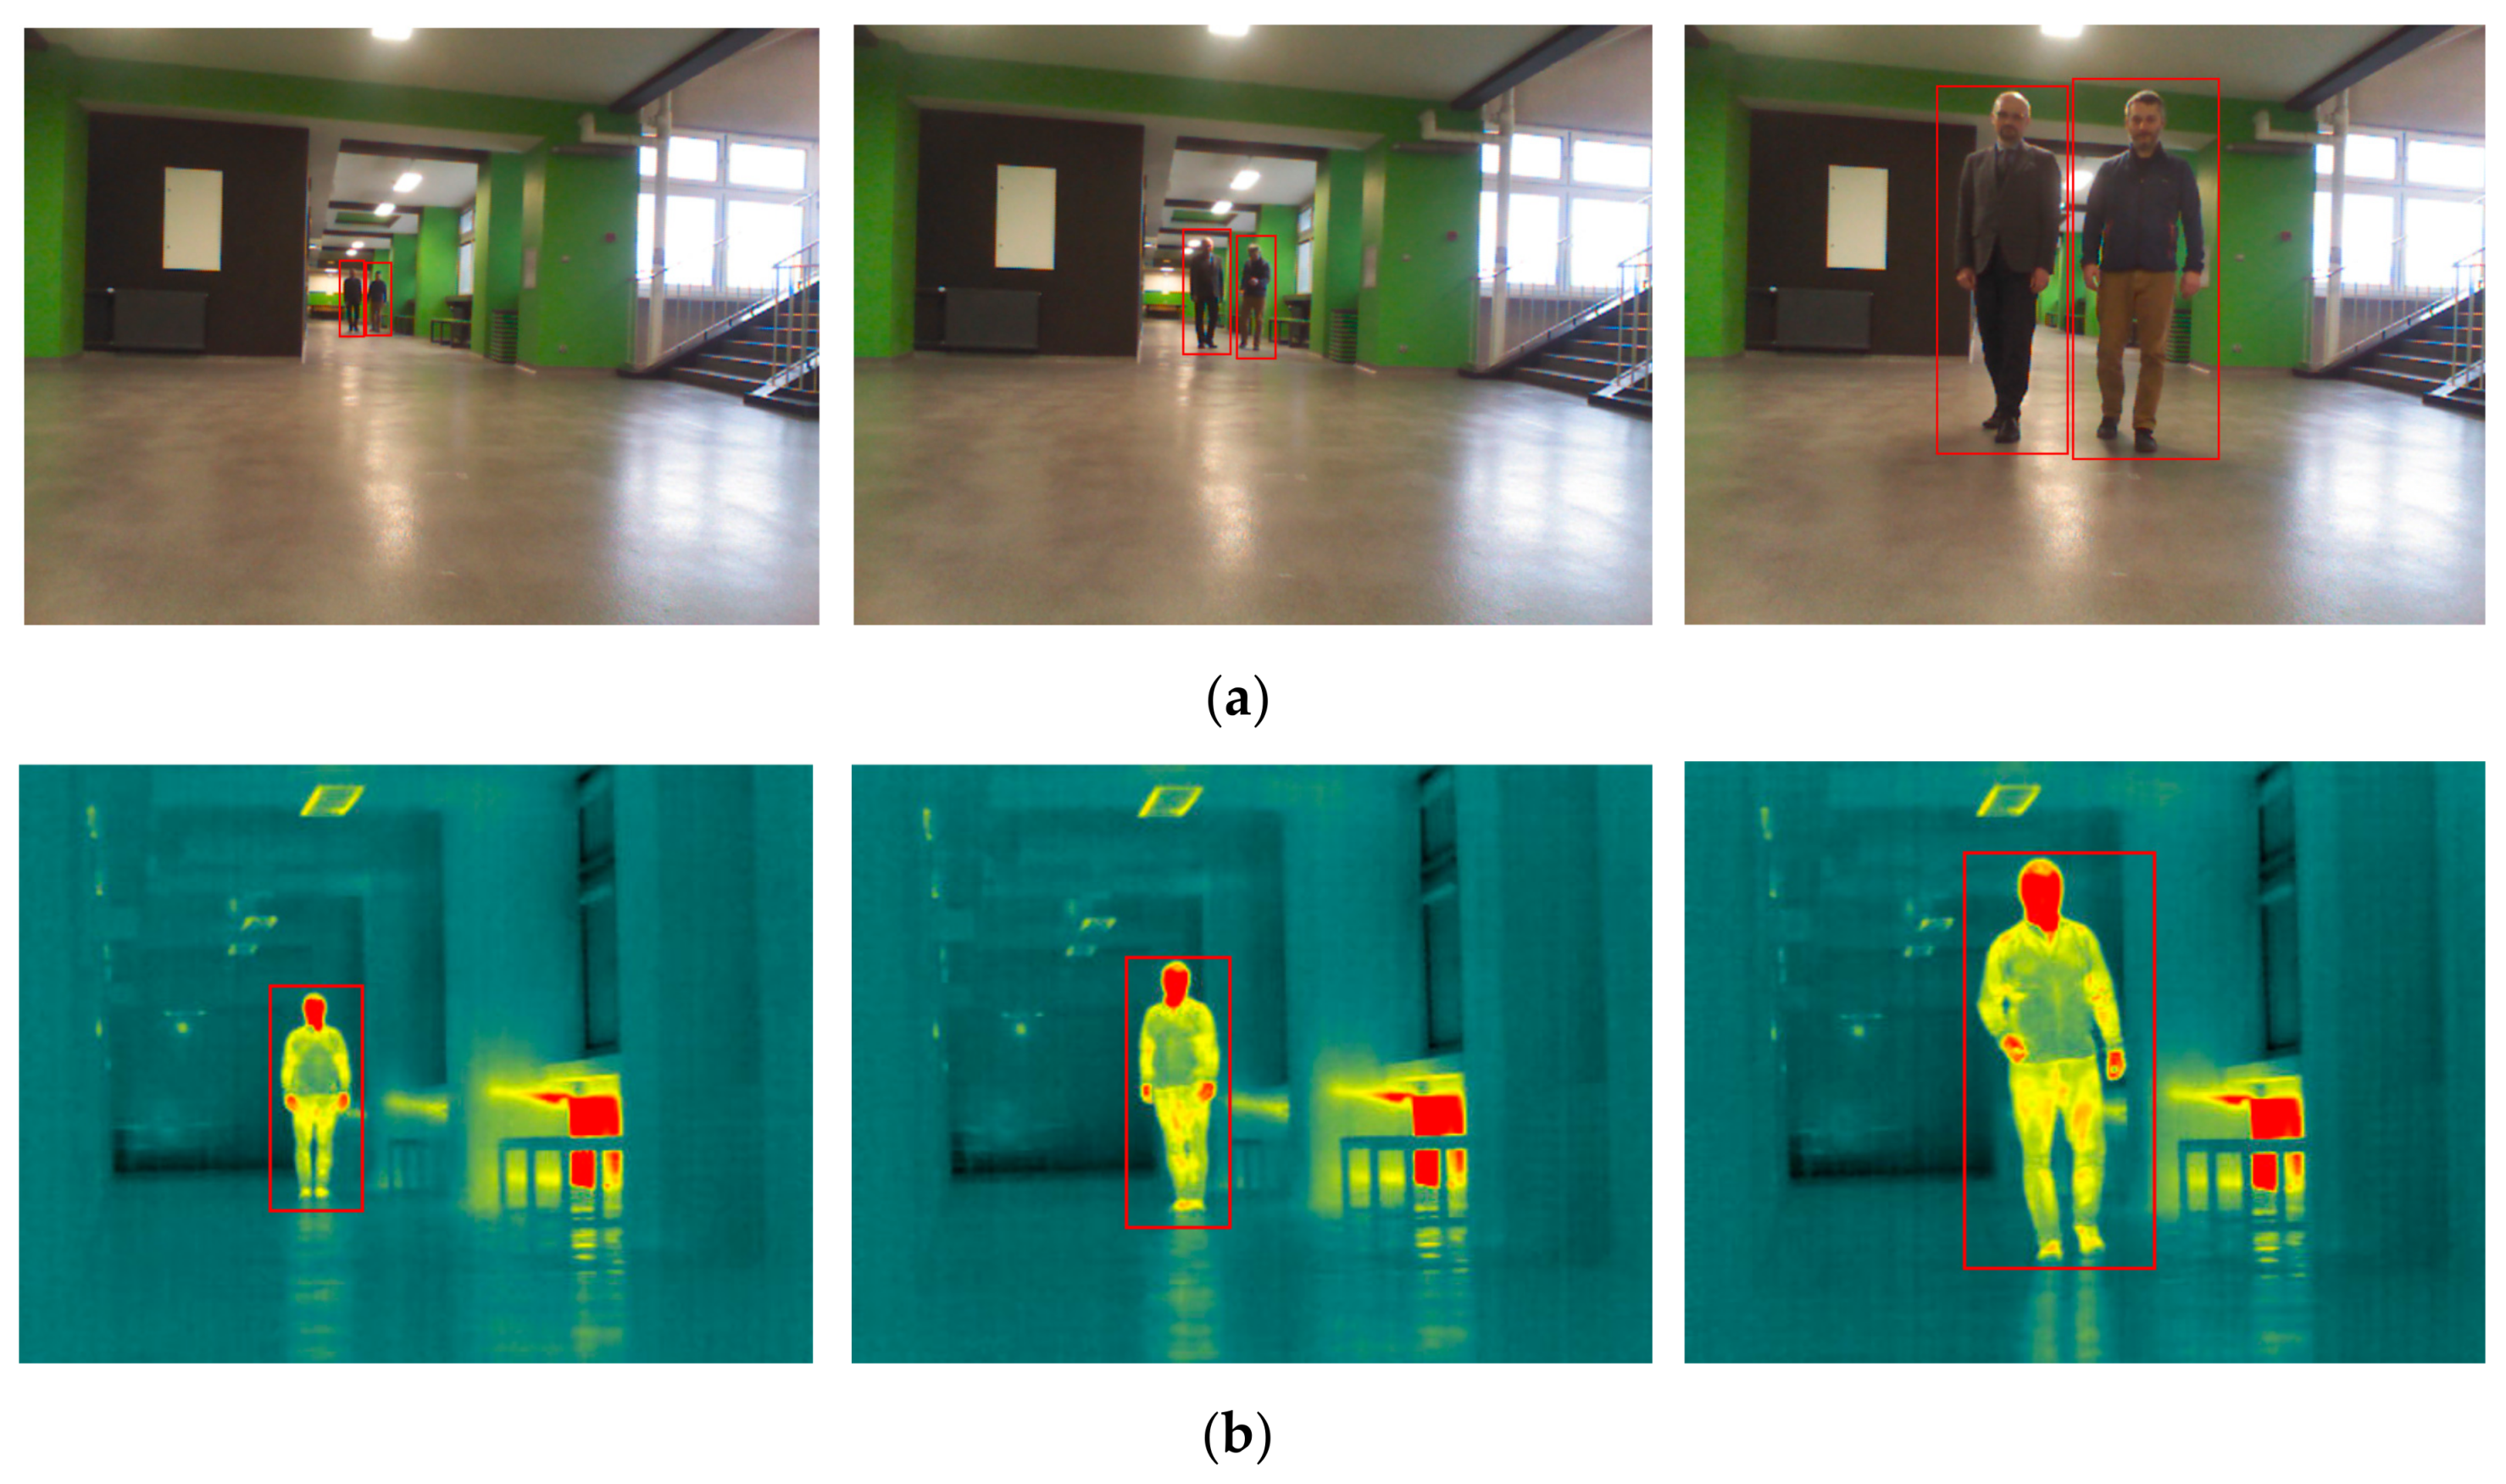
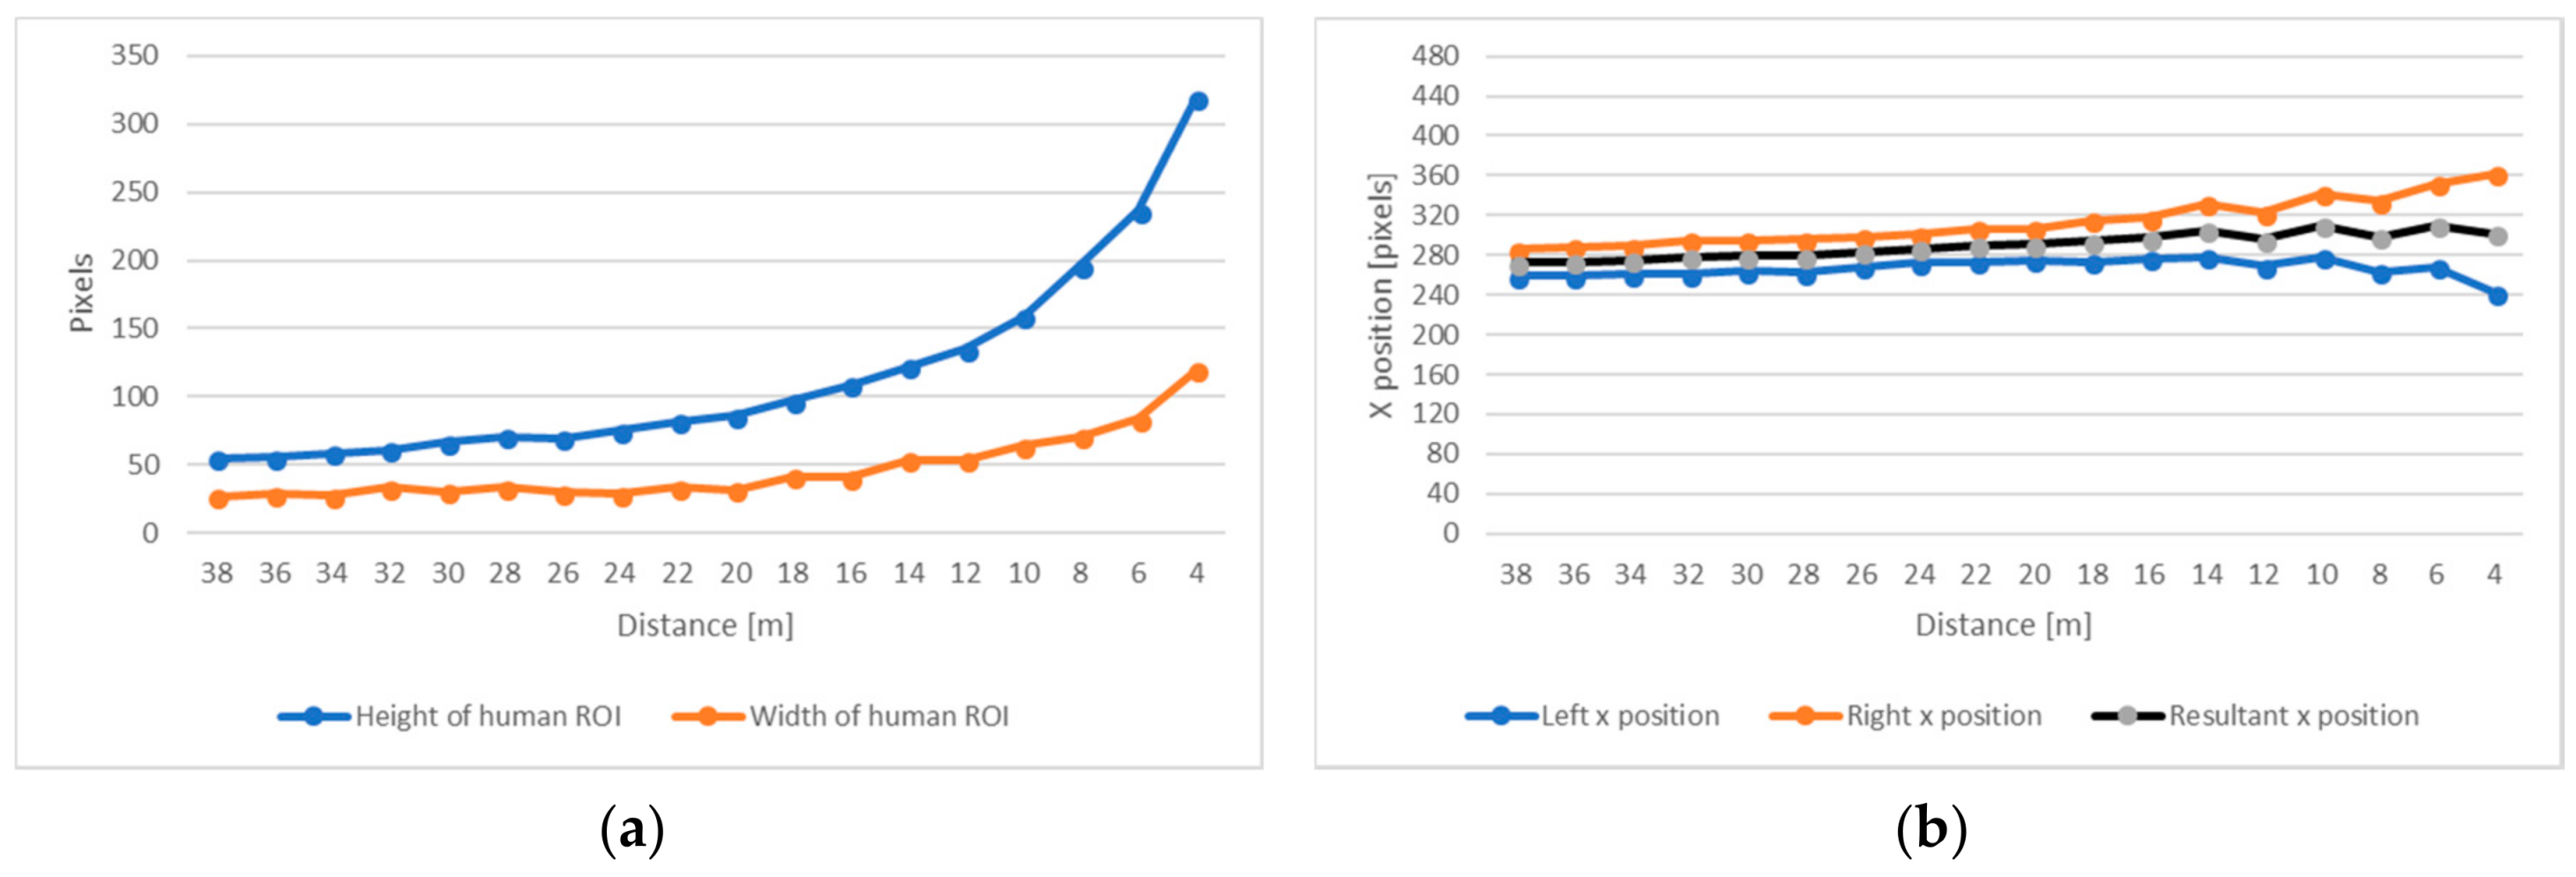
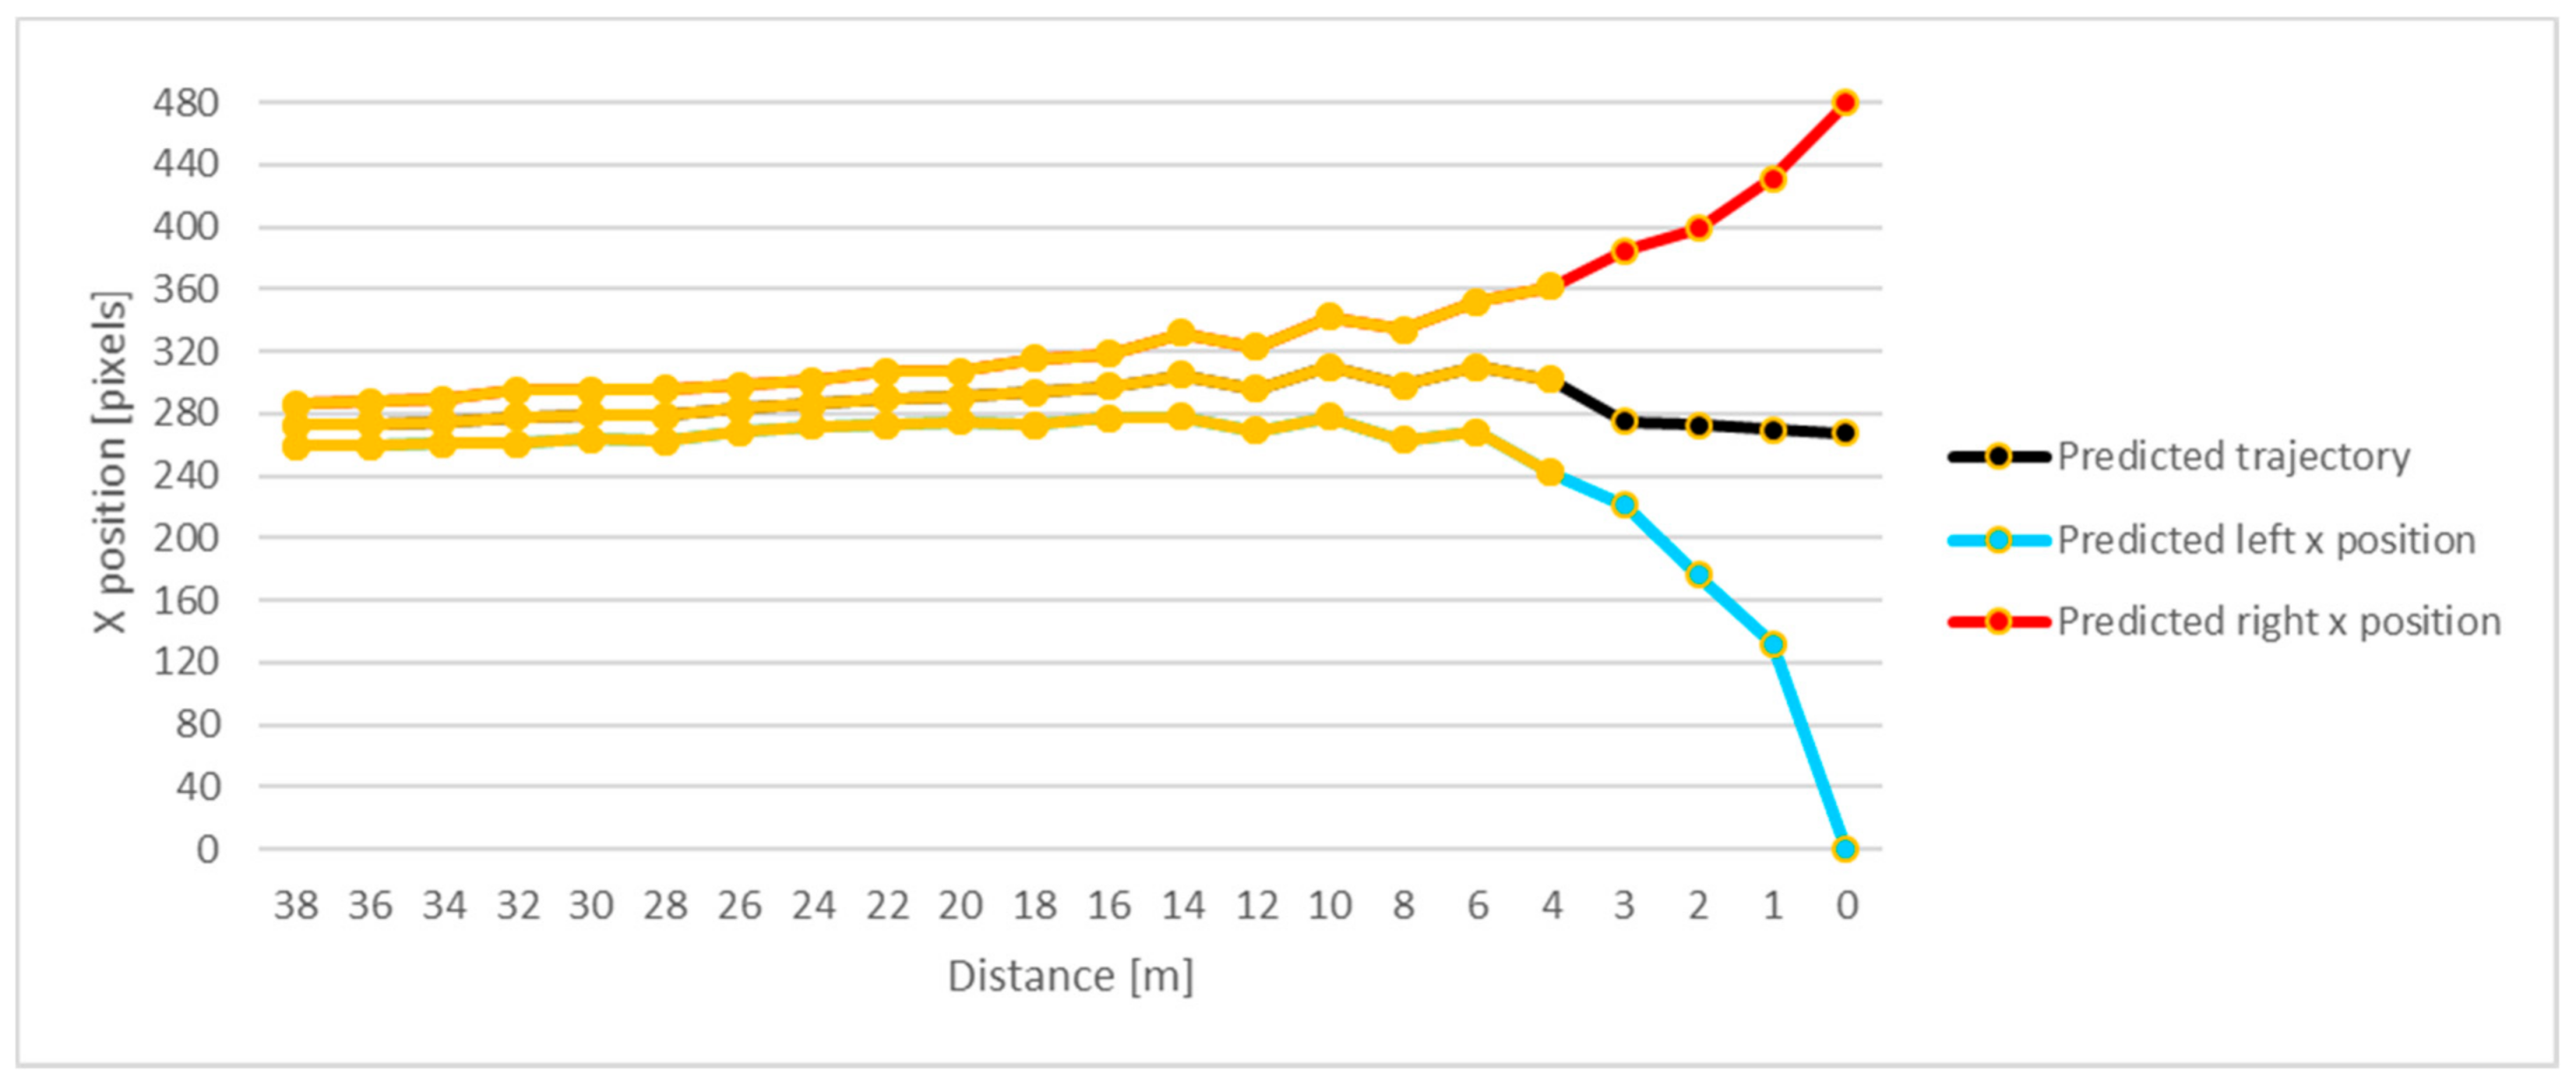
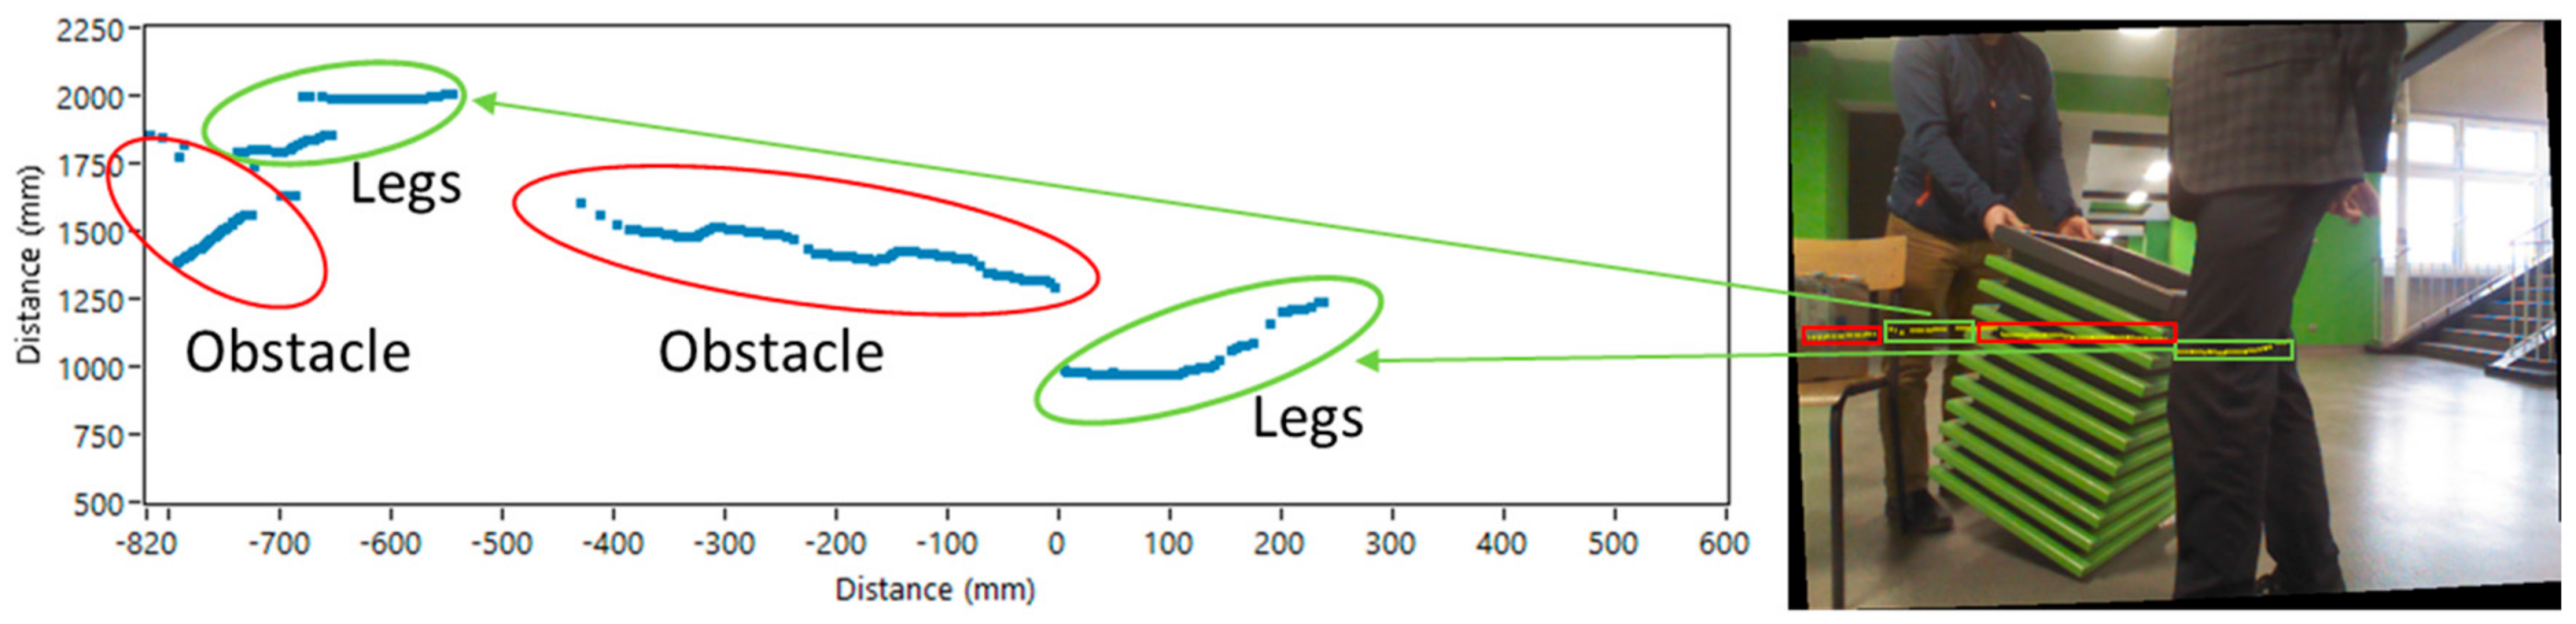
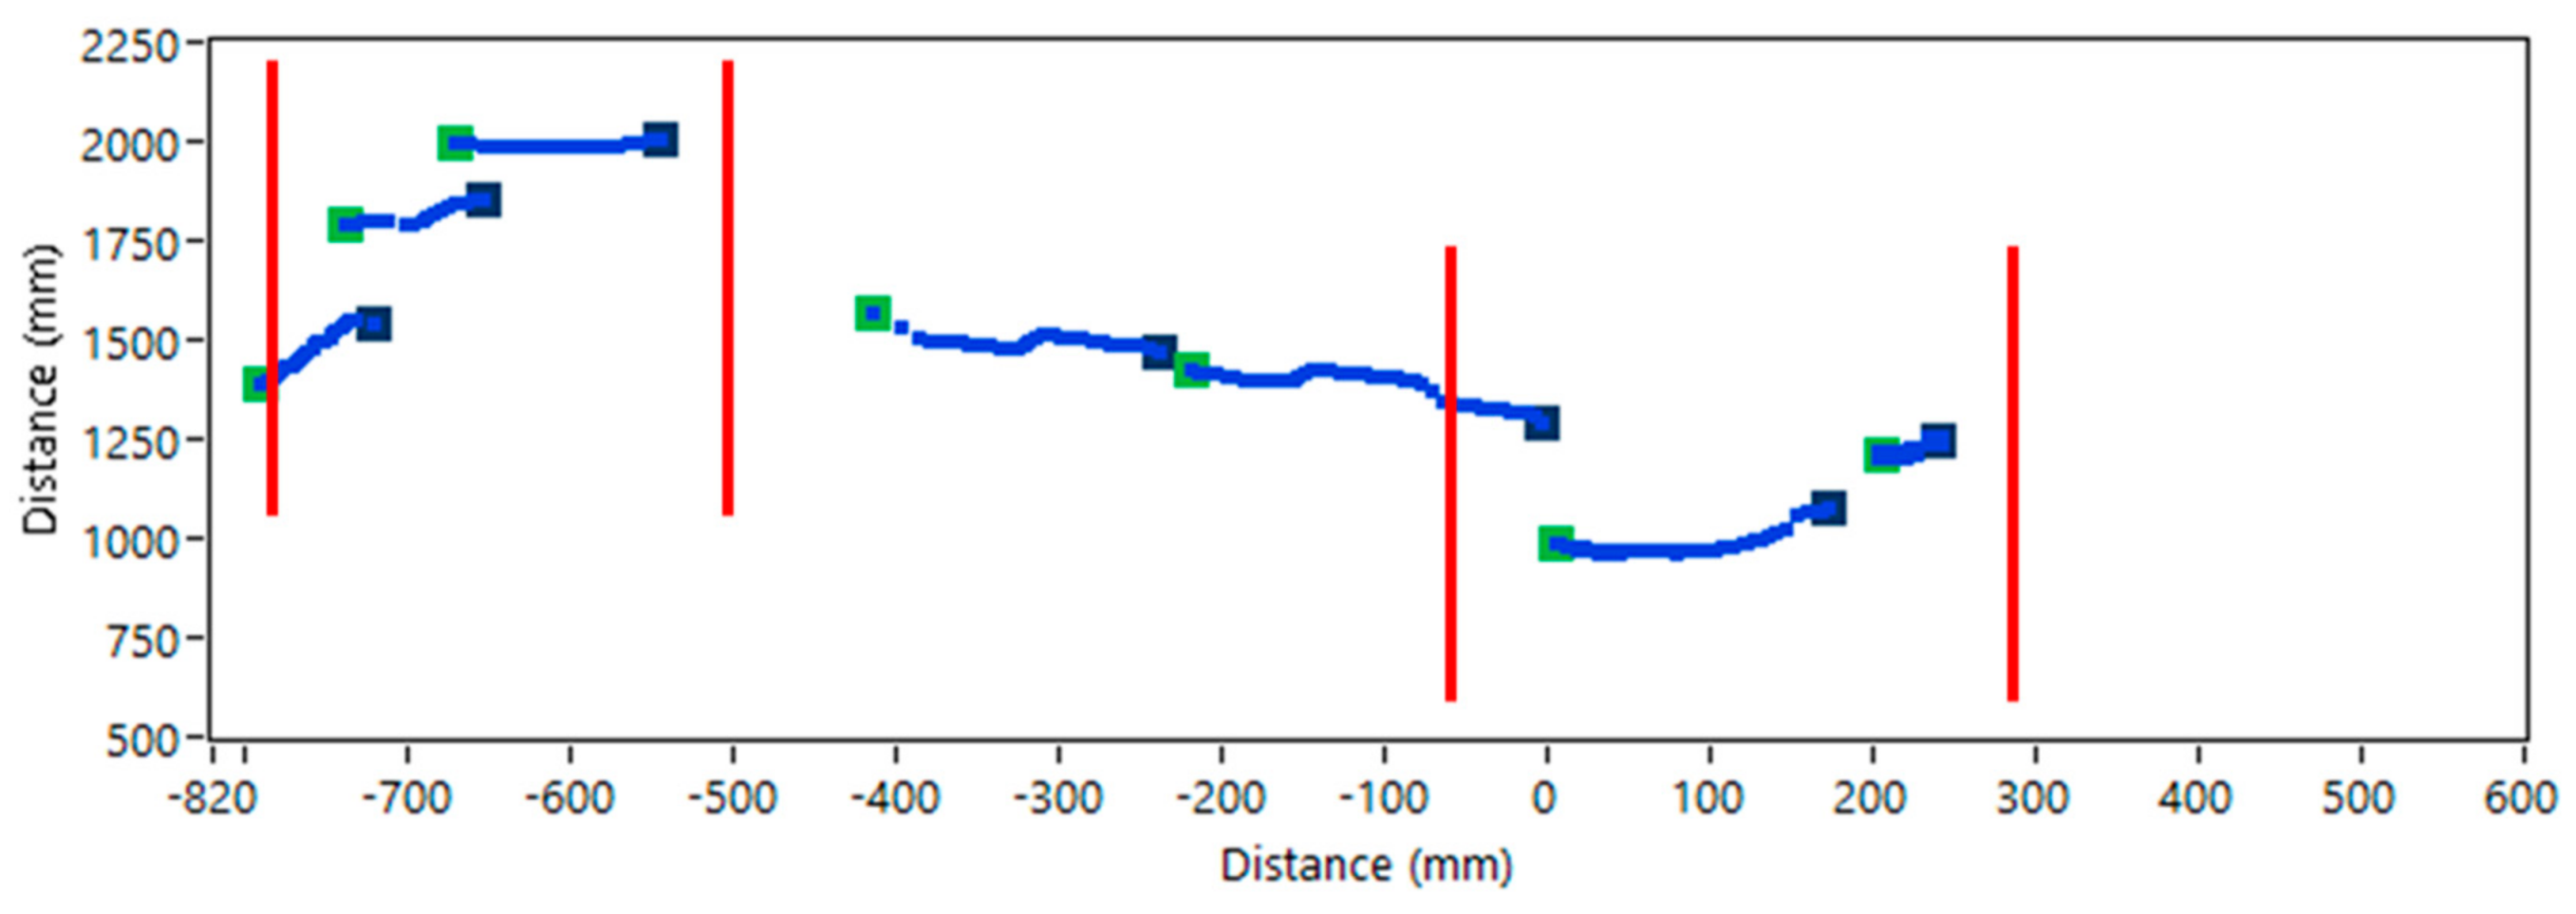
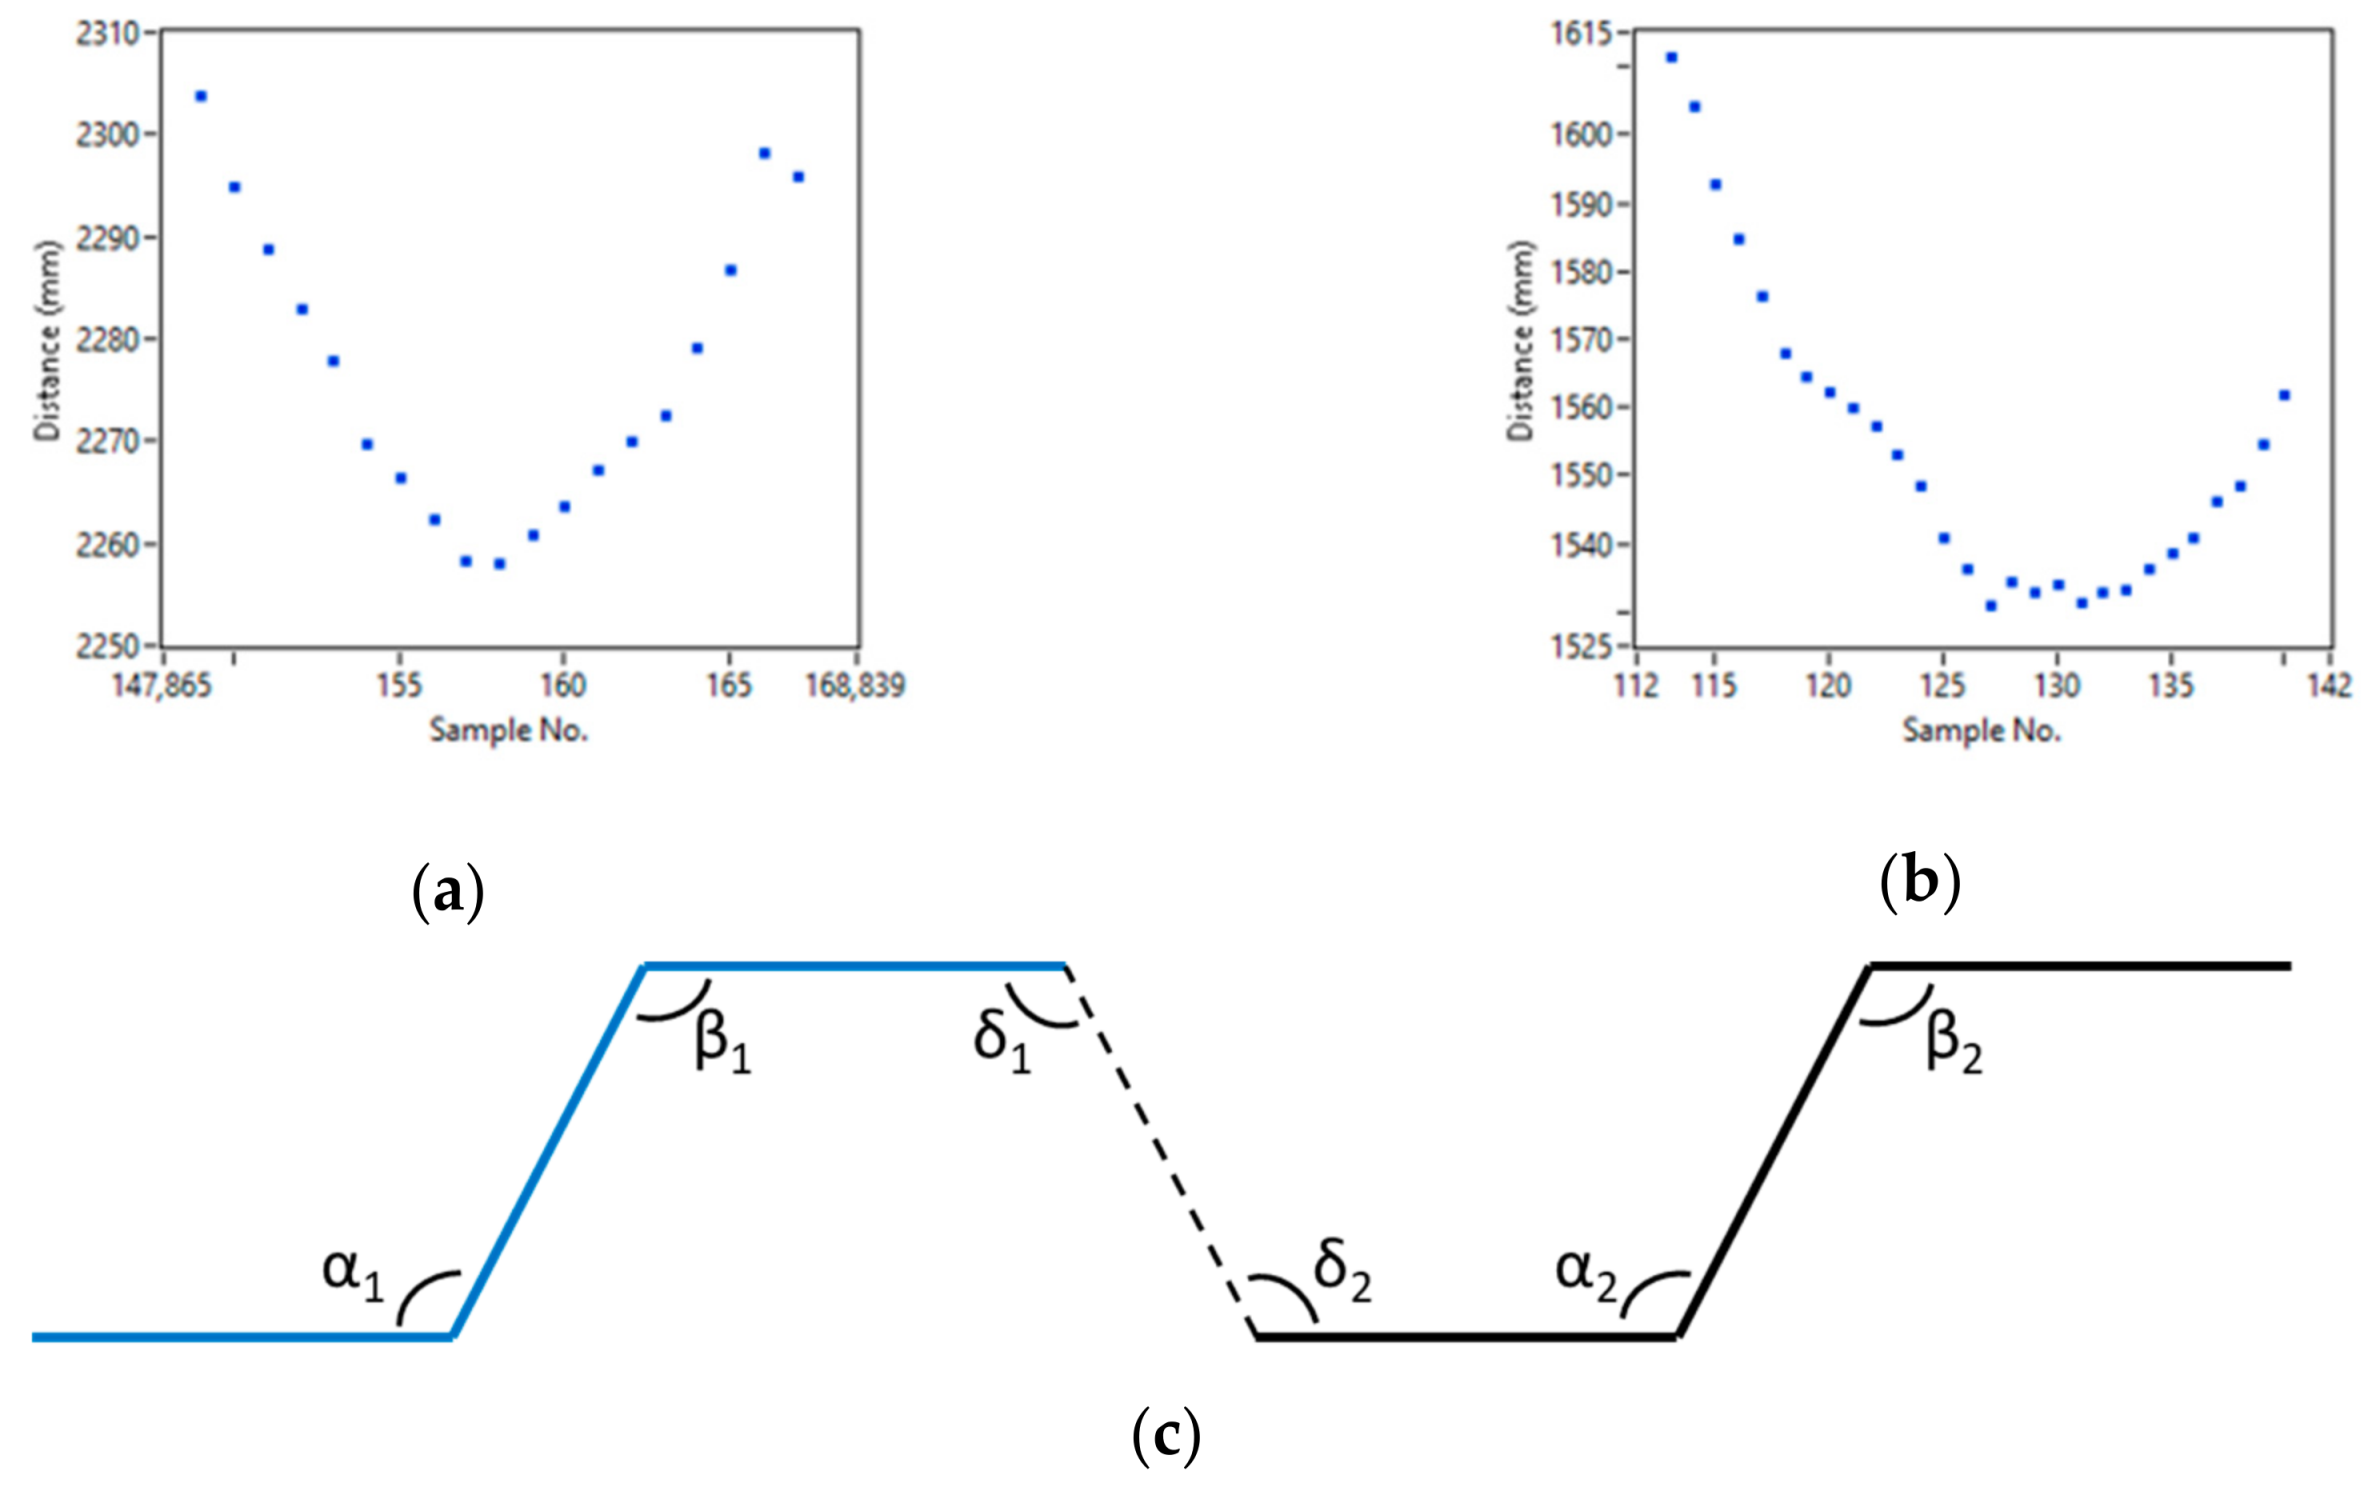
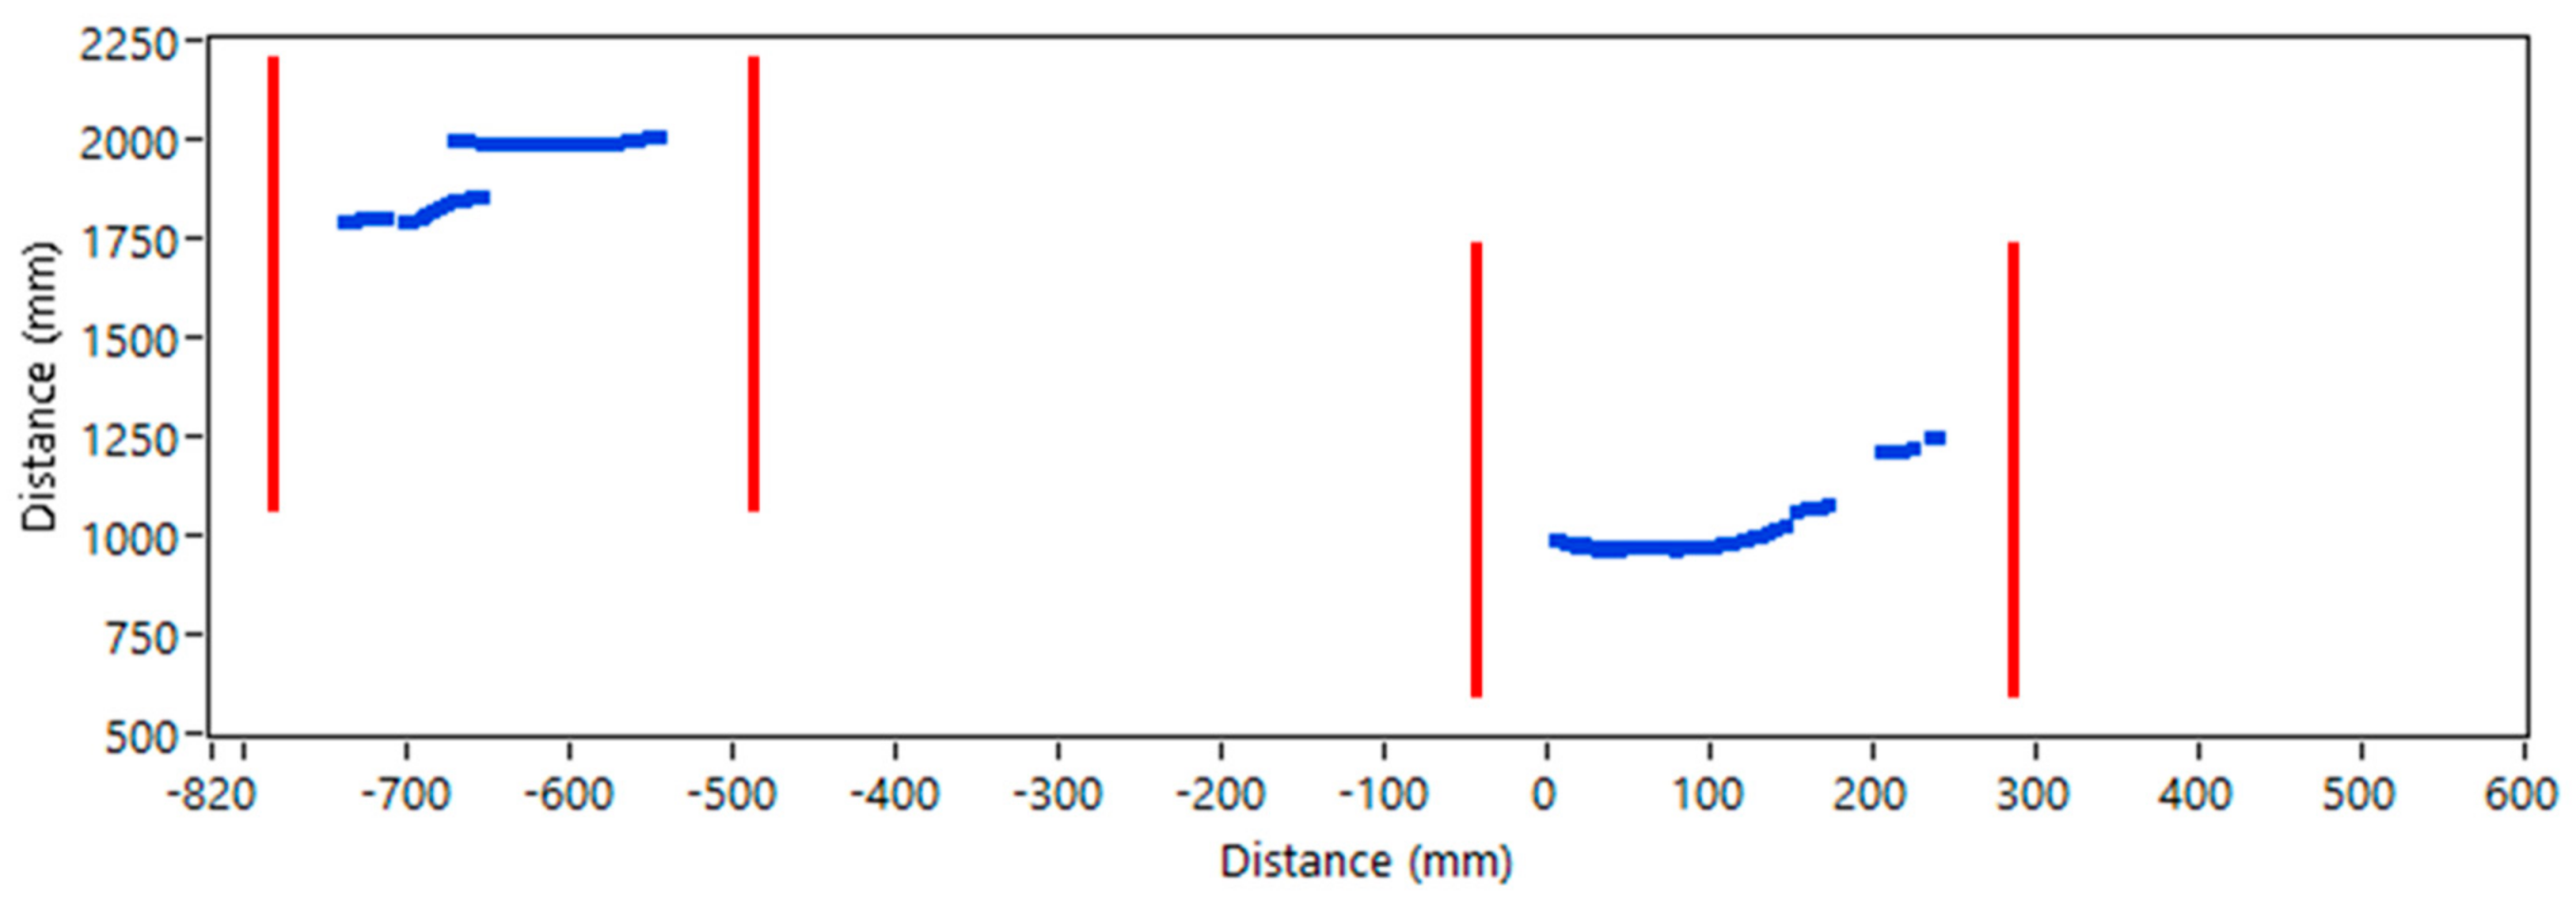
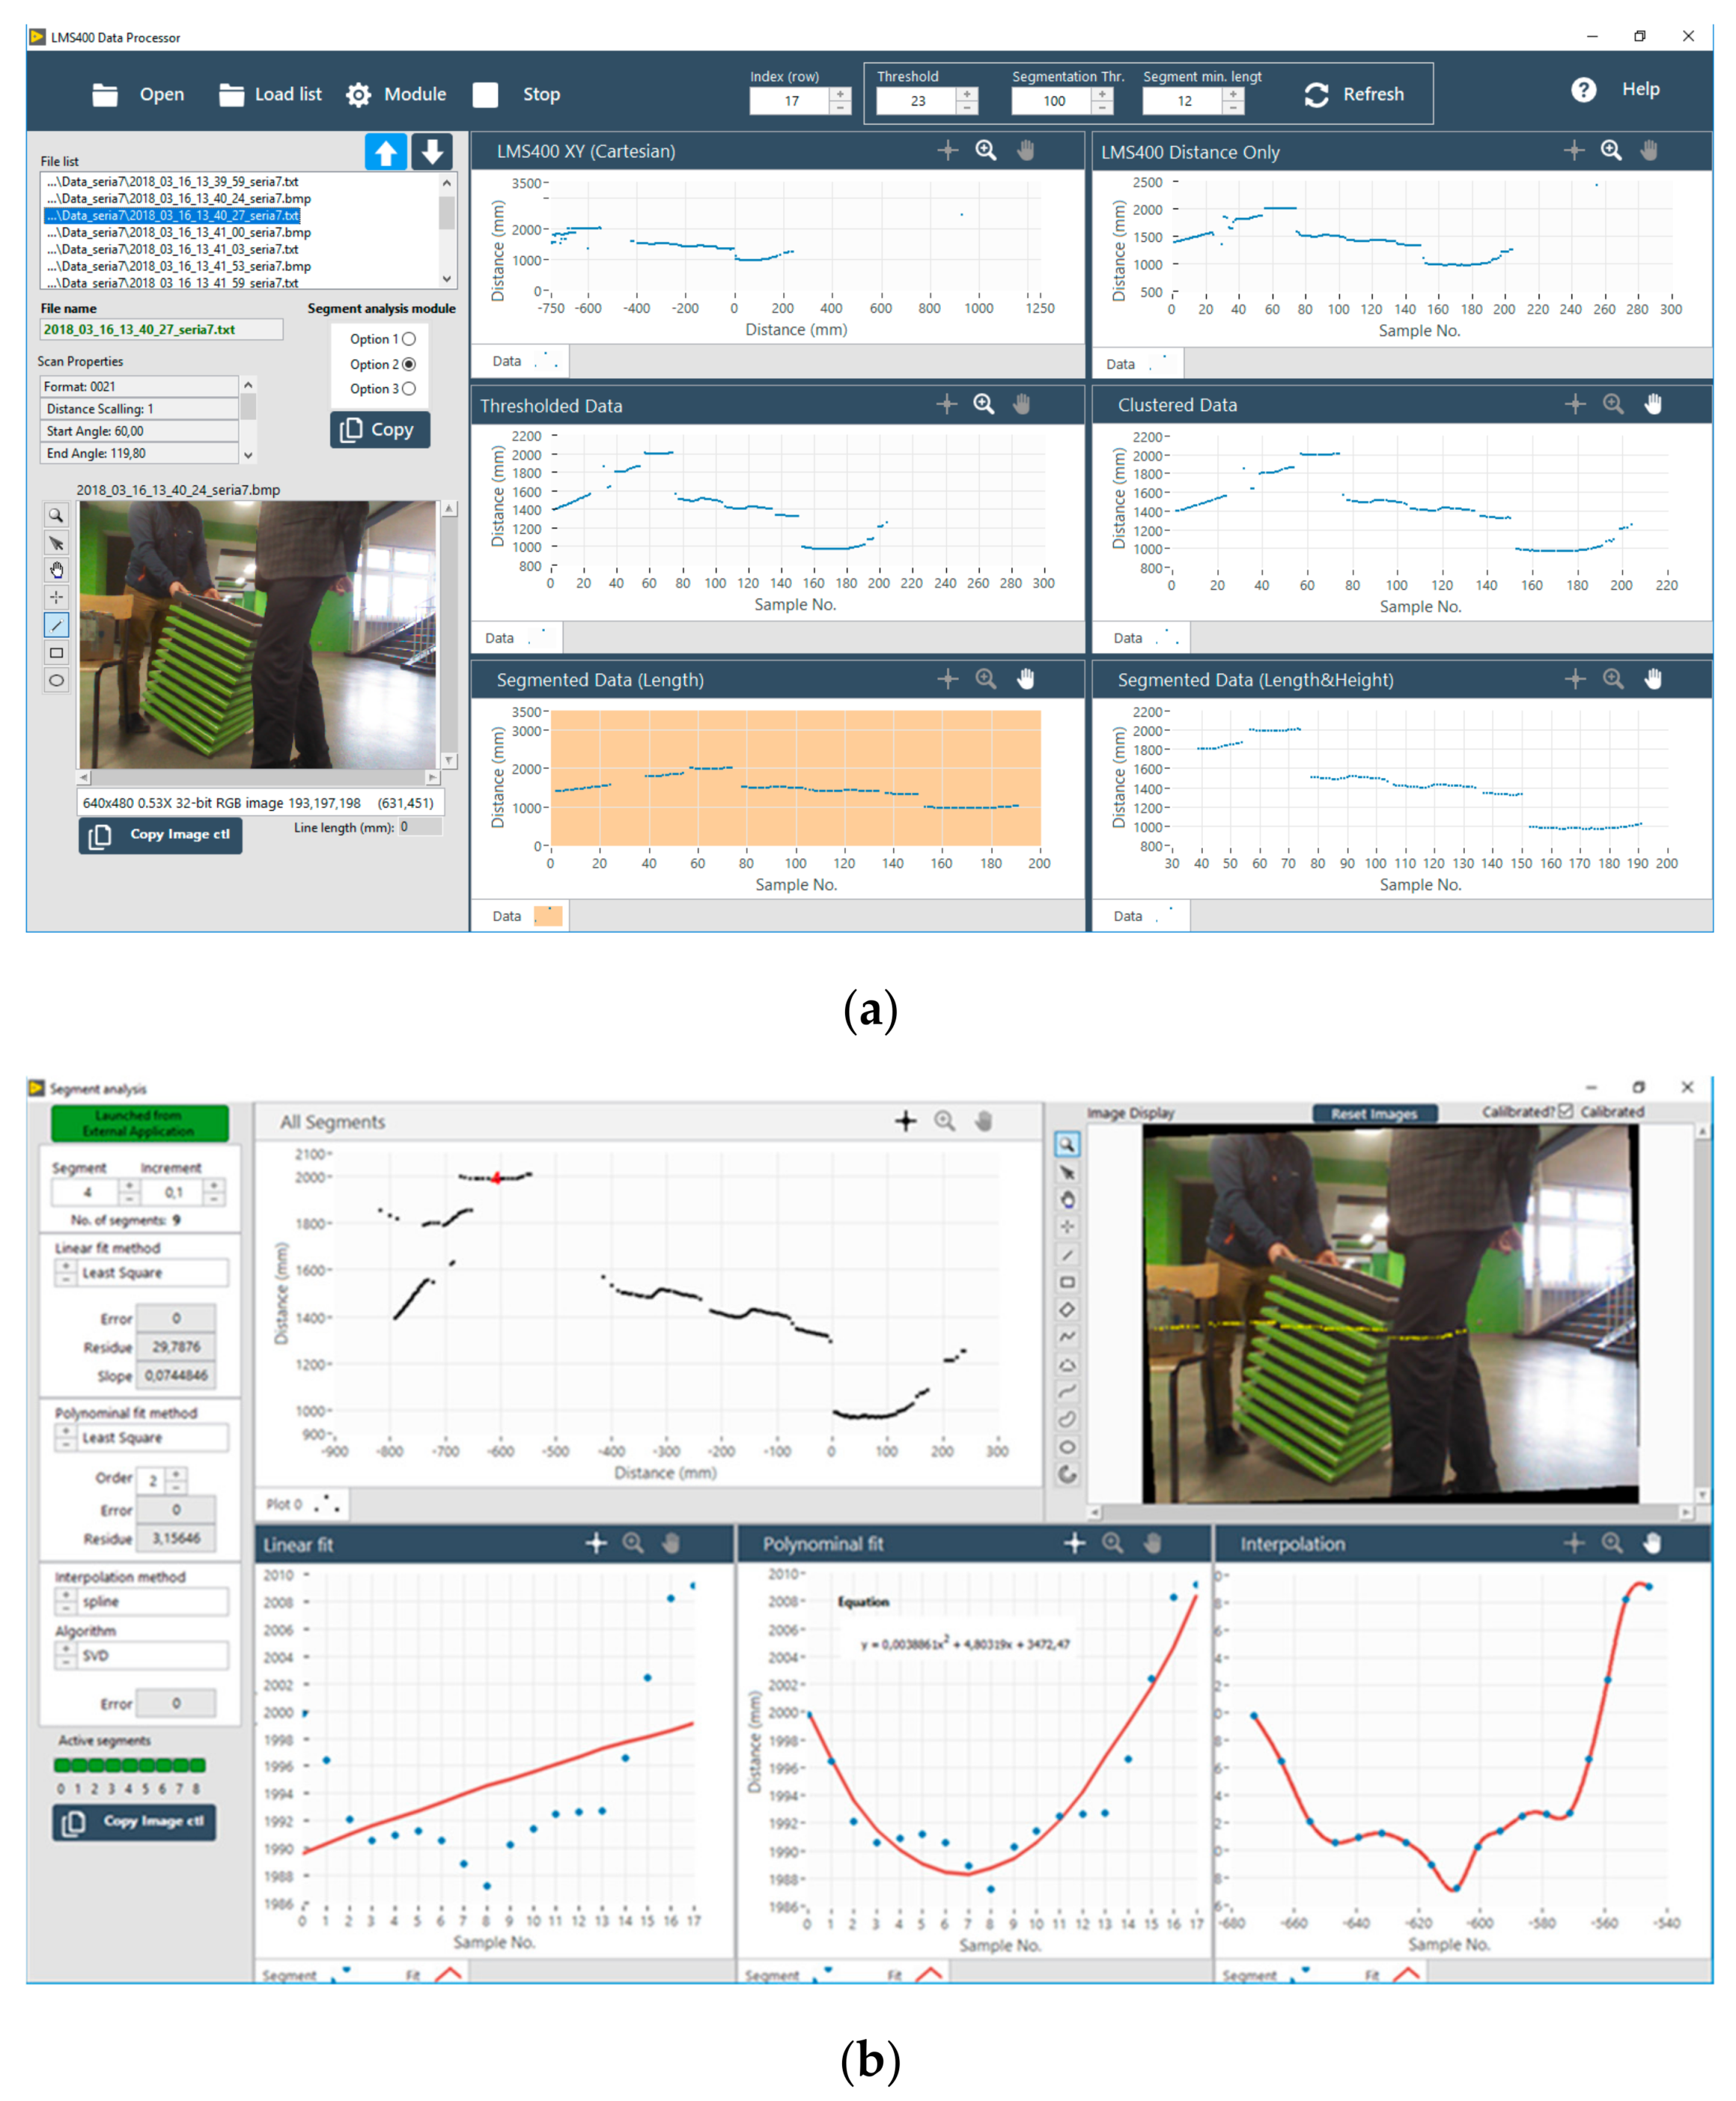
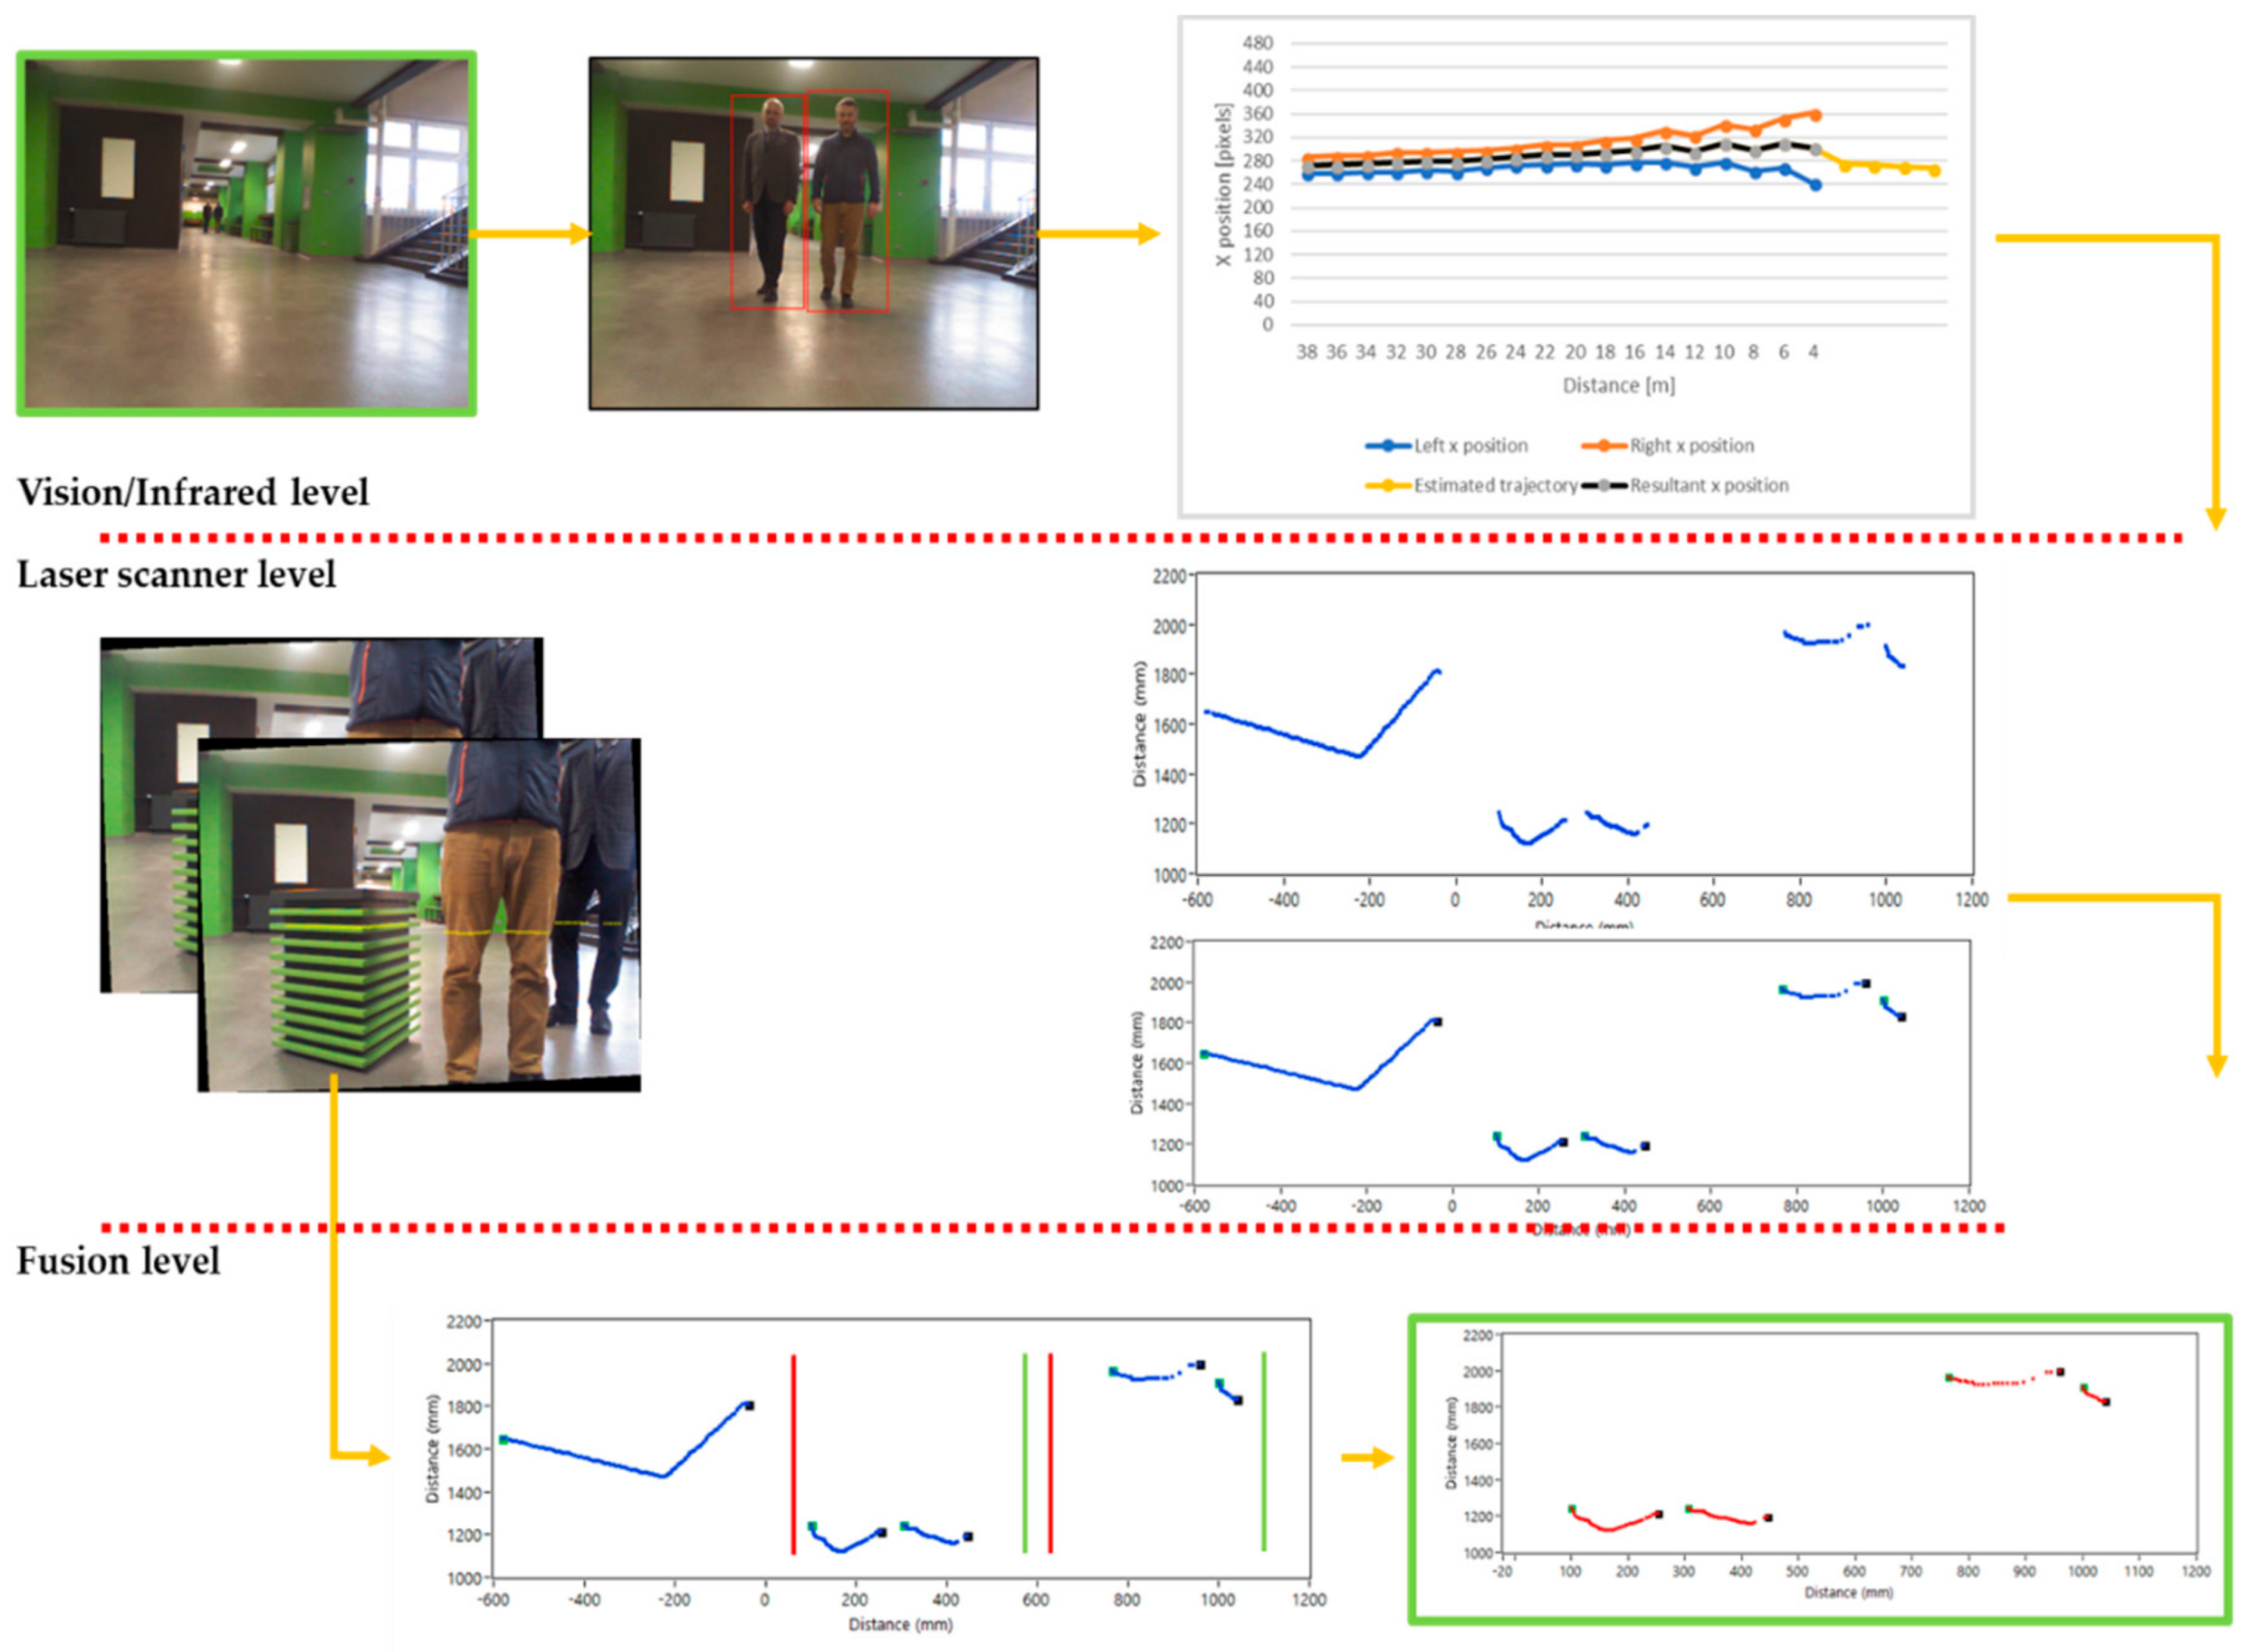
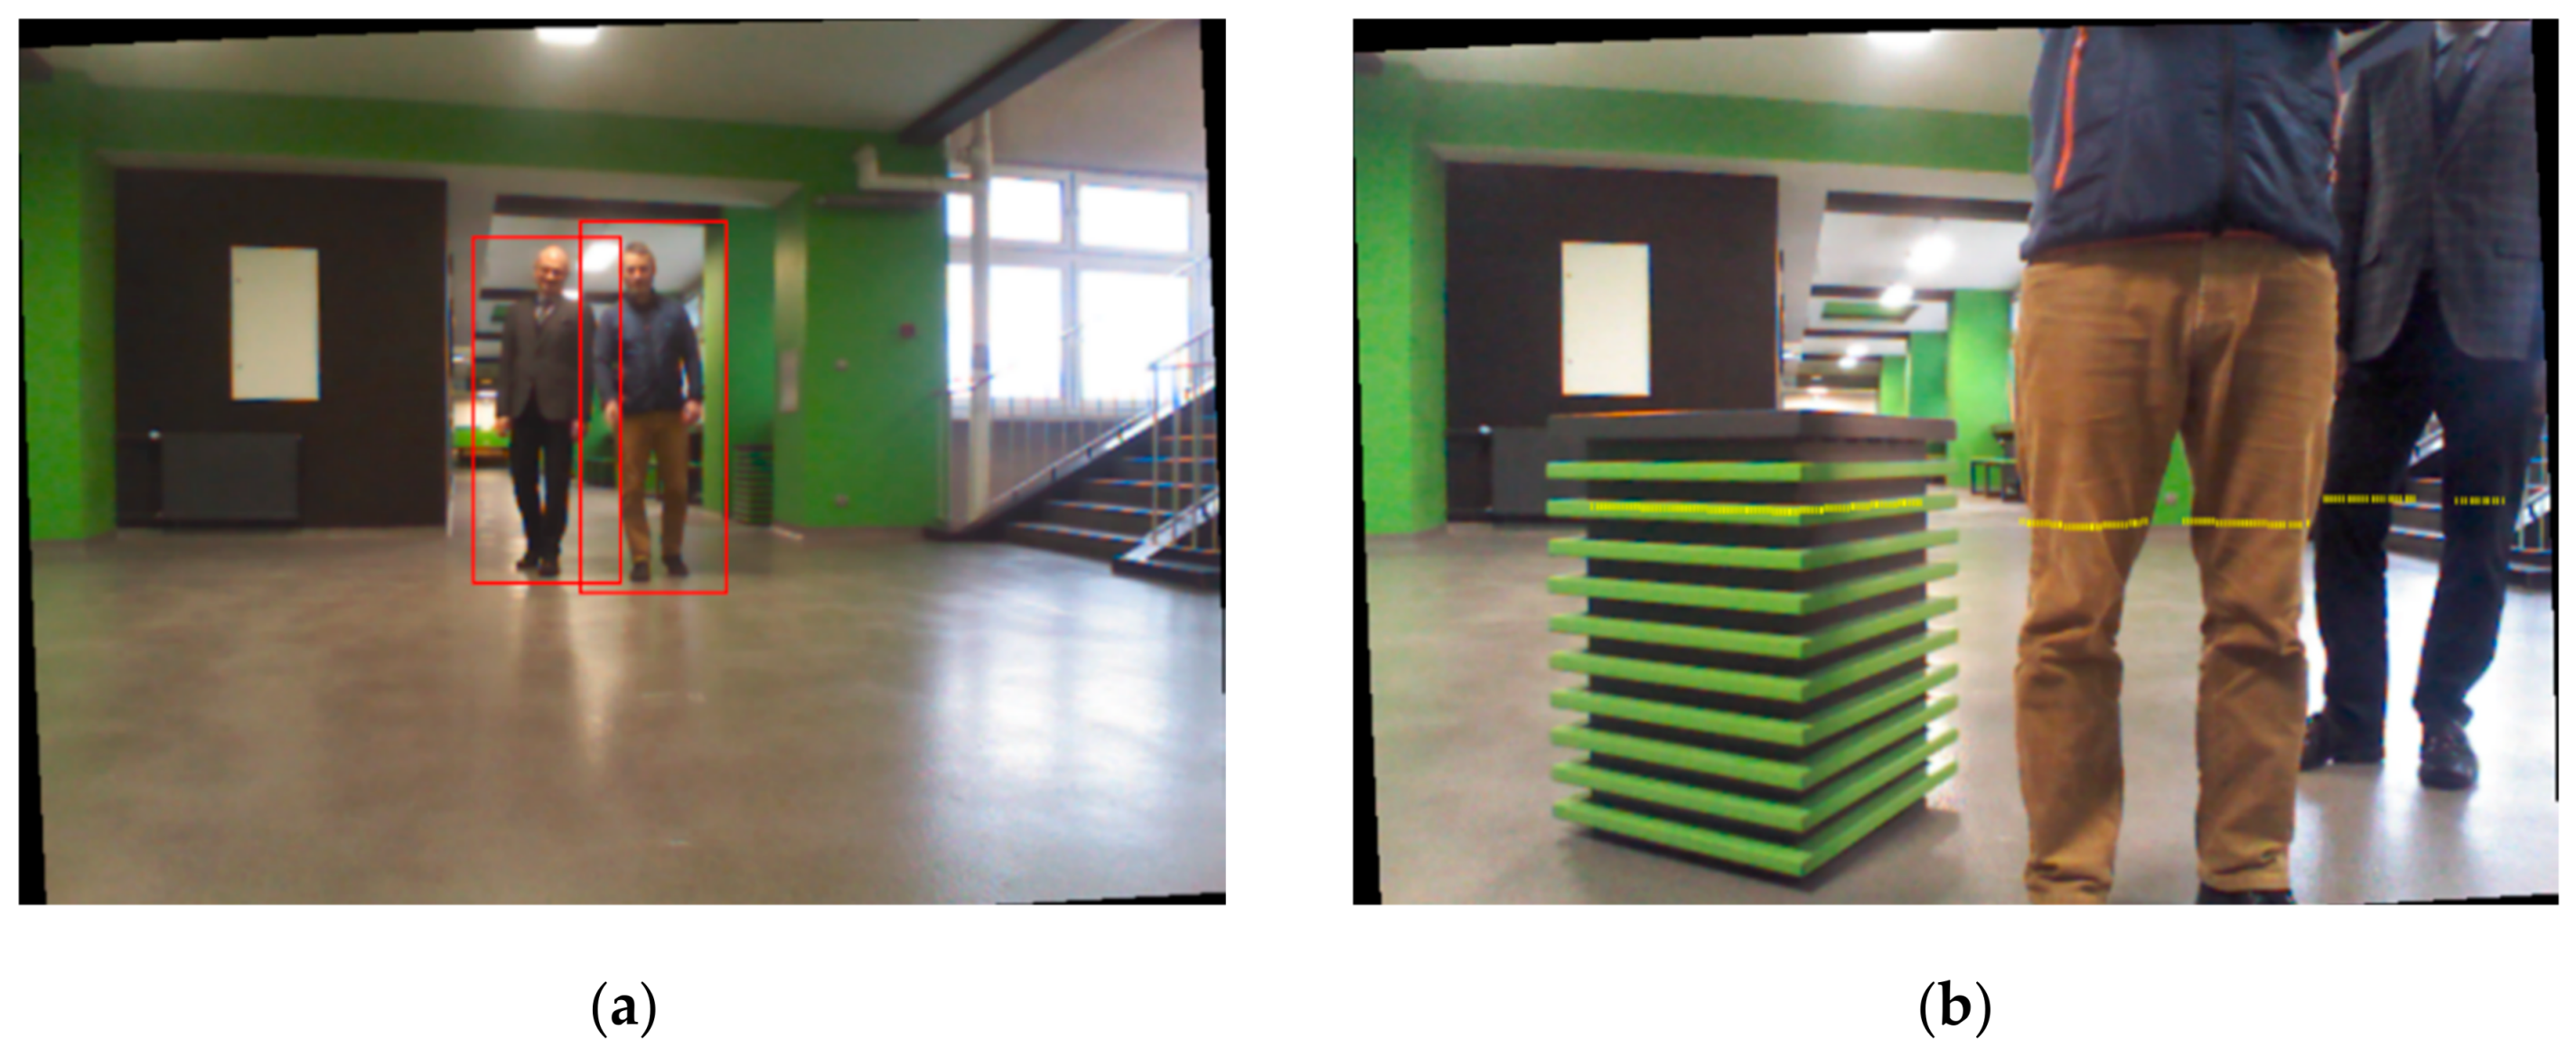
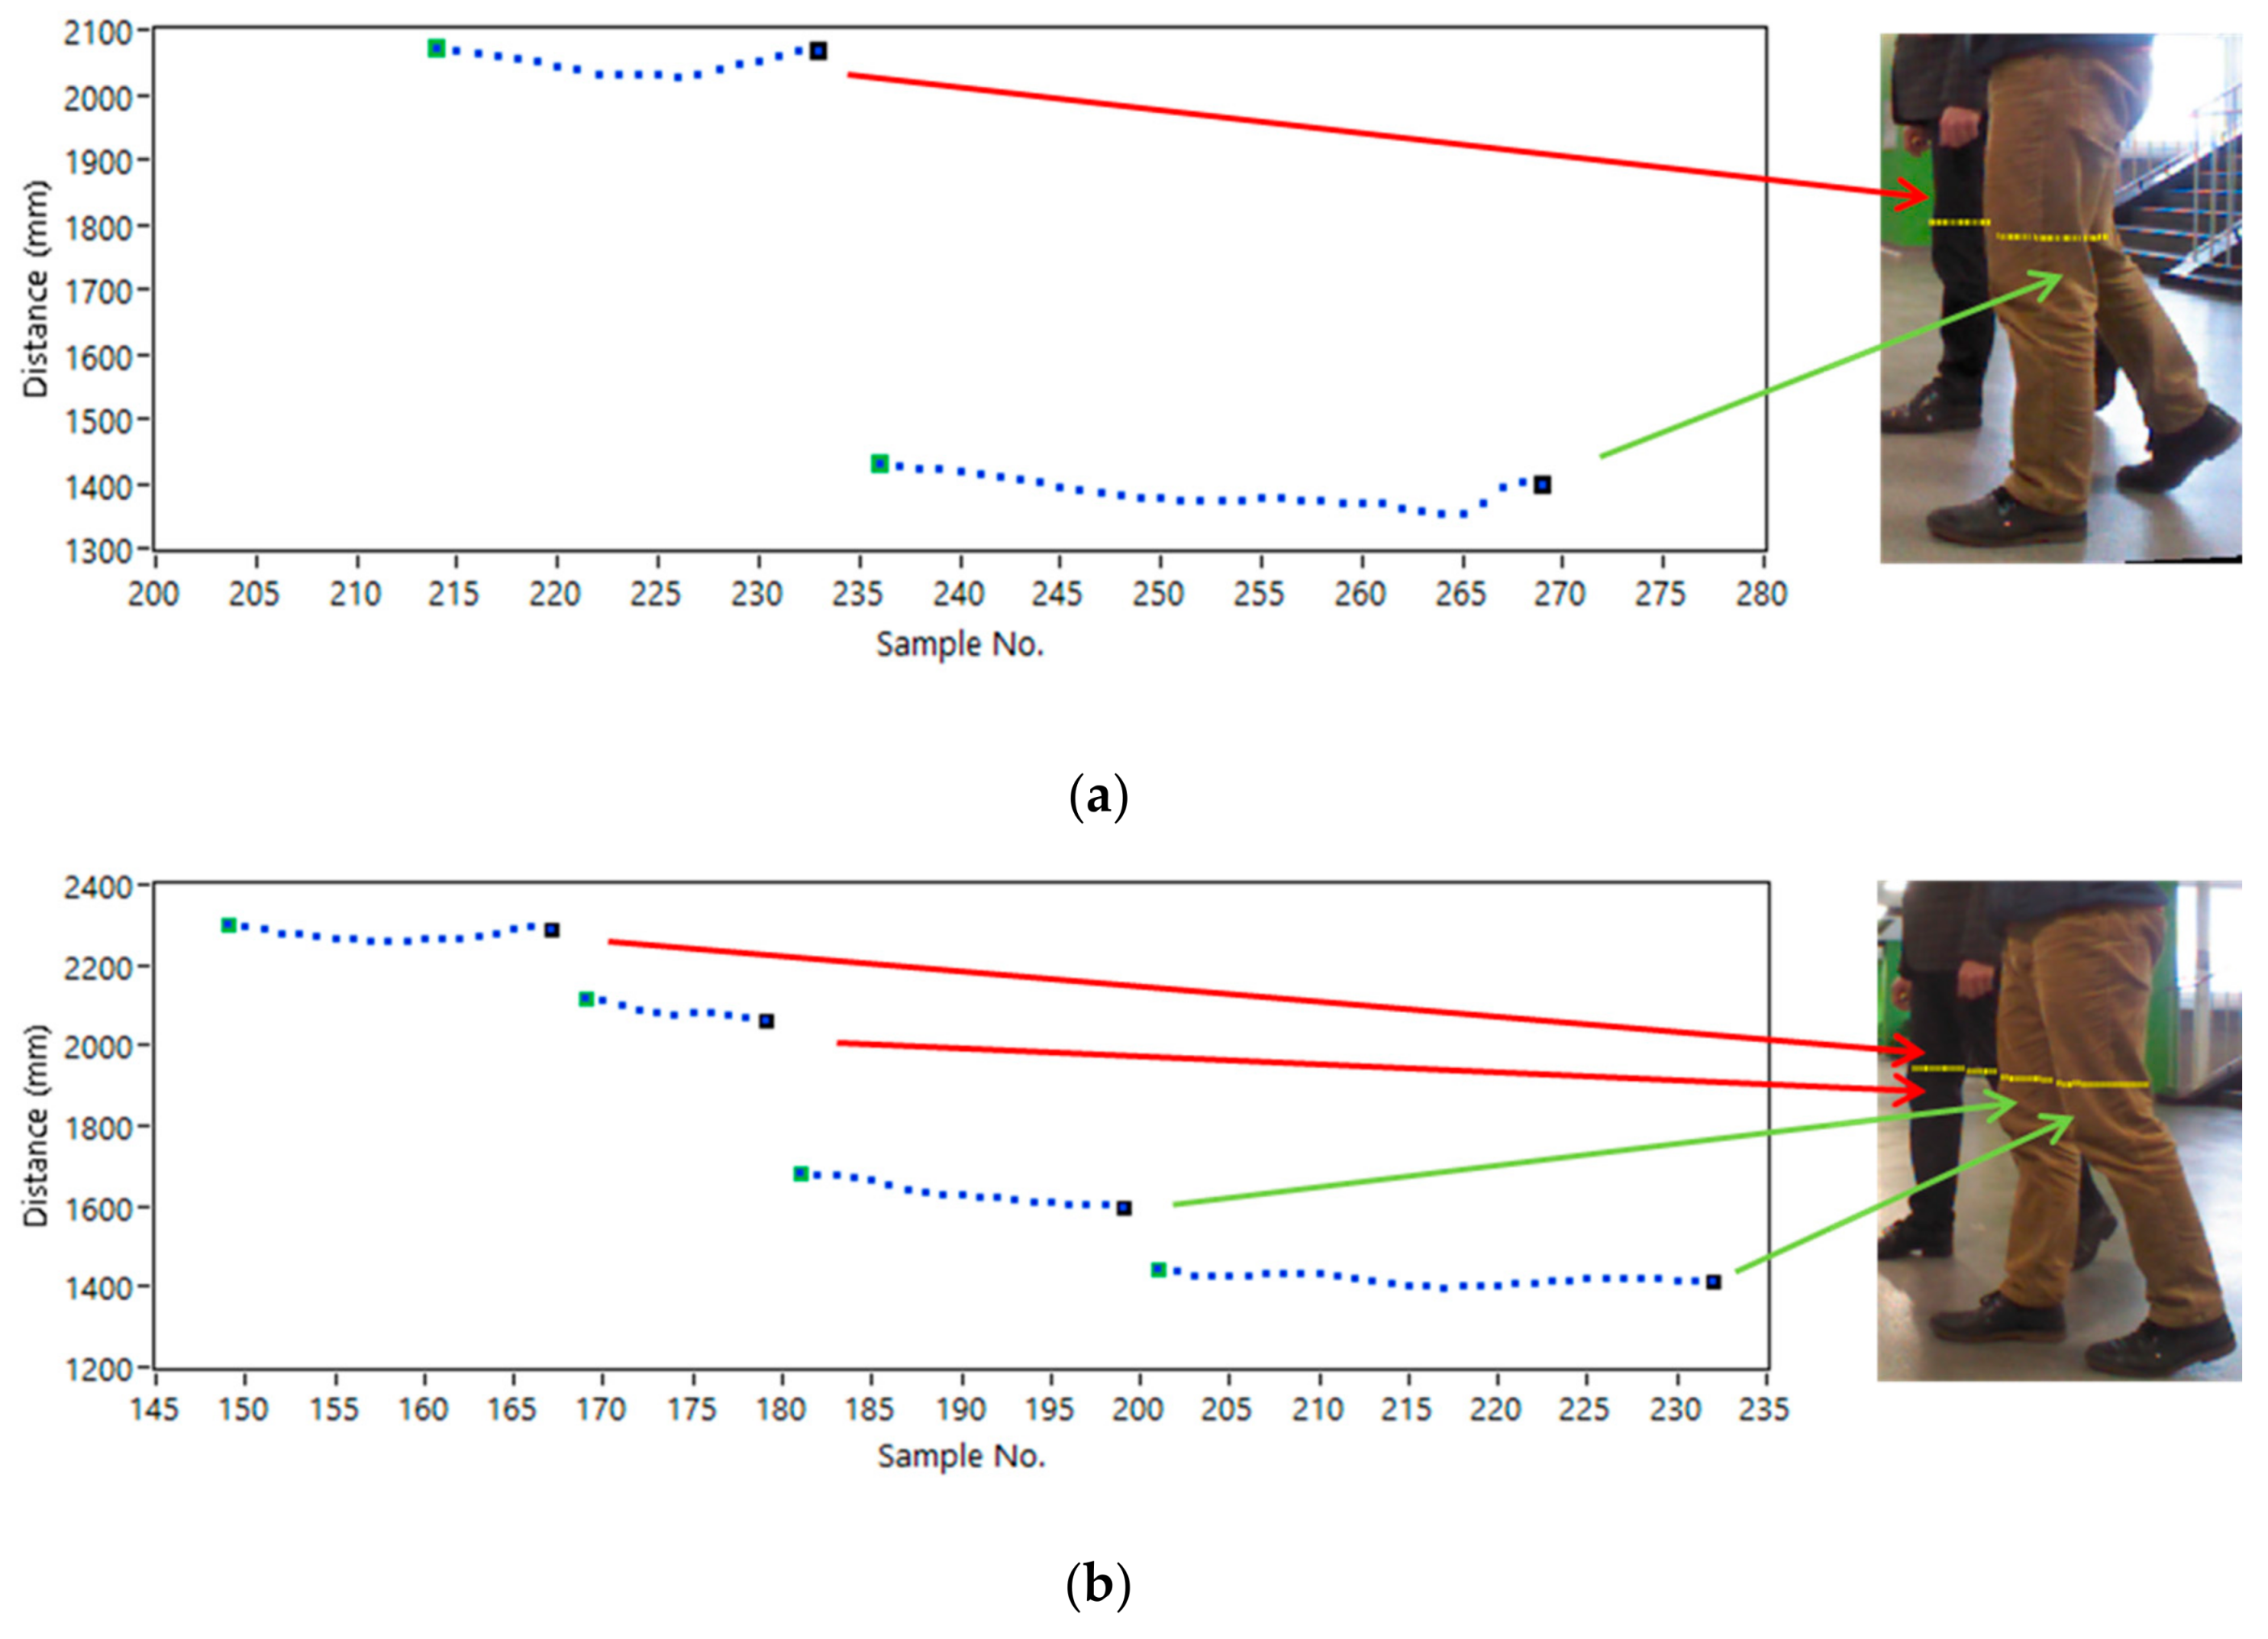
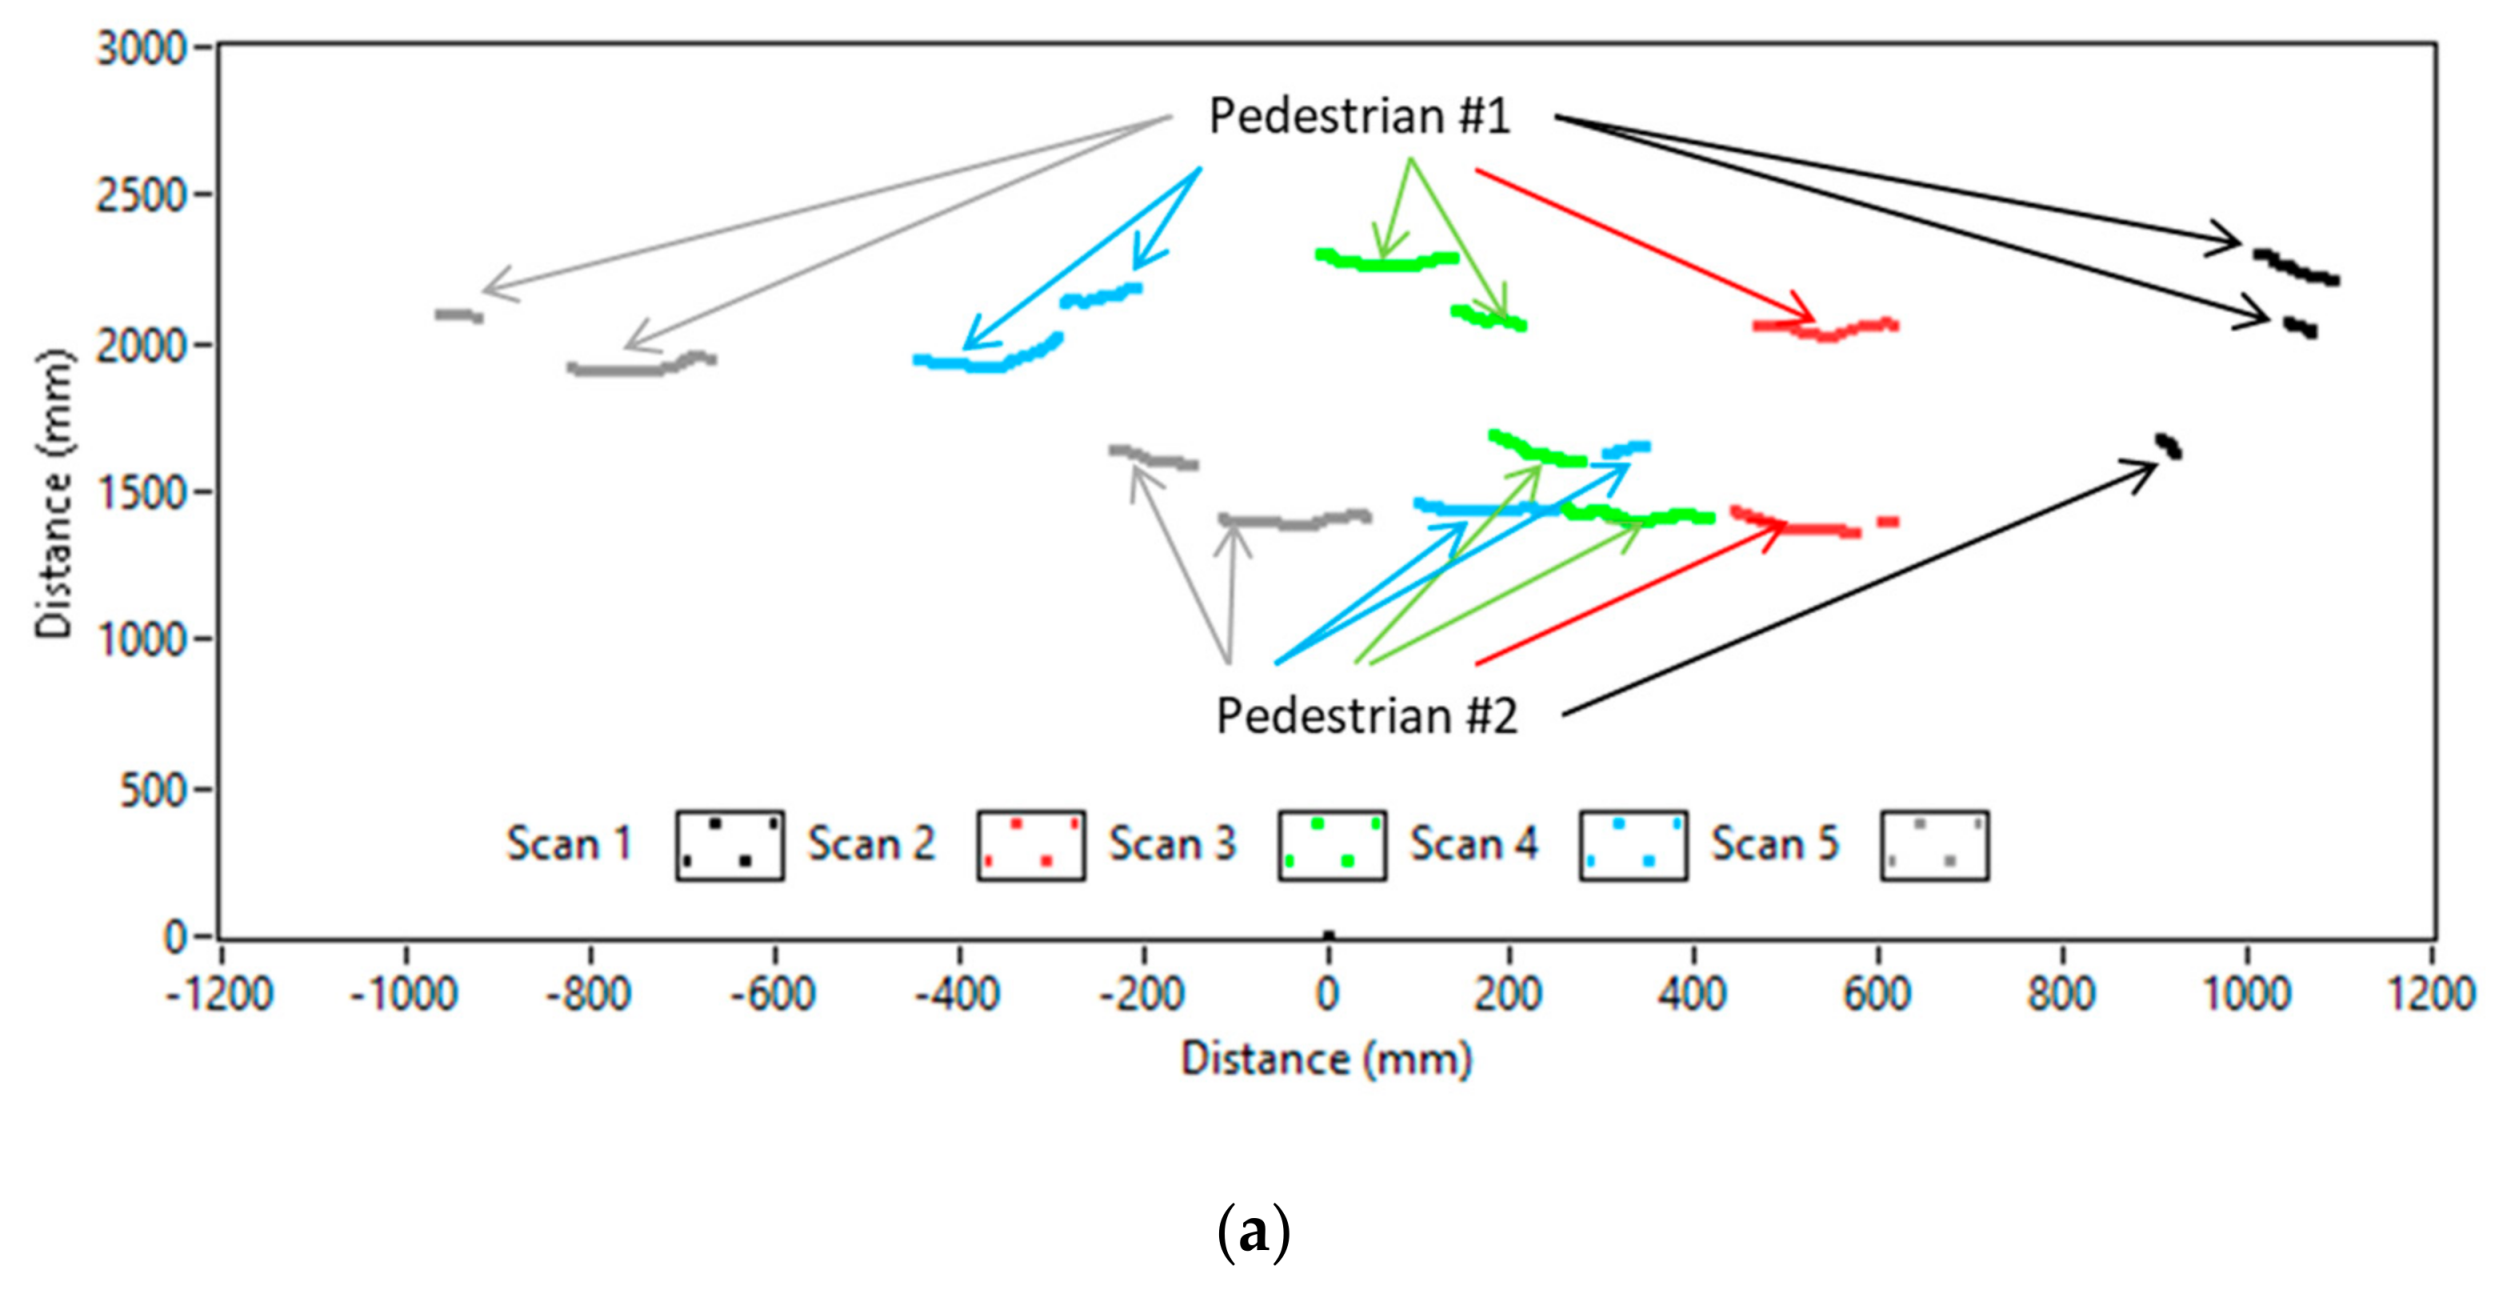
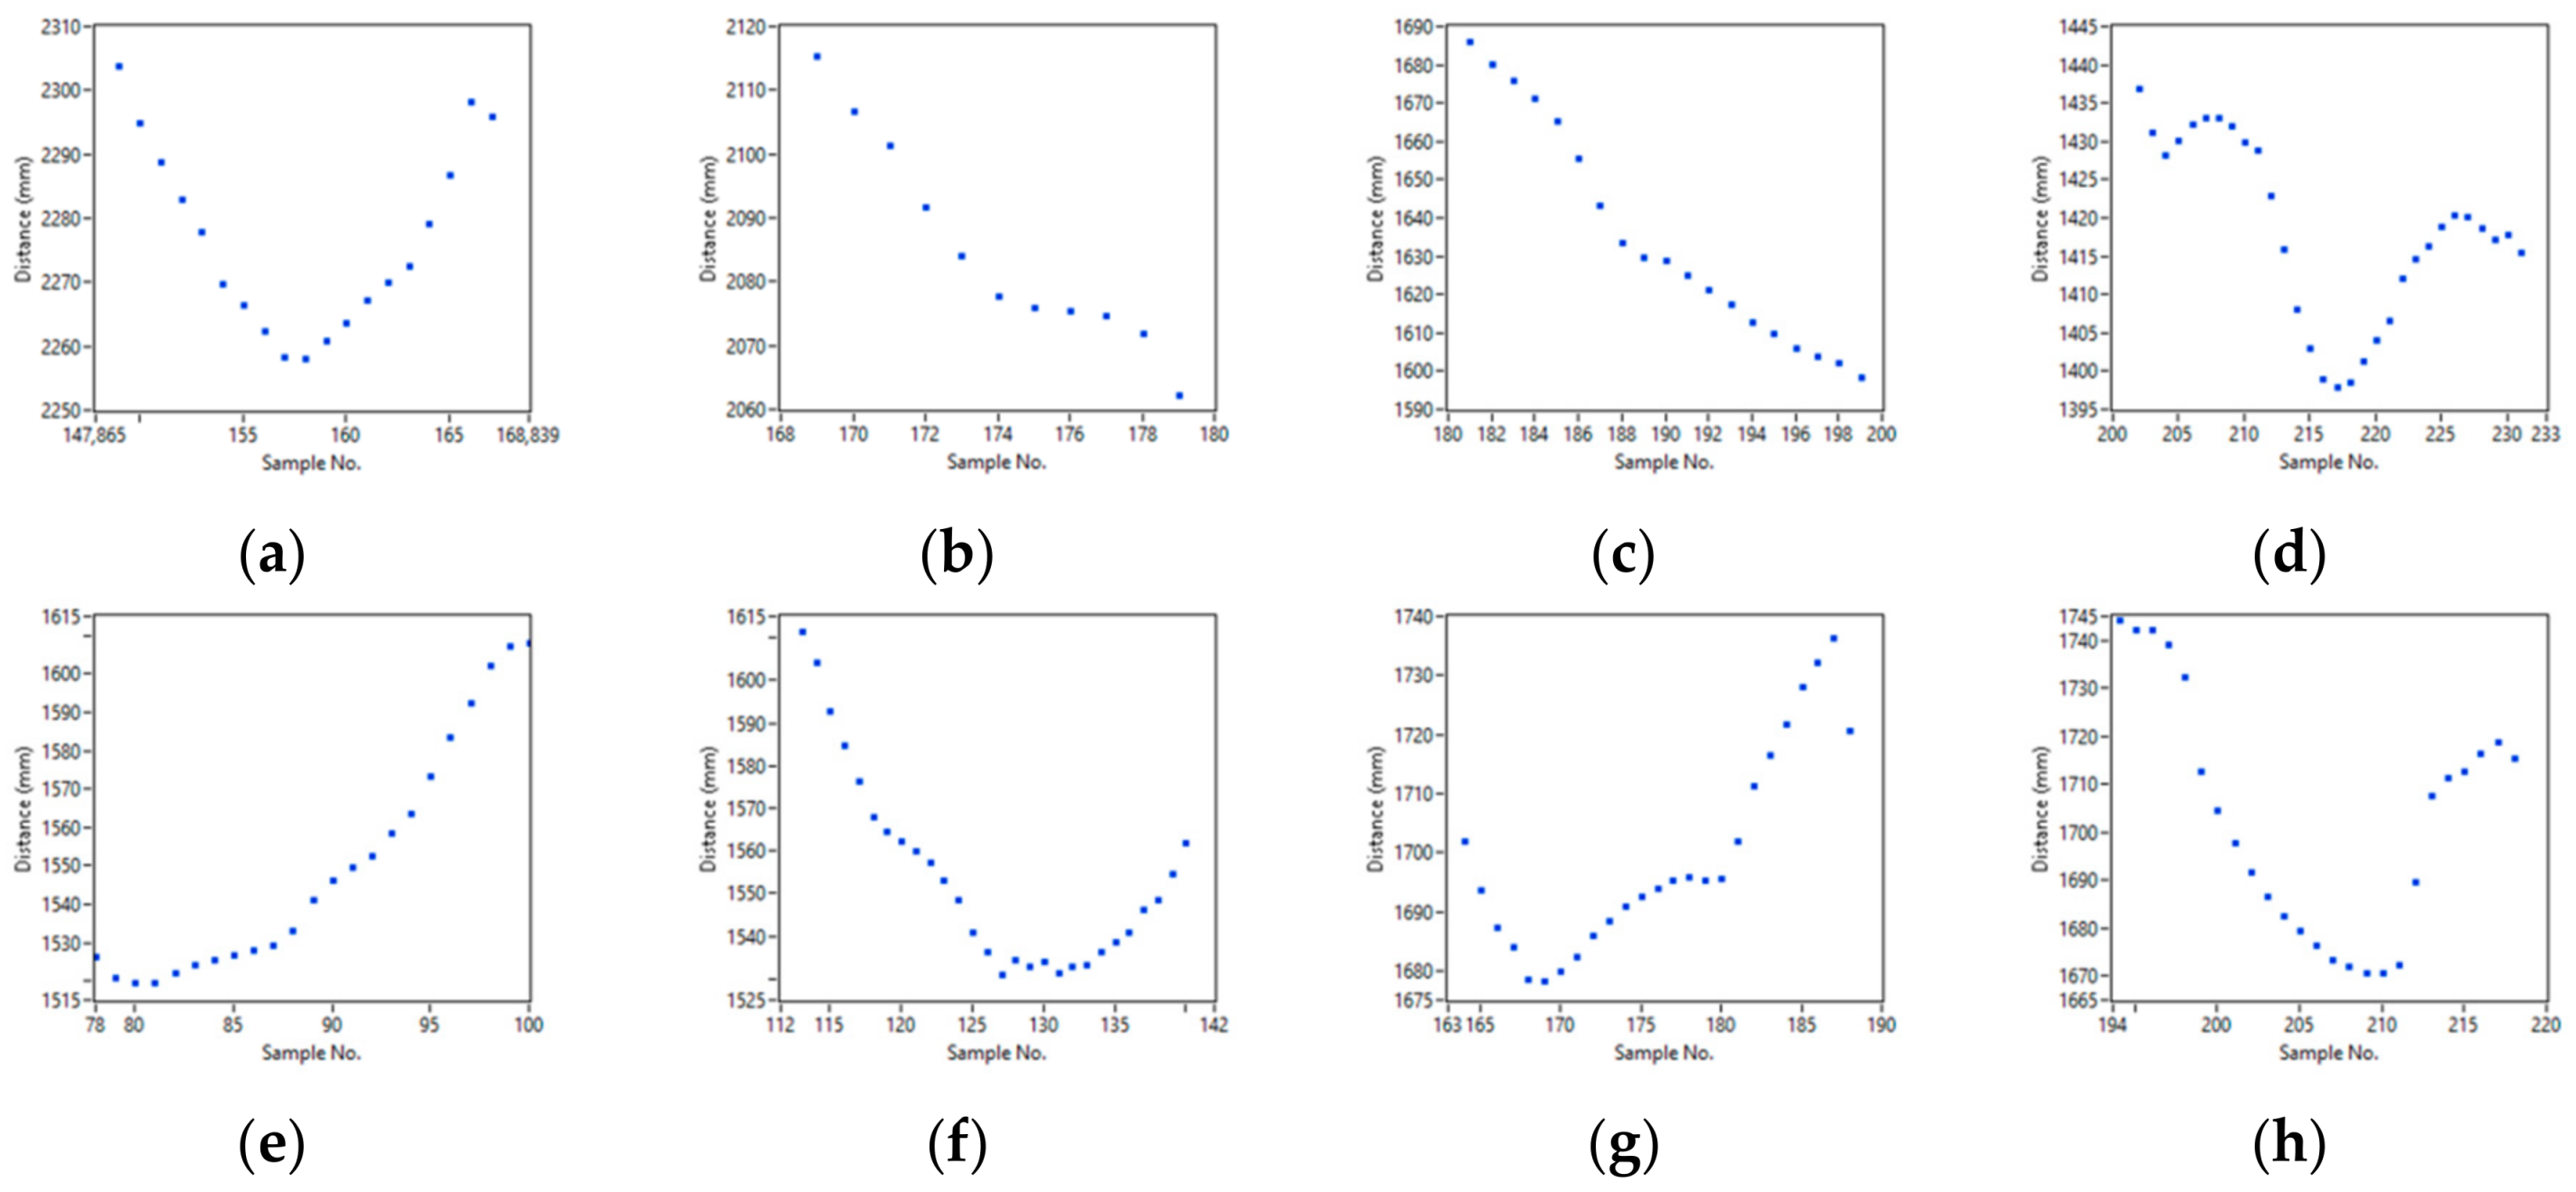
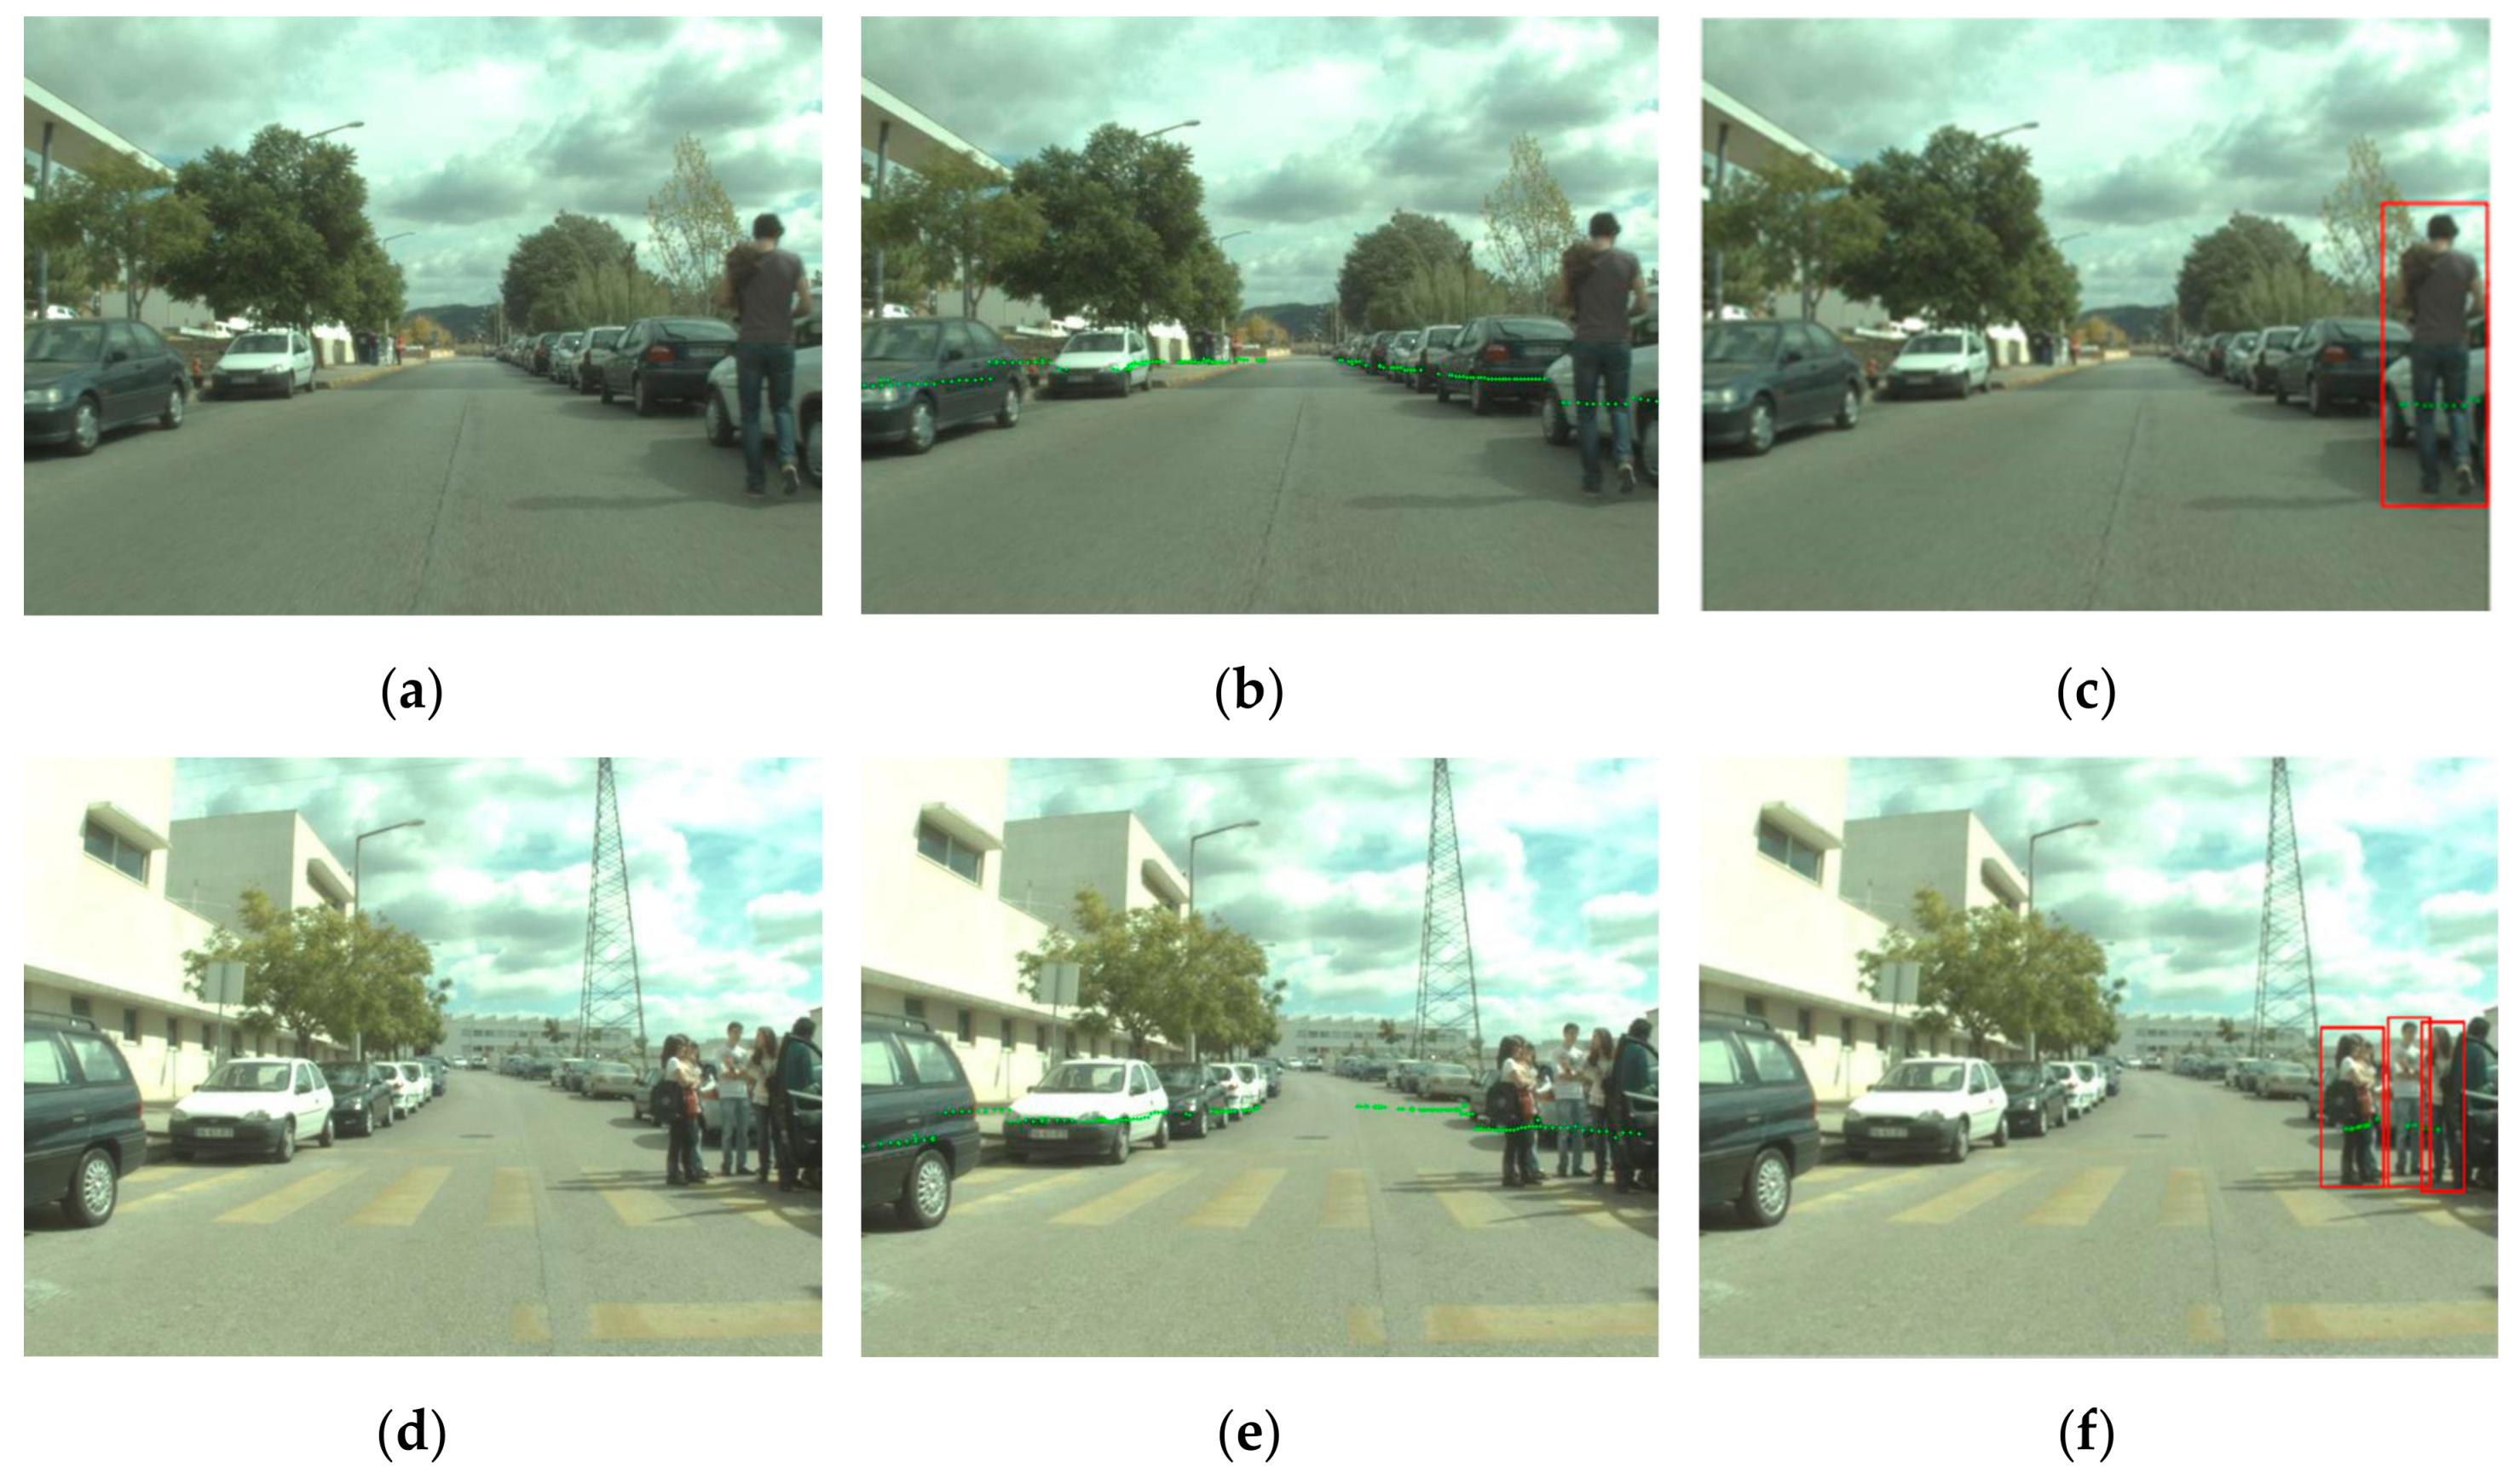
Table 1.
Performed experimental scenarios.
| Test Type | Description | Obstacles |
|---|---|---|
| 1 | One human walking towards the test platform | No |
| 2 | Group of people walking towards the test platform | No |
| 3 | Group of people walking towards the test platform | Yes |
| 4 | Group of people walking alongside the test platform | No |
| 5 | Group of people walking alongside the test platform | Yes |
Table 2.
Results for different sensor modalities.
| Type | ACC | TPR | ERR |
|---|---|---|---|
| Laser (1) | 0.611 | 0.701 | 0.389 |
| Vision camera (2) | 0.812 | 0.928 | 0.188 |
| Infrared camera (3) | 0.810 | 0.934 | 0.190 |
| Fusion (1 + 2) | 0.892 | 0.945 | 0.108 |
| Fusion (1 + 3) | 0.889 | 0.943 | 0.111 |
© 2018 by the authors. Licensee MDPI, Basel, Switzerland. This article is an open access article distributed under the terms and conditions of the Creative Commons Attribution (CC BY) license (http://creativecommons.org/licenses/by/4.0/).
Share and Cite
MDPI and ACS Style
Budzan, S.; Wyżgolik, R.; Ilewicz, W. Improved Human Detection with a Fusion of Laser Scanner and Vision/Infrared Information for Mobile Applications. Appl. Sci. 2018, 8, 1967. https://doi.org/10.3390/app8101967
AMA Style
Budzan S, Wyżgolik R, Ilewicz W. Improved Human Detection with a Fusion of Laser Scanner and Vision/Infrared Information for Mobile Applications. Applied Sciences. 2018; 8(10):1967. https://doi.org/10.3390/app8101967
Chicago/Turabian StyleBudzan, Sebastian, Roman Wyżgolik, and Witold Ilewicz. 2018. "Improved Human Detection with a Fusion of Laser Scanner and Vision/Infrared Information for Mobile Applications" Applied Sciences 8, no. 10: 1967. https://doi.org/10.3390/app8101967
Note that from the first issue of 2016, this journal uses article numbers instead of page numbers. See further details here.