The Characteristics of Intrinsic Fluorescence of Type I Collagen Influenced by Collagenase I


1
College of Leather Chemistry and Engineering, Qilu University of Technology (Shandong Academy of Sciences), Jinan 250353, China
2
Room L1.42 Gorlaeus Laboratory, Leiden University, 2311 EZ Leiden, The Netherlands
*
Authors to whom correspondence should be addressed.
Appl. Sci. 2018, 8(10), 1947; https://doi.org/10.3390/app8101947
Submission received: 28 September 2018
/
Revised: 12 October 2018
/
Accepted: 13 October 2018
/
Published: 16 October 2018
(This article belongs to the Section Chemical and Molecular Sciences)
Abstract
:The triple helix structure of collagen can be degraded by collagenase. In this study, we explored how the intrinsic fluorescence of type I collagen was influenced by collagenase I. We found that tyrosine was the main factor that could successfully excite the collagen fluorescence. Initially, self-assembly behavior of collagen resulted in a large amount of tyrosine wrapped with collagen, which decreased the fluorescence intensity of type I collagen. After collagenase cleavage, some wrapped-tyrosine could be exposed and thereby the intrinsic fluorescence intensity of collagen increased. By observation and analysis, the influence of collagenase to intrinsic fluorescence of collagen was investigated and elaborated. Furthermore, collagenase cleavage to the special triple helix structure of collagen would result in a slight improvement of collagen thermostability, which was explained by the increasing amount of terminal peptides. These results are helpful and effective for reaction mechanism research related to collagen, which can be observed by fluorescent technology. Meantime, the reaction behaviors of both collagenase and collagenolytic proteases can also be analyzed by fluorescent technology. In conclusion, this research provides a foundation for the further investigation of collagen reactions in different areas, such as medicine, nutrition, food and agriculture.
1. Introduction
Fluorescence spectroscopy is considered an effective method of studying the reactions of biomolecules. Owing to its simple operation, cheap instrumentation, high sensitivity and selection, it has been widely used in medicine, food, nutrition and many other fields [1]. Yu-Hua [2] investigated the interaction between type I collagen and Hypocrellin B using fluorescence spectroscopy. The bioelectric property of collagen was explored, which resulted from the ideal molecular arrangement and potential intramolecular and intermolecular interactions. Furthermore, it was found the intrinsic fluorescence of type I collagen could be excited through hydrogen bonding and electrostatic forces [3]. Sun proposed an alternative fluorescence method to measure the thermal stability of collagen mimic peptides [4]. Additionally, acid-soluble collagen, which was extracted from walleye pollock skin, was analyzed by the external fluorescence probe of pyrene, and the aggregation behavior of collagen was studied [5]. The aggregation concentration of collagen was revealed through the transient fluorescence decay study. There is potential for developing fluorescence spectroscopy technology for collagen mechanism research in different areas, including medicine, nutrition, food and agriculture.
It is well known that the intrinsic fluorescence of proteins comes from aromatic amino acids, such as phenylalanine, tyrosine and tryptophan residues; this is a valuable probe to explore protein-protein interactions apart from other external influences [6]. Due to a lack of tryptophan [7] and phenylalanine residues [8] in type I collagen, its intrinsic fluorescence may be a result of tyrosine. Up to now, type I collagen plays an essential role in embryonic development, tissue repair, wound healing and organ formation, owing to its unique biochemical characteristics [9,10]. In recent years, the anomaly of type I collagen in connective tissue results in arterial stiffness, joint damage, reduced osteogenesis, decreased lung expansion and even neuropathy [11,12]. Therefore, investigating collagen reaction mechanisms is significant and important. As is known, collagen structure can be changed by collagenase cleavage, which may influence the intrinsic fluorescence of collagen, especially in degradation pathways, observed by fluorescence spectroscopy. Toyoshima presented that collagenase I could hydrolyze type I collagen by reacting with diverse sites in type I collagen [13]. Thus, how the reaction between type I collagen and collagenase influences the intrinsic fluorescence of collagen deserves to be studied. It is significant and essential to characterize the behavior of not only collagenase but also other collagenolytic proteases.
This paper studied the influence of collagenase I on collagen intrinsic fluorescence, and the mechanism is explained. Type I collagen was reacted with collagenase I; the intrinsic fluorescence intensity was evaluated and the interaction mechanism was further analyzed. The changes of collagen intrinsic fluorescence, which was influenced by the aggregation status of collagen molecules, was observed and analyzed. This method would provide the basis of researching the collagen reaction mechanism using fluorescence spectroscopy, and it is expected to guide the application of collagenase I in artificial skin, bone repair, collagen casing, animal food and cosmetic products.
2. Materials and Methods
2.1. Reagents
Type I collagen (Preparation from cow Achilles tendon, MW~300,000) and other chemical reagents were purchased from Source leaf organism (Shanghai, China). Collagenase I (Preparation from Clostridium histolyticum) was purchased from Life Technologies (Shanghai, China). Sodium dihydrogen phosphate, disodium hydrogen phosphate, chloramine T, perchloric acid and acetic acid were all analytical grades and obtained from Sigma-Aldrich (Shanghai, China). Doubly distilled water was used in all experiments.
2.2. Analysis of Fluorescence Spectroscopy
Type I collagen sample was dissolved in 0.5 M acetic acid into 0.4 mg/mL at 4 °C. Collagenase I was dissolved in 0.2 mol/L PB (pH = 7.4) buffer covering a range of 0–0.12 mg/mL (0, 0.02, 0.04, 0.08, 0.12 mg/mL). The above solutions were homogenized. Type I collagen was mixed with 0.12 mg/mL collagenase I (1:1, v/v) at room temperature and the fluorescence intensities of the solution were measured by a Cary Eclipse Fluorescence Spectrophotometer (Agilent Technologies, Waldbronn, Germany) every 10 min. A variety of concentrations of collagenase (0, 0.02, 0.04, 0.08, 0.12 mg/mL) were added in type I collagen solution in a 10 mL volumetric flask (1:1, v/v) at 25 °C and their fluorescence intensities were tested after 30 min. The fluorescence spectroscopy measurements were performed to observe the changes of tyrosine and tryptophan of Type I collagen with the excitation wavelength (λex) of 280 nm [14]. The emission spectrum was in the range of 300–500 nm with a scanning rate of 300 nm/min, and the voltage was 800 V. Furthermore, the synchronous fluorescence spectroscopy of samples was carried out for in-depth analysis of tyrosine, where the D-value (Δλ) was set at 15 nm.
2.3. High-Performance Liquid Chromatography (HPLC) Analysis
Collagenase I (0 and 0.12 mg/mL) was added into the collagen solution (1:1, v/v) for 30 min, then the mixed solution was dialyzed in dialysis bags (mv ≤ 3000) for 24 h at 4 °C and the liquid outside the dialysis bags was collected. Then, 20 μL samples were filtered by a membrane (0.45 μm) and injected into the HPLC system for analysis. The HPLC system included a Shimadzu LC-20AT pump, an SPD-20A ultraviolet detector, an InertSustain C18 column (4.6 × 150 mm, 5 μm) and a CTO-20A injection valve with a 20 μL sample fixed loop (Shimadzu, Tokyo, Japan). The mobile phase consisted of 40% acetonitrile and 60% NH4Ac (30 mmol, pH 7.8), and the flow rate was 1 mL/min. The chromatography of samples was monitored by an ultraviolet detector at 280 nm wavelength at 30 °C [15].
2.4. Analysis of Particle Size
The nanoparticle granulometry determined the percentage of different particle sizes in a range of size classes and indicated the average particle size. The type I collagen sample was dissolved in 0.5 M acetic acid at 0.4 mg/mL concentration at 4 °C, and the particle sizes were measured. The samples of collagenase I were prepared to different concentrations of solution (0, 0.02, 0.04, 0.08, 0.12 mg/mL), and 2 mL of these liquids was transferred into 10 mL beakers, while 2 mL of 0.4 mg/mL collagen liquids was added into these beakers. After 30 min reacting, the particle sizes of these samples were measured and analyzed using a Nano-ZS90 Nanoparticles granulometry (Malvern, England). Moreover, a change in particle size of 0.4 mg/mL type I collagen was observed over 0–48 h.
2.5. Analysis of Hydroxyproline Concentration
The preparation of samples was similar to Section 2.4. The hydroxyproline concentration of samples was measured by using a modified method of Yu Ignat’eva [16]. The oxidation of hydroxyproline was performed with 2 mL of Chloramine-T every test tube; the mixture was placed at room temperature for 20 min. After the addition of P-dimethylaminobenzaldehyde solution, the test tubes were placed in the water bath and heated to 60 °C for 20 min. After cooling down to room temperature by cold water for 5 min, the absorbance was measured at λ = 558 nm in order to calculate the hydroxyproline concentration of the samples.
2.6. SEM Analysis
Collagenase I (0, 0.02 and 0.12 mg/mL) was added into the collagen solution (1:1, v/v) for 30 mins, then the mixed solution was frozen and dried at −40 °C for 24 h. The aggregation of collagen fibers was analyzed by Gemini 500 Environmental Scanning Electron Microscope (Hitachi, America, Tarrytown, NY, USA) [17] at the magnification of ×2000 and ×300,000. All measurements were carried out at 25 °C.
2.7. Differential Scanning Calorimetry (DSC) Analysis
Collagenase I (0, 0.02, 0.06 and 0.12 mg/mL) was added into the collagen solution (1:1, v/v), after freezing and drying. The thermal stability of these samples was measured using a Differential Scanning Calorimeter (TA instrument, New Castle, DE, USA) at a uniform heating rate of 5 °C/min [18].
3. Results and Discussions
3.1. Fluorescence Spectroscopy Analysis
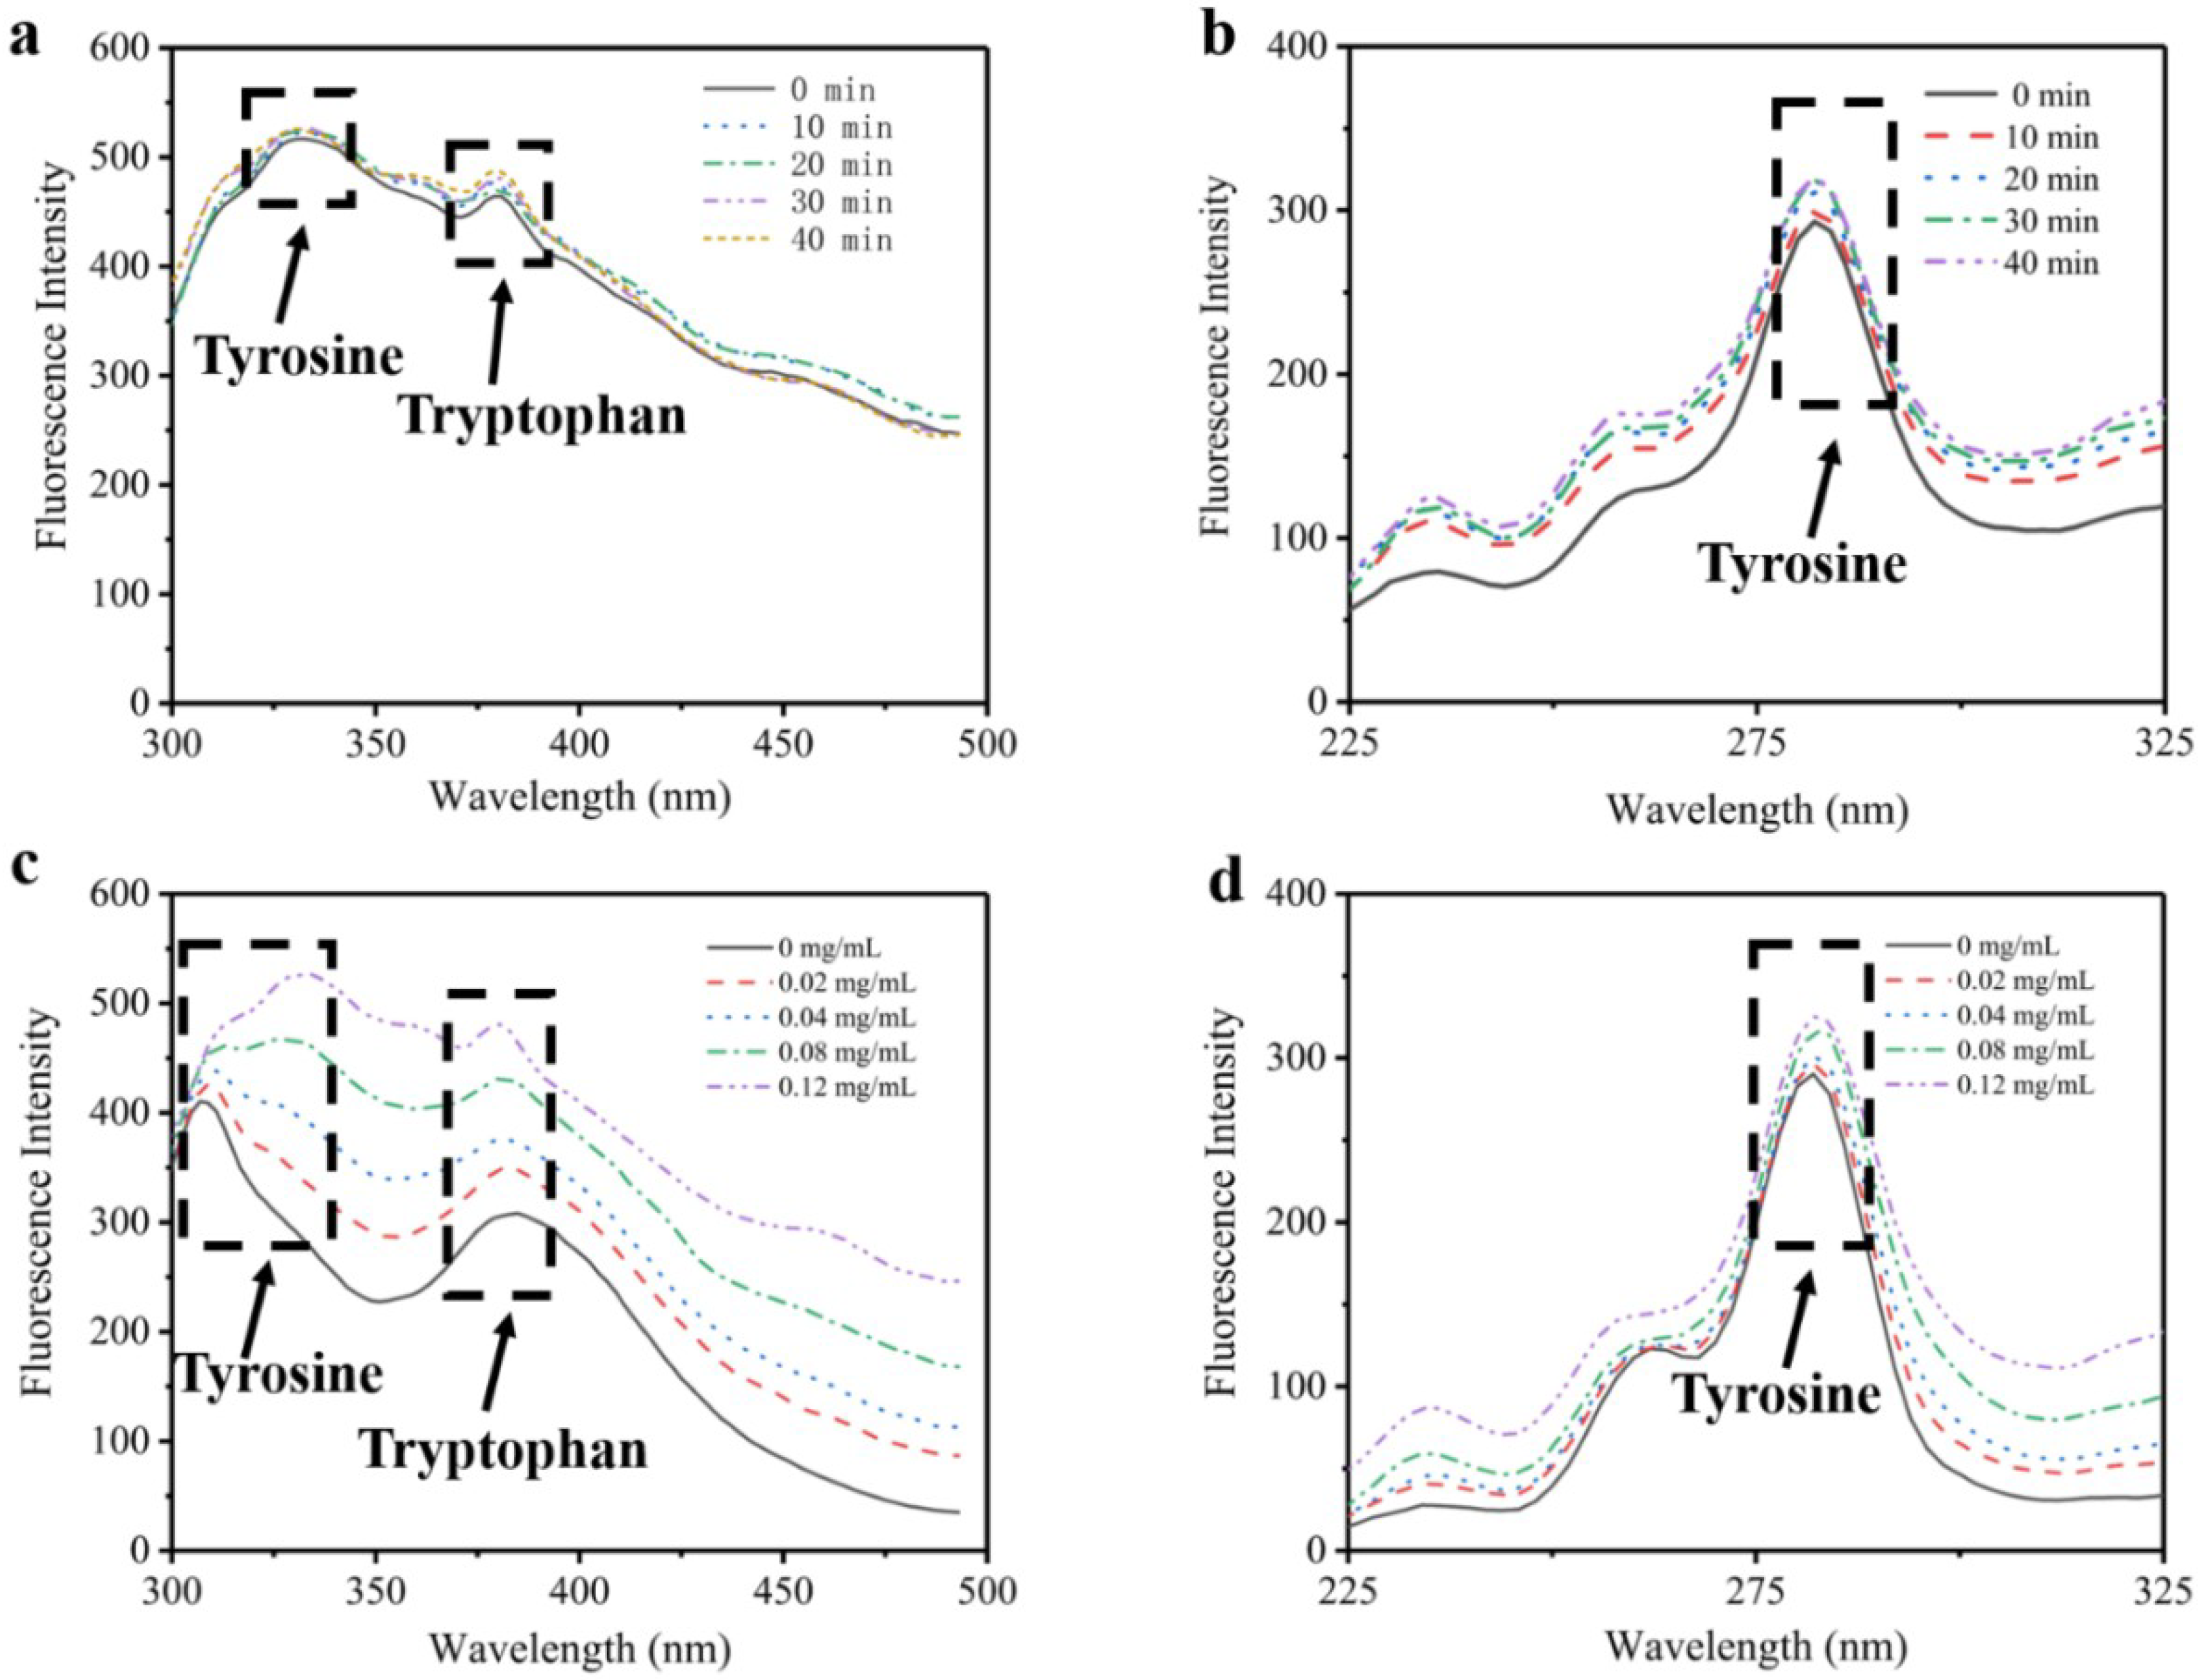
Due to a lack of phenylalanine and tryptophan [19,20], the intrinsic fluorescence of type I collagen is presumed to be dominated by tyrosine. Compared to traditional fluorescence technology, synchronous fluorescence technology can scan monochromators of excitation and emission simultaneously. Therefore, synchronous spectroscopy has the more obvious advantages of simplifying spectroscopy, increasing sensitivity and reducing interference [21]. Figure 1 shows the changes of intrinsic florescence intensity of type I collagen influenced by collagenase concentration and time. It reveals that the fluorescence intensity and the synchronous fluorescence intensity increased with increasing collagenase usage. As presented in Figure 1a,c, the peaks at 310 nm and 370 nm represent the existence of tyrosine and tryptophan, respectively [22]. After adding collagenase I, the intensity of the tyrosine peak increased with rising time and concentration. It illustrates that type I collagen aggregation was cleaved by collagenase I, which resulted in exposure of tyrosines wrapped in collagen, and thus the intrinsic fluorescence of type I collagen increased with stronger binding to tyrosine. From Figure 1b,d, it is seen that the intensity of the peak at 280 nm increased with the addition of collagenase I, which represented an increase in the number of tyrosine residues.
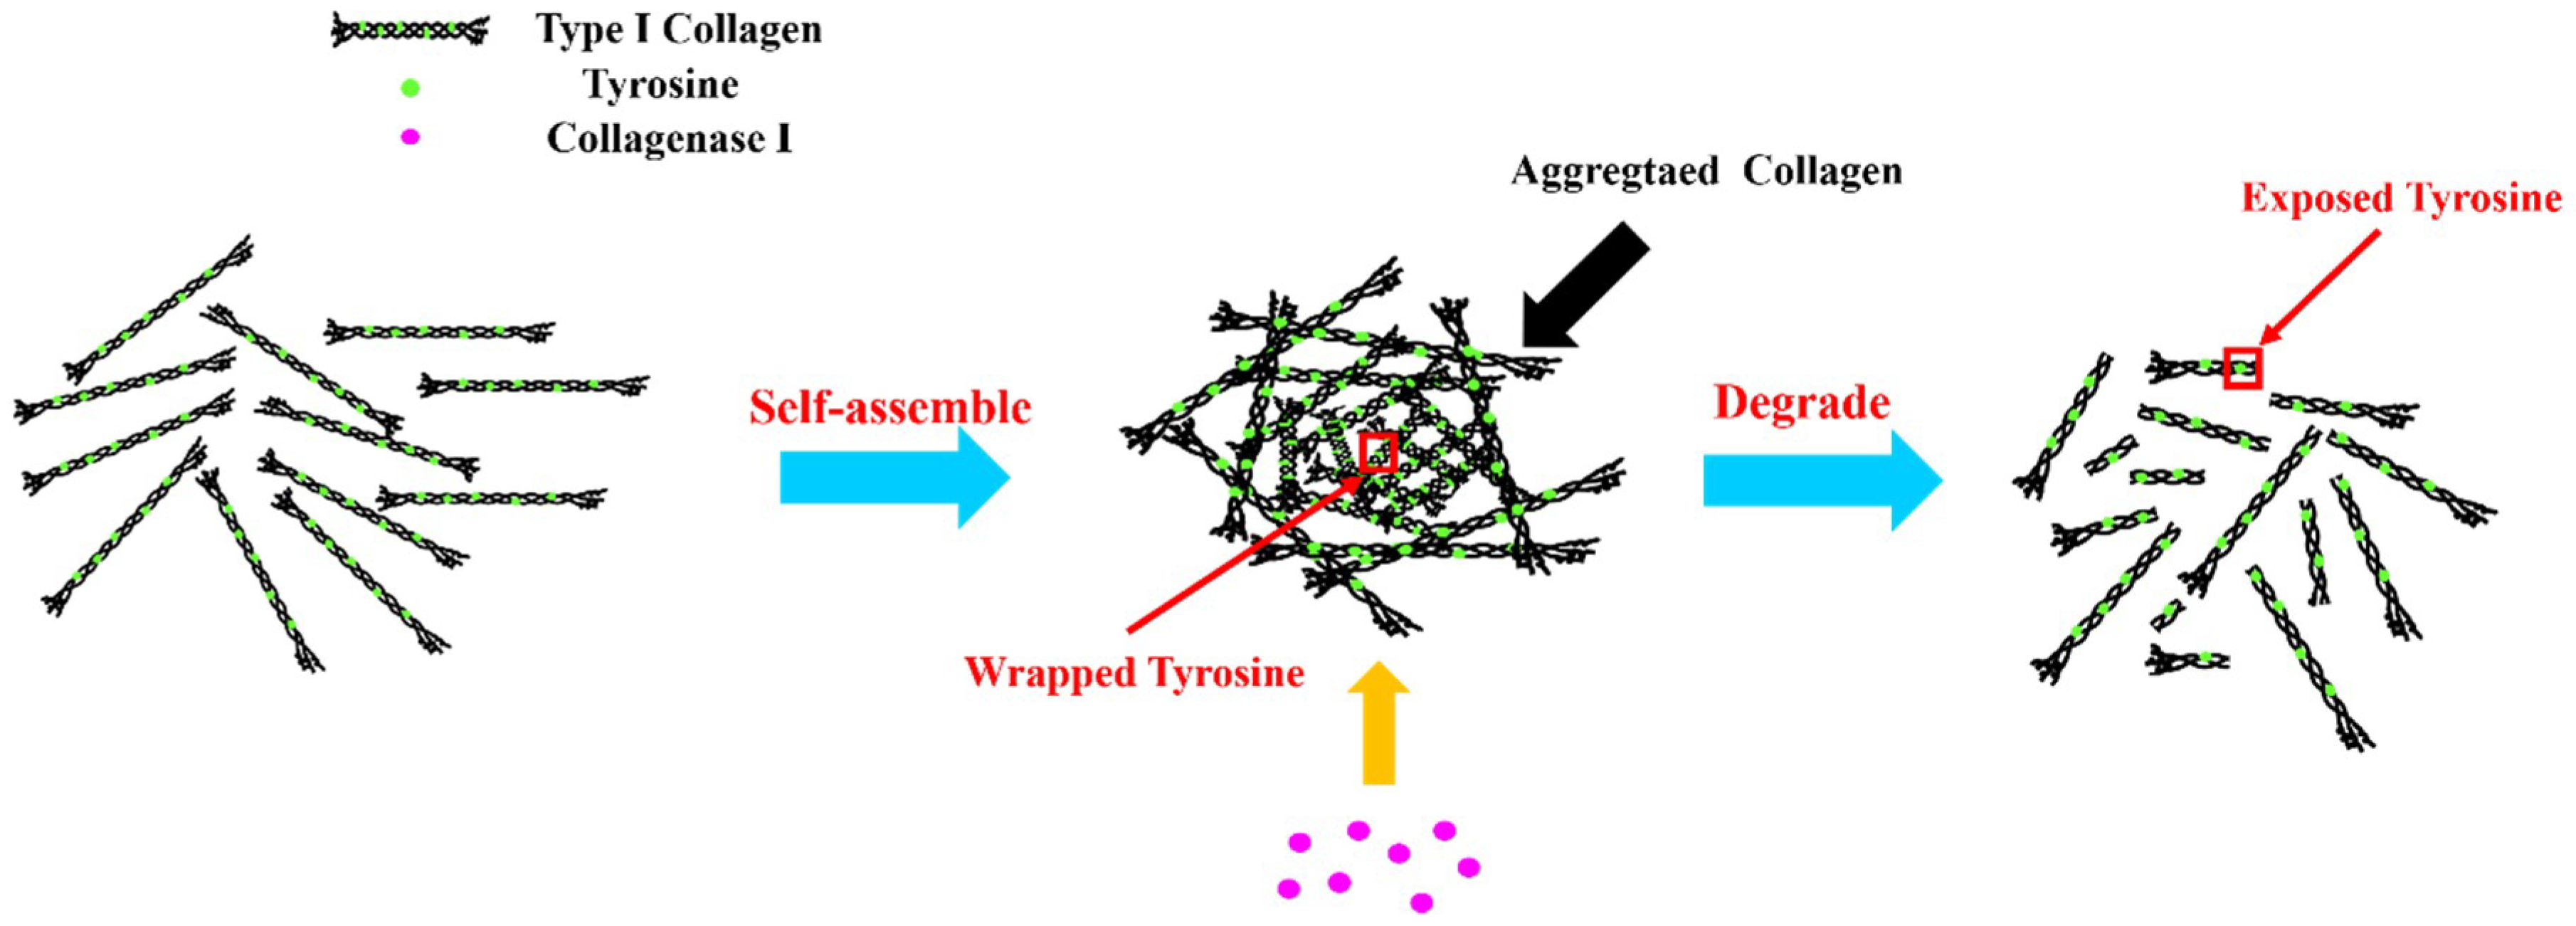
The reaction mechanism can be further illustrated by Figure 2. When type I collagen was dissolved in acetic acid solution, it would form aggregates by self-assembly [23]. A large number of tyrosine residues of type I collagen were wrapped in polypeptide chains, which reduced intrinsic fluorescence intensity. Owing to the cleavage specificity of collagenase I [24] in the sequence of Gly-Pro-X of collagen [25], the aggregated collagen could be degraded into small fragments and the tyrosine residues were exposed for further binding. This enhanced the intrinsic fluorescence intensity of type I collagen.
3.2. Self-Assembly of Type I Collagen
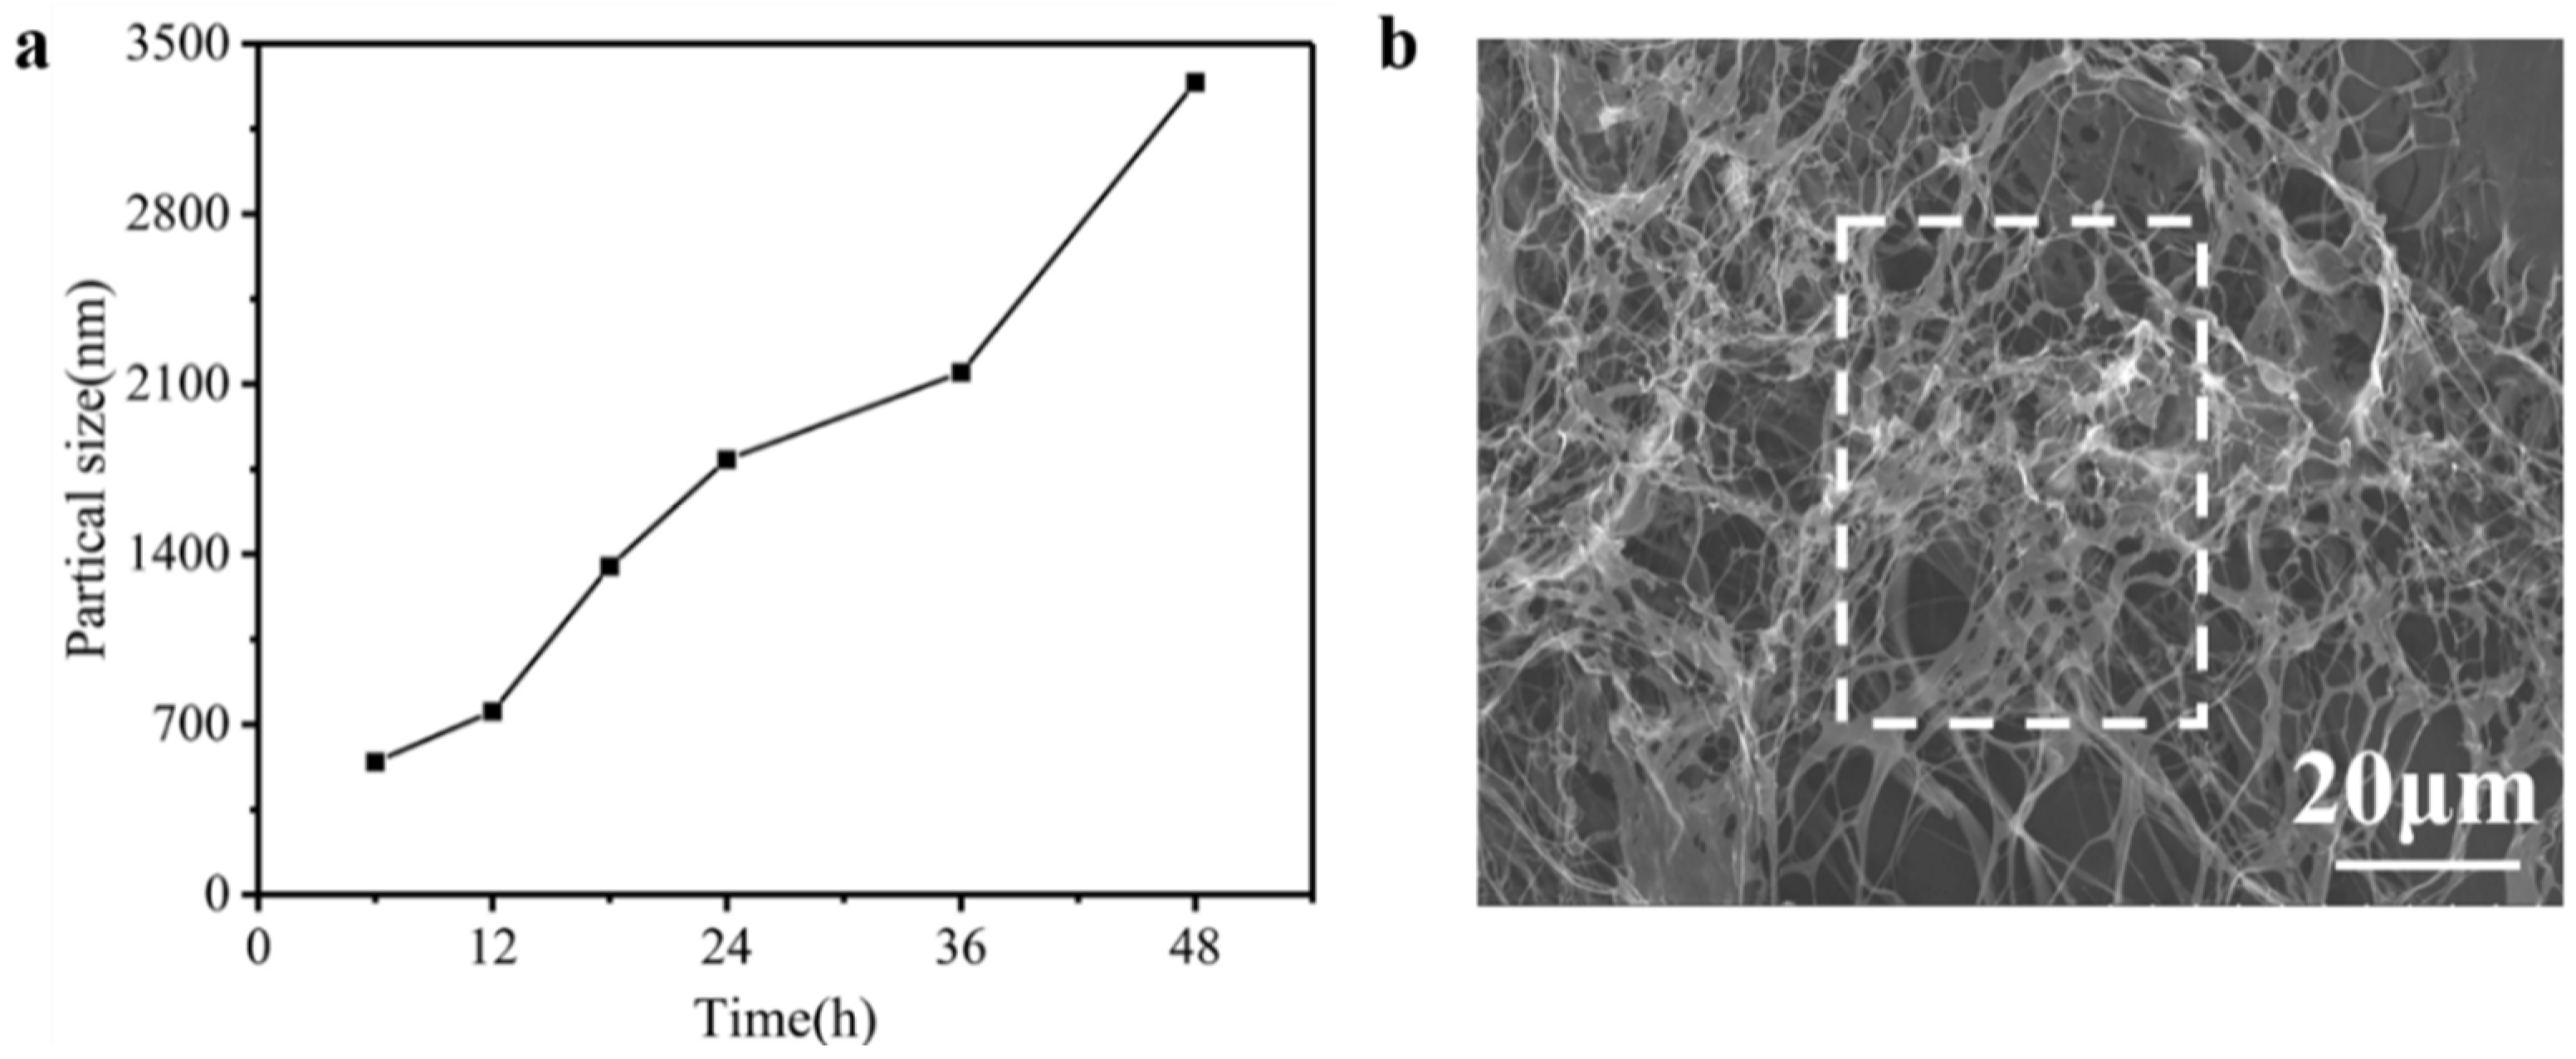
As known, the particle sizes were determined by the shape and size of the nanoparticle [26]. In order to observe the self-assembly of collagen, the particle sizes of type I collagen were measured constantly to evaluate the self-assembly pathway. Figure 3a shows the particle sizes of type I collagen solution, over 48 h, by nanoparticle granulometry. It was found that particle sizes consistently increased as time increased. Normally, the length of a collagen molecule is approximately 280 nm [27]. However, from Figure 3a, it is seen that the particle sizes of type I collagen reached 3000 nm at 48 h, which represents the self-assembly of type I collagen appearing in the solution [28]. In addition, the morphology of collagen fibers was further viewed by SEM. In Fig 3b, a collagen mesh structure is displayed where the collagen fibers are entangled with each other to form a fibrous aggregation [29,30]. These results indicate the self-assembly of type I collagen promoted aggregation and tyrosine would be wrapped in the collagen.
3.3. HPLC Analysis
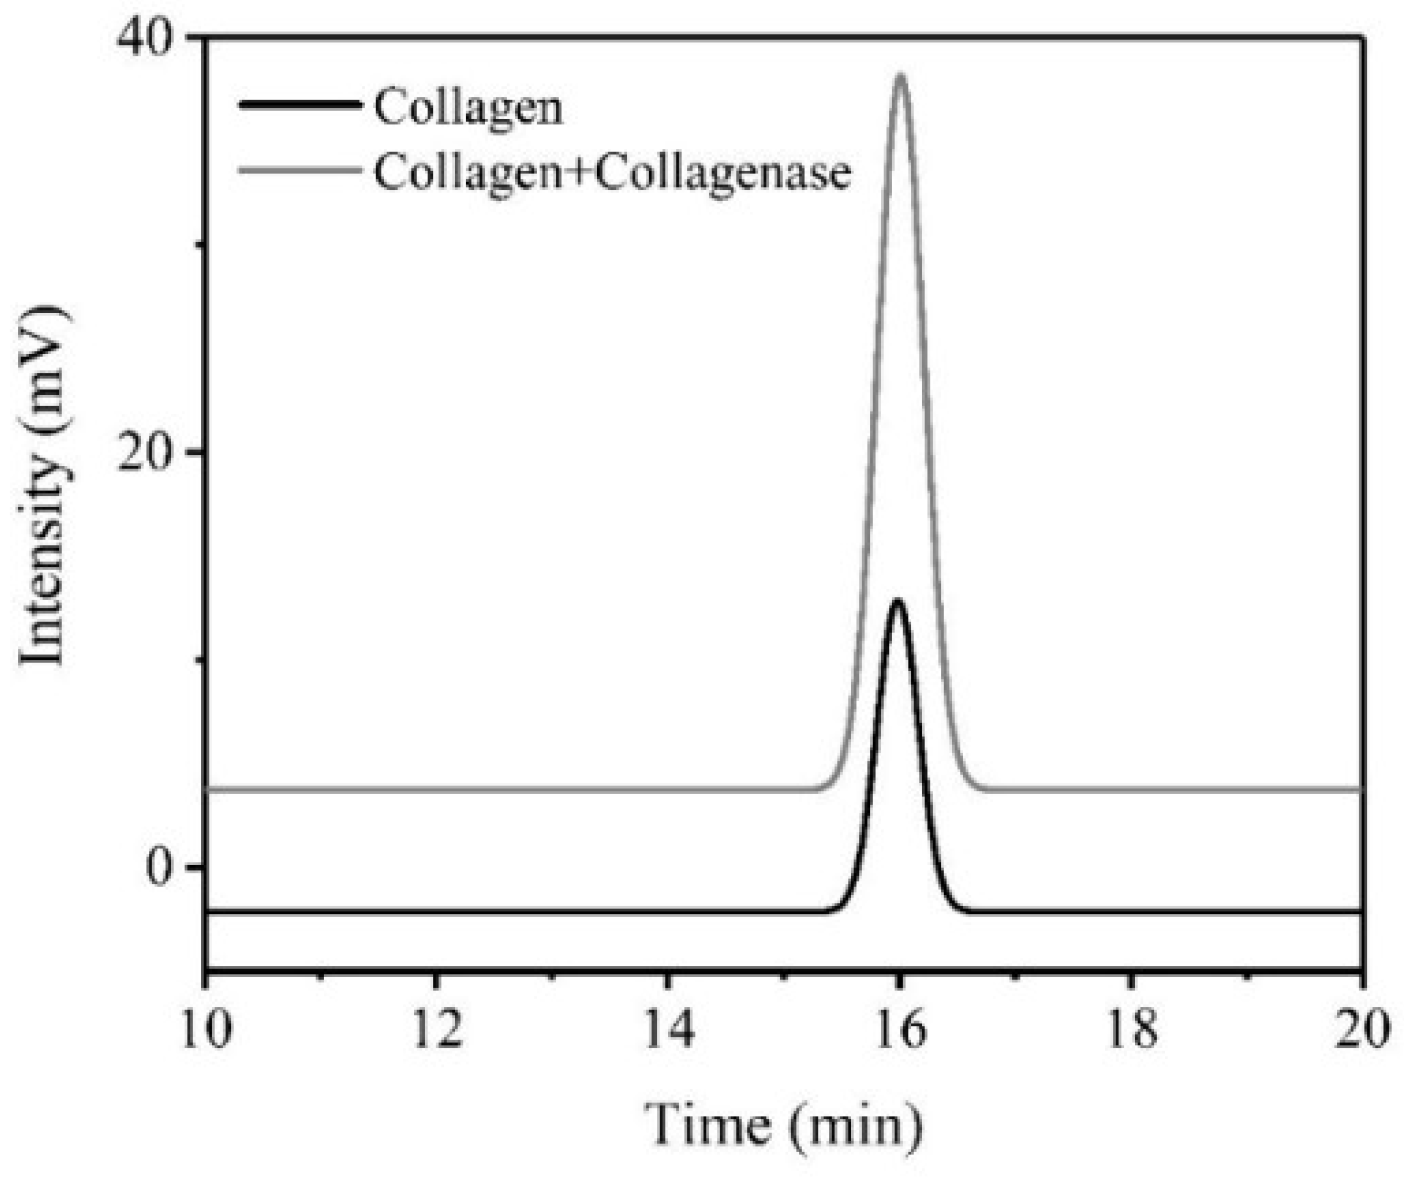
The peak appearing at 16 min represents tyrosine (Figure 4), while the peak area correlated with the tyrosine concentration [31]. It was obvious that dialysate type I collagen with collagenase I contained more tyrosine than without collagenase, which could further demonstrate the theory in Figure 2. Owing to the cleavage of collagenase to the self-assembly aggregated collagen, the tyrosine residues wrapped in collagen would be exposed. Based on the results mentioned, it proved that collagenase I could improve the exposed tyrosine concentration in type I collagen, which resulted in an increased intrinsic fluorescence intensity of type I collagen finally.
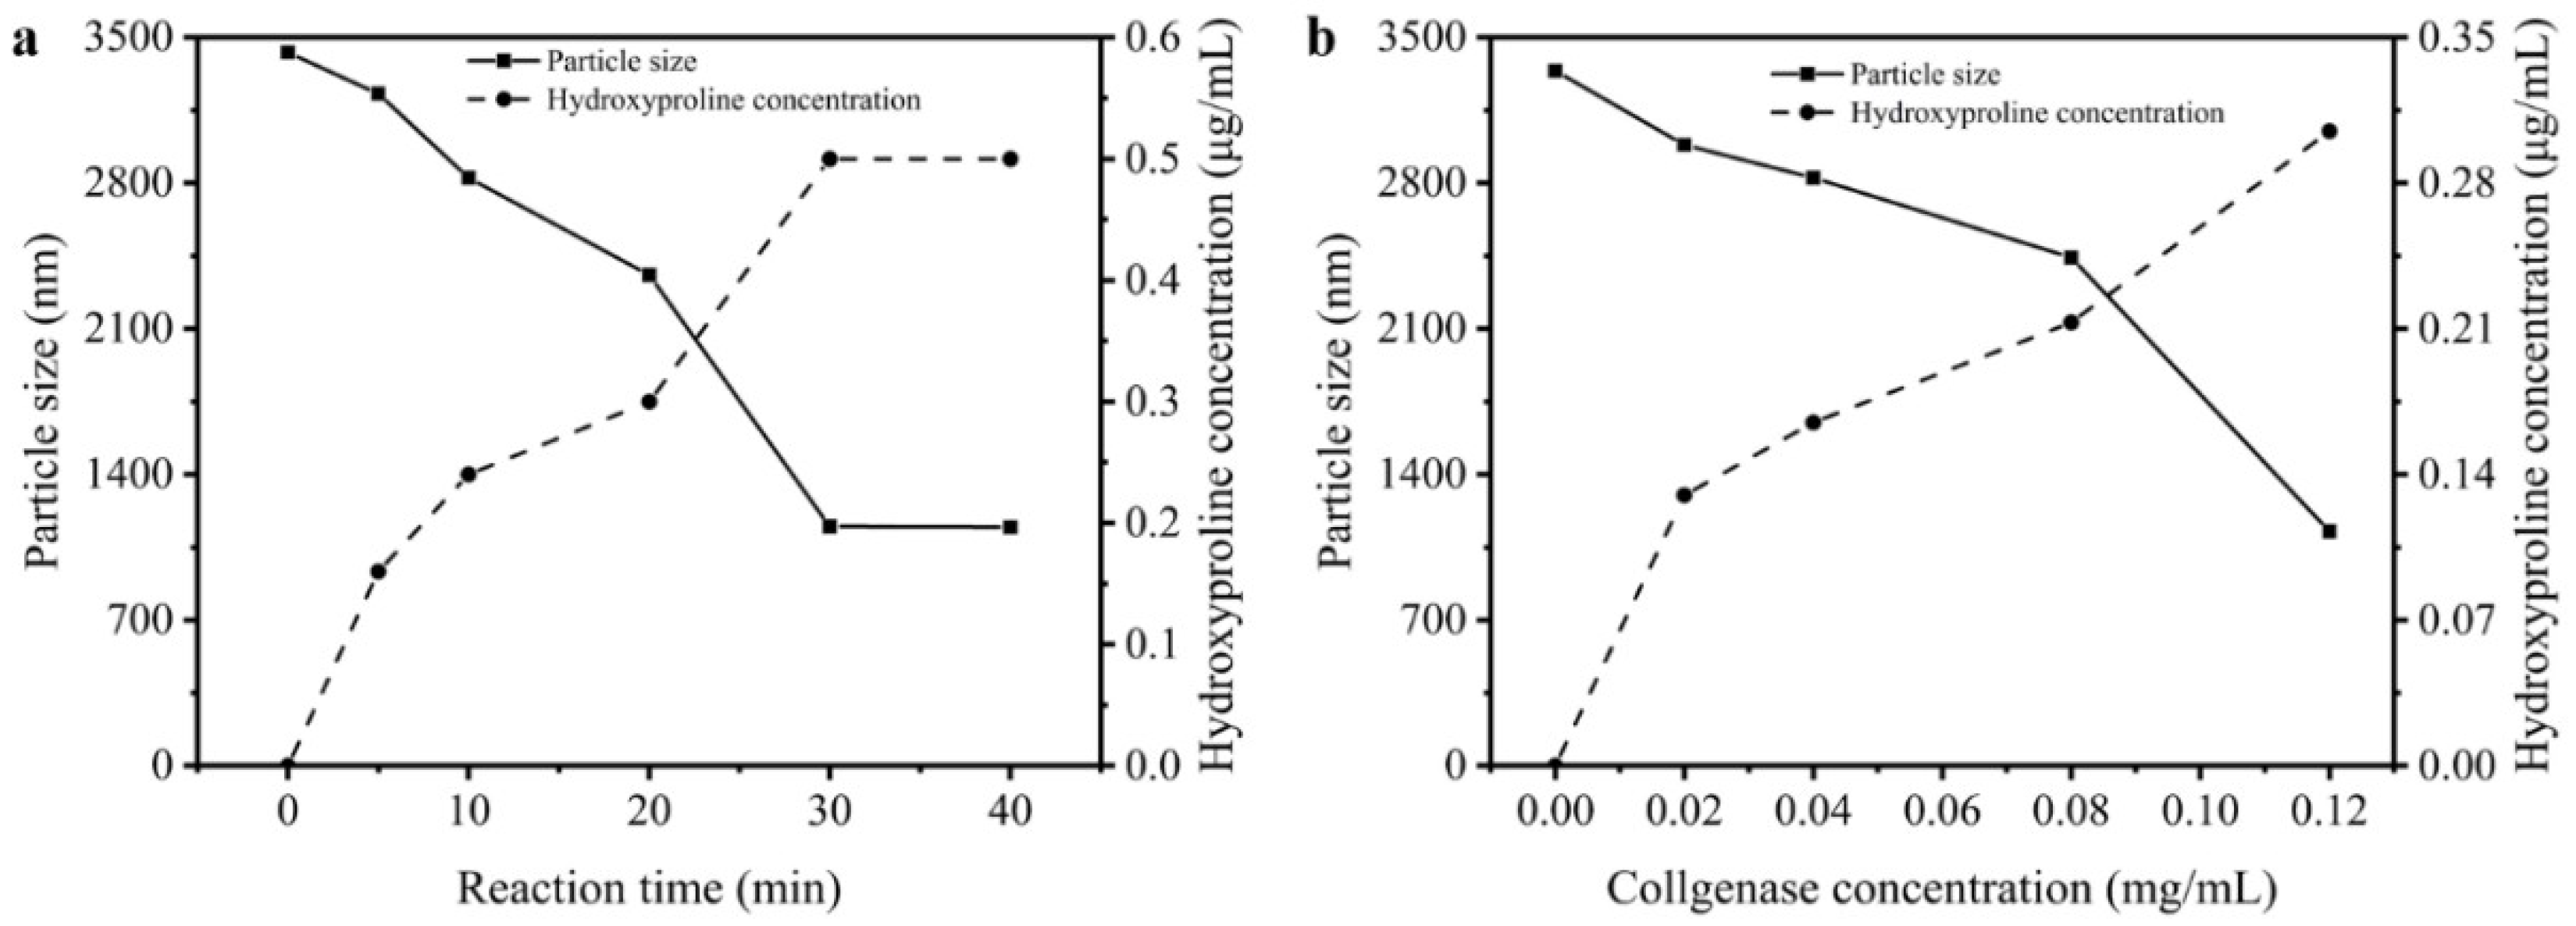
3.4. Particle Sizes and Hydroxyproline Contents of Reaction Solution
Hydroxyproline is the signature amino acid of collagen, thereby its content in the solution directly related to the hydrolysis degree of type I collagen. The changes in particle sizes and hydroxyproline concentration in solution could be analyzed to investigate the dissociation of collagen aggregates. Figure 5a displays the changes in collagen particle sizes and hydroxyproline concentration during 40 min of reacting with 0.12 mg/mL collagenase I. Owing to self-aggregation mentioned above, the collagen particle size was around 3500 nm and there was no hydroxyproline in the solution. Then with increasing time, the triple-helix structure of type I collagen was degraded by collagenase which resulted in the hydroxyproline concentration rising in the solution. Therefore, the tyrosine residues which were wrapped in the aggregation could be exposed, and it caused the fluorescence intensity of type I collagen to increase. Figure 5b shows the dissociation of type I collagen, which was degraded by different concentrations of collagenase I. Higher dosage of collagenase I contributed to a stronger dissociation of collagen aggregation. Meantime, the particle sizes decreased and hydroxyproline concentration increased. Therefore, the addition of collagenase I changed the self-assembly of type I collagen, which directly complemented the fact that the disappearance of a huge amount of aggregation exposed more tyrosine residues in the solution, which was related to increasing the intrinsic fluorescence intensity as mentioned before.
3.5. Electron Microscope Observation of the Solution
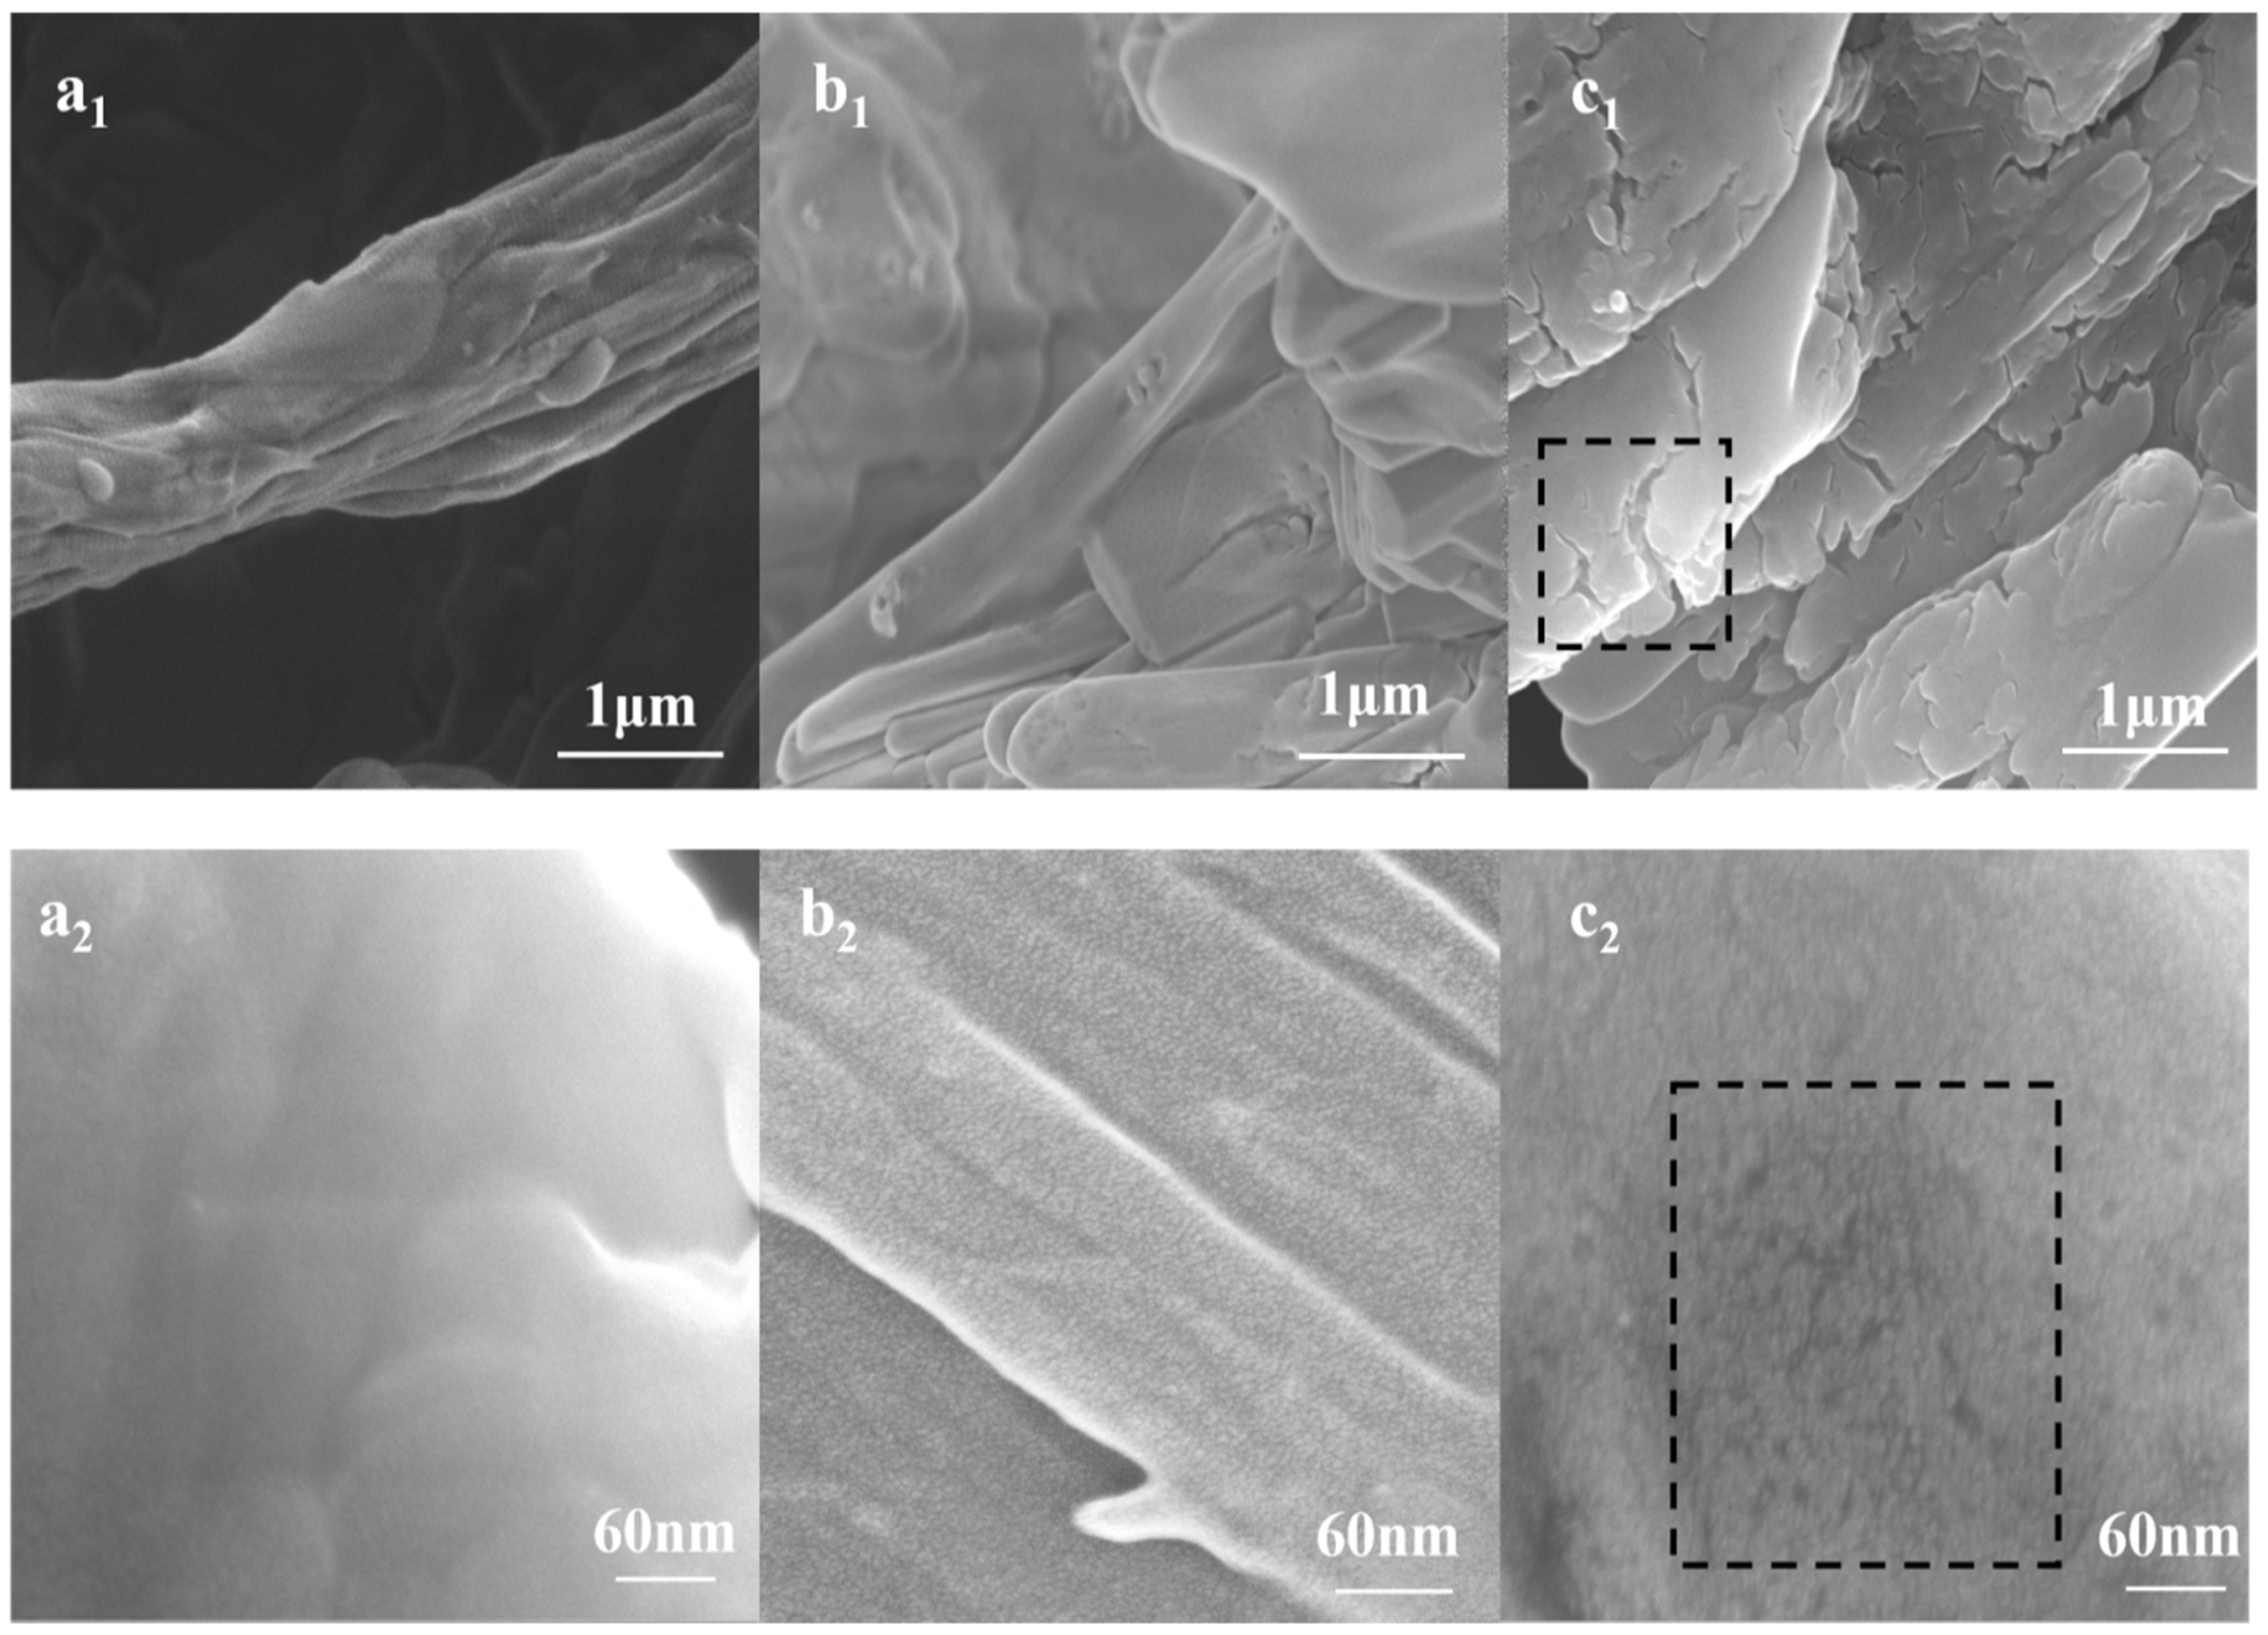
After analyzing the aggregation and dissociation processes, the microstructure changes of type I collagen could be directly observed by SEM. As shown in Figure 6, three representative states in the degradation process were selected to display the micro changes of collagen structure reacted with collagenase. Figure 6a1–2 reveals the normal structure of collagen fibers without cleavage [32]. Figure 6b1 shows the surface of slightly-treated collagen fibers was rougher than untreated collagen fibers. In addition, after observing under high magnification (Figure 6b2), it was seen obviously that collagen fiber was split lightly by cleavage of collagenase I. When referring to Figure 6c1–2, it was apparent that horizontal and vertical cutting appeared in collagen fibers, and these obvious cracks indicated the collagen had been degraded. Figure 6 demonstrates the micro structure changes of collagen fibers with collagenase I. It provides the supplementary information involving the interaction mechanism of type I collagen and collagenase I. Moreover, it could be predicted that these liner cracks expanded into holes with further collagen degradation. Thus it was expected that tyrosine residues were exposed by collagenase cleavage.
3.6. Thermal Stability of the Solution
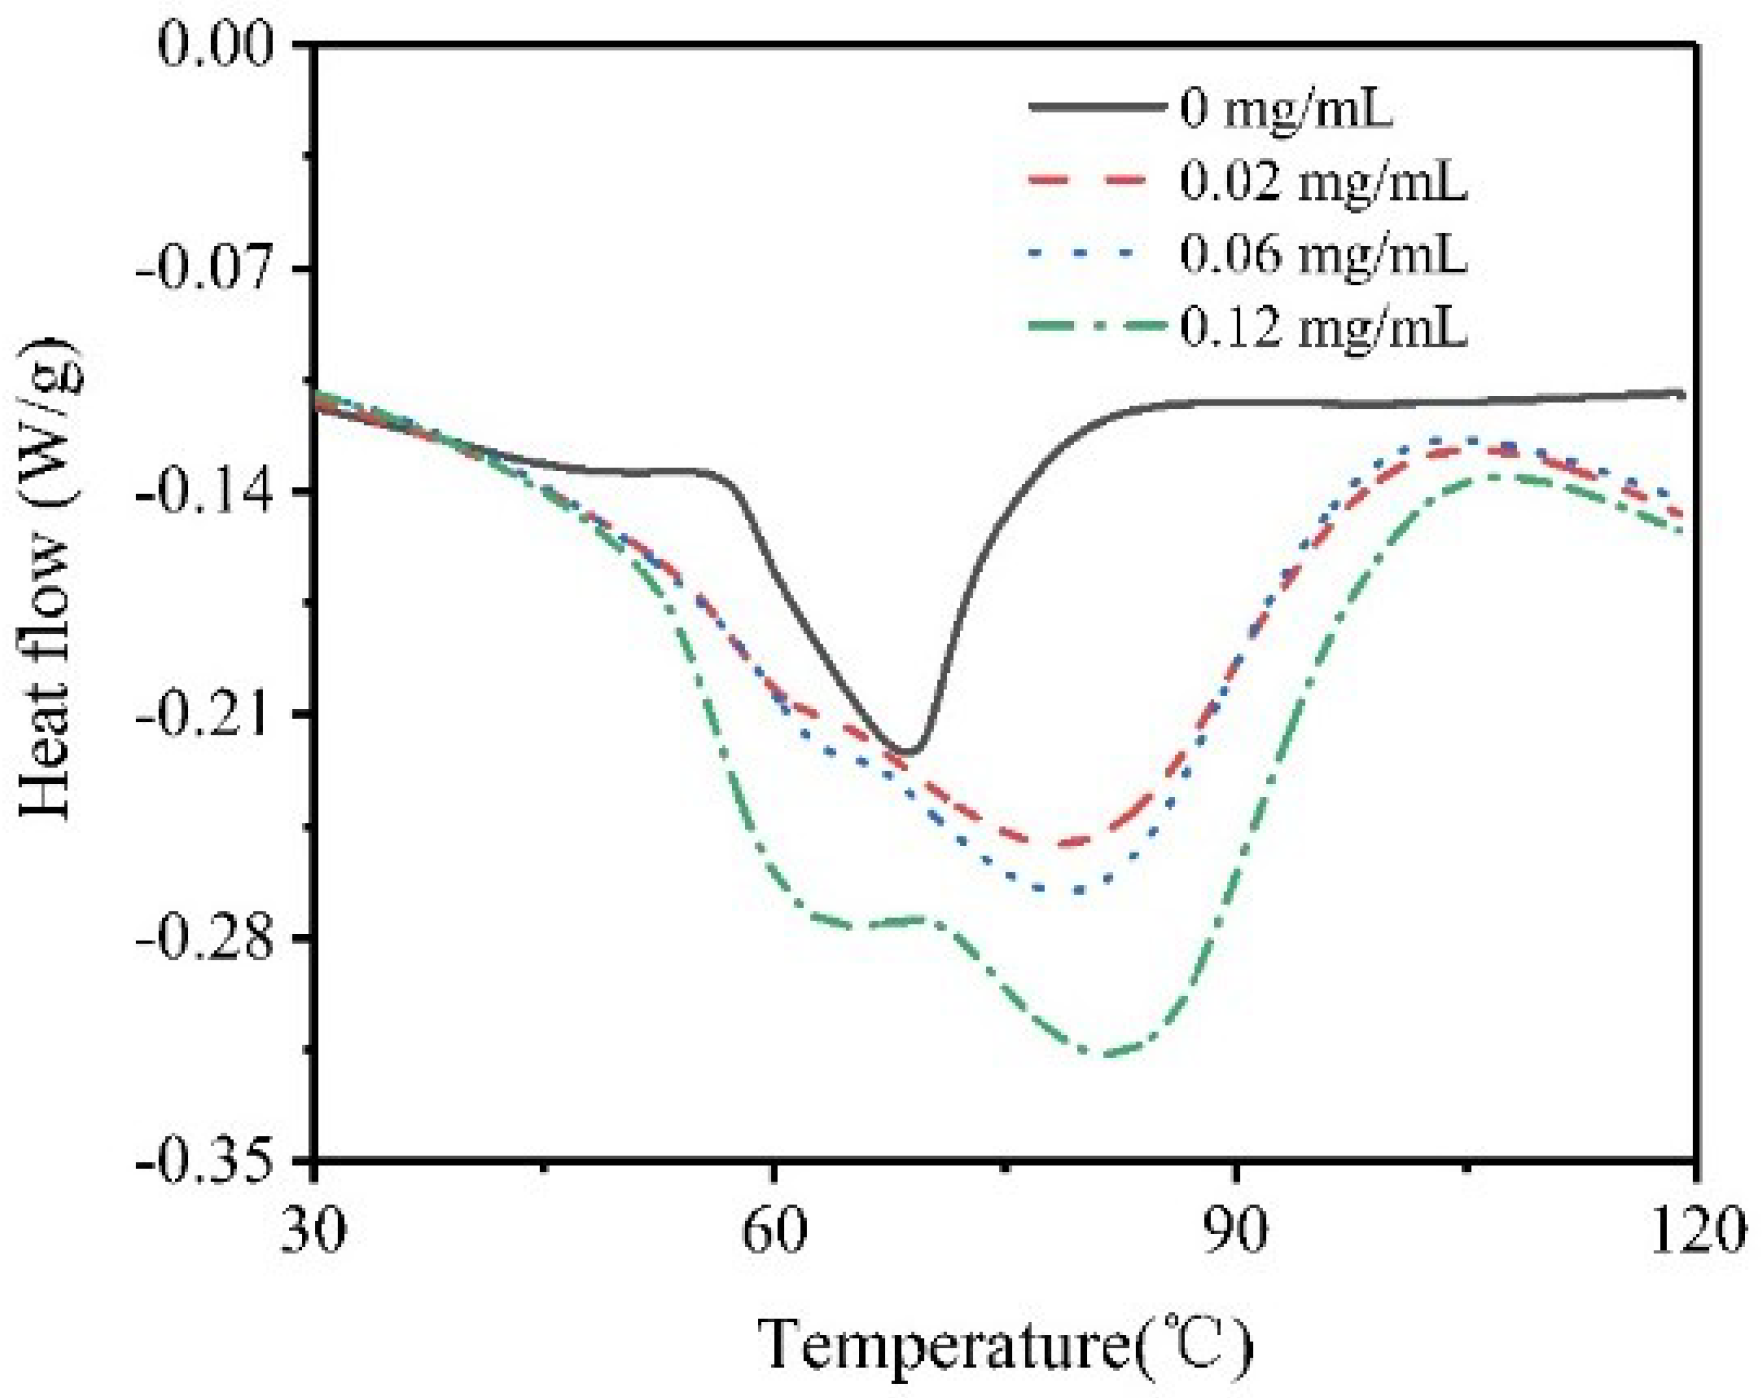
The thermostability of type I collagen with different concentrations of collagenase I were measured by DSC. The endothermic peak related to the transformation of collagen structure, which varied from triple helical to random coil [33], while the peak value was generally considered as the denaturation temperature (Td) [34]. The improvement in Td resulted from changes in type I collagen structure, where the fiber surface was cleaved and some functional groups were exposed. Figure 7 shows that the denaturation temperature of type I collagen increased with increasing concentration of collagenase I, which resulted from aggregation status changes of collagen molecules. The Td of collagen with 0.12 mg/mL collagenase I was highest because the short fragments, cleaved by collagenase [35], were hard to thermally decompose. In other words, the proper degradation degree could improve the exposure of more tyrosine residues and result in better thermal stability.
4. Conclusions
This study reported that the intrinsic fluorescence of collagen type I is influenced by collagenase cleavage. The interaction mechanism between collagen type I and collagenase I was explained. The increasing intrinsic fluorescence of collagen resulted from collagenase cleavage through exposing more tyrosine residues. The analysis of particle sizes confirmed the self-assembly of collagen, which resulted in aggregation of collagen peptide chains. The self-assembly behavior could make tyrosine wrapped in collagen, thereby the intrinsic fluorescence of collagen decreased. The collagenase was capable of exposing the tyrosine residues of collagen and therefore improving intrinsic fluorescence. Besides increasing intrinsic fluorescence, the thermostability of collagen was also slightly improved, which was explained by slight triple helix structure changes of collagen. This research provides a foundation for an in-depth understanding of collagen intrinsic florescence change, and is fundamental to collagen mechanism research, influenced by not only collagenase, but also other collagenolytic proteases in artificial skin, bone repair, collagen casing, animal food and cosmetic products.
Author Contributions
All authors discussed and agreed on the contents of the manuscript. S.C. and Y.L. proposed the idea; Y.S. and S.C. conducted the research tasks; D.Z. and W.L. analyzed experimental data. Y.S. wrote the manuscript with support from Y.L. and S.C.; S.C. and B.L. revised the paper.
Funding
This research was funded by the National Key Research and Development Program of China (No. 2017YFB0308402) and National Natural Science Foundation of China (No. 21808170).
Conflicts of Interest
The authors declare no conflicts of interest.
References
- Chen, H.; Rhoades, E. Fluorescence characterization of denatured proteins. Curr. Opin. Struct. Biol. 2008, 18, 516–524. [Google Scholar] [CrossRef] [PubMed] [Green Version]
- Li, Y.H.; Yue, J.C.; Cai, G.P. Fluorescence characterization of type I collagen from normal and silicotic rats and its quenching dynamics induced by hypocrellin B. Biopolymers 1997, 42, 219–226. [Google Scholar] [CrossRef]
- Su, D.; Wang, C.; Cai, S.; Mu, C.; Li, D.; Lin, W. Influence of palygorskite on the structure and thermal stability of collagen. Appl. Clay Sci. 2012, 62, 41–46. [Google Scholar] [CrossRef]
- Sun, X.-X.; Fan, J.; Hou, Y.-N.; Liang, S.; Zhang, Y.-P.; Xiao, J.-X. Fluorescence characterization of the thermal stability of collagen mimic peptides. Chin. Chem. Lett. 2017, 28, 963–967. [Google Scholar] [CrossRef]
- Yan, M.; Li, B.; Zhao, X. Determination of critical aggregation concentration and aggregation number of acid-soluble collagen from walleye pollock (Theragra chalcogramma) skin using the fluorescence probe pyrene. Food. Chem. 2010, 122, 1333–1337. [Google Scholar] [CrossRef]
- Masters, B.R. Principles of Fluorescence Spectroscopy, Third Edition. J. Biomed. Opt. 2008, 13, 029901. [Google Scholar] [CrossRef]
- Yan, L.I.; Wang, C.; Lan, W.Q. Isolation and purification of collagen from porcine skin and analysis of amino acid composition. Food Sci. Technol. 2007, 10, 060. [Google Scholar]
- Chen, R. Fluorescence Quantum Yields of Tryptophan and Tyrosine. Anal. Lett. 1967, 1, 35–42. [Google Scholar] [CrossRef]
- Adhikari, A.S.; Glassey, E.; Dunn, A.R. Conformational dynamics accompanying the proteolytic degradation of trimeric collagen I. by collagenases. J. Am. Chem. Soc. 2012, 134, 13259–13265. [Google Scholar] [CrossRef] [PubMed]
- Zhao, X.; Gao, J.; Hu, X.; Guo, H.; Wang, F.; Qiao, Y.; Wang, L. Collagen/Polyethylene Oxide Nanofibrous Membranes with Improved Hemostasis and Cytocompatibility for Wound Dressing. Appl. Sci. 2018, 8, 1226. [Google Scholar] [CrossRef]
- Di, L.G.; Sweeney, S.M.; Korkko, J.; Ala-Kokko, L.; San Antonio, J.D. Mapping the ligand-binding sites and disease-associated mutations on the most abundant protein in the human, type I collagen. J. Biol. Chem. 2002, 277, 4223–4231. [Google Scholar]
- Yao, L.; He, M.; Li, D.; Tian, J.; Liu, H.; Xiao, J. Terminal aspartic acids promote the self-assembly of collagen mimic peptides into nanospheres. RSC Adv. 2018, 8, 2404–2409. [Google Scholar] [CrossRef] [Green Version]
- Toyoshima, T.; Matsushita, O.; Minami, J.; Nishi, N.; Okabe, A.; Itano, T. Collagen-binding domain of a Clostridium histolyticum collagenase exhibits a broad substrate spectrum both in vitro and in vivo. Connect. Tissue Res. 2001, 42, 281–290. [Google Scholar] [CrossRef] [PubMed]
- Mu, Y.; Lin, J.; Liu, R. Interaction of sodium benzoate with trypsin by spectroscopic techniques. Spectrochim. Acta A 2011, 83, 130–135. [Google Scholar] [CrossRef] [PubMed]
- Li, Y.; Tang, A.G.; Mu, S. HPLC-FLD determination of serum aromatic amino acids: Application in chronic kidney disease patients. Clin. Chim. Acta 2011, 412, 1032–1035. [Google Scholar] [CrossRef] [PubMed]
- Eva, N.Y.I.; Danilov, N.A.; Averkiev, S.V.; Obrezkova, M.V.; Lunin, V.V.; Sobol’, E.N. Determination of hydroxyproline in tissues and the evaluation of the collagen content of the tissues. J. Anal. Chem. 2007, 62, 51–57. [Google Scholar] [CrossRef]
- Chen, J.P.; Chang, G.Y.; Chen, J.K. Electrospun collagen/chitosan nanofibrous membrane as wound dressing. Colloid Surf. A 2008, 313, 183–188. [Google Scholar] [CrossRef]
- Shanmugasundaram, N.; Ravichandran, P.; Reddy, P.N.; Ramamurty, N.; Pal, S.; Rao, K.P. Collagen-chitosan polymeric scaffolds for the in vitro culture of human epidermoid carcinoma cells. Biomaterials 2001, 22, 1943–1951. [Google Scholar] [CrossRef]
- Vanscyoc, W.S.; Sorensen, B.R.; Rusinova, E.; Laws, W.R.; Ross, J.B.A.; Shea, M.A. Calcium binding to calmodulin mutants monitored by domain-specific intrinsic phenylalanine and tyrosine fluorescence. Biophys. J. 2002, 83, 2767–2780. [Google Scholar] [CrossRef]
- Persikov, A.V.; Ramshaw, J.A.M.; Kirkpatrick, A.; Brodsky, B. Amino acid propensities for the collagen triple-helix. Biochemistry 2000, 39, 14960–14967. [Google Scholar] [CrossRef] [PubMed]
- Zhang, M.; Yang, J.; Yang, Q.; Huang, L.; Wu, H.; Chen, L.; Ding, C. Fluorescence studies on the aggregation behaviors of collagen modified with NHS-activated poly(γ-glutamic acid). Int. J. Biol. Macromol. 2018, 112, 1156–1163. [Google Scholar] [CrossRef] [PubMed]
- Menter, J.M. Temperature dependence of collagen fluorescence. Photochem. Photobiol. 2006, 5, 403–410. [Google Scholar] [CrossRef] [PubMed]
- Wu, K.; Liu, W.; Li, G. The aggregation behavior of native collagen in dilute solution studied by intrinsic fluorescence and external probing. Spectrochim. Acta A 2013, 102, 186–193. [Google Scholar] [CrossRef] [PubMed]
- Bauer, R.; Wilson, J.J.; Dan, D.; Matsushita, O.; Sakon, J. Structural Comparison of ColH and ColG Collagen-Binding Domains from Clostridium histolyticum. J. Bacteriol. 2013, 195, 318–327. [Google Scholar] [CrossRef] [PubMed]
- Eckhard, U.; Huesgen, P.F.; Brandstetter, H.; Overall, C.M. Proteomic protease specificity profiling of clostridial collagenases reveals their intrinsic nature as dedicated degraders of collagen. J. Proteom. 2014, 100, 102–114. [Google Scholar] [CrossRef] [PubMed]
- Madden, A.S.; Hochella, M.F., Jr. A test of geochemical reactivity as a function of mineral size: Manganese oxidation promoted by hematite nanoparticles. Geochim. Cosmochim. Acta 2005, 69, 389–398. [Google Scholar] [CrossRef]
- Paige, M.F.; Goh, M.C. Ultrastructure and assembly of segmental long spacing collagen studied by atomic force microscopy. Micron 2001, 32, 355–361. [Google Scholar] [CrossRef]
- O’Leary, L.E.R.; Fallas, J.A.; Bakota, E.L.; Kang, M.K.; Hartgerink, J.D. Multi-hierarchical self-assembly of a collagen mimetic peptide from triple helix to nanofibre and hydrogel. Nat. Chem. 2011, 3, 821. [Google Scholar] [CrossRef] [PubMed]
- Ottani, V.; Martini, D.; Franchi, M.; Ruggeri, A.; Raspanti, M. Hierarchical structures in fibrillar collagens. Micron 2002, 33, 587–596. [Google Scholar] [CrossRef]
- Ottani, V.; Raspanti, M.; Ruggeri, A. Collagen structure and functional implications. Micron 2001, 32, 251–260. [Google Scholar] [CrossRef]
- Mo, X.M.; Li, Y.; Tang, A.G.; Ren, Y.P. Simultaneous determination of phenylalanine and tyrosine in peripheral capillary blood by HPLC with ultraviolet detection. Clin. Biochem. 2013, 46, 1074–1078. [Google Scholar] [CrossRef] [PubMed]
- Yamazaki, C.M.; Asada, S.; Kitagawa, K.; Koide, T. Artificial collagen gels via self-assembly of de novo designed peptides. Biopolymers 2010, 90, 816–823. [Google Scholar] [CrossRef] [PubMed]
- Pietrucha, K. Changes in denaturation and rheological properties of collagen-hyaluronic acid scaffolds as a result of temperature dependencies. Int. J. Biol. Macromol. 2005, 36, 299–304. [Google Scholar] [CrossRef] [PubMed]
- He, L.; Mu, C.; Shi, J.; Zhang, Q.; Shi, B.; Lin, W. Modification of collagen with a natural cross-linker, procyanidin. Int. J. Biol. Macromol. 2011, 48, 354–359. [Google Scholar] [CrossRef] [PubMed]
- Cucos, A.; Budrugeac, P. Simultaneous TG/DTG–DSC–FTIR characterization of collagen in inert and oxidative atmospheres. J. Therm. Anal. Calorim. 2014, 115, 2079–2087. [Google Scholar] [CrossRef]
Figure 1.
The fluorescence and synchronous fluorescence spectroscopy of type I collagen. (a) Changes of tyrosine residues influenced by time with fluorescence spectroscopy. (b) Changes of tyrosine residues influenced by time with synchronous fluorescence spectroscopy. (c) Changes of tyrosine residues influenced by collagenase I concentration with fluorescence spectroscopy. (d) Changes of tyrosine residues influenced by collagenase I concentration with synchronous fluorescence spectroscopy.

Figure 2.
The interaction mechanism of type I collagen and collagenase I.
Figure 3.
(a) The changes in particle size of type I collagen from 6 h to 48 h. (b) SEM analysis at 48 h (×1000).
Figure 3.
(a) The changes in particle size of type I collagen from 6 h to 48 h. (b) SEM analysis at 48 h (×1000).
Figure 4.
High-Performance Liquid Chromatography (HPLC) chromatogram of dialysate of collagen before and after reaction.
Figure 4.
High-Performance Liquid Chromatography (HPLC) chromatogram of dialysate of collagen before and after reaction.
Figure 5.
The changes in particle sizes and hydroxyproline in the solution. (a) Dissociation influenced by different reaction time (0, 5, 10, 20, 30, 40 min). (b) Dissociation influenced by different concentration of collagenase I (0, 0.02, 0.04, 0.08, 0.12 mg/mL).
Figure 5.
The changes in particle sizes and hydroxyproline in the solution. (a) Dissociation influenced by different reaction time (0, 5, 10, 20, 30, 40 min). (b) Dissociation influenced by different concentration of collagenase I (0, 0.02, 0.04, 0.08, 0.12 mg/mL).
Figure 6.
SEM analysis. (a) Type I collagen with 0 mg/mL collagenase I (a1 ×2000, a2 ×300,000). (b) Type I collagen with 0.02 mg/mL collagenase I (b1 ×2000, b2 ×300,000) (c) Type I collagen with 0.12 mg/mL collagenase I (c1 ×2,000, c2 ×300,000).
Figure 6.
SEM analysis. (a) Type I collagen with 0 mg/mL collagenase I (a1 ×2000, a2 ×300,000). (b) Type I collagen with 0.02 mg/mL collagenase I (b1 ×2000, b2 ×300,000) (c) Type I collagen with 0.12 mg/mL collagenase I (c1 ×2,000, c2 ×300,000).
Figure 7.
Differential Scanning Calorimetry (DSC) analysis of type I collagen with different concentrations of collagenase I (0, 0.02, 0.06, 0.12 mg/mL).
Figure 7.
Differential Scanning Calorimetry (DSC) analysis of type I collagen with different concentrations of collagenase I (0, 0.02, 0.06, 0.12 mg/mL).
© 2018 by the authors. Licensee MDPI, Basel, Switzerland. This article is an open access article distributed under the terms and conditions of the Creative Commons Attribution (CC BY) license (http://creativecommons.org/licenses/by/4.0/).
Share and Cite
MDPI and ACS Style
Shen, Y.; Zhu, D.; Lu, W.; Liu, B.; Li, Y.; Cao, S. The Characteristics of Intrinsic Fluorescence of Type I Collagen Influenced by Collagenase I. Appl. Sci. 2018, 8, 1947. https://doi.org/10.3390/app8101947
AMA Style
Shen Y, Zhu D, Lu W, Liu B, Li Y, Cao S. The Characteristics of Intrinsic Fluorescence of Type I Collagen Influenced by Collagenase I. Applied Sciences. 2018; 8(10):1947. https://doi.org/10.3390/app8101947
Chicago/Turabian StyleShen, Yiming, Deyi Zhu, Wenhui Lu, Bing Liu, Yanchun Li, and Shan Cao. 2018. "The Characteristics of Intrinsic Fluorescence of Type I Collagen Influenced by Collagenase I" Applied Sciences 8, no. 10: 1947. https://doi.org/10.3390/app8101947
Note that from the first issue of 2016, this journal uses article numbers instead of page numbers. See further details here.