Review of Recent Advances in QEPAS-Based Trace Gas Sensing


National Key Laboratory of Science and Technology on Tunable Laser, Harbin Institute of Technology, Harbin 150001, China
Appl. Sci. 2018, 8(10), 1822; https://doi.org/10.3390/app8101822
Submission received: 5 September 2018
/
Revised: 27 September 2018
/
Accepted: 28 September 2018
/
Published: 4 October 2018
(This article belongs to the Special Issue State-of-the-art Laser Gas Sensing Technologies)
Abstract
:Quartz-enhanced photoacoustic spectroscopy (QEPAS) is an improvement of the conventional microphone-based photoacoustic spectroscopy. In the QEPAS technique, a commercially available millimeter-sized piezoelectric element quartz tuning fork (QTF) is used as an acoustic wave transducer. With the merits of high sensitivity and selectivity, low cost, compactness, and a large dynamic range, QEPAS sensors have been applied widely in gas detection. In this review, recent developments in state-of-the-art QEPAS-based trace gas sensing technique over the past five years are summarized and discussed. The prospect of QEPAS-based gas sensing is also presented.
1. Introduction
Photoacoustic spectroscopy (PAS) is an indirect absorption spectroscopy. It is based on the photoacoustic effect, which was first discovered by Alexander Graham Bell in 1880 [1]. The principle of PAS is shown in Figure 1. When the laser output is absorbed by a gas sample, the absorbed laser energy is converted to heat energy by the non-radiative relaxation processes of gas molecules, and will subsequently result in an increase in the local temperature and pressure in the sample. If the laser is modulated, the absorption of laser energy in a gas sample leads to the generation of an acoustic wave. The intensity of the produced acoustic wave is related to the sample concentration. The signal amplitude S of PAS is expressed as in Equations (1) and (2) [2]:
where α is the absorption coefficient, Q is the quality factor of spectrophone, P is the optical power of excitation source, f is the resonance frequency, σ is the absorption cross section, and N is the gas molecular concentration. From Equation (1), it can be seen that the signal amplitude of PAS sensor is inversely proportional to the resonance frequency of the photo-acoustic cell. However, if the resonance frequency is too low, it makes the PAS sensor more sensitive to 1/f noise, environmental noise, and sample gas flow noise. Finally, it will result in a low signal-to-noise ratio (SNR) for the PAS sensor [3].
Unlike an optical detector used in direct absorption spectroscopy, in traditional PAS, a sensitive microphone is employed to detect the acoustic wave. PAS has the advantages of low cost and signal enhancement on increasing the laser excitation power. However, for the microphone-based PAS, the low value of Q factor (<100) and the large size of the photoacoustic cell limit its performance and actual applications [4,5,6,7,8]. Quartz-enhanced photoacoustic spectroscopy (QEPAS) is a modification of the conventional microphone-based PAS, which was first reported in 2002 [9].
In the QEPAS technique, a quartz tuning fork (QTF) is used as an acoustic wave transducer. The QTF is a commercially available millimeter-sized piezoelectric element, which is usually used in watches, clocks, and electronic circuits to provide clock rate [10,11,12]. The high Q-factor (~100,000 in a vacuum and ~10,000 in a standard atmosphere pressure) and narrow resonance frequency band (<1 Hz) of QTF improve the QEPAS selectivity and immunity to environmental acoustic noise [13,14,15,16,17,18,19]. Due to the merits of high selectivity and sensitivity, low cost, compactness, and a large dynamic range, QEPAS sensors have been widely applied in gas detection for atmospheric monitoring [20,21,22,23,24,25,26,27], chemical analysis [28,29,30,31,32], biomedical diagnostics [33,34,35,36], and trace gas sensing [37,38,39,40,41,42,43,44]. Different QEPAS sensor architectures were developed to meet the requirements of a large number of applications.
2. Standard QEPAS-Based Gas Sensor System
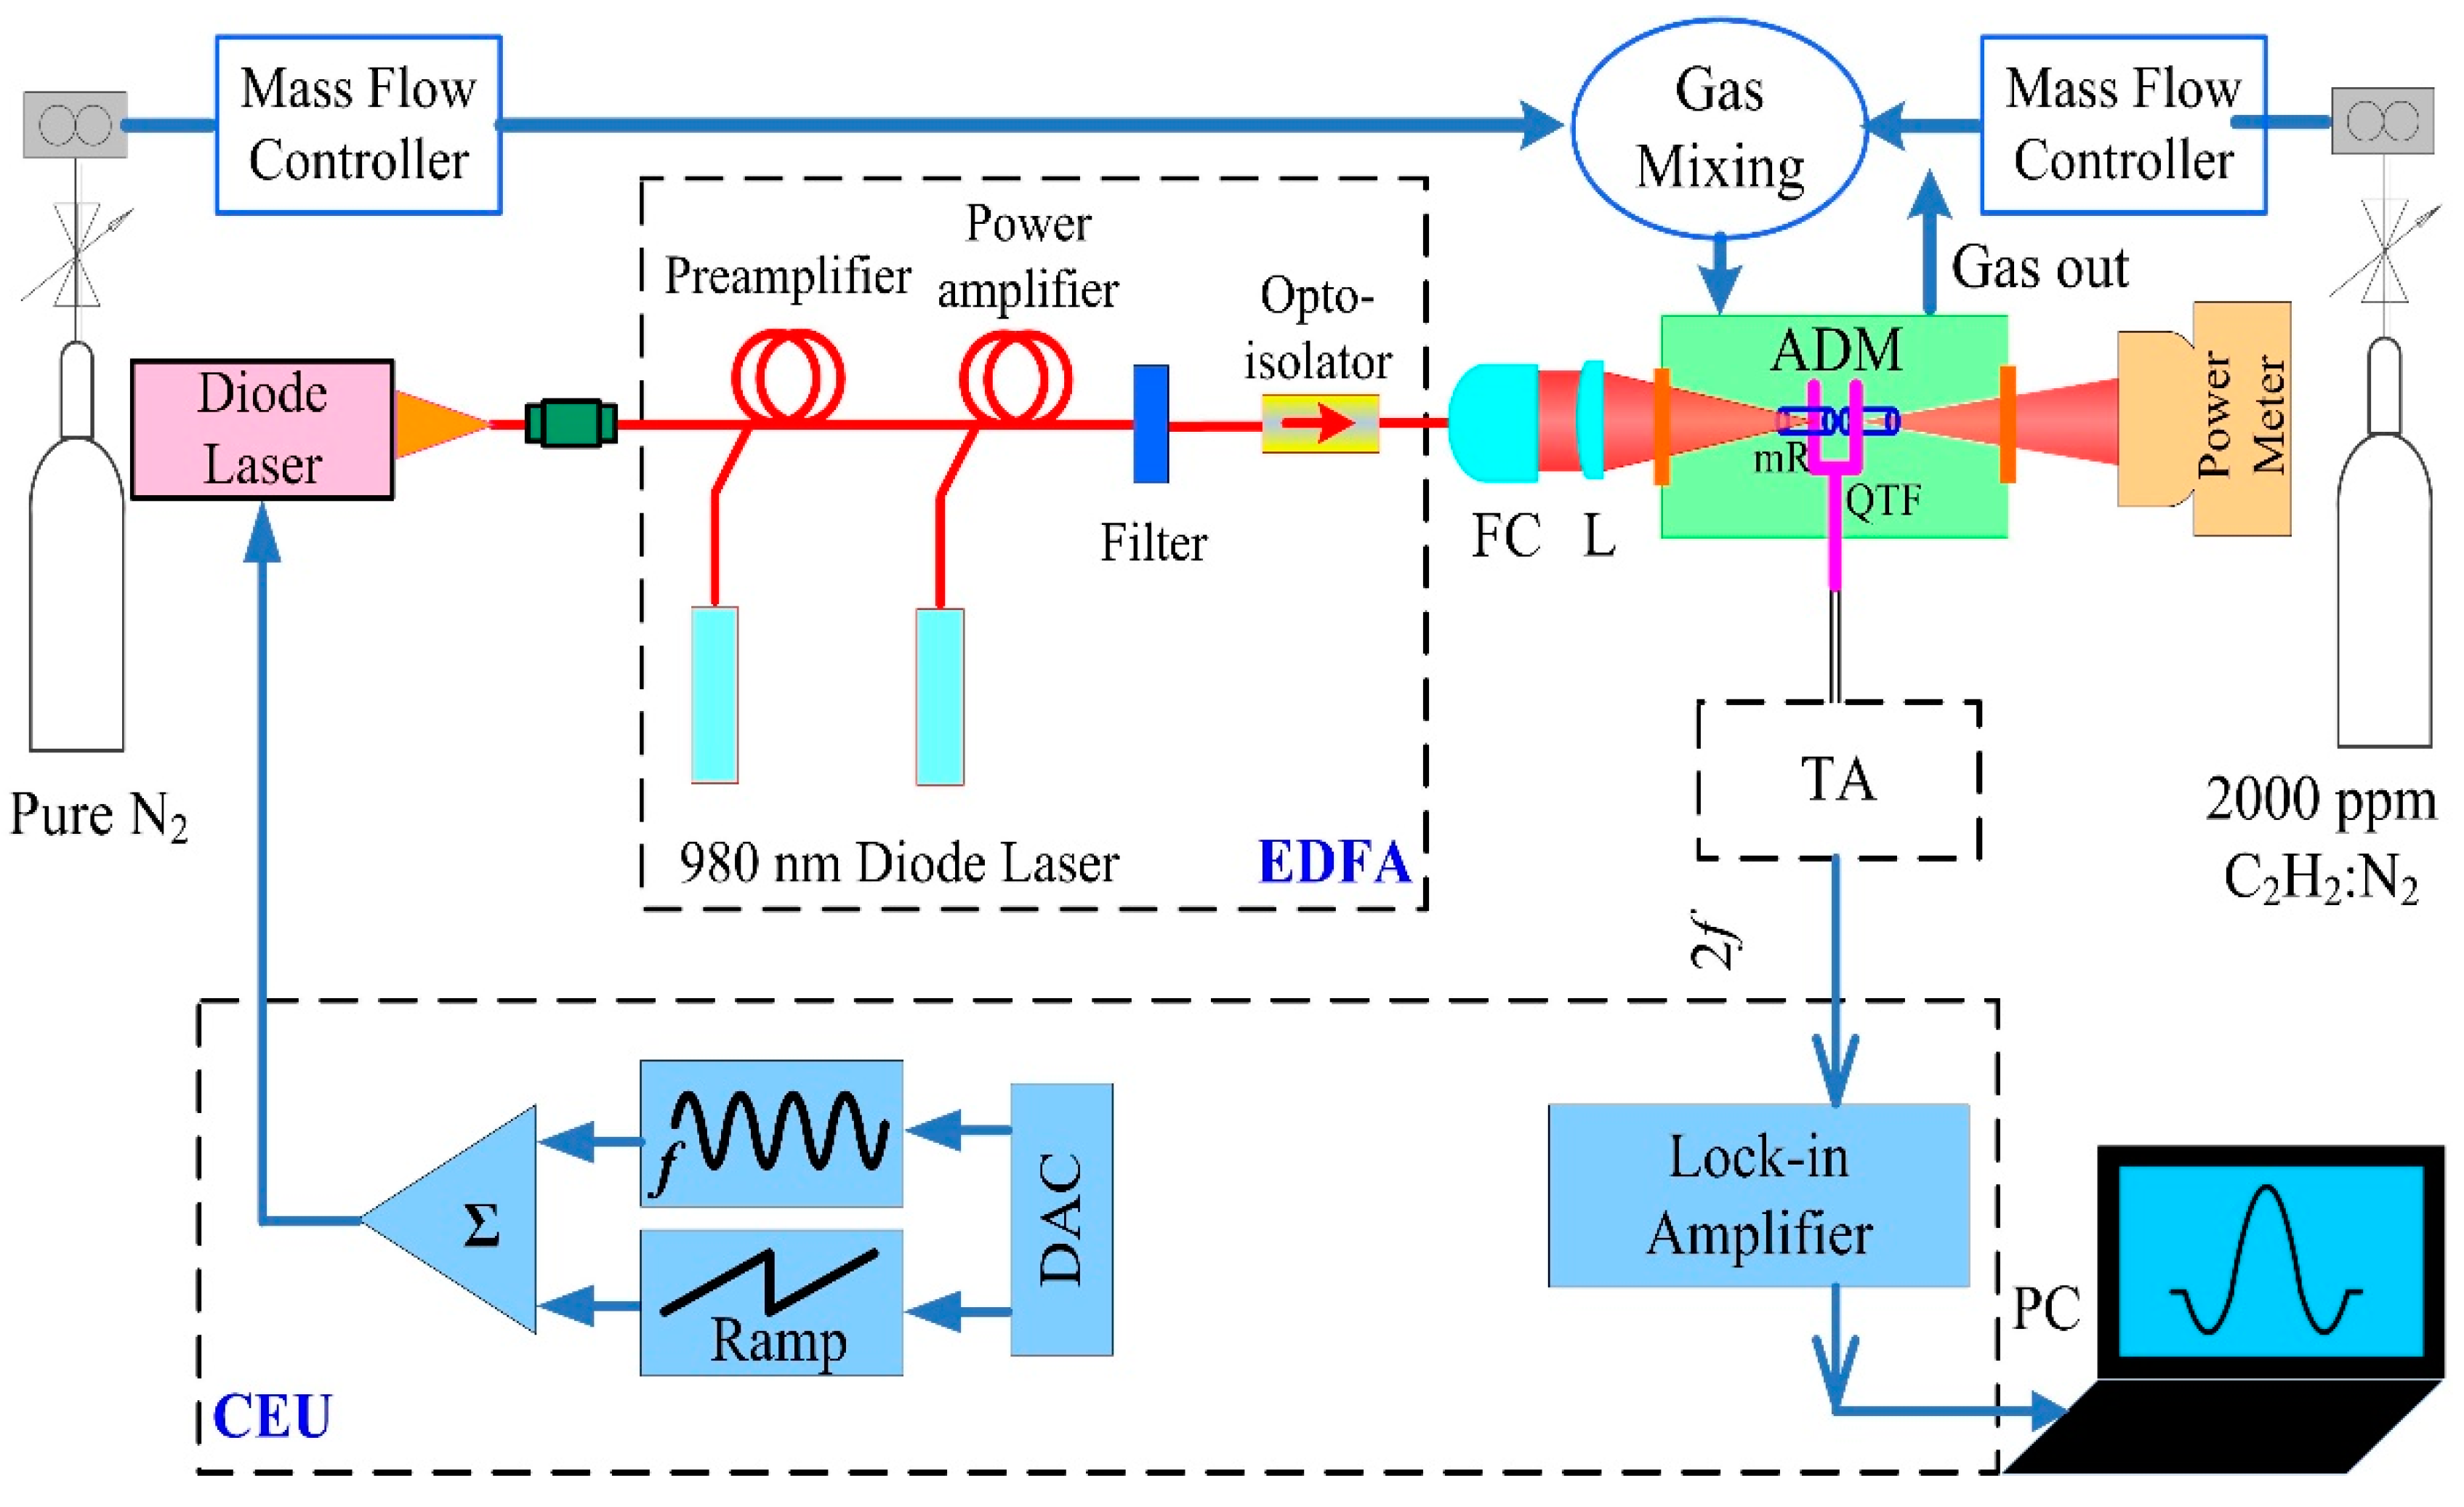
A standard QEPAS-based gas sensor system is shown in Figure 2. A diode laser or quantum cascade laser (QCL) is often used as a gas sample excitation source. For a diode laser, the emission wavelength is less than 3 μm. Usually it is a fiber-coupled output. The gas analytes flow into an acoustic detection module (ADM) with a slow flow rate to avoid flow noise. Usually the rate is smaller than 200 mL/min. In order to increase the Q factor of QTF and narrow the gas absorption line width, a pressure controller is adopted to reduce the gas pressure. The laser wavelength is modulated through employing a sinusoidal dither at frequency f (f = f0/2, where f0 is the resonance frequency of QTF). The QTF in QEPAS sensor converts the acoustic wave into an electrical signal due to the piezoelectric effect, and the resonant property of QTF enhances the signal amplitude. Commercially available QTFs with a f0 of ~32.76 kHz are typically employed. An obvious enhancement of the QTF current signal can be obtained after adding two metallic tubes (mRs) to the QTF sensor architecture. The mRs act as micro-resonators [45]. To obtain a strong acoustic wave coupling, the length L of mR should be optimized. Typically, the optimum L is in the range of λs/4 < L < λs/2, where λs is the acoustic wave wavelength [46]. The weak current signal of QTF (in the scale of nanoampere) is amplified and converted into voltage by a transimpedance amplifier (TA) with a resistance of ~MΩ. The lock-in amplifier is used to demodulate the second harmonic component (2f) generated by the QTF. To improve the slow vibrational‒translational (V‒T) relaxation processes of the target analyte, H2O vapor is usually added to the target trace gas. The presence of H2O vapor in the analyzed gas increases the V‒T relaxation process, which results in a higher detected amplitude of the QEPAS signal. Furthermore, the excitation laser wavelengths and absorption lines of the target analyte should avoid overlap with the metastable vibrational transitions of atmospheric nitrogen (N2) and oxygen (O2) to ensure efficient V‒T relaxation of the target molecule, thus contributing to the QEPAS signal.
3. QEPAS Sensor with High-Power Excitation Source
When a laser source with a higher optical power is used in the QEPAS sensor, more molecules are excited, which results in a stronger acoustic wave. Therefore, different from tunable diode laser absorption spectroscopy (TDLAS) and other laser absorption spectroscopy, a distinct merit of the QEPAS sensor is that its performance can be improved when the excitation laser power is increased. As shown in Equation (1), QEPAS detection sensitivity is proportional to the excitation laser power P.
3.1. QEPAS Sensor Based on an EDFA-Amplified Diode Laser
Single-mode diode lasers with a butterfly package or transistor outline (TO) package are usually used in QEPAS sensor system due to their low cost and compactness [47,48,49]. However, the output power of the diode laser is low, typically in the range of several milliwatts (<50 mW), which significantly limits the QEPAS sensor sensitivity. An optical fiber amplifier is usually used for optical signal amplification. With the advantage of high-power output (which easily reaches watt level), it is used extensively in optical communications. In a commercially available optical fiber amplifier, an optical fiber with a single-mode structure (and doped with rare-earth ions such as erbium and ytterbium) is used as the active medium. The fiber is pumped by diode lasers. The optical fiber amplifier usually used is an erbium-doped fiber amplifier (EDFA). EDFA has many obvious advantages, such as fiber compatibility, low noise, high gain, and polarization independence [50,51]. When an appropriate seed diode laser is injected, an EDFA can be used to obtain an amplification gain of more than 30 decibel (dB). Three operating wavelength bands (L band: 1565–1610 nm, C band: 1520–1570 nm, and S band: 1450–1550 nm) of EDFA are commercially available.
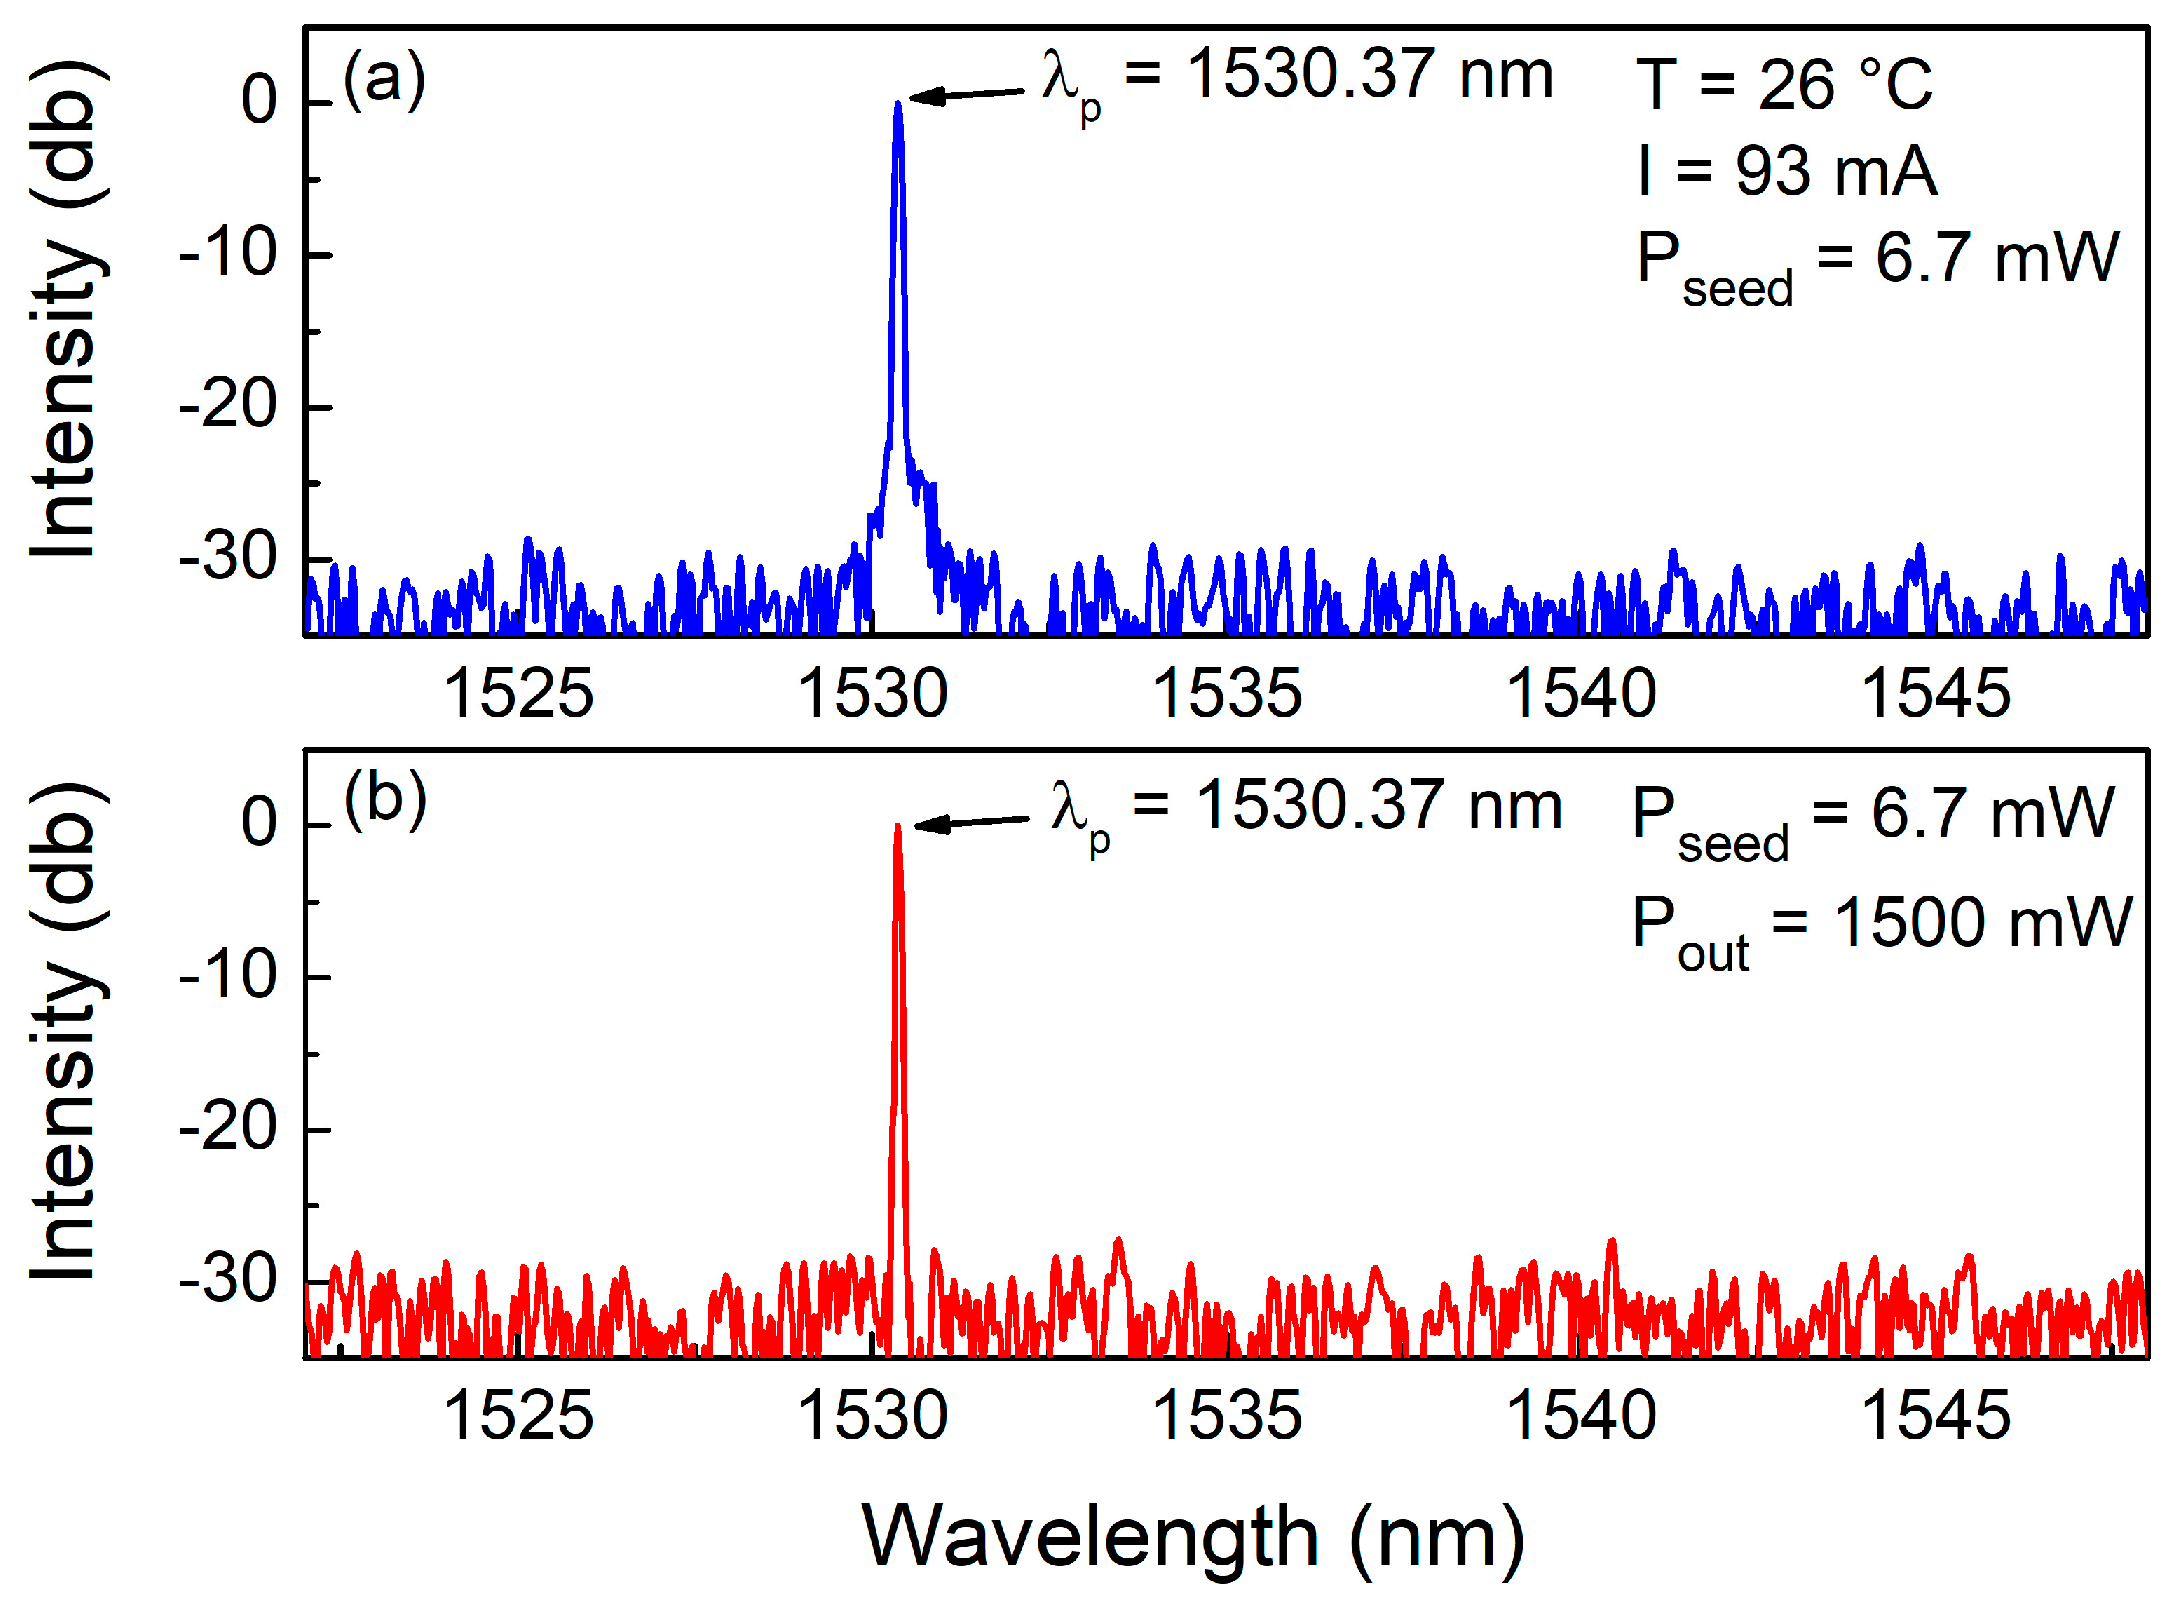
Recently, a QEPAS sensor system based on an EDFA-amplified diode laser was successfully used in acetylene (C2H2), hydrogen sulfide (H2S), and ammonia (NH3) detection [52,53,54]. In [52], a near-infrared, continuous-wave diode laser with emitting power of 6.7 mW served as the seed laser. The output of this laser was sent to an EDFA for power amplification. The maximum output power of the EDFA was 1500 mW. The emission spectra for the seed laser and the EDFA-amplified diode laser are shown in Figure 3. The amplified diode laser with high output power of 1500 mW had the same signal-to-noise ratio as the seed laser (~30 dB). Due to the fact that with high power intensity it is easy to attain high gain, compared to the seed laser, the line width of the amplified diode laser was compressed (see Figure 3a,b). Narrower line width represents better spectral resolution and is beneficial for improving the sensor’s selectivity.
The schematic of an EDFA-based QEPAS sensor is shown in Figure 4. After being amplified by an EDFA, the laser beam of a diode laser was injected into an acoustic detection module (ADM). For C2H2, H2S, and NH3 sensing, the detection limits of EDFA-QEPAS sensors were 33.2 ppb (parts per billion by volume) [52], 142 ppb [53], and 418.4 ppb [54], respectively. No signal saturation was observed in these investigations, which means that an EDFA with higher output power can be adopted to further improve the QEPAS sensor performance.
3.2. Intra-Cavity QEPAS Sensor
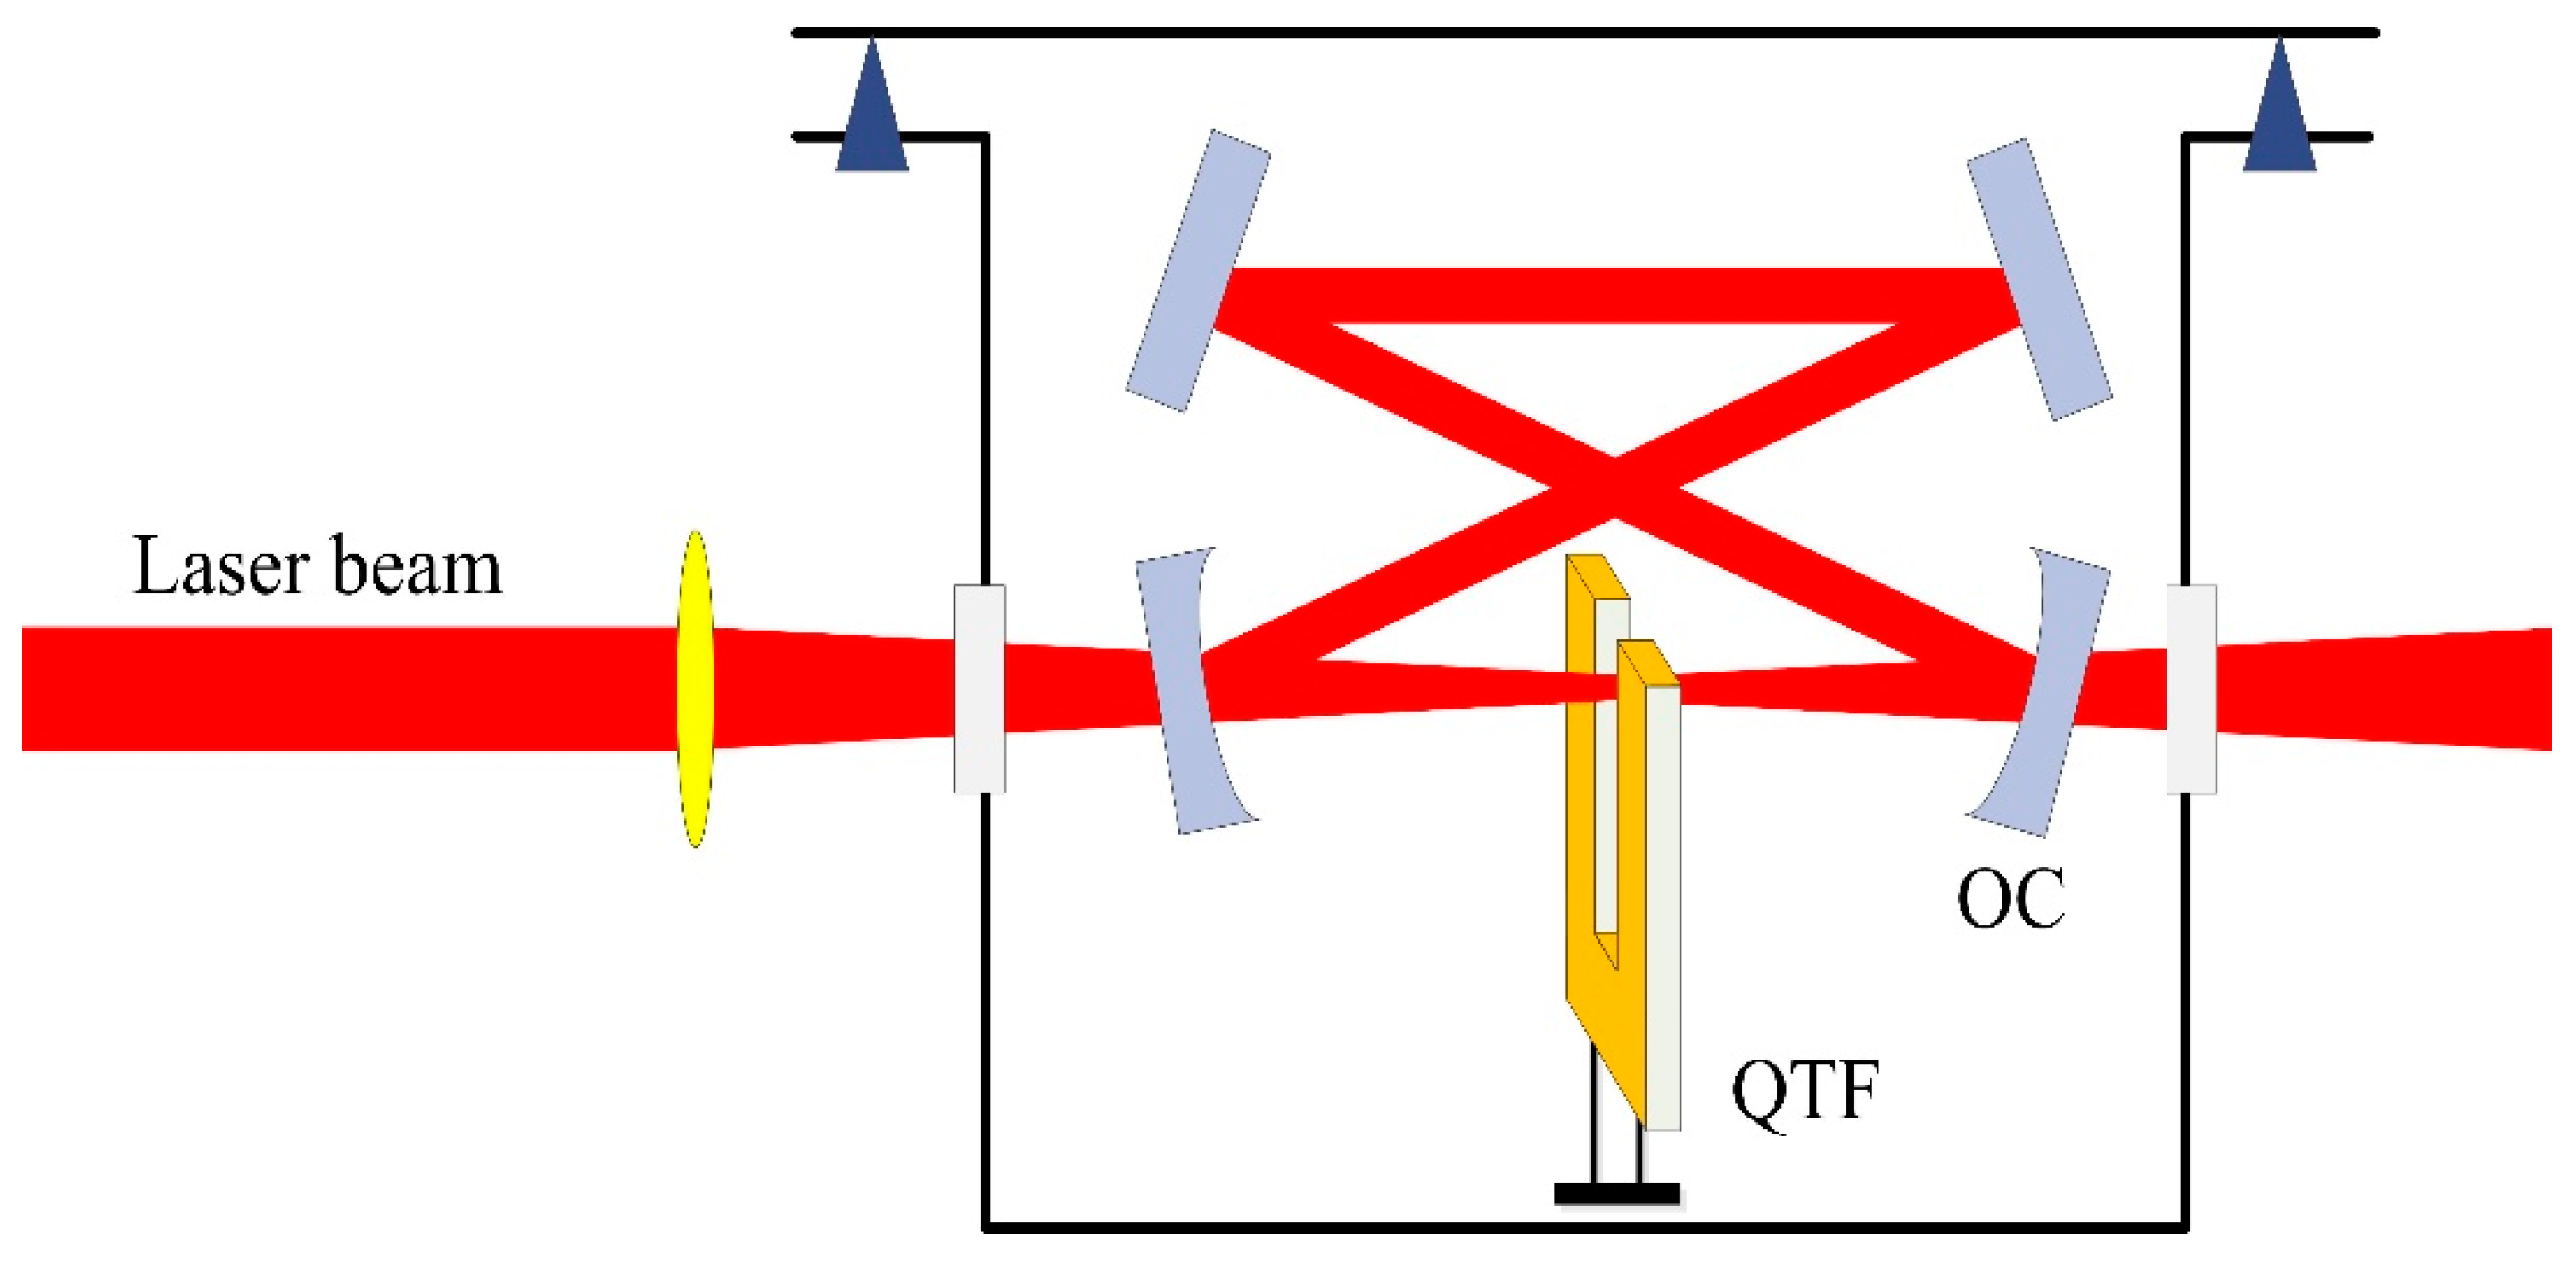
An intra-cavity QEPAS (I-QEPAS) sensor was first reported by Vincenzo Spagnolo [55] and was further developed for sensitive carbon dioxide (CO2) and nitric oxide (NO) detection [56,57,58]. Due to the output coupling loss, the laser power intensity in the intra-cavity is much higher than outside. In [55], a bow-tie type optical resonator with a high finesse (>1500) was developed, which is shown in Figure 5. A distributed feedback quantum cascade laser (QCL) emitting at 4.33 μm was used as the excitation source for carbon dioxide (CO2) detection. Compare to the incident laser power, the intra-cavity optical power was boosted by a factor of ~250. Finally, a ppt (parts per trillion) level detection limit and a normalized noise equivalent absorption (NNEA) of 3.2 × 10⁻¹⁰ cm−1 W/√Hz were achieved.
An I-QEPAS sensor based on fiber-ring laser was reported by Ren [59]. The schematic of the experimental setup is shown in Figure 6. An erbium-doped fiber laser with a ring cavity structure was adopted. A fiber coupler #1 with a ratio of 1:9 was used to ensure that the laser power intensity within the cavity was much higher than outside. Hence, it would make maximum use of the laser power for the I-QEPAS. A fiber Bragg grating (FBG) was used to modulate the laser wavelength. C2H2 detection at the wavelength of 1531.6 nm was performed to evaluate the fiber-ring laser based I-QEPAS sensor performance. A minimum detection limit of C2H2 of 29 ppb at 300 s integration time was achieved when the optimized laser modulation depth and gas pressure were selected. The linear dynamic range of the fiber-ring laser-based I-QEPAS sensor was on the order of 105.
4. QEPAS Sensor Based on Custom QTF
A commercially available, low-cost QTF (<$1) with a resonance frequency f0 of ~32.76 kHz is usually used in the QEPAS sensor system [60,61,62]. Typically, the dimension of the two prongs of the QTF is 3.6 mm in length, 0.6 mm in width, and 0.36 mm in thickness, and the gap between the two prongs is 300 μm [63]. As shown in Equation (1), the signal amplitude of the QEPAS sensor is inversely proportional to the QTF resonance frequency. A QTF with a smaller f0 will result in a longer integration time, which is an advantage for increasing the QEPAS sensor signal level [64,65,66].
4.1. QEPAS Sensor Employing a Custom QTF with a Large Prong Gap
When excitation sources with bad beam quality such as light-emitting diodes (LEDs), vertical cavity surface emitting lasers (VCSELs), and terahertz (Thz) QCLs are used in QEPAS sensors, the large beam diameter and divergence angle make the light beam unable to pass through the micro-resonators and the 300 μm gap between the two prongs of usually used standard QTF totally, resulting in obvious optical noise. Custom QTFs with a large prong gap can solve this issue [67,68,69]. The first custom-made QTF employed in a QEPAS sensor combining a 3.93 THz QCL was reported by Spagnolo [70]. The gap between the two QTF prongs was 1 mm. The fundamental resonance frequency and Q factor at atmospheric pressure of this custom QTF were 4246 Hz and 9930, respectively. The comparison of parameters of geometries for a standard QTF and the custom QTF is shown in Table 1. Methanol detection was performed to verify the performance of this THz-QEPAS sensor with custom QTF. The obtained detection limit was 7 ppm at 4 s integration time and the corresponding NNEA was 2 × 10⁻¹⁰ cm−1W/√Hz.
4.2. QEPAS Sensor Employing Overtone Flexural Mode of Custom QTF
If the fundamental resonance frequency of custom QTF is small (a few kHz), the resonance frequency of the first overtone flexural mode should not be too high. Therefore, the first overtone flexural mode of QTF can be used in a QEPAS sensor [71,72,73,74]. The schematic of the fundamental flexural mode and the first overtone flexural mode of QTF is shown in Figure 7. In [71], a custom QTF with fundamental mode resonance ~2.87 kHz was adopted and the first overtone at ~17.7 kHz was utilized. The measured Q factor for the first overtone resonance was 31,373.81, which is ~2.6 times higher than when it operated in fundamental flexural resonance mode (12,098.97). A high Q factor is beneficial to improve the QEPAS signal level. To evaluate the sensor performance, a near infrared (IR) diode laser emitting at 1.37 μm and water vapor (H2O) as the target gas were selected. The comparison of the first overtone mode and the fundamental mode was carried out at the same conditions, in terms of a 1.7% water concentration, a pressure of 75 Torr, an optimized laser wavelength modulation depth, and laser beam focusing point. The normalized peak value of measured second harmonics for the first overtone mode is ~5.3 times higher than that achieved using the fundamental mode.
4.3. QEPAS Sensor Employing a Custom Small-Gap QTF
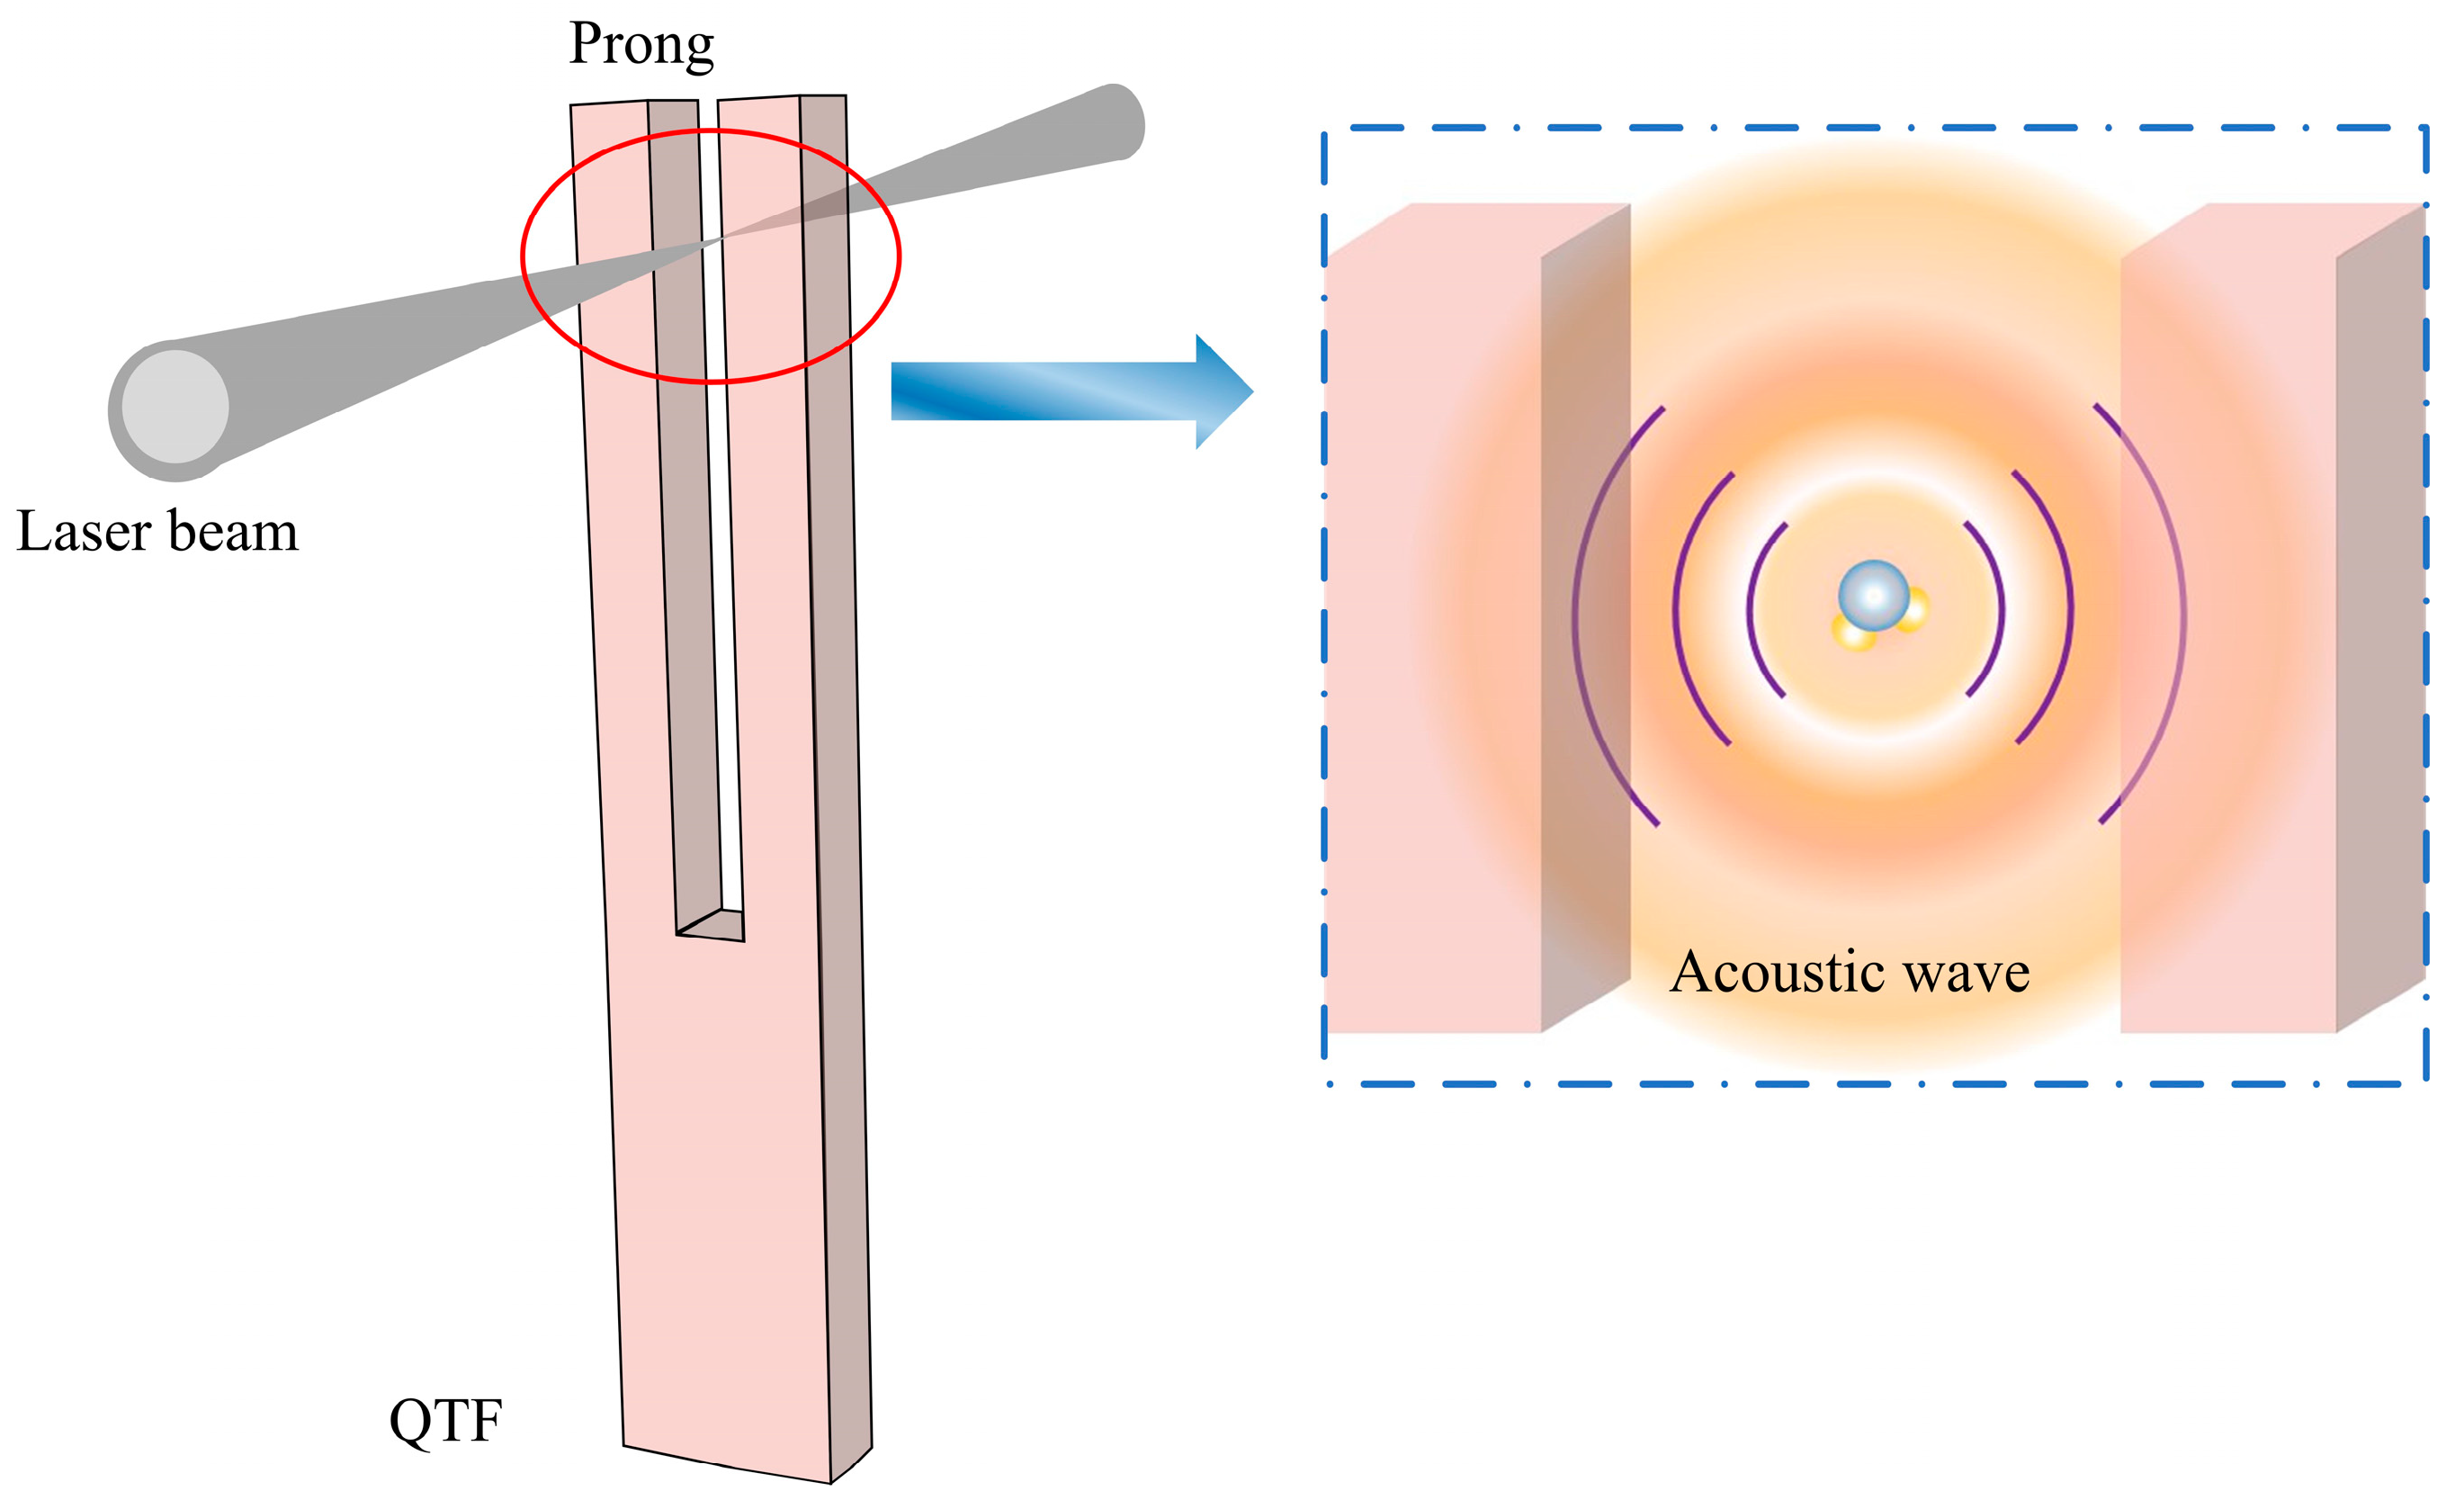
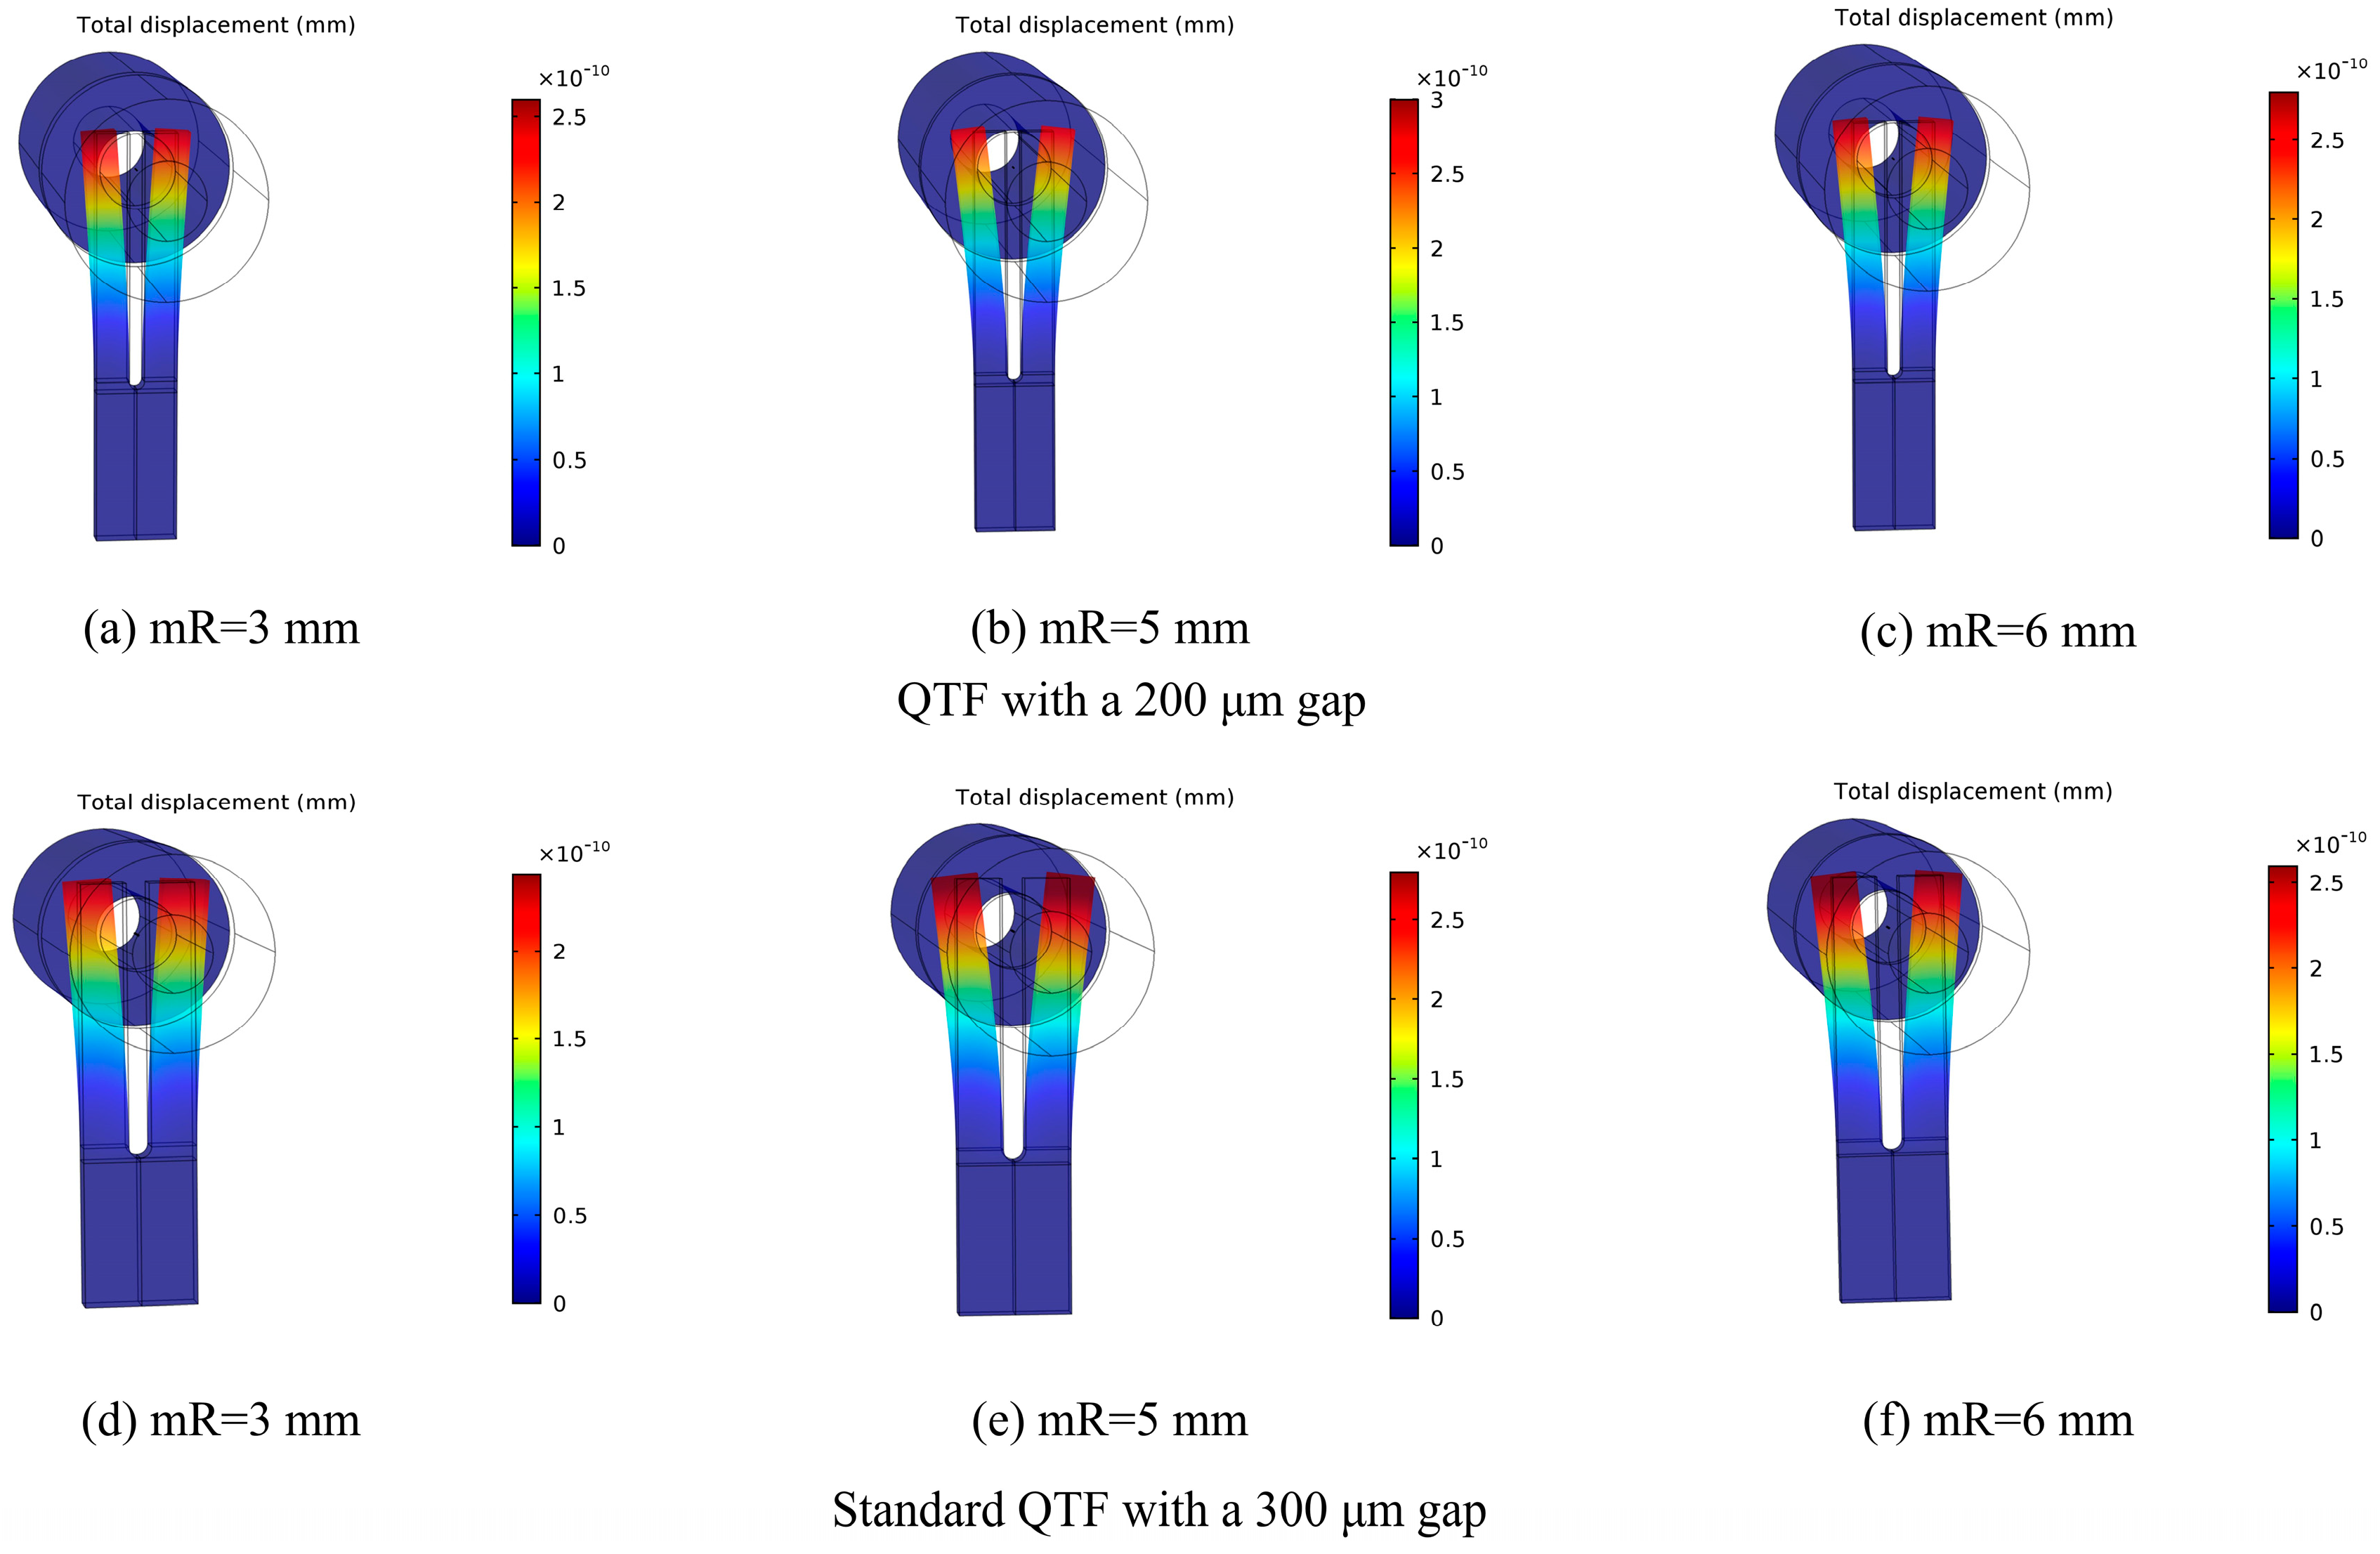
In the QEPAS technique, the acoustic wave generated by the reaction between gas molecules and laser at the gap of the two prongs can be regarded as spherical wave oscillation. The spherical wave propagation decreases with the cube of the distance, which means that the energy of the acoustic wave will attenuate rapidly as the distance from the generation point of the acoustic wave increases. Based on the above analysis, employing a QTF with a small gap will increase the strength of the acoustic wave acting on the prongs of QTF. Therefore, the signal level of QEPAS would be enhanced. The schematic of the laser beam, a QTF, and the generated acoustic wave is shown in Figure 8. The first custom QTF with a small gap of 200 μm used in the QEPAS sensor was reported by Ma [75]. Using the COMSOL software, a finite element modeling (FEM) was constructed, and the displacement of QTF with different micro-resonators (mR) was calculated theoretically. For comparison, a standard QTF with a 300-μm gap was also investigated. The calculated results are shown in Figure 9. An experimental evaluation was carried out by employing a distributed feedback diode laser with emitting wavelength of 1.39 μm and choosing water vapor (H2O) as the target analyte. The detailed parameters of QTF and experimental results are displayed in Table 2. It can be seen that using a custom QTF with a small gap of 200 μm improved the QEPAS sensor performance significantly. This improvement can be explained as follows. Firstly, due to a lower energy loss of propagation, the QTF with a small gap of 200 μm allowed the acoustic wave to push the fork prongs more efficiently. Secondly, a decrease of QTF mass compared to that of a standard QTF would result in bigger displacement.
5. FEW-QEPAS Sensor for Long-Distance and Distributed Gas Detection
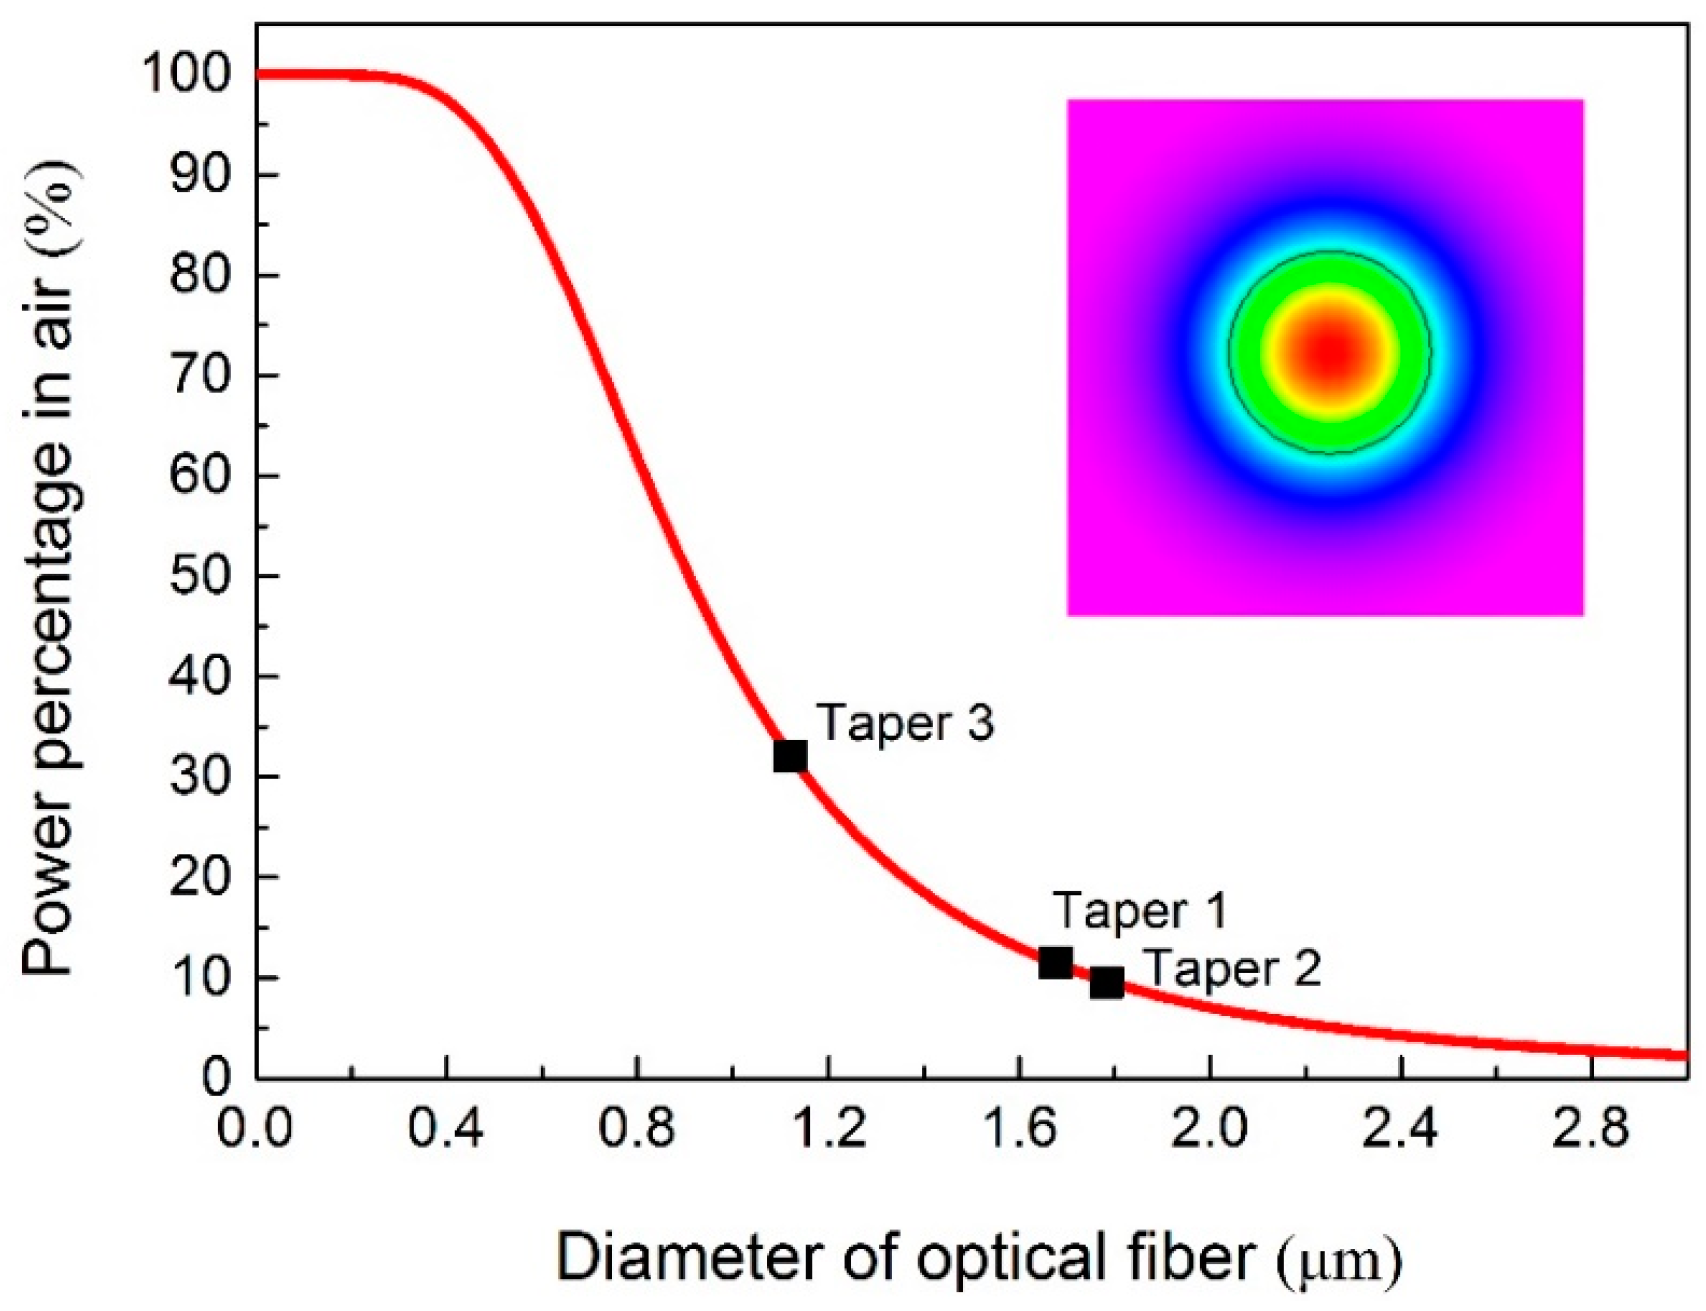
Usually the QEPAS sensor is applied to gas concentration measurement for one point. It is hard for it to realize distributed gas sensing. Fiber evanescent wave (FEW) technology has the advantages of anti-adverse environment, anti-electromagnetic interference, low transmission loss, flexible in operation, and on-line measurement. In 2017, Ma combined the QEPAS and FEW techniques and proposed a new FEW-QEPAS method for long-distance and distributed gas sensing [76]. Due to the fact that the power of the FEW increases with decreasing diameter of the micro-nano fiber, the diameter of the tapered fiber should be small enough (<2 µm) to get a strong FEW. Using the flame-brushing method, the tapered fibers were fabricated from a standard single-mode fiber (SMF). To evaluate the FEW sensor performance, a single mode fiber with a length of 3 km was used to deliver the laser, and three tapers were fabricated as sensing units. The measured diameters of the three tapered fibers were ~1.67 µm, 1.77 µm, and 1.12 µm, respectively. The power percentage of FEW for the three tapers was calculated by a finite element method (FEM) of COMSOL Multiphysics (COMSOL Inc., Stockholm, Sweden) and is depicted in Figure 10.
The schematic of the experimental setup for FEW-QEPAS sensor is depicted in Figure 11. An experimental evaluation was carried out by employing a distributed feedback diode laser with emitting wavelength of 1.53 μm and choosing acetylene (C2H2) as the target analyte. The detection limit of 30 ppm, 51 ppm and 13 ppm at 1 s integration time was obtained for the three tapers, respectively. The corresponding NNEA were 3.55 × 10⁻⁶, 3.52 × 10⁻⁶, and 3.66 × 10⁻⁶ cm−1 W/Hz−1/2, respectively. Further improvement of the performance of FEW-sensor can be achieved by using a fiber taper with a smaller diameter and lower transmission loss.
6. 3D-Printed QEPAS Sensor
To be useful in practical applications, a QEPAS sensor should be portable and small in terms of size, weight, and power consumption. Typically, a group of block-shaped lenses is used for laser beam propagating and transforming [77,78]. As a consequence, it results in unstable configuration and large size and therefore limits the sensor’s performance and real applications. The 3D printing technique does not need traditional machine tools and multi-machining process. It holds the merits of “free manufacturing”, reduction in processing time and procedure, high integration and stability, and so on. A 3D-printed QEPAS acoustic detection module (ADM) was first demonstrated by Ma [79,80]. The designed 3D model of ADM and the 3D-printed product are displayed in Figure 12. A UV-curable resin was used as the processing material for the 3D printing. The 3D-printed ADM had dimensions of 29 mm in length, 15 mm in width, and 8 mm in thickness, and was sealed by a quartz glass window. A fiber-coupled grin lens with a diameter of 1.8 mm was adopted for laser focusing. The optical components of fiber and grin lens and the photoacoustic detection components of QTF and a pair of micro-resonators (mRs) were assembled together. The total weight of the 3D-printed ADM, including all the above components, was ~5 g.
A portable QEPAS sensor was further developed based on the above 3D-printed ADM. The QEPAS system contains two floors, in which Floor I is for the circuitry section, including a diode laser driver, a custom lock-in amplifier, and a transimpedance amplifier. In order to facilitate its usage outside, a rechargeable battery with running time of 8 h was used as the power supply. Floor II is for the optical section, in which a fiber beam splitter (FBS) with a splitting ratio of 1:9, an integrated ADM, and a reference cell were assembled. The portable QEPAS sensor had a dimension of 250 × 250 × 50 mm3. The weight of it was ~3.5 kg.
7. Conclusions and Future Outlook
In this review, recent developments of the QEPAS-based trace gas sensing technique in the past five years are summarized and discussed. Compared to other absorption spectroscopy such as tunable diode laser absorption spectroscopy (TDLAS), a distinct advantage of the QEPAS sensor is that its performance can be improved when the output power of the excitation laser source is increased. Based on this feature, the near-infrared light source of diode laser was power amplified by an erbium-doped fiber amplifier in the communications bands to improve the QEPAS sensor performance. Due to the output coupling loss, the laser power intensity in the intra-cavity is much higher than outside. Therefore, placing a QTF into the intra-cavity can enhance the signal level of QEPAS. When excitation sources such as LEDs, VCSELs, and terahertz (Thz) QCLs are used in QEPAS sensors, the bad beam quality of large beam diameter and divergence angle make the light beam unable to pass through the micro-resonators and the 300 μm gap between the two prongs of standard QTFs, resulting in obvious optical noise. A custom QTF with a large prong gap of ~1 mm can solve this issue well. If the fundamental resonance frequency of the custom QTF is small (a few kHz), the resonance frequency of the first overtone flexural mode should not be too high (<20 kHz). Therefore, the first overtone flexural mode of QTF can be used in the QEPAS sensor. The several-fold increase in the Q factor of the first overtone mode improved the QEPAS sensor detection sensitivity significantly. Unlike the custom QTF with a large prong gap, a custom QTF with a small gap of 200 μm with the merit of lower energy loss of propagation allowed the acoustic wave to push the fork prongs more efficiently. A decrease of QTF mass compared to a standard QTF would result in bigger displacement. Therefore, employing a QTF with a small gap of 200 μm in QEPAS is another way to improve the detection limit. Fiber evanescent wave (FEW) has the advantages of being flexible in operation and on-line measurement. By combining FEW and QEPAS techniques together, a long distance of 3 km and distributed gas sensing were achieved. The 3D printing technique has the merits of “free manufacturing”, reduction in processing time and procedure, high integration, and stability. A portable, small QEPAS sensor was obtained using a 3D-printed QEPAS acoustic detection module with a weight of ~5 g. Further improvement of the QEPAS sensor detection sensitivity can be obtained by using a THz laser source with high output power in order to achieve the minimum detectable concentration at the ppb or sub-ppb level. Furthermore, the intra-cavity QEPAS sensor can be realized in the novel mid-infrared solid-state laser oscillations with the merits of high laser power intensity and excellent beam quality [81,82]. Unlike optical detectors used in other laser spectroscopy such as TDLAS, QTF is immune to the laser wavelength. This feature is especially attractive for QEPAS gas sensing in the >10 μm region, where the availability of optical detectors is limited and the strong absorption band of gas molecules exist. The overall size of a typical QEPAS sensor platform can be significantly reduced to a size that makes this device suitable for applications requiring lightweight and compact sensors such as balloon- or miniature unmanned aerial vehicle (UAV)-based atmospheric measurements or portable low-cost sensors for first responders, such as in mining accidents or forest fires near urban centers. The QEPAS-based sensor has a wide range of applications in environmental monitoring, atmospheric chemistry, industrial chemical analysis, and medical and biomedical diagnostics, as well as in law enforcement.
Funding
This research was funded by the National Natural Science Foundation of China (Grant No. 61505041 and 61875047), the Natural Science Foundation of Heilongjiang Province of China (Grant No. F2015011), the Fundamental Research Funds for the Central Universities, and the Application Technology Research and the Development Projects of Harbin (No. 2016RAQXJ140).
Conflicts of Interest
The author declares no conflict of interest.
References
- Bell, A.G. On the production and reproduction of sound by light: The photophone. Am. J. Sci. 1880, 20, 305–324. [Google Scholar] [CrossRef]
- Kosterev, A.A.; Tittel, F.K.; Serebryakov, D.V.; Malinovsky, A.L.; Morozov, I.V. Applications of quartz tuning forks in spectroscopic gas sensing. Rev. Sci. Instrum. 2005, 76, 043105. [Google Scholar] [CrossRef]
- Elia, A.; Lugarà, P.M.; Franco, C.D.; Spagnolo, V. Photoacoustic techniques for trace gas sensing based on semiconductor laser sources. Sensors 2009, 9, 9616–9628. [Google Scholar] [CrossRef] [PubMed]
- Manninen, A.; Sand, J.; Saarela, J.; Sorvajärvi, T.; Toivonen, J.; Hernberg, R. Electromechanical film as a photoacoustic transducer. Opt. Express 2009, 17, 16994–16999. [Google Scholar] [CrossRef] [PubMed]
- Bozóki, Z.; Pogany, A.; Szabo, G. Photoacoustic instruments for practical applications: Present, potentials, and future challenges. Appl. Spectrosc. Rev. 2011, 46, 1–37. [Google Scholar] [CrossRef]
- Elia, A.; Franco, C.D.; Lugarà, P.M.; Scamarcio, G. Photoacoustic spectroscopy with quantum cascade lasers for trace gas detection. Sensors 2006, 6, 1411–1419. [Google Scholar] [CrossRef]
- Schmohl, A.; Miklós, A.; Hess, P. Detection of ammonia by photoacoustic spectroscopy with semiconductor lasers. Appl. Opt. 2002, 41, 1815–1823. [Google Scholar] [CrossRef] [PubMed]
- Zheng, H.; Lou, M.; Dong, L.; Wu, H.; Ye, W.; Yin, X.; Kim, C.S.; Kim, M.; Bewley, W.W.; Merritt, C.D.; et al. Compact photoacoustic module for methane detection incorporating interband cascade light emitting device. Opt. Express 2017, 25, 16761–16770. [Google Scholar] [CrossRef] [PubMed]
- Kosterev, A.A.; Bakhirkin, Y.A.; Curl, R.F.; Tittel, F.K. Quartz-enhanced photoacoustic spectroscopy. Opt. Lett. 2002, 27, 1902–1904. [Google Scholar] [CrossRef] [PubMed]
- Mordmüller, M.; Köhring, M.; Schade, W.; Willer, U. An electrically and optically cooperated QEPAS device for highly integrated gas sensors. Appl. Phys. B 2015, 119, 111–118. [Google Scholar] [CrossRef]
- Petra, N.; Zweck, J.; Kosterev, A.A.; Minkoff, S.E.; Thomazy, D. Theoretical analysis of a quartz-enhanced photoacoustic spectroscopy sensor. Appl. Phys. B 2009, 94, 673–680. [Google Scholar] [CrossRef]
- Gong, P.; Xie, L.; Qi, X.Q.; Wang, R. A QEPAS-based central wavelength stabilized diode laser for gas sensing. IEEE Photonics Technol. Lett. 2015, 27, 545–548. [Google Scholar] [CrossRef]
- Liu, Y.N.; Chang, J.; Lian, J.; Liu, Z.J.; Wang, Q.; Qin, Z.G. Quartz-enhanced photoacoustic spectroscopy with right-angle prism. Sensors 2016, 16, 214. [Google Scholar] [CrossRef] [PubMed]
- Kosterev, A.A.; Bakhirkin, Y.A.; Tittel, F.K. Ultrasensitive gas detection by quartz-enhanced photoacoustic spectroscopy in the fundamental molecular absorption bands region. Appl. Phys. B 2005, 80, 133–138. [Google Scholar] [CrossRef]
- Lassen, M.; Lamard, L.; Feng, Y.; Peremans, A.; Petersen, J.C. Off-axis quartz-enhanced photoacoustic spectroscopy using a pulsed nanosecond mid-infrared optical parametric oscillator. Opt. Lett. 2016, 41, 4118–4121. [Google Scholar] [CrossRef] [PubMed]
- Rück, T.; Bierl, R.; Matysik, F. NO2 trace gas monitoring in air using off-beam quartz enhancedphotoacoustic spectroscopy (QEPAS) and interference studies towards CO2, H2O and acoustic noise. Sens. Actuators B 2018, 255, 2462–2471. [Google Scholar] [CrossRef]
- Dong, Y.J.; Chen, J.; Luo, L.Q.; Forsberg, E.; He, S.L.; Yan, C.S. Modeling and implementation of a fiber-based quartz-enhanced photoacoustic spectroscopy system. Appl. Opt. 2015, 54, 4202–4206. [Google Scholar] [CrossRef]
- Starecki, T.; Wieczorek, P.Z. A high sensitivity preamplifier for quartz tuning forks in QEPAS (quartz enhanced photoacoustic spectroscopy) applications. Sensors 2017, 17, 2528. [Google Scholar] [CrossRef] [PubMed]
- Ngai, A.K.Y.; Persijn, S.T.; Lindsay, I.D.; Kosterev, A.A.; Groß, P.; Lee, C.J.; Cristescu, S.M.; Tittel, F.K.; Boller, K.J.; Harren, F.J.M. Continuous wave optical parametric oscillator for quartz-enhanced photoacoustic trace gas sensing. Appl. Phys. B 2007, 89, 123. [Google Scholar] [CrossRef] [Green Version]
- Ma, Y.F.; Lewicki, R.; Razeghi, M.; Tittel, F.K. QEPAS based ppb-level detection of CO and N2O using a high power CW DFB-QCL. Opt. Express 2013, 21, 1008–1019. [Google Scholar] [CrossRef] [PubMed]
- Li, Z.L.; Wang, Z.; Wang, C.; Ren, W. Optical fiber tip-based quartz-enhanced photoacoustic sensor for trace gas detection. Appl. Phys. B 2016, 122, 147. [Google Scholar] [CrossRef]
- Yi, H.M.; Maamary, R.; Gao, X.M.; Sigrist, M.W.; Fertein, E.; Chen, W.D. Short-lived species detection of nitrous acid by external-cavity quantum cascade laser based quartz-enhanced photoacoustic absorption spectroscopy. Appl. Phys. Lett. 2015, 106, 101109. [Google Scholar] [CrossRef]
- Dong, L.; Spagnolo, V.; Lewicki, R.; Tittel, F.K. Ppb-level detection of nitric oxide using an external cavity quantum cascade laser based QEPAS sensor. Opt. Express 2011, 19, 24037–24045. [Google Scholar] [CrossRef] [PubMed]
- Gray, S.; Liu, A.P.; Xie, F.; Zah, C. Detection of nitric oxide in air with a 5.2 µm distributed-feedback quantum cascade laser using quartz-enhanced photoacoustic spectroscopy. Opt. Express 2010, 18, 23353–23357. [Google Scholar] [CrossRef] [PubMed]
- Zheng, H.D.; Dong, L.; Ma, Y.; Wu, H.P.; Liu, X.L.; Yin, X.K.; Zhang, L.; Ma, W.G.; Yin, W.B.; Xiao, L.T.; et al. Scattered light modulation cancellation method for sub-ppb-level NO2 detection in a LD-excited QEPAS system. Opt. Express 2016, 24, A752–A761. [Google Scholar] [CrossRef] [PubMed]
- Jiang, M.; Feng, Q.L.; Wang, C.Y.; Wei, Y.F.; Liang, T.L.; Wang, X.F. Ammonia sensor based on QEPAS with HC-PBF as reference cell. Proc. SPIE 2015, 9620, 96200F. [Google Scholar]
- Triki, M.; Nguyen, B.T.; Vicet, A. Compact sensor for methane detection in the mid infrared region based on quartz enhanced photoacoustic spectroscopy. Infrared Phys. Technol. 2015, 69, 74–80. [Google Scholar] [CrossRef]
- Waclawek, J.P.; Moser, H.; Lendl, B. Compact quantum cascade laser based quartz-enhanced photoacoustic spectroscopy sensor system for detection of carbon disulfide. Opt. Express 2016, 24, 6559–6571. [Google Scholar] [CrossRef] [PubMed]
- Wang, Z.; Li, Z.; Ren, W. Quartz-enhanced photoacoustic detection of ethylene using a 10.5 μm quantum cascade laser. Opt. Express 2016, 24, 4143–4154. [Google Scholar] [CrossRef] [PubMed]
- Nguyen, B.T.; Triki, M.; Desbrosses, G.; Vicet, A. Quartz-enhanced photoacoustic spectroscopy sensor for ethylene detection with a 3.32 μm distributed feedback laser diode. Rev. Sci. Instrum. 2015, 86, 023111. [Google Scholar] [CrossRef] [PubMed]
- Helman, M.; Moser, H.; Dudkowiak, A.; Lendl, B. Off-beam quartz-enhanced photoacoustic spectroscopy-based sensor for hydrogen sulfide trace gas detection using a mode-hop-free external cavity quantum cascade laser. Appl. Phys. B 2017, 123, 141. [Google Scholar] [CrossRef]
- Jahjah, M.; Belahsene, S.; Nähle, L.; Fischer, M.; Koeth, J.; Rouillard, Y.; Vicet, A. Quartz enhanced photoacoustic spectroscopy with a 3.38 µm antimonide distributed feedback laser. Opt. Lett. 2012, 37, 2502–2504. [Google Scholar] [CrossRef] [PubMed]
- Pohlkötter, A.; Köhring, M.; Willer, U.; Schade, W. Detection of molecular oxygen at low concentrations using quartz enhanced photoacoustic spectroscopy. Sensors 2010, 10, 8466–8477. [Google Scholar] [CrossRef] [PubMed]
- Milde, T.; Hoppe, M.; Tatenguem, H.; Mordmüller, M.; Ogorman, J.; Willer, U.; Schade, W.; Sacher, J. QEPAS sensor for breath analysis: A behavior of pressure. Appl. Opt. 2018, 57, C120–C127. [Google Scholar] [CrossRef] [PubMed]
- Lewicki, R.; Kosterev, A.A.; Thomazy, D.M.; Risby, T.H.; Solga, S.; Schwartz, T.B.; Tittel, F.K. Real time ammonia detection in exhaled human breath using a distributed feedback quantum cascade laser based sensor. Proc. SPIE 2011, 10, 709–716. [Google Scholar]
- Köhring, M.; Böttger, S.; Willer, U.; Schade, W. LED-absorption-QEPAS sensor for biogas plants. Sensors 2015, 15, 12092–12102. [Google Scholar] [CrossRef] [PubMed]
- Liu, K.; Zhao, W.X.; Wang, L.; Tan, T.; Wang, G.S.; Zhang, W.J.; Gao, X.M.; Chen, W.D. Quartz-enhanced photoacoustic spectroscopy of HCN from 6433 to 6613 cm−1. Opt. Commun. 2015, 340, 126–130. [Google Scholar] [CrossRef]
- Gong, P.; Xie, L.; Qi, X.Q.; Wang, R.; Wang, H.; Chang, M.C.; Yang, H.X.; Sun, F.; Li, G.P. A quartz-enhanced photoacoustic spectroscopy sensor for measurement of water vapor concentration in the air. Chin. Phys. B 2015, 24, 014206. [Google Scholar] [CrossRef]
- Dong, L.; Lewicki, R.; Liu, K.; Buerki, P.R.; Weida, M.J.; Tittel, F.K. Ultra-sensitive carbon monoxide detection by using EC-QCL based quartz-enhanced photoacoustic spectroscopy. Appl. Phys. B 2012, 107, 275–283. [Google Scholar] [CrossRef]
- Cao, Y.C.; Jin, W.; Ho, L.H.; Liu, Z.B. Evanescent-wave photoacoustic spectroscopy with optical micro/nano fibers. Opt. Lett. 2012, 37, 214–216. [Google Scholar] [CrossRef] [PubMed]
- Lewicki, R.; Wysocki, G.; Kosterev, A.A.; Tittel, F.K. QEPAS based detection of broadband absorbing molecules using a widely tunable, cw quantum cascade laser at 8.4 μm. Opt. Express 2007, 15, 7357–7366. [Google Scholar] [CrossRef] [PubMed]
- Dong, L.; Kosterev, A.A.; Thomazy, D.; Tittel, F.K. Compact portable QEPAS multi-gas sensor. Proc. SPIE 2011, 7945, 631–640. [Google Scholar]
- Ren, W.; Jiang, W.; Sanchez, N.P.; Patimisco, P.; Spagnolo, V.; Zah, C.; Xie, F.; Hughes, L.C.; Griffin, R.J.; Tittel, F.K. Hydrogen peroxide detection with quartz-enhanced photoacoustic spectroscopy using a distributed-feedback quantum cascade laser. Appl. Phys. Lett. 2014, 104, 041117. [Google Scholar] [CrossRef]
- Bauer, C.; Willer, U.; Lewicki, R.; Pohlkötter, A.; Kosterev, A.A.; Kosynkin, D.; Tittel, F.K.; Schade, W. A mid-infrared QEPAS sensor device for TATP detection. J. Phys. Conf. Ser. 2009, 157, 012002. [Google Scholar] [CrossRef]
- Ma, Y.F.; He, Y.; Yu, X.; Yu, G.; Zhang, J.B.; Sun, R. Research on high sensitivity detection of carbon monoxide based on quantum cascade laser and quartz-enhanced photoacoustic spectroscopy. Acta Phys. Sin. 2016, 65, 060701. [Google Scholar]
- Dong, L.; Kosterev, A.A.; Thomazy, D.; Tittel, F.K. QEPAS spectrophones: Design, optimization, and performance. Appl. Phys. B 2010, 100, 627–635. [Google Scholar] [CrossRef]
- Viciani, S.; de Cumis, M.S.; Borri, S.; Patimisco, P.; Sampaolo, A.; Scamarcio, G.; De Natale, P.; D’Amato, F.; Spagnolo, V. A quartz-enhanced photoacoustic sensor for H2S trace-gas detection at 2.6 μm. Appl. Phys. B 2015, 119, 21–27. [Google Scholar] [CrossRef]
- Ma, Y.F.; Yu, X.; Yu, G.; Li, X.D.; Zhang, J.B.; Chen, D.Y.; Sun, R.; Tittel, F.K. Multi-quartz-enhanced photoacoustic spectroscopy. Appl. Phys. Lett. 2015, 107, 021106. [Google Scholar] [CrossRef] [Green Version]
- Liu, K.; Guo, X.Y.; Yi, H.M.; Chen, W.D.; Zhang, W.J.; Gao, X.M. Off-beam quartz-enhanced photoacoustic spectroscopy. Opt. Lett. 2009, 34, 1594–1596. [Google Scholar] [CrossRef] [PubMed]
- Wu, M.C.; Olsson, N.A.; Sivco, D.; Cho, A.Y. A 970 nm strained-layer InGaAs/GaAlAs quantum well laser for pumping an erbium-doped optical fiber amplifier. Appl. Phys. Lett. 1990, 56, 221–223. [Google Scholar] [CrossRef]
- Nakazawa, M.; Kimura, Y.; Suzuki, K. Efficient Er3+-doped optical fiber amplifier pumped by a 1.48 μm InGaAsP laser diode. Appl. Phys. Lett. 1989, 54, 295–297. [Google Scholar] [CrossRef]
- Ma, Y.F.; He, Y.; Zhang, L.G.; Yu, X.; Zhang, J.B.; Sun, R.; Tittel, F.K. Ultra-high sensitive acetylene detection using quartz-enhanced photoacoustic spectroscopy with a fiber amplified diode laser and a 30.72 kHz quartz tuning fork. Appl. Phys. Lett. 2017, 110, 031107. [Google Scholar] [CrossRef]
- Wu, H.P.; Dong, L.; Zheng, H.D.; Liu, X.L.; Yin, X.K.; Ma, W.G.; Zhang, L.; Yin, W.B.; Jia, S.T.; Tittel, F.K. Enhanced near-infrared QEPAS sensor for sub-ppm level H2S detection by means of a fiber amplified 1582 nm DFB laser. Sens. Actuators B 2015, 221, 666–672. [Google Scholar] [CrossRef]
- Ma, Y.F.; He, Y.; Tong, Y.; Yu, X.; Tittel, F.K. Ppb-level detection of ammonia based on QEPAS using a power amplified laser and a low resonance frequency quartz tuning fork. Opt. Express 2017, 25, 29356–29364. [Google Scholar] [CrossRef]
- Borri, S.; Patimisco, P.; Galli, I.; Mazzotti, D.; Giusfredi, G.; Akikusa, N.; Yamanishi, M.; Scamarcio, G.; de Natale, P.; Spagnolo, V. Intracavity quartz-enhanced photoacoustic sensor. Appl. Phys. Lett. 2014, 104, 091114. [Google Scholar] [CrossRef]
- Patimisco, P.; Borri, S.; Galli, L.; Mazzotti, D.; Giufredi, G.; Akikusa, N.; Yamanishi, M.; Scamarcio, G.; Natale, P.D.; Spagnolo, V. High finesse optical cavity coupled with a quartz-enhanced photoacoustic spectroscopic sensor. Analyst 2015, 140, 736–743. [Google Scholar] [CrossRef] [PubMed]
- Patimisco, P.; Sampaolo, A.; Tittel, F.K.; Spagnolo, V. Mode matching of a laser-beam to a compact high finesse bow-tie optical cavity for quartz enhanced photoacoustic gas sensing. Sens. Actuators A 2017, 267, 70–75. [Google Scholar] [CrossRef]
- Wojtas, J.; Gluszek, A.; Hudzikowski, A.; Tittel, F.K. Mid-infrared trace gas sensor technology based on intracavity quartz-enhanced photoacoustic spectroscopy. Sensors 2017, 17, 513. [Google Scholar] [CrossRef] [PubMed]
- Wang, Q.; Wang, Z.; Ren, W.; Patimisco, P.; Sampaolo, A.; Spagnolo, V. Fiber-ring laser intracavity QEPAS gas sensor using a 7.2 kHz quartztuning fork. Sens. Actuators B 2018, 268, 512–518. [Google Scholar] [CrossRef]
- Ma, Y.F.; Tong, Y.; He, Y.; Yu, X.; Tittel, F.K. High power DFB diode laser based CO-QEPAS sensor: Optimization and performance. Sensors 2018, 18, 122. [Google Scholar] [CrossRef] [PubMed]
- Ma, Y.F.; Yu, G.; Zhang, J.B.; Yu, X.; Sun, R. Sensitive detection of carbon monoxide based on a QEPAS sensor with a 2.3 μm fiber-coupled antimonide diode laser. J. Opt. 2015, 17, 055401. [Google Scholar] [CrossRef]
- Li, Z.; Shi, C.; Ren, W. Mid-infrared multimode fiber-coupled quantum cascadelaser for off-beam quartz-enhanced photoacoustic detection. Opt. Lett. 2016, 41, 4095–4098. [Google Scholar] [CrossRef] [PubMed]
- Ma, Y.F.; Yu, G.; Zhang, J.B.; Yu, X.; Sun, R.; Tittel, F.K. Quartz enhanced photoacoustic spectroscopy based trace gas sensors using different quartz tuning forks. Sensors 2015, 15, 7596–7604. [Google Scholar] [CrossRef] [PubMed]
- Ma, Y.F.; He, Y.; Yu, X.; Chen, C.; Sun, R.; Tittel, F.K. HCl ppb-level detection based on QEPAS sensor using a low resonance frequency quartz tuning fork. Sens. Actuators B 2016, 233, 388–393. [Google Scholar] [CrossRef] [Green Version]
- Ma, Y.F.; He, Y.; Yu, X.; Zhang, J.B.; Sun, R.; Tittel, F.K. Compact all-fiber quartz-enhanced photoacoustic spectroscopy sensor with a 30.72 kHz quartz tuning fork and spatially resolved trace gas detection. Appl. Phys. Lett. 2016, 108, 091115. [Google Scholar] [CrossRef] [Green Version]
- Ma, Y.F.; He, Y.; Chen, C.; Yu, X.; Zhang, J.B.; Peng, J.B.; Sun, R.; Tittel, F.K. Planar laser-based QEPAS trace gas sensor. Sensors 2016, 16, 989. [Google Scholar] [CrossRef] [PubMed]
- Patimisco, P.; Sampaolo, A.; Dong, L.; Giglio, M.; Scamarcio, G.; Tittel, F.K.; Spagnolo, V. Analysis of the electro-elastic properties of custom quartz tuning forks for optoacoustic gas sensing. Sens. Actuators B 2016, 227, 539–546. [Google Scholar] [CrossRef]
- Wu, H.; Yin, X.; Dong, L.; Pei, K.; Sampaolo, A.; Patimisco, P.; Zheng, H.; Ma, W.; Zhang, L.; Yin, W.; et al. Simultaneous dual-gas QEPAS detection based on a fundamental and overtone combined vibration of quartz tuning fork. Appl. Phys. Lett. 2017, 110, 121104. [Google Scholar] [CrossRef] [Green Version]
- Zheng, H.; Dong, L.; Patimisco, P.; Wu, H.; Sampaolo, A.; Yin, X.; Li, S.; Ma, W.; Zhang, L.; Yin, W.; et al. Double antinode excited quartz-enhanced photoacoustic spectrophone. Appl. Phys. Lett. 2017, 110, 021110. [Google Scholar] [CrossRef] [Green Version]
- Borri, S.; Patimisco, P.; Sampaolo, A.; Beere, H.E.; Ritchie, D.A.; Vitiello, M.S.; Scamarcio, G.; Spagnolo, V. Terahertz quartz enhanced photo-acoustic sensor. Appl. Phys. Lett. 2013, 103, 021105. [Google Scholar] [CrossRef]
- Sampaolo, A.; Patimsco, P.; Dong, L.; Geras, A.; Scamarcio, G.; Starecki, T.; Tittel, F.K.; Spagnolo, V. Quartz-enhanced photoacoustic spectroscopy exploiting tuning fork overtone modes. Appl. Phys. Lett. 2015, 107, 231102. [Google Scholar] [CrossRef] [Green Version]
- Zheng, H.; Dong, L.; Sampaolo, A.; Wu, H.; Patimisco, P.; Yin, X.; Ma, W.; Zhang, L.; Yin, W.; Spagnolo, V.; et al. Single-tube on-beam quartz-enhanced photoacoustic spectroscopy. Opt. Lett. 2016, 41, 978–981. [Google Scholar] [CrossRef] [PubMed]
- Zheng, H.; Dong, L.; Sampaolo, A.; Patimisco, P.; Ma, W.; Zhang, L.; Yin, W.; Xiao, L.; Spagnolo, V.; Jia, S.; et al. Overtone resonance enhanced single-tube on-beam quartz enhanced photoacoustic spectrophone. Appl. Phys. Lett. 2016, 109, 111103. [Google Scholar] [CrossRef] [Green Version]
- Tittel, F.K.; Sampaolo, A.; Patimisco, P.; Dong, L.; Geras, A.; Starecki, T.; Spagnolo, V. Analysis of overtone flexural modes operation in quartz-enhanced photoacoustic spectroscopy. Opt. Express 2016, 24, A682–A692. [Google Scholar] [CrossRef] [PubMed]
- Ma, Y.; Tong, Y.; He, Y.; Long, J.; Yu, X. Quartz-enhanced photoacoustic spectroscopy sensor with a small-gap quartz tuning fork. Sensors 2018, 18, 2047. [Google Scholar] [CrossRef] [PubMed]
- He, Y.; Ma, Y.F.; Tong, Y.; Yu, X.; Peng, Z.F.; Gao, J.; Tittel, F.K. Long distance, distributed gas sensing based on micro-nano fiber evanescent wave quartz-enhanced photoacoustic spectroscopy. Appl. Phys. Lett. 2017, 111, 24110. [Google Scholar] [CrossRef]
- Kosterev, A.A.; Mosely, T.S.; Tittel, F.K. Impact of humidity on quartz-enhancedphotoacoustic spectroscopy based detection of HCN. Appl. Phys. B 2006, 85, 295–300. [Google Scholar] [CrossRef]
- Jahjah, M.; Vicet, A.; Rouillard, Y. A QEPAS based methane sensor with a 2.35 μm antimonide laser. Appl. Phys. B 2012, 106, 483–489. [Google Scholar] [CrossRef]
- He, Y.; Ma, Y.; Tong, Y.; Yu, X.; Tittel, F.K. HCN ppt-level detection based on a QEPAS sensor with amplified laser and a miniaturized 3D-printed photoacoustic detection channel. Opt. Express 2018, 26, 9666–9675. [Google Scholar] [CrossRef] [PubMed]
- Yang, X.; Xiao, Y.; Ma, Y.; He, Y.; Tittel, F.K. A Miniaturized QEPAS trace gas sensor with a 3D-printed acoustic detection module. Sensors 2017, 17, 1750. [Google Scholar] [CrossRef] [PubMed]
- Wang, Y.C.; Lan, R.J.; Mateos, X.; Li, J.; Hu, C.; Li, C.Y.; Suomalainen, S.; Härkönen, A.; Guina, M.; Petrov, V.; et al. Broadly tunable mode-locked Ho:YAG ceramic laser around 2.1 μm. Opt. Express 2016, 24, 18003–18012. [Google Scholar] [CrossRef] [PubMed]
- Yang, X.T.; Yao, B.Q.; Ding, Y.; Li, X.; Aka, G.; Zheng, L.H.; Xu, J. Spectral properties and laser performance of Ho:Sc2SiO5 crystal at room temperature. Opt. Express 2013, 21, 32566–32571. [Google Scholar] [CrossRef] [PubMed]
Figure 1.
The principle of the PAS technique.

Figure 2.
Schematic of the QEPAS sensor. TA: transimpedance amplifier; mR: micro-resonator; ADM: acoustic detection module; L: plano-convex lens; FC: fiber collimator.
Figure 2.
Schematic of the QEPAS sensor. TA: transimpedance amplifier; mR: micro-resonator; ADM: acoustic detection module; L: plano-convex lens; FC: fiber collimator.

Figure 3.
Emission spectra for a seed laser and an EDFA-amplified diode laser.

Figure 4.
EDFA-based QEPAS sensor system.

Figure 5.
Schematic of the optical resonator.

Figure 6.
Schematic of the I-QEPAS sensor based on fiber-ring laser.

Figure 7.
Schematic of the custom QTF, fundamental flexural mode, and the first overtone flexural mode.
Figure 7.
Schematic of the custom QTF, fundamental flexural mode, and the first overtone flexural mode.

Figure 8.
Schematic of the QTF, the laser beam, and the generated acoustic wave.

Figure 9.
Calculated displacement for two different QTFs with various lengths of micro-resonators (mRs): (a–c) for the QTF with a 200 μm gap; (d–f) for the standard QTF with a 300 μm gap.
Figure 9.
Calculated displacement for two different QTFs with various lengths of micro-resonators (mRs): (a–c) for the QTF with a 200 μm gap; (d–f) for the standard QTF with a 300 μm gap.

Figure 10.
FEW power as a function of fiber diameter for three tapers (inset: optical field distribution for fiber taper).
Figure 10.
FEW power as a function of fiber diameter for three tapers (inset: optical field distribution for fiber taper).

Figure 11.
Schematic of the FEW-QEPAS sensor.

Figure 12.
Schematic of the 3D-printed ADM (a) Designed 3D model; (b) 3D-printed ADM with optical and photoacoustic detection components; (c) the flow field within the ADM.
Figure 12.
Schematic of the 3D-printed ADM (a) Designed 3D model; (b) 3D-printed ADM with optical and photoacoustic detection components; (c) the flow field within the ADM.


Table 1.
Parameters for standard and custom QTFs.
| QTF | f0 (kHz) | Length (mm) | Width (mm) | Thickness (mm) | Gap (mm) |
|---|---|---|---|---|---|
| Standard | 32.768 | 3.6 | 0.6 | 0.36 | 0.3 |
| Custom | 4.246 | 20 | 1.4 | 0.8 | 1 |
Table 2.
Dimensions and parameters of two QTFs.
| Parameter | Unit | Small-Gap QTF | Standard QTF [63] |
|---|---|---|---|
| Length | mm | 3.42 | 3.6 |
| Width | mm | 0.3 | 0.6 |
| Thickness | mm | 0.44 | 0.36 |
| Gap | μm | 200 | 300 |
| Detection limit | ppm | 1.85 | 5.9 |
| NNEA | cm−1W/√Hz | 2.02 × 10⁻⁸ | 7.73 × 10⁻⁸ |
© 2018 by the author. Licensee MDPI, Basel, Switzerland. This article is an open access article distributed under the terms and conditions of the Creative Commons Attribution (CC BY) license (http://creativecommons.org/licenses/by/4.0/).
Share and Cite
MDPI and ACS Style
Ma, Y. Review of Recent Advances in QEPAS-Based Trace Gas Sensing. Appl. Sci. 2018, 8, 1822. https://doi.org/10.3390/app8101822
AMA Style
Ma Y. Review of Recent Advances in QEPAS-Based Trace Gas Sensing. Applied Sciences. 2018; 8(10):1822. https://doi.org/10.3390/app8101822
Chicago/Turabian StyleMa, Yufei. 2018. "Review of Recent Advances in QEPAS-Based Trace Gas Sensing" Applied Sciences 8, no. 10: 1822. https://doi.org/10.3390/app8101822
Note that from the first issue of 2016, this journal uses article numbers instead of page numbers. See further details here.