Investigating the Relation between Absorption and Gas Concentration in Gas Detection Using a Diffuse Integrating Cavity

1
Condensed-Matter Science and Technology Institute, Harbin Institute of Technology, Harbin 150001, China
2
Physical Science and Technology, Heilongjiang University, Harbin 150001, China
*
Author to whom correspondence should be addressed.
Appl. Sci. 2018, 8(9), 1630; https://doi.org/10.3390/app8091630
Submission received: 2 August 2018
/
Revised: 2 September 2018
/
Accepted: 7 September 2018
/
Published: 12 September 2018
(This article belongs to the Special Issue State-of-the-art Laser Gas Sensing Technologies)
Abstract
:Featured Application
The current work provides twofold benefits on using a diffuse integrating cavity as a gas cell: (1) Understand the non-linear relation between absorption and gas concentration; (2) Provide the experimental method for determining the transition point.
Abstract
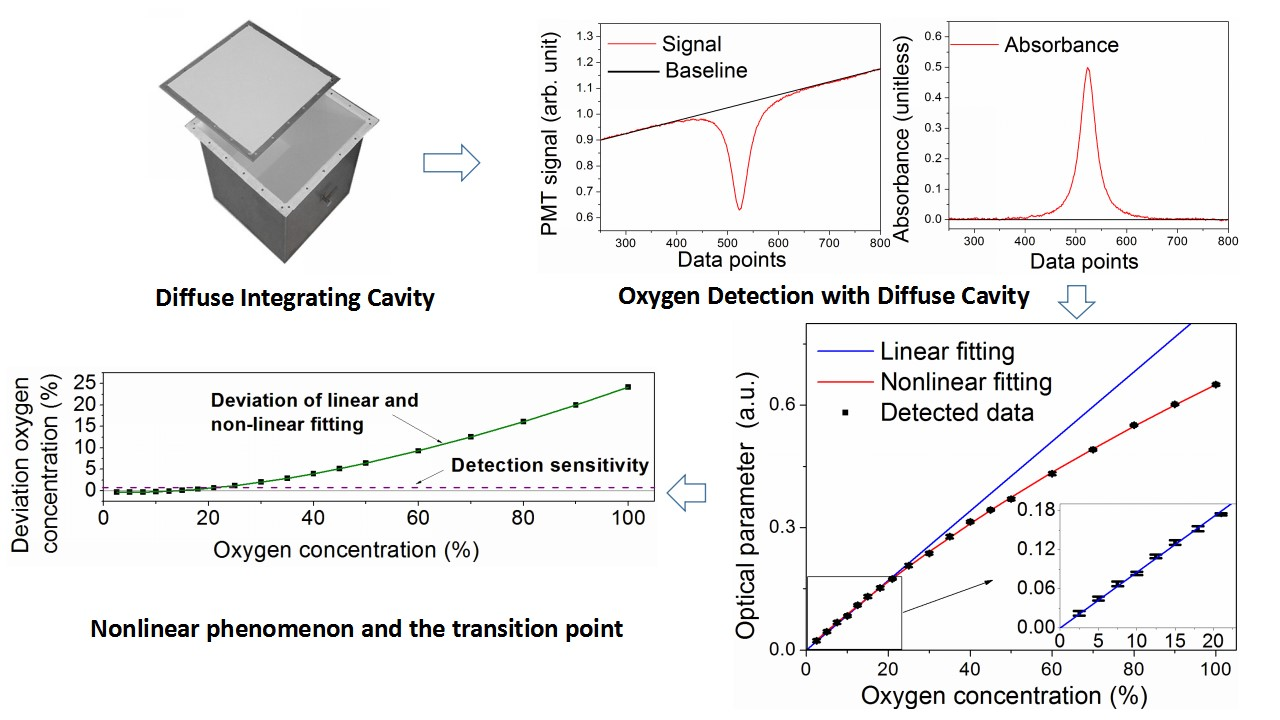
The relationship between absorption and gas concentration was studied using a diffuse integrating cavity as a gas cell. The light transmission process in an arbitrary diffuse cavity was theoretically derived based on a beam reflection analysis. It was found that a weak absorption condition must be satisfied to ensure a linear relationship between absorbance and gas concentration. When the weak absorption condition is not satisfied, a non-linear relation will be observed. A 35 × 35 × 35 cm diffuse integrating cavity was used in the experiment. Different oxygen concentrations were measured by detecting the P9 absorption line at 763.8 nm, based on tunable diode laser absorption spectroscopy. The relationship between the absorption signals and oxygen concentration was linear at low oxygen concentrations and became non-linear when oxygen concentrations were higher than 21%. The absorbance value of this transition point was 0.17, which was considered as the weak absorption condition for this system. This work studied the theoretical reason for the non-linear phenomenon and provided an experimental method to determine the transition point when using a diffuse integrating cavity as a gas cell.

1. Introduction
The measurement of gas concentration using absorption spectroscopy is a technique with great environmental adaptability and commercial potential. To improve the detection sensitivity, a long optical path length is necessary for trace gas measurement because the signal to noise ratio (SNR) improves with increasing optical path length in absorber [1]. Many methods have been developed to extend the optical path length, such as multi-pass cells [2,3], cavity ring-down spectroscopy (CRDS) [4], gas in media absorption spectroscopy (GASMAS) and applications of diffuse integrating cavities [5,6,7]. Among these methods, integrating cavities have proven advantageous in good stability, effortless laser beam alignment, few interference fringes, and low cost [8,9]. Besides, a diffuse integrating cavity is an attractive choice for spectral techniques with incoherent light sources, such as Fourier transform infrared (FTIR) spectroscopy [10].
Many achievements have been obtained on the light transmission law of diffuse integrating cavities [11,12]. The Beer-Lambert law is usually used to describe the output light radiation from a diffuse cavity, where the effective optical path length (EOPL) is usually introduced to describe the equivalent path length of a photon in the cavity. From previous publications, the EOPL formula has been presented as being related to the launch geometry condition, L0, reflectivity, ρ, of the inner surface, the single pass average path length, Lave, and the port fraction, f, of the cavity [13,14]. Thus, the EOPL should be independent of the detected gas concentration. The experimental methods used to measure the EOPL and its related parameters, such as ρ, Lave, and f have been established and implemented [15,16]. However, detected absorption signals usually show a nonlinear relation with gas concentration at high gas concentration values [17,18] in applications. To explain such non-linear phenomenon, the EOPL was considered as a variation with gas concentration in some previous research [19,20], in which an absorption term (including gas concentration information) was introduced to describe the varied EOPL in a modified formula. Nevertheless, a varying EOPL makes practical gas concentration measurements complicated. Hence, the EOPL should be independent of the detected gas. That is, a restriction might exist while using the Beer-Lambert law to describe the output radiance from a diffuse cavity, which has not been considered in previous research. If the condition is not satisfied, a non-linear phenomenon will be observed. Thus, two concerns should be addressed preferentially. Firstly, what is the restrictive condition? Secondly, how is the condition value determined from an experiment?
In this study, the relation between absorbance and concentration in gas detection was investigated when a diffuse integrating cavity was used as a gas cell. A beam reflection analysis was implemented to analyze the light transmission process for an arbitrary-shaped diffuse cavity. An approximate condition was proposed and used in the derivation to ensure that the output radiation as a form of the Beer-Lambert law. When this condition was not satisfied, at high gas concentrations, a non-linear phenomenon was observed. Different oxygen concentrations were detected by scanning the P9 absorption line at 763.8 nm based on tunable diode laser absorption spectroscopy (TDLAS). A 35 × 35 × 35 cm diffuse integrating cavity was designed and used as the gas cell. A relationship between absorbance and gas concentration was obtained. The absorbance value at the non-linear transition was determined by experiments.
2. Theory
To fundamentally understand the reason for the non-linear relationship between the absorption signal and gas concentration, the reflection process for a light beam passing through a diffuse integrating cavity was analyzed theoretically. In general, an ideal arbitrary integrating cavity is defined as a cavity in which any two points on the inner wall can be connected to a segment inside the cavity. The inner wall of an integrating cavity is covered with a highly diffuse reflective coating, which can be considered as an ideal Lambertian radiation source. Thus, an incident beam could be diffused continuously. A simplified model of the beam transmission process is shown in Figure 1. The input light radiation flux is denoted by Ф0, and the first light path, L0, is the distance between the entrance aperture and the first reflection spot. Neglecting the radiation loss through the entrance and detection windows, the radiant flux after the first reflection can be expressed by Equation (1), according to the Beer-Lambert law:
Here, ρ is the reflectivity of the inner surface, α is the absorption coefficient, which is equal to the product of the particle number density N and the absorption cross section σ.
A single-pass average path length of Lave was introduced to describe the distance between successive light reflections [21]. If the port fraction of the cavity is f, then light travels a distance Lave and a portion exits from the output aperture. Light exiting the cavity is received by a detector:
The remaining radiation flux is
This light radiation is still transmitted in the integrating cavity and part of this light outputs again after traveling Lave. The rest is reflected by the internal wall again. This process repeats continuously. Table 1 shows the output radiation after each reflection from an arbitrary integrating cavity.
The total light radiation, Фout, received by the detector is proportional to the sum of the output radiation:
The absorbance, A, can be expressed as:
We found that the absorbance, A, is a complicated expression here. However, a linear relationship between absorbance and gas concentration was expected in gas detection for easy calibration. Thus, some approximations should be introduced to express Фout in the form of the Beer-Lambert law:
It was found that Equation (7) is a stricter condition compared to Equation (6). Once Equation (7) is satisfied, Equation (6) must be followed. Thus, the following approximations were obtained in mathematics:
Thus, Equation (4) can be expressed as:
Here,
Detailed derivations for Equations (4)–(10) are presented in “Appendix A”. These indicate that Equation (10) is in the same form as the Beer-Lambert law. Comparing Equation (10) with the Beer-Lambert law, the expression for the EOPL for an arbitrary diffuse cavity can be obtained as:
Obviously, Equation (12) is similar to the previously reported EOPL expression [13,14]. The only difference is the coefficient ρ in the numerator, which was replaced by 1 in the previous results. This slight difference was usually smaller than measurement errors and could be ignored.
According to Equation (12), the approximate condition of Equation (7) can be transformed into
Here, we define Equation (13) as the weak absorption condition of the diffuse integrating cavity. Thus, the absorbance can be expressed as Equation (14), according to Equation (10).
Here, the particle number density, N, denotes the concentration of the test gas and σ is the absorption cross-section. In other words, the absorbance can be expressed as Equation (14) under the weak absorption condition of Equation (13), where the absorbance depends linearly on the gas concentration. On the contrary, if the weak absorption condition was not satisfied, the absorbance will present non-linearly on the gas concentration.
3. Experimental Section
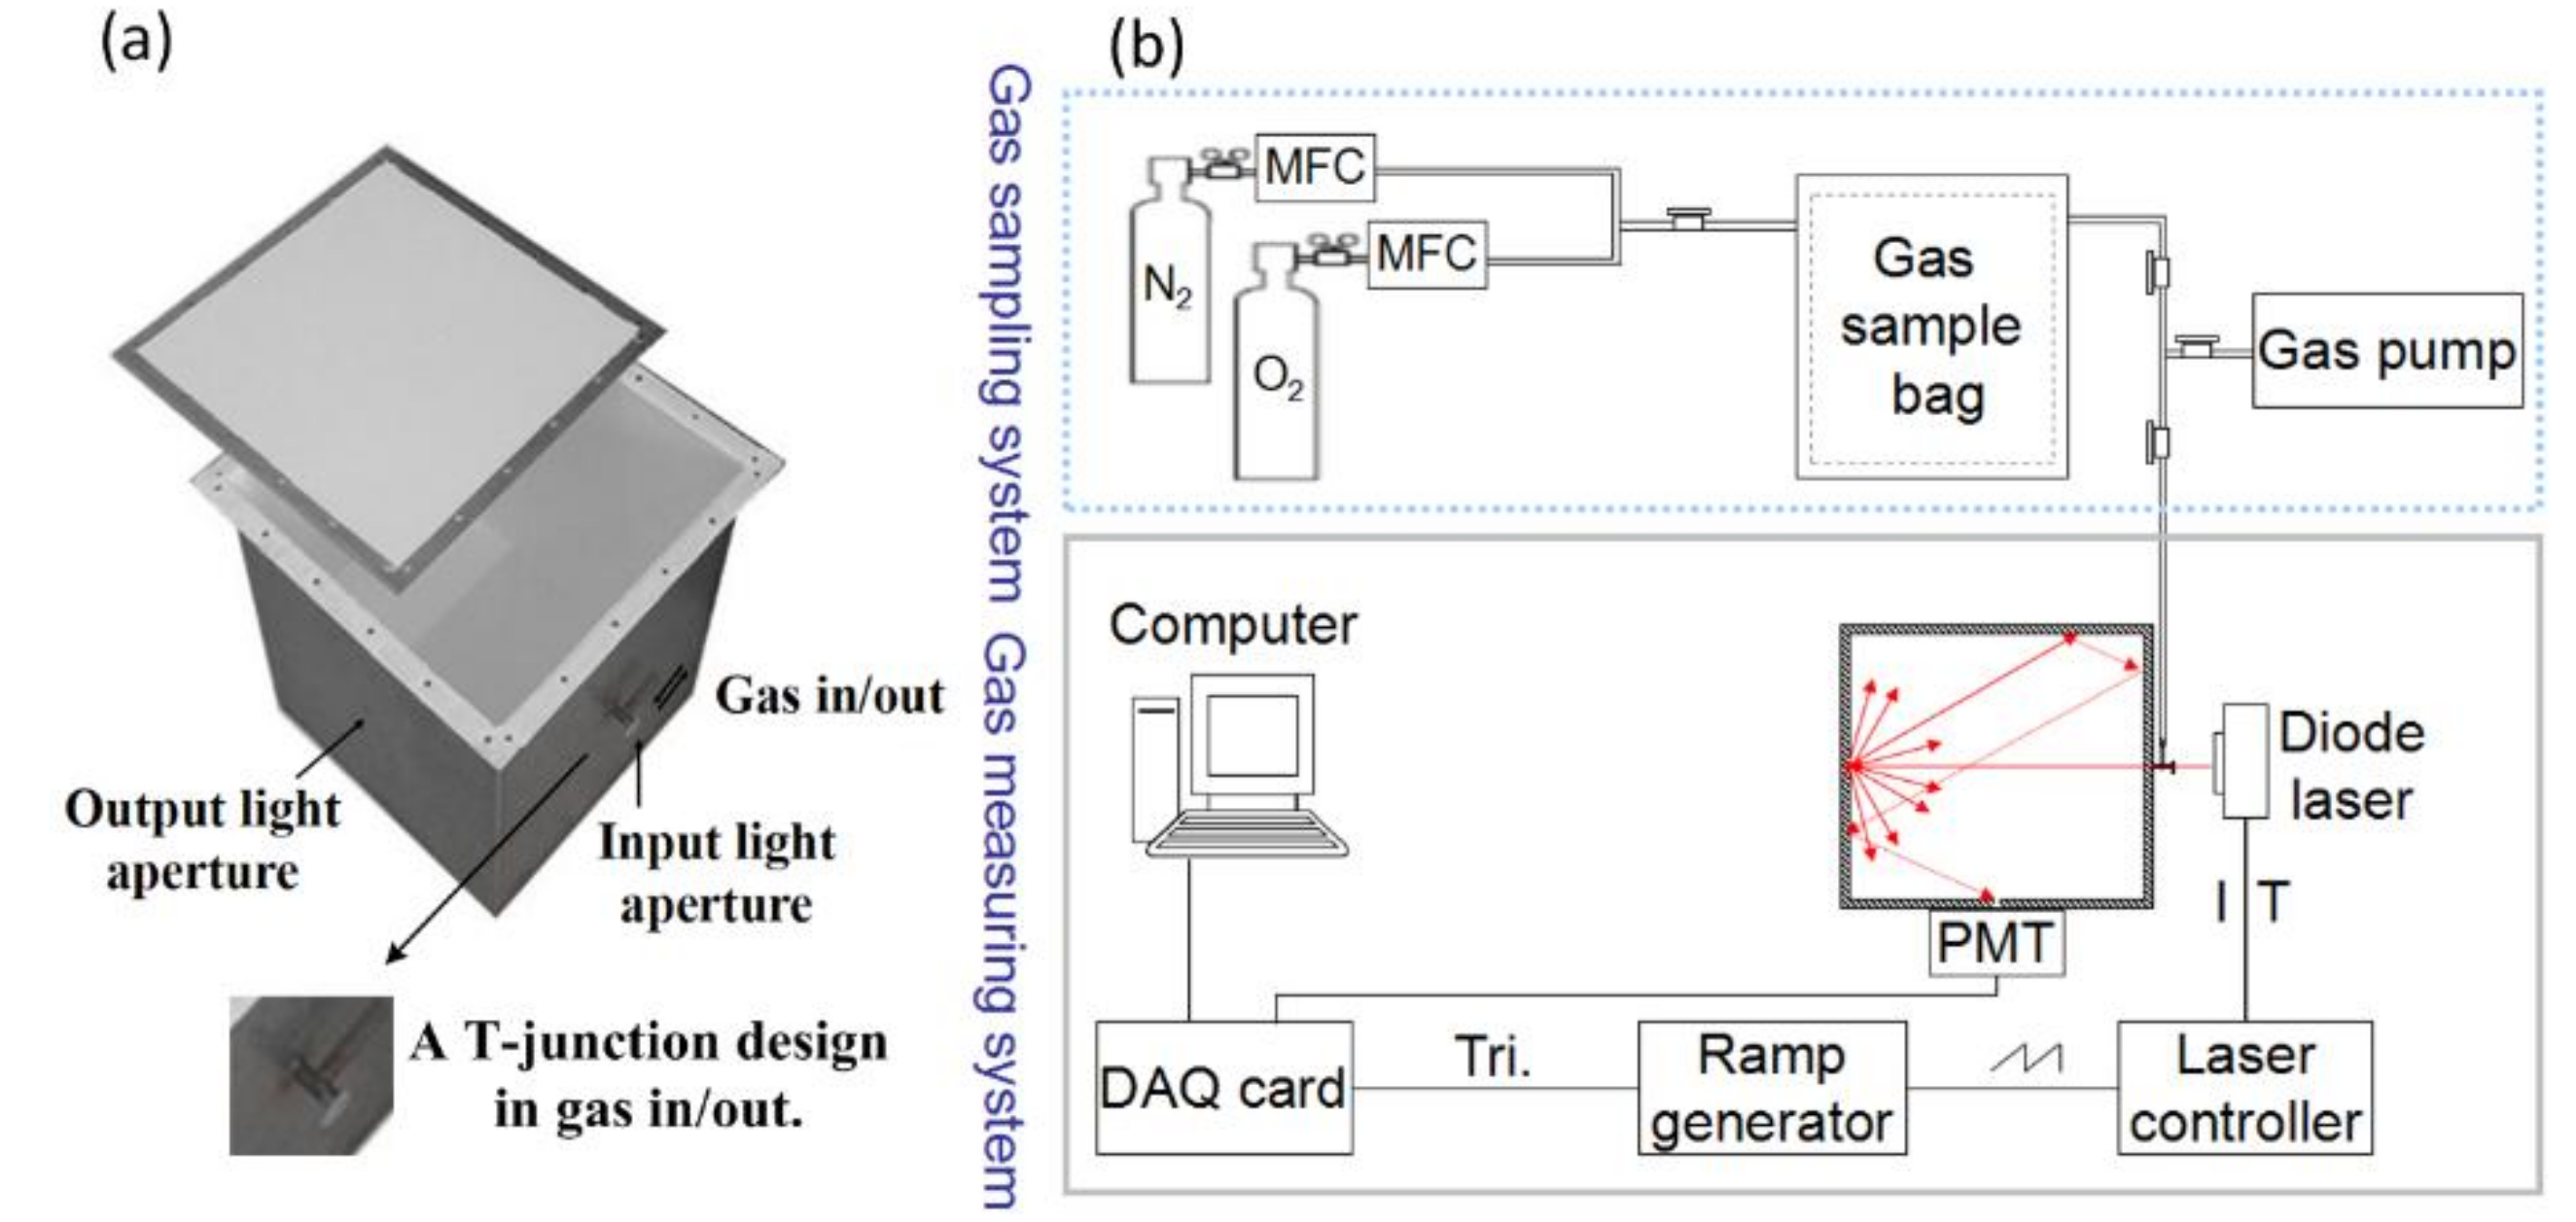
An experiment was designed and implemented to investigate the weak absorption condition of a diffuse integrating cavity. Oxygen was chosen as the sample gas due to its non-toxicity and easy accessibility. To achieve enough absorption for observing the non-linearity, the absorbance of oxygen was estimated using the HITRAN-2016 database [22]. A 35 × 35 × 35 cm diffuse integrating cavity was fabricated for this experiment. The diameters of the input and output light apertures were both 2 mm. The inner surface of the cavity was coated with a 0.4 mm thickness of Avian-D paint (Avian Technologies LLC, New London, NH, USA) and the painted surface was functioned as an ideal Lambertian diffuse scatter. The reflectivity of the coating was 98.3–98.4% at 750–800 nm, according to the supplier [23]. To reduce the port fraction of the cavity, the input light aperture and the gas inlet/outlet holes were combined with a T-junction. The light apertures were glued with a wedge-shaped glass lens to eliminate interference effects. The structure of a cubic integrating cavity is shown in Figure 2a, the in/out light aperture is labeled and an enlarged view of the T-junction is shown. The cavity could be sealed after screwing and gluing the head cover.
The experimental setup, including a gas-sampling system and a gas-measuring system, is shown in Figure 2b. Different oxygen concentrations were achieved by mixing different proportions of oxygen and nitrogen with mass flow controllers (MFC D07-19C, Sevenstar, Beijing, China). Based on TDLAS, a vertical-cavity surface-emitting tunable diode laser (Laser Components: Single Mode VCSEL 763 nm TO46), with a free running output power of 0.3 mW, was used as the light source. The laser temperature was controlled at 22.47 °C (Temperature Controller: TED 200C, Thorlabs, Newton, MA, USA), and the laser injection current was 1.29 mA (VCSEL Laser Diode Controller: LDC 200, Thorlabs, Newton, MA, USA). The injection current was modulated using a sawtooth wave (10 Hz, 200 mV), corresponding to a current varying from 1.16 to 1.40 mA. The output light from the integrating cavity was detected with a photomultiplier tube (PMTH-S1-1P28, Hamamatsu, Japan). Data were recorded using a data acquisition card (DAQ card: National Instrument Co., NI PCI-6133, Austin, TX, USA). The sawtooth wave was simultaneously put into the DAQ card as the trigger signal. The ambient temperature was controlled at 25 °C for the experiments. The center frequency of the laser was used to scan over the oxygen-absorption P9 line in the A-band at 763.84 nm by comparing the measured laser center wavelength with the calculated oxygen absorption line based on the HITRAN data. Each oxygen concentration was measured 15 times to obtain the detection error. Each signal was averaged 500 times per minute.
4. Results and Discussion
Figure 3 demonstrates the signal of 70% oxygen concentration in the 35 × 35 × 35 cm diffuse integrating cavity. The red curve in Figure 3a denotes the detected signal, Фout. The black baseline is the incident light radiation, Ф0, which was obtained by linear fitting based on the data points besides the absorption signal in the red curve. Here, the data points in the range of 250–350 and 700–800 in Figure 3a are used to linearly fit the baseline. Thus, the absorbance can be calculated as shown in Figure 3b.
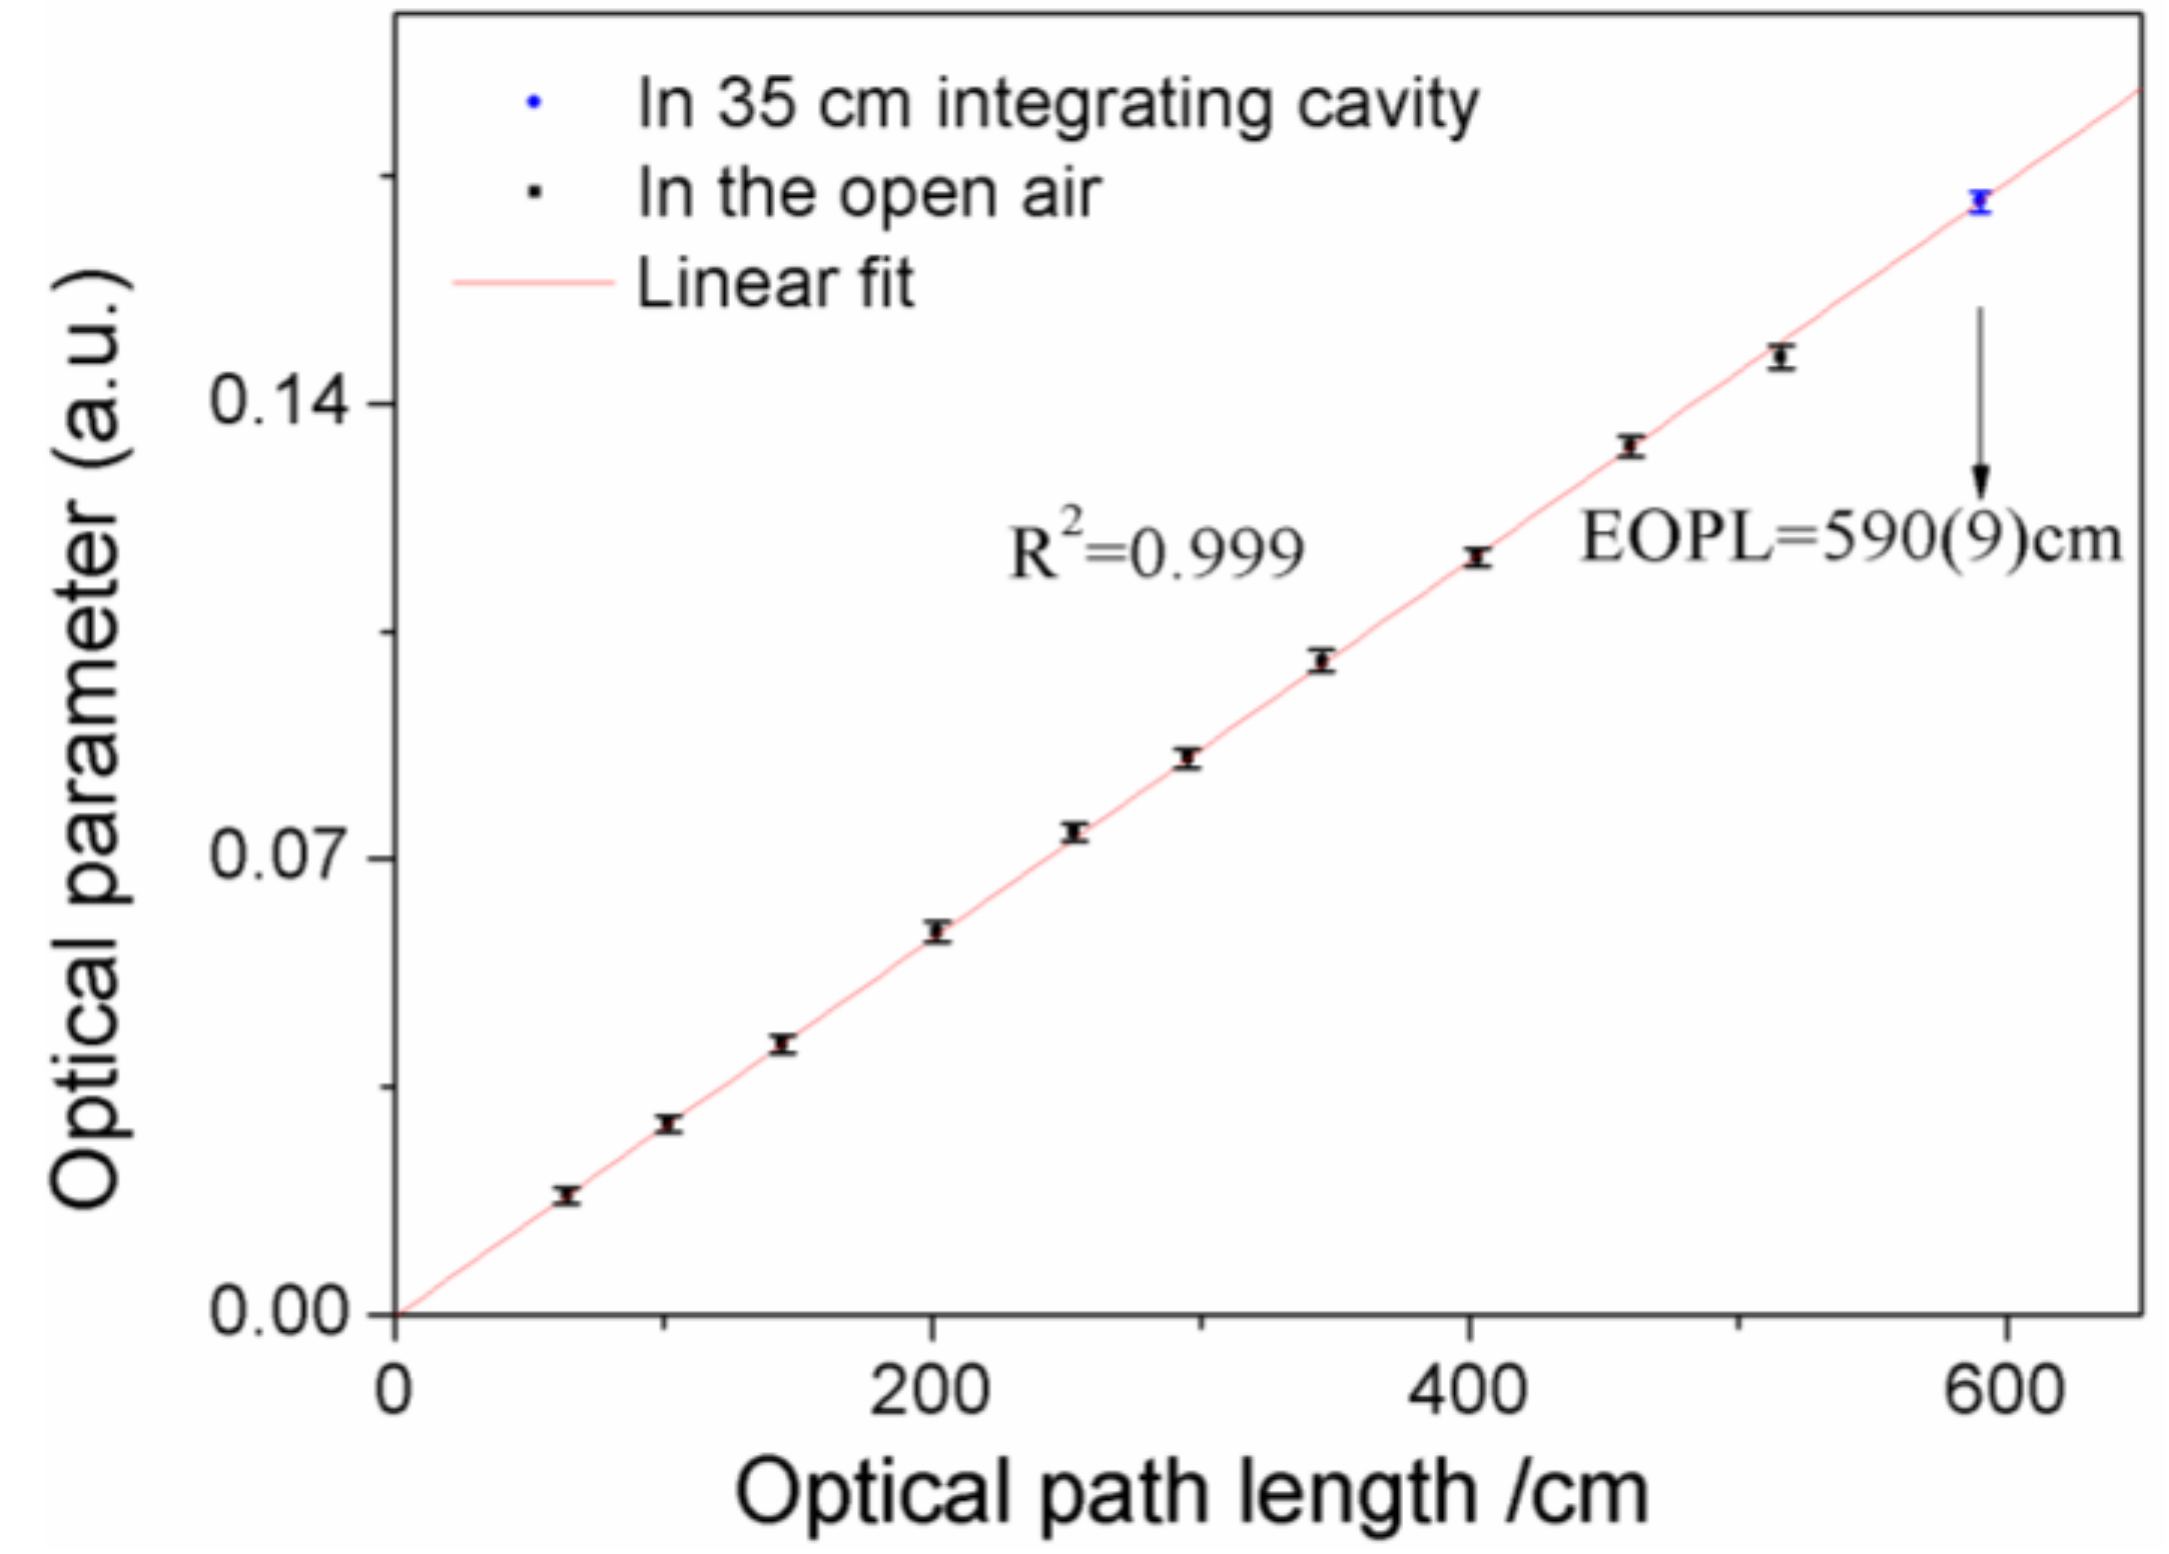
Here, the peak value of the absorbance was defined as the optical parameter (OP), i.e., the maximum value of ln(Ф0/Фout). According to Equation (14), the OP is proportional to the optical path length, once the oxygen concentration is constant. Thus, because the oxygen concentration is stable in air, the EOPL of the diffuse cavity was calibrated by comparing the oxygen absorption signal in the cavity and in the air [14,15,16]. Based on this method, each optical path length was measured 15 times, and the error bars are shown in Figure 4. The EOPL of the 35 × 35 × 35 cm diffuse integrating cavity was 590 ± 9 cm, i.e., the average value was 590 cm and the detection error was 9 cm. The detection limit of this system was ~0.6% for oxygen measurement. Detailed continuous detection results and Allen Variance are shown in Appendix B.
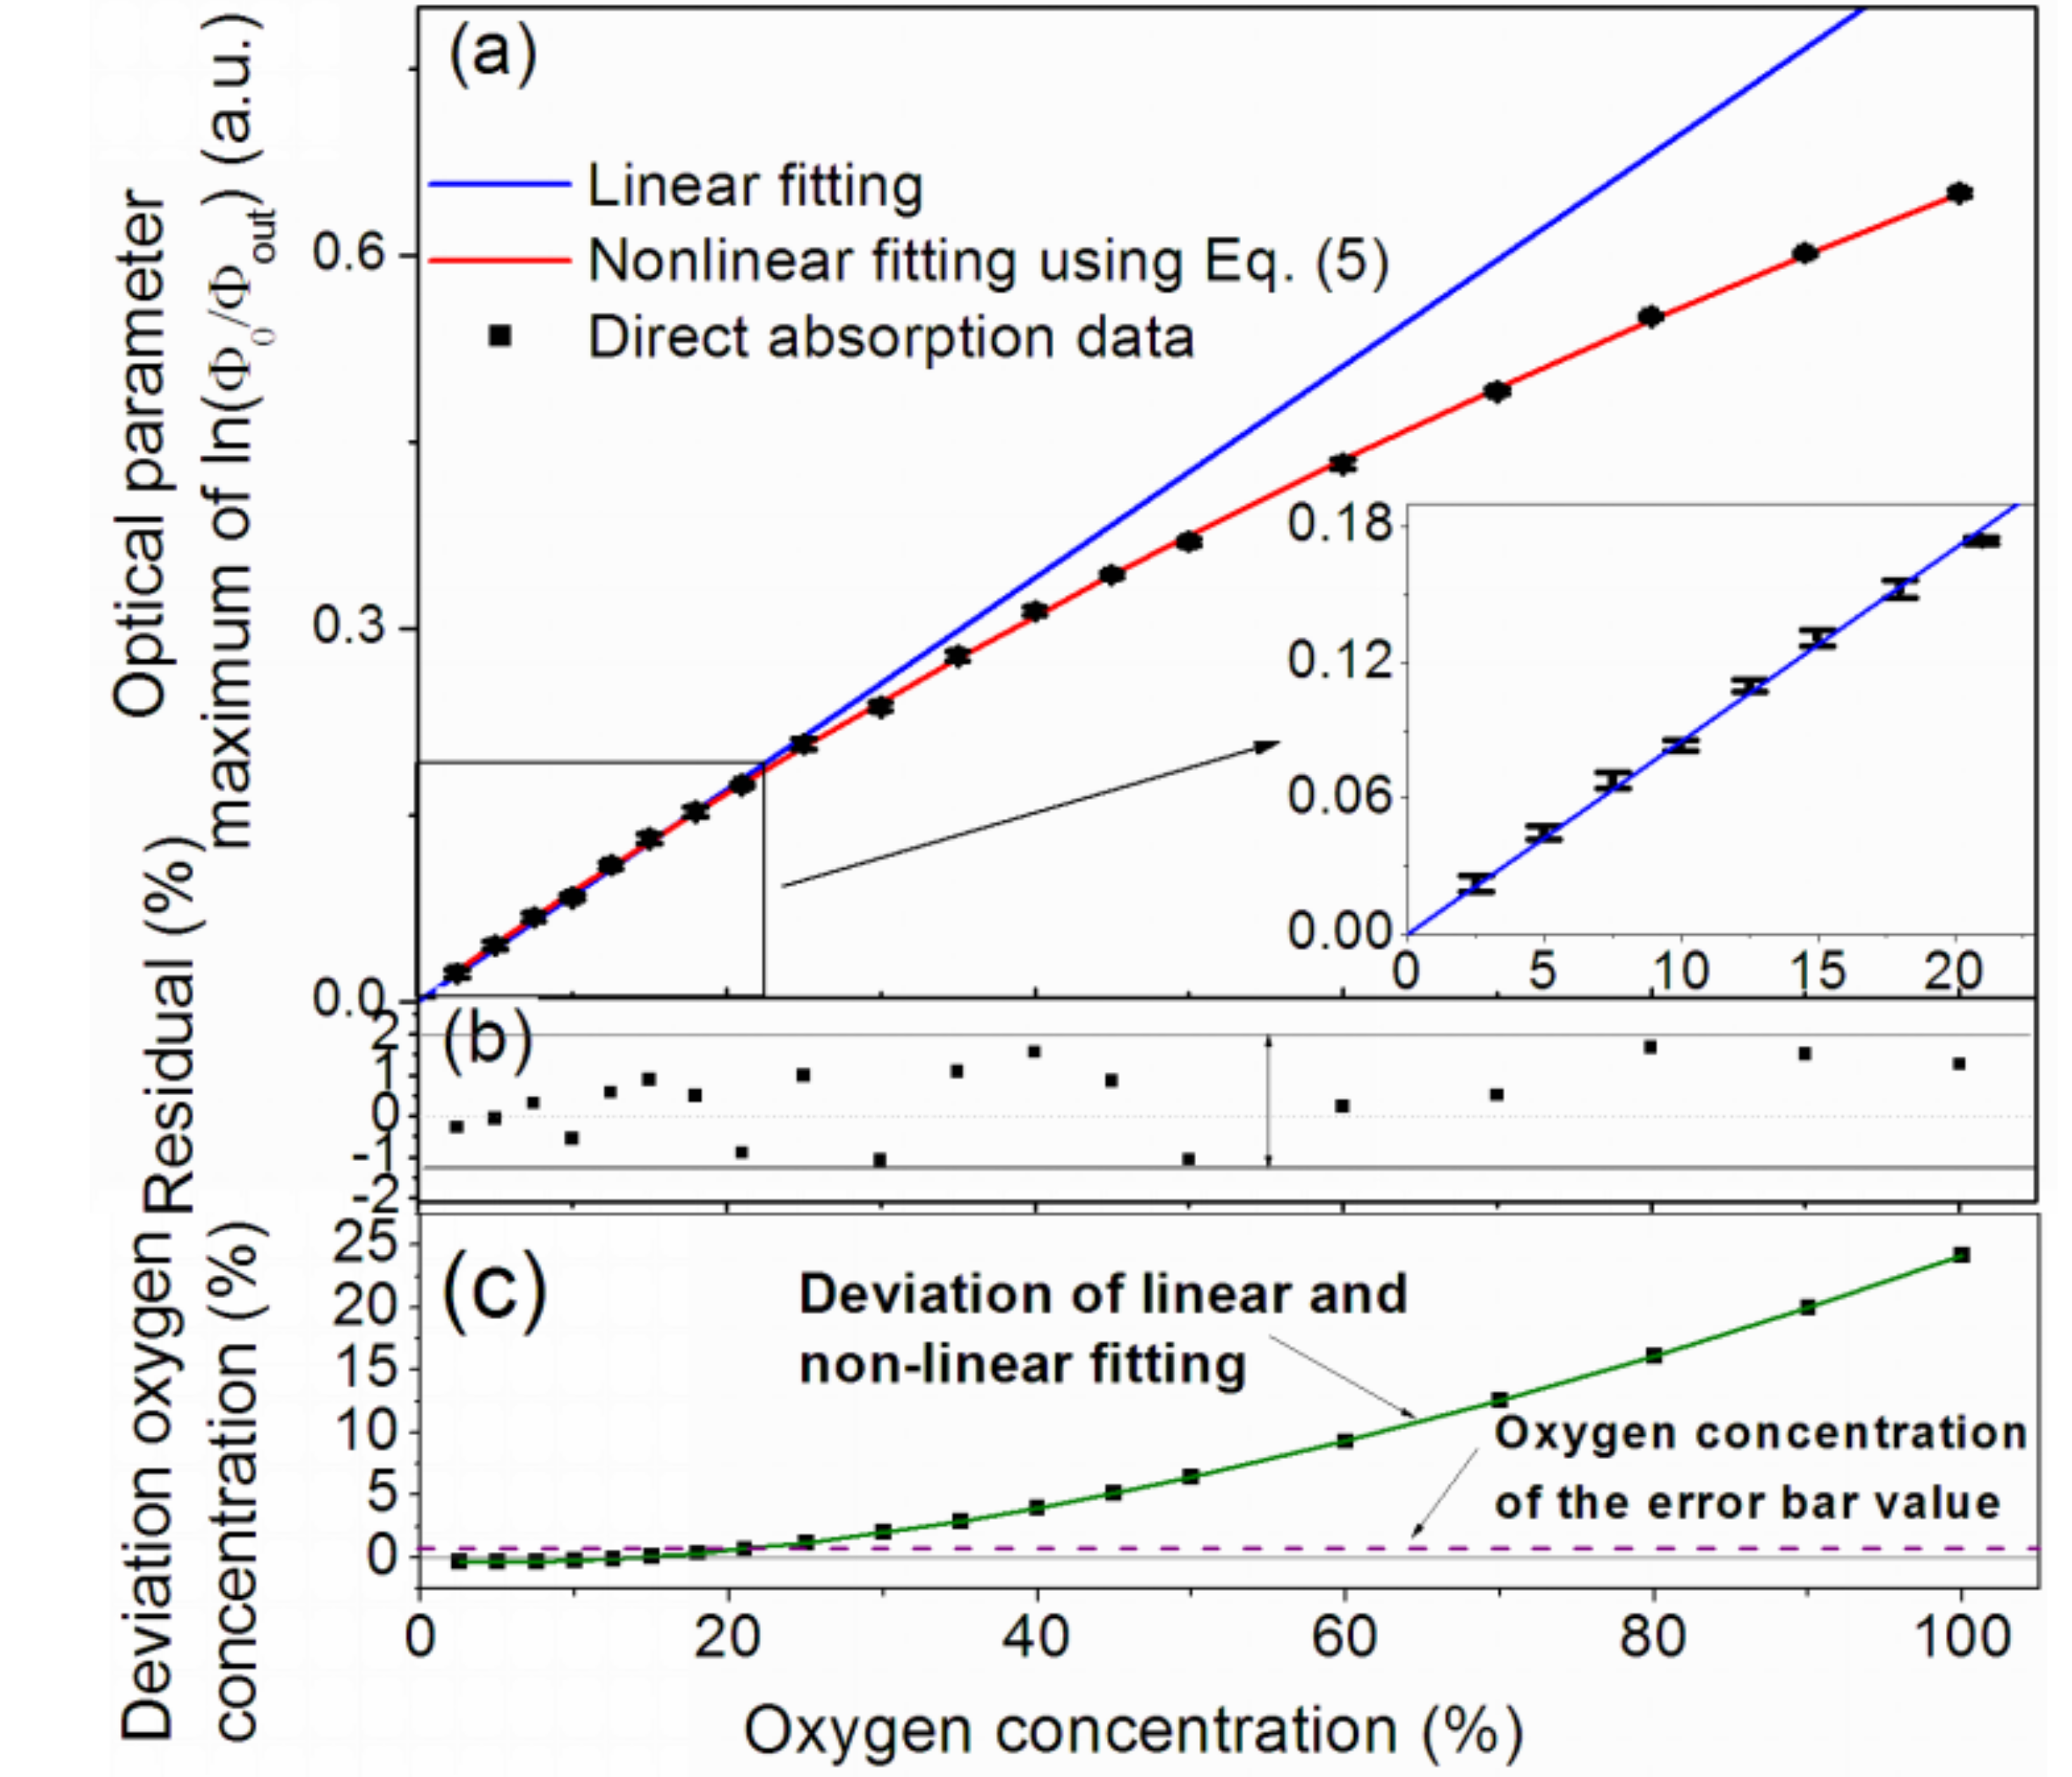
Then, different oxygen concentrations were measured with the cubic diffuse cavity. The relationship between the OP and oxygen concentration is shown in Figure 5a.
The black points show the OP values calculated using the detected spectra. It was found that the OP values depended linearly on the concentrations in the low concentration range and were non-linear when the concentration was relatively high. The blue line shows a linear fitting result using the OP data in the 0–18% oxygen concentration range. Obviously, the data gradually diverge from the blue line with an increasing oxygen concentration. The non-linear fitting result (the red curve) was obtained for all absorption data using Equation (5) with the fitted L0 = 39 ± 5 cm, ρ = 0.98 ± 1, Lave = 22 ± 2 cm, and f = 0.004 ± 1. As shown in Figure 5b, the residual error between the non-linear fitting result and the experimental data was lower than 2%. Thus, the Budget error of the gas sampling system was lower than 2%, including errors of gas flow-rate mixing and gas cylinders. The error of the detection system is analyzed in Appendix B. It indicates that the theoretical predictions by the beam reflection analysis agreed with the experiments. In fact, the theoretical value of L0 and Lave were 35 and 23.3 cm respectively for this cavity [21,24]. The fitting results agree with the theoretical values within the measured error ranges. The fitting reflectivity of the inner coating was slightly lower than the value provided by the supplier, which was caused by imperfections in the coating (pollution during drying and a humidity difference).
To determine the non-linear transition point, the deviation between the linear (blue curve) and nonlinear (red curve) fitting results was calculated and is shown as the green curve in Figure 5c. The deviation increased with increasing oxygen concentration. We considered that the deviation was resolved when it was larger than the system detection sensitivity. As the signal of each oxygen concentration was measured 15 times, the detection error was obtained as the error bars shown in Figure 5a. The average delta absorbance was 0.0045 for different oxygen concentrations. According to the linear relationship, this detection error denoted a detection sensitivity of 0.6%, which is shown as the dotted line in Figure 5c. Obviously, the deviation was smaller than the error bar value when the oxygen concentration was lower than 21%. The deviation was larger than the error bar value and could be resolved when the oxygen concentration was higher than 21%. Hence, we considered that the transition point was an oxygen concentration of 21%. The absorbance value at the transition point was 0.17. Thus, a linear relationship between the absorbance and gas concentration could be ensured when the absorbance was lower than 0.17 for this system. This result was universal for different gases in such a system. For other detection systems, the transition point is related to the detection error of the system. We have provided an experimental method to determine the transition point of linear and non-linear measurements for a diffused integrating cavity.
5. Conclusions
In summary, this study investigated the relationship between absorbance and gas concentration when a diffuse integrating cavity was used as a gas cell. Theoretically, an approximation for weak absorption was proposed. When the weak absorption condition was not satisfied, a non-linear relation was be observed. Experimentally, different oxygen concentrations were measured by detecting the P9 absorption line at 763.84 nm using a cubic diffuse integrating cavity. A linear relationship between the measured absorbance and the gas concentration was observed at low concentrations. The non-linear transition point was confirmed as an oxygen concentration of 21%, based on experimental results. The absorbance value of the transition point was 0.17. This transition point value was only applicable to this system for oxygen detection. Thus, an approach to determine the applicable condition of a diffuse cavity was proposed. For a different system, it was related to the detection sensitivity and was measured using such method. This work studied the theoretical reason for the non-linear phenomenon and provided an experimental method to determine the transition point when using a diffuse integrating cavity as a gas cell.
Author Contributions
X.Z. performed experiments, analyzed data and wrote the paper; J.Y. and L.W. revised the paper; Z.Z. designed experiments and revised the paper.
Funding
This research was funded by the National Key Research and Development Program of China (2016YFF0102803).
Conflicts of Interest
The authors declare no conflicts of interest.
Appendix A. Detailed Derivation
The total light radiation, Фout, received by the detector is proportional to the sum of the output radiation:
Here, ρ(1 − f) exp(−αLave) is less than 1 and ρn(1−f)n exp(−nαLave)~0. Thus, we ignored it.
Then, αLave and αL0 are usually less than 1 in gas detection (Equation (6) in the main text). The following approximation was obtained mathematically as Equation (A2) (same as Equation (8) in the main text):
Taking Equation (A2) into (A1), the expression can be written as follow:
As αLave is less than 1, α2Lave2(1 − f)2 was ignored. Then Equation (A3) can be converted into Equation (A4).
Then, we defined a condition. If Equation (A5) (same as Equation (7) in the main text) is satisfied,
Thus,
Hence, Фout can be expressed as follows, which is same as the Equation (10) in the main text.
Thus, the output radiation can be expressed in the same form as the Beer-Lambert law.
Appendix B. Detection Error of the System
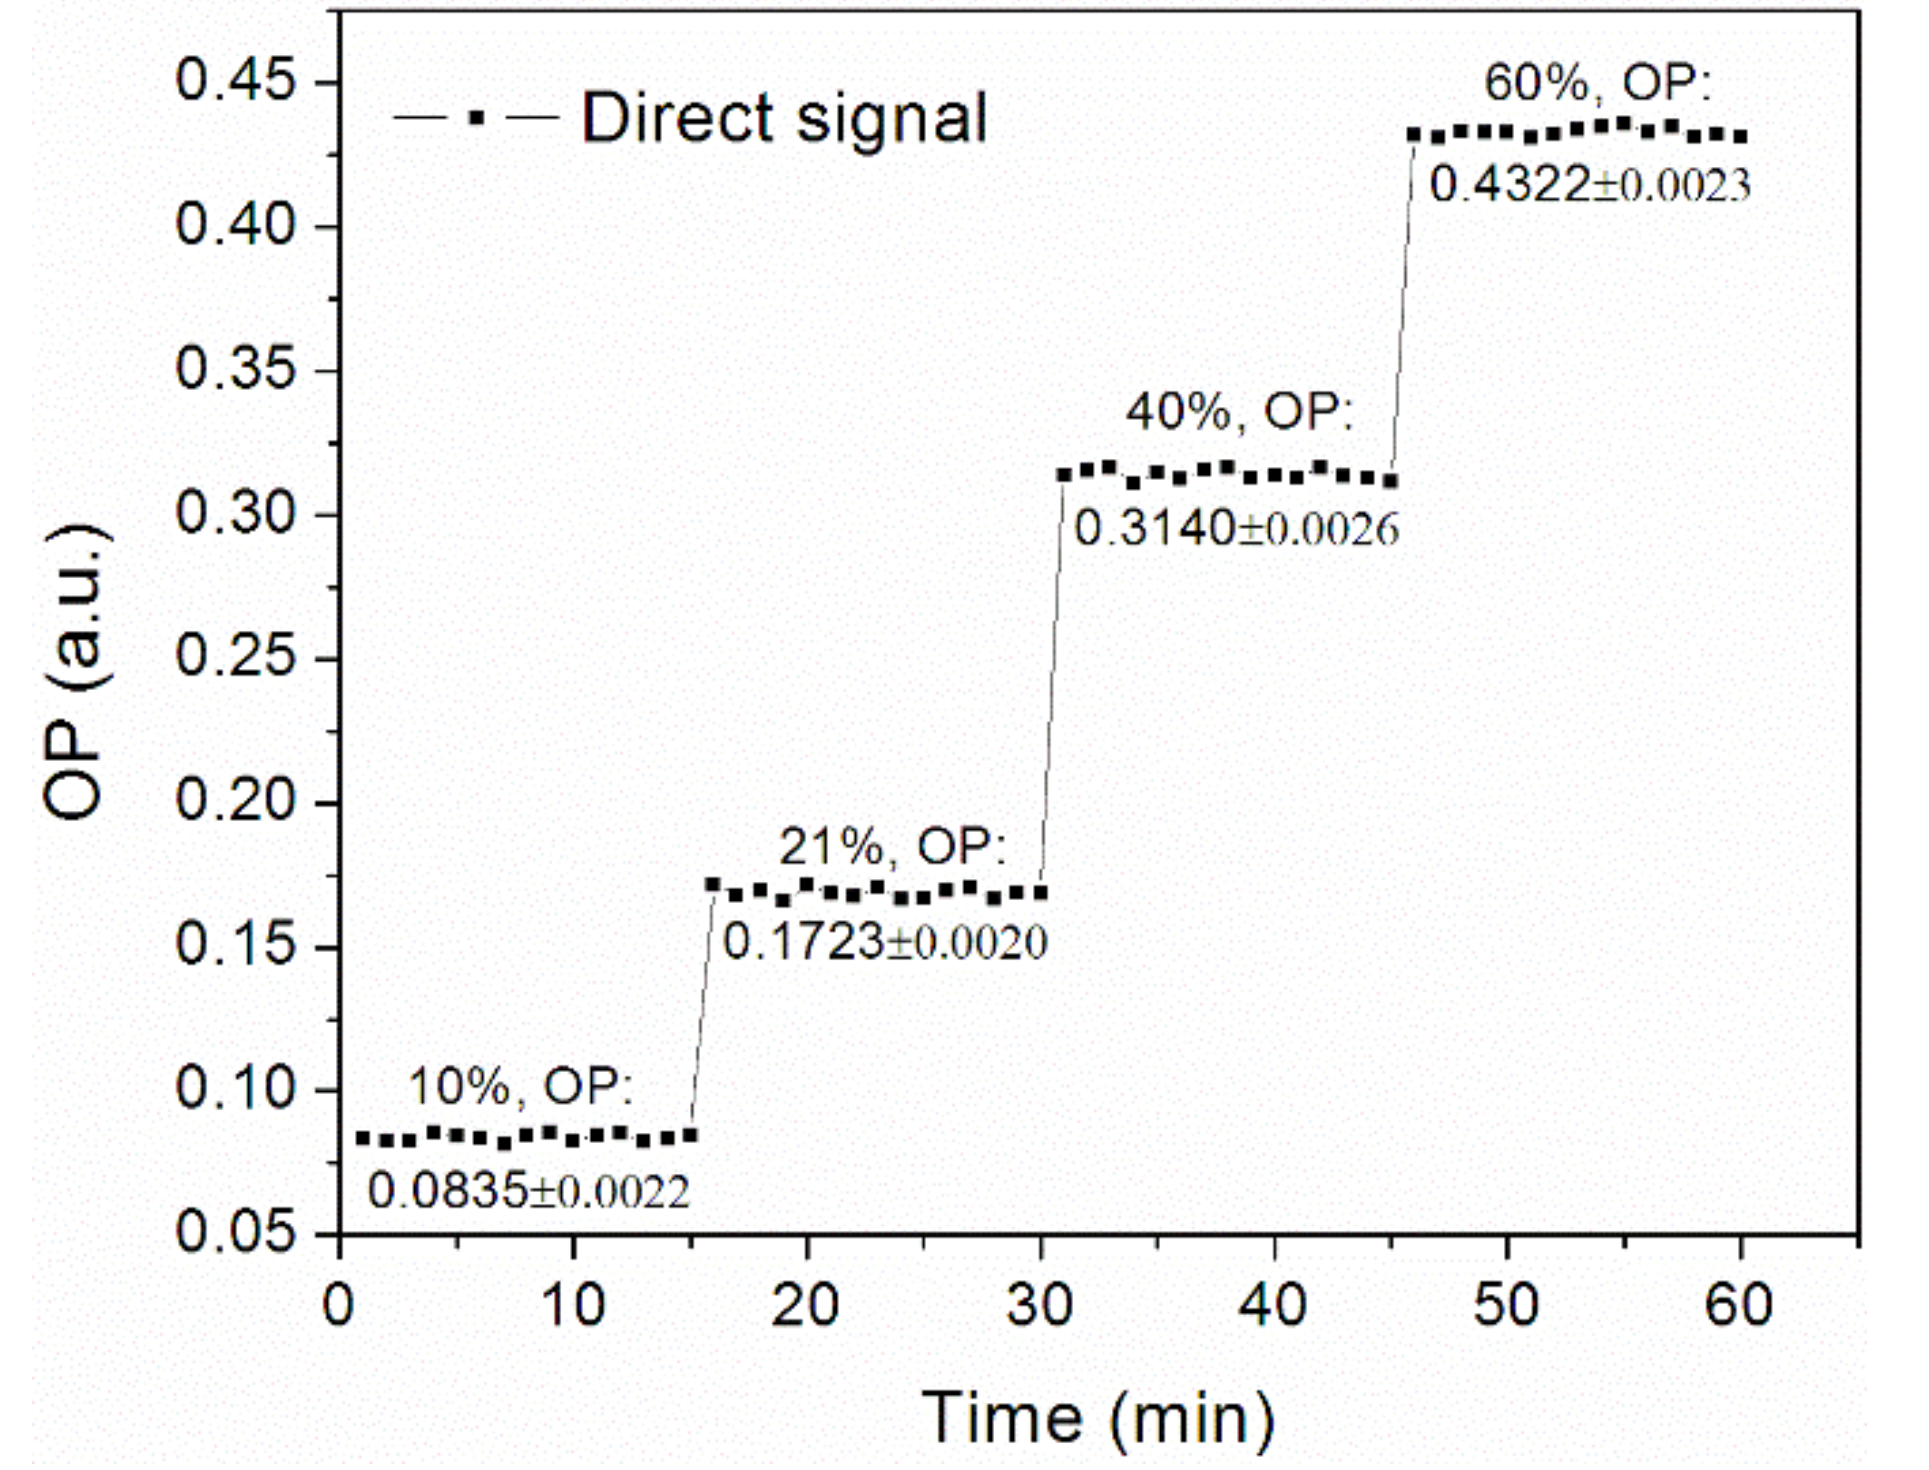
For each oxygen concentration, the signal was detected 15 times. Figure A1 shows the continuous detection results of the 10, 21, 40 and 60 oxygen concentrations. The detected OP fluctuation ranges for different oxygen concentrations are shown in Table A1, which are plotted as the error bars in Figure 5a. The Allen Variances of the OP for each concentration were calculated and are shown in Table A1. Thus, the detection limit of oxygen was about 0.6% for this system.
Figure A1.
Fluctuations of the measured results under different oxygen concentrations.


Table A1.
Fluctuation ranges of the detected OP and Allen Variances for different oxygen concentrations.
Table A1.
Fluctuation ranges of the detected OP and Allen Variances for different oxygen concentrations.
| Oxygen Concentration (%) | Fluctuated Ranges of OP (ΔOP) | Allen Variances of OP | Detection Limit (ΔC %) |
|---|---|---|---|
| 5 | 0.0045 | 1.06 × 10⁻⁵ | 0.53 |
| 10 | 0.0044 | 1.10 × 10⁻⁵ | 0.52 |
| 15 | 0.0056 | 4.23 × 10⁻⁵ | 0.65 |
| 21 | 0.0040 | 2.84 × 10⁻⁵ | 0.47 |
| 25 | 0.0059 | 5.90 × 10⁻⁵ | 0.69 |
| 30 | 0.0054 | 4.3 × 10⁻⁵ | 0.63 |
| 40 | 0.0052 | 2.51 × 10⁻⁵ | 0.61 |
| 60 | 0.0046 | 1.09 × 10⁻⁵ | 0.54 |
| 80 | 0.0034 | 3.2 × 10⁻⁵ | 0.40 |
| 100 | 0.0032 | 3.7 × 10⁻⁵ | 0.38 |
References
- Hodgkinson, J.; Tatam, R.P. Optical gas sensing: A review. Meas. Sci. Technol. 2013, 24, 012004. [Google Scholar] [CrossRef]
- Du, Z.H.; Gao, H.; Cao, X.H. Direct high-precision measurement of the effective optical path length of multi-pass cell with optical frequency domain reflectometer. Opt. Express 2016, 24, 417–426. [Google Scholar] [CrossRef] [PubMed]
- Krzempek, K.; Hudzikowski, A.; Gluszek, A.; Dudzik, G.; Abramski, K.; Wysocki, G.; Nikodem, M. Multi-pass cell-assisted photoacoustic/photothermal spectroscopy of gases using quantum cascade laser excitation and heterodyne interferometric signal detection. Appl. Phys. B 2018, 124, 74–80. [Google Scholar] [CrossRef]
- Cone, M.T.; Mason, J.D.; Figueroa, E.; Hokr, B.H.; Bixler, J.N.; Castellanos, C.C.; Noojin, G.D.; Wigle, J.C.; Rockwell, B.A.; Yakovlev, V.V.; et al. Measuring the absorption coefficient of biological materials using integrating cavity ring-down spectroscopy. Optica 2015, 2, 162–168. [Google Scholar] [CrossRef]
- Svensson, T.; Adolfsson, E.; Lewander, M.; Xu, C.T.; Svanberg, S. Disordered, Strongly Scattering Porous Materials as Miniature Multipass Gas Cells. Phys. Rev. Lett. 2017, 107, 143901. [Google Scholar] [CrossRef] [PubMed]
- Davis, M.; Hodgkinson, J.; Francis, D.; Tatam, R.P. Sensitive detection of methane at 3.3 μm using an integrating sphere and interband cascade laser. In Proceedings of the SPIE, Optical Sensing and Detection IV, Brussels, Belgium, 29 April 2016; Volume 9899, p. 98990M. [Google Scholar] [CrossRef]
- Ducanchez, A.; Bendoula, R.; Roger, J.M. An investigation into the effects of pressure on gas detection using an integrating sphere as multipass gas absorption cell: Analysis and discussion. J. Near Infrared Spec. 2016, 24, 405–412. [Google Scholar] [CrossRef]
- Lassen, M.; Balslev-Clausen, D.; Brusch, A.; Petersen, J.C. A versatile integrating sphere based photoacoustic sensor for trace gas monitoring. Opt. Express 2014, 22, 11660–11669. [Google Scholar] [CrossRef] [PubMed]
- Zhou, X.; Yu, J.; Wang, L.; Gao, Q.; Zhang, Z.G. Sensitive detection of oxygen using a diffused integrating cavity as a gas absorption cell. Sens. Actuators B 2017, 241, 1076–1081. [Google Scholar] [CrossRef]
- Ogawara, Y.; Bruneau, A.; Kimura, T. Determination of ppb-level CO, CO2, CH4, and H2O in high-purity gases using matrix isolation FT-IR with an integrating sphere. Anal. Chem. 1994, 66, 4354–4358. [Google Scholar] [CrossRef]
- Tranchart, S.; Bachir, I.H.; Destonbes, J.L. Sensitive trace gas detection with near-infrared laser diodes and an integrating sphere. Appl. Opt. 1996, 35, 7070–7074. [Google Scholar] [CrossRef] [PubMed]
- Kirk, J.T.O. Modeling the performance of an integrating-cavity absorption meter: Theory and calculations for a spherical cavity. Appl. Opt. 1995, 34, 4397–4408. [Google Scholar] [CrossRef] [PubMed]
- Labsphere Inc. A Guide to Integrating Sphere Theory and Applications. 1994. Available online: http://www.labsphere.com (accessed on 2 August 2018).
- Yu, J.; Zheng, F.; Gao, Q.; Li, Y.J.; Zhang, Y.G.; Zhang, Z.G.; Wu, S.H. Effective optical path length investigation for cubic diffuse cavity as gas absorption cell. Appl. Phys. B 2014, 116, 135–140. [Google Scholar] [CrossRef]
- Bergin, S.; Hodgkinson, J.; Francis, D.; Tatam, R.P. Integrating cavity based gas cells: A multibeam compensation scheme for pathlength variation. Opt. Express 2016, 24, 13647–13664. [Google Scholar] [CrossRef] [PubMed]
- Gao, Q.; Zhang, Y.G.; Yu, J.; Zhang, Z.G.; Wu, S.H.; Guo, W. Integrating sphere effective optical path length calibration by gas absorption spectroscopy. Appl. Phys. B 2014, 114, 341–346. [Google Scholar] [CrossRef]
- Hodgkinson, J.; Masiyano, D.; Tatam, R.P. Using integrating spheres as absorption cells: Path-length distribution and application of Beer’s law. Appl. Opt. 2009, 48, 5748–5758. [Google Scholar] [CrossRef] [PubMed]
- Hodgkinson, J.; Masiyano, D.; Tatam, R.P. Using integrating spheres with wavelength modulation spectroscopy: Effect of pathlength distribution on 2nd harmonic signals. Appl. Phys. B 2013, 110, 223–231. [Google Scholar] [CrossRef] [Green Version]
- Hawe, E.; Chambers, P.; Fitzpatrick, C.; Lewis, E. CO2 monitoring and detection using an integrating sphere as a multipass absorption cell. Meas. Sci. Technol. 2007, 18, 3187–3194. [Google Scholar] [CrossRef]
- Hawe, E.; Fitzpatrick, C.; Chambers, P.; Dooly, G.; Lewis, E. Hazardous gas detection using an integrating sphere as a multipass gas absorption cell. Sens. Actuators A 2008, 141, 414–421. [Google Scholar] [CrossRef]
- Fry, E.S.; Musser, J.; Kattawar, G.W.; Zhai, P.W. Integrating cavities: Temporal response. Appl. Opt. 2006, 45, 9053–9065. [Google Scholar] [CrossRef] [PubMed]
- Gordon, I.E.; Rothman, L.S.; Hill, C.; Kochanov, R.V.; Tan, Y.; Bernath, P.F.; Birk, M.; Boudon, V.; Campargue, A.; Chance, K.V.; et al. The HITRAN 2016 molecular spectroscopic database. J. Quant. Spectrosc. Radiat. Transf. 2017, 203, 3–69. [Google Scholar] [CrossRef]
- Avian Technologies LLC. Available online: http://aviantechnologies.com/catalog/avian-d-white-reflectance-coating/ (accessed on 2 August 2018).
- Yu, J.; Zhang, Y.G.; Gao, Q.; Hu, G.; Zhang, Z.G.; Wu, S.H. Diffuse reflectivity measurement using cubic cavity. Opt. Lett. 2014, 39, 1941–1944. [Google Scholar] [CrossRef] [PubMed]
Figure 1.
Simplified model of the radiation transmission process in an arbitrary integrating cavity.
Figure 1.
Simplified model of the radiation transmission process in an arbitrary integrating cavity.
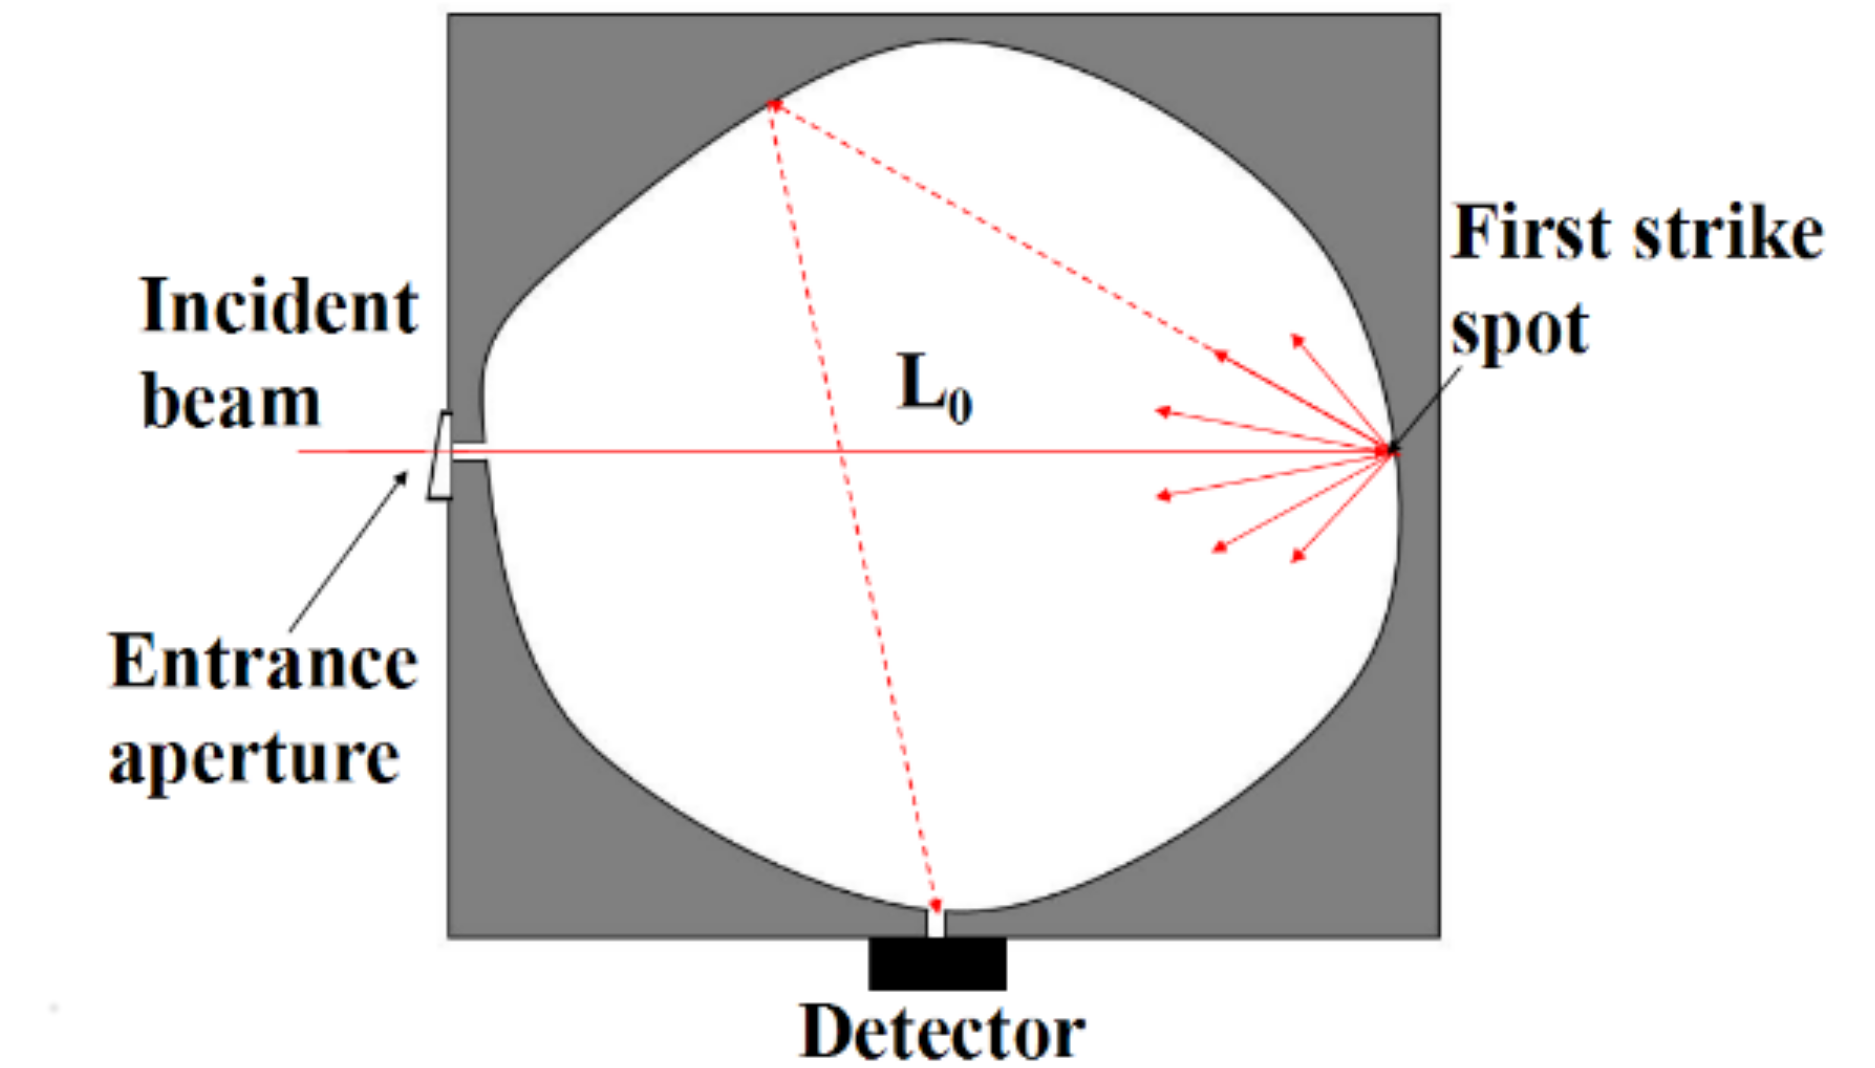
Figure 2.
(a) Structure of a cubic diffuse integrating cavity; (b) schematic of the gas-sampling system and TDLAS (tunable diode laser absorption spectroscopy) for measuring the absorption of oxygen with a cubic cavity as the gas cell.
Figure 2.
(a) Structure of a cubic diffuse integrating cavity; (b) schematic of the gas-sampling system and TDLAS (tunable diode laser absorption spectroscopy) for measuring the absorption of oxygen with a cubic cavity as the gas cell.

Figure 3.
(a) Direct scan PMT (photomultiplier tube) signal for 70% oxygen concentration in the 35 × 35 × 35 cm diffuse integrating cavity; (b) calculated result of the absorbance from the PMT signal.
Figure 3.
(a) Direct scan PMT (photomultiplier tube) signal for 70% oxygen concentration in the 35 × 35 × 35 cm diffuse integrating cavity; (b) calculated result of the absorbance from the PMT signal.
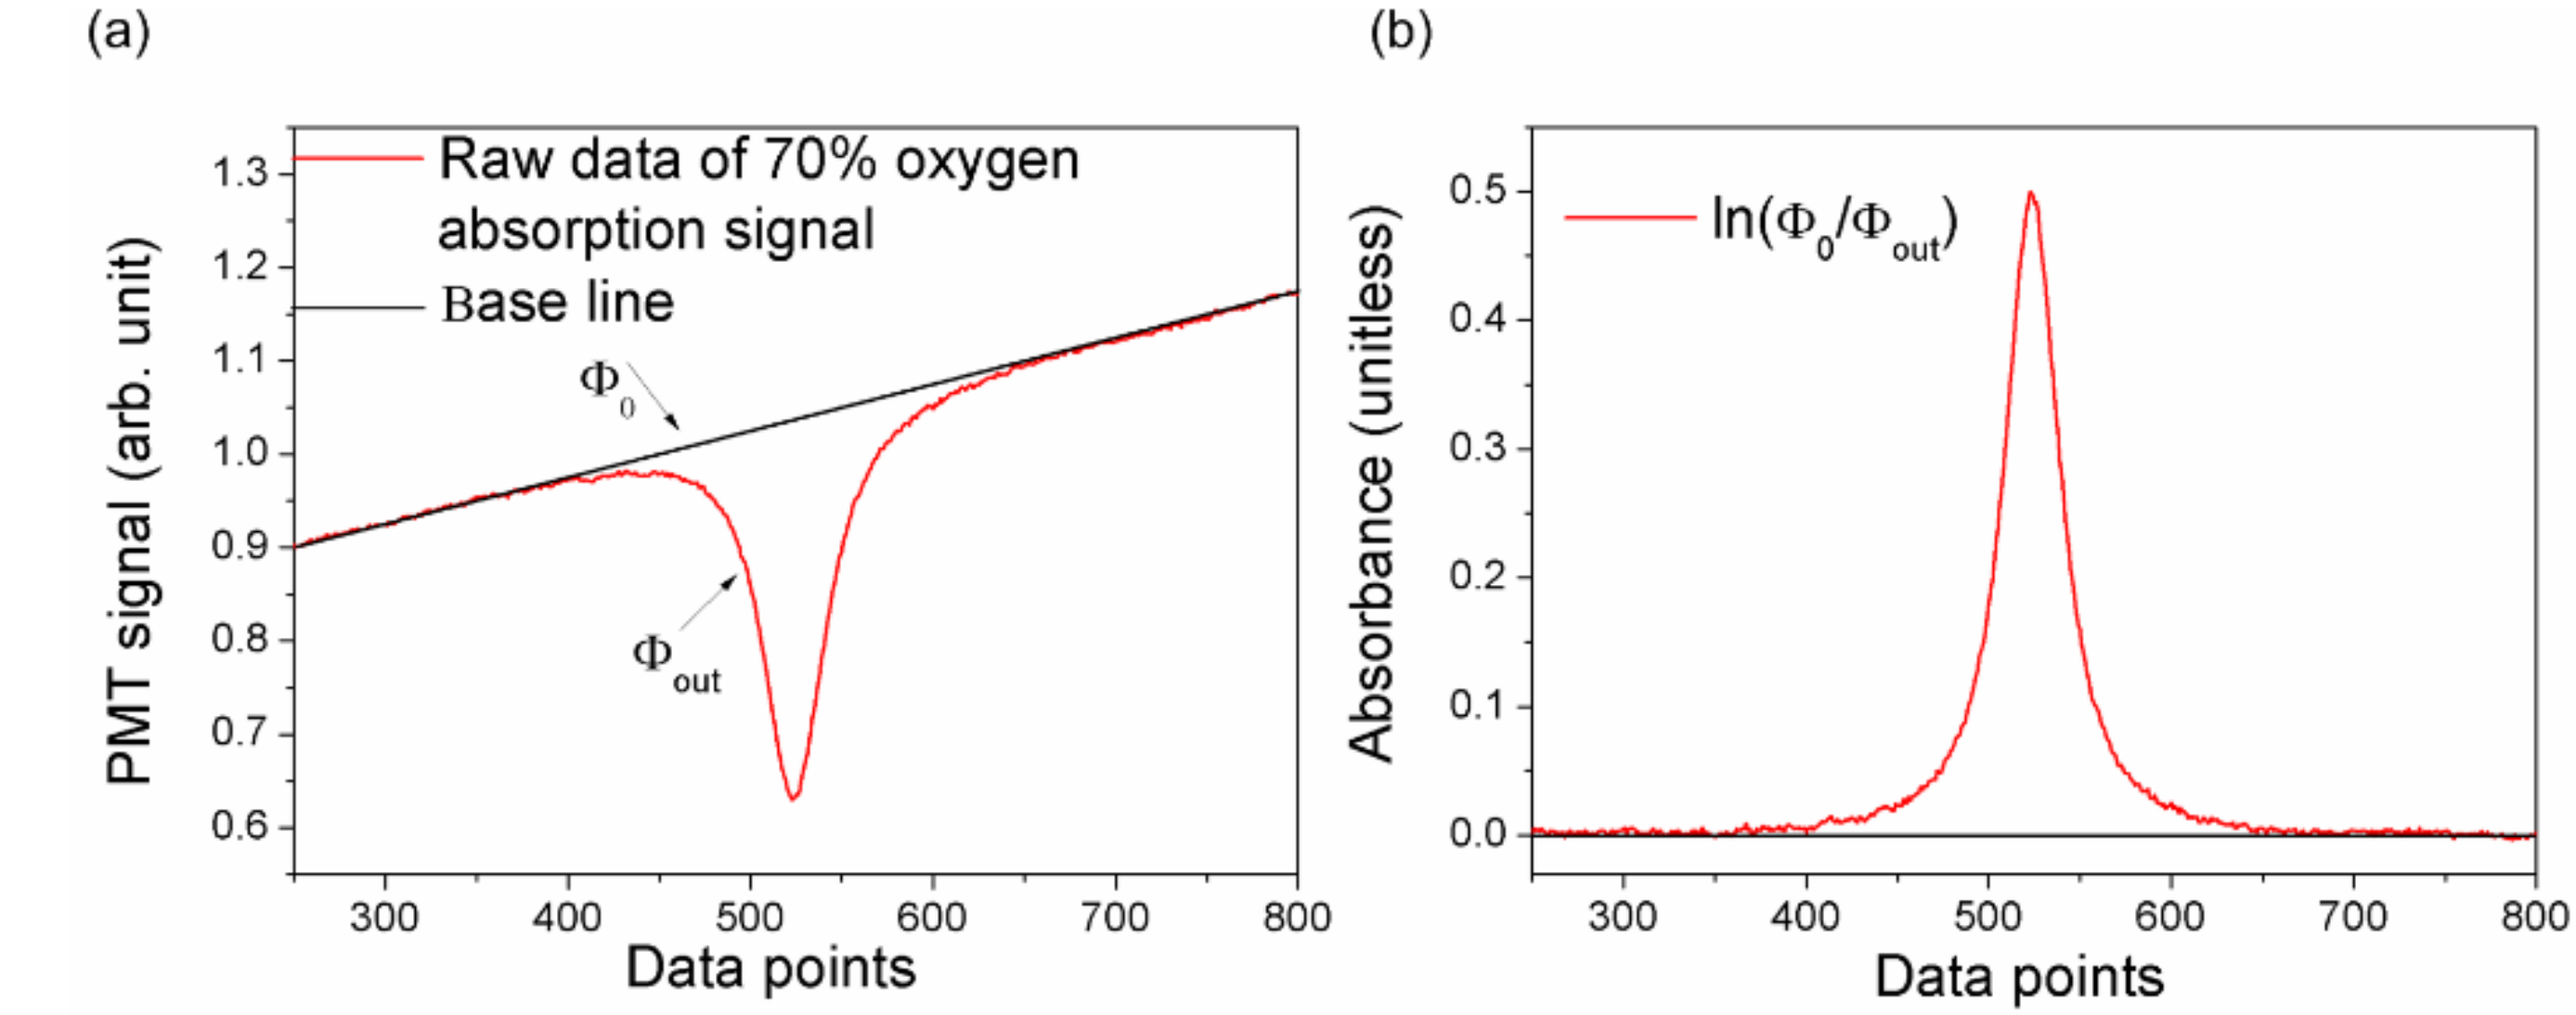
Figure 4.
The EOPL (effective optical path length) calibration curve for the cubic integrating cavity between the OP (optical parameter) and optical path lengths in the air.
Figure 4.
The EOPL (effective optical path length) calibration curve for the cubic integrating cavity between the OP (optical parameter) and optical path lengths in the air.

Figure 5.
(a) Relationship between the OP and oxygen concentration; the inset shows an enlarged view of the low concentration range. (b) Residual error between the experimental data and the non-linear fitting result. (c) Deviation between the linear and non-linear fitting results.
Figure 5.
(a) Relationship between the OP and oxygen concentration; the inset shows an enlarged view of the low concentration range. (b) Residual error between the experimental data and the non-linear fitting result. (c) Deviation between the linear and non-linear fitting results.

Table 1.
Output light radiation after each reflection from an arbitrary diffuse integrating cavity.
| Reflection Multiplier | Output Radiation from the Aperture |
|---|---|
| 1 | |
| 2 | |
| 3 | |
| … | … |
| n |
© 2018 by the authors. Licensee MDPI, Basel, Switzerland. This article is an open access article distributed under the terms and conditions of the Creative Commons Attribution (CC BY) license (http://creativecommons.org/licenses/by/4.0/).
Share and Cite
MDPI and ACS Style
Zhou, X.; Yu, J.; Wang, L.; Zhang, Z. Investigating the Relation between Absorption and Gas Concentration in Gas Detection Using a Diffuse Integrating Cavity. Appl. Sci. 2018, 8, 1630. https://doi.org/10.3390/app8091630
AMA Style
Zhou X, Yu J, Wang L, Zhang Z. Investigating the Relation between Absorption and Gas Concentration in Gas Detection Using a Diffuse Integrating Cavity. Applied Sciences. 2018; 8(9):1630. https://doi.org/10.3390/app8091630
Chicago/Turabian StyleZhou, Xue, Jia Yu, Lin Wang, and Zhiguo Zhang. 2018. "Investigating the Relation between Absorption and Gas Concentration in Gas Detection Using a Diffuse Integrating Cavity" Applied Sciences 8, no. 9: 1630. https://doi.org/10.3390/app8091630
Note that from the first issue of 2016, this journal uses article numbers instead of page numbers. See further details here.