Assessment of Protein-Rich Cheese Whey Waste Stream as a Nutrients Source for Low-Cost Mixed Microbial PHA Production †

 ,
,  ,
,
Abstract
:1. Introduction
2. Materials and Methods
2.1. Acidogenic Fermentation
2.2. MMC Enrichment in PHA-Accumulating Organisms
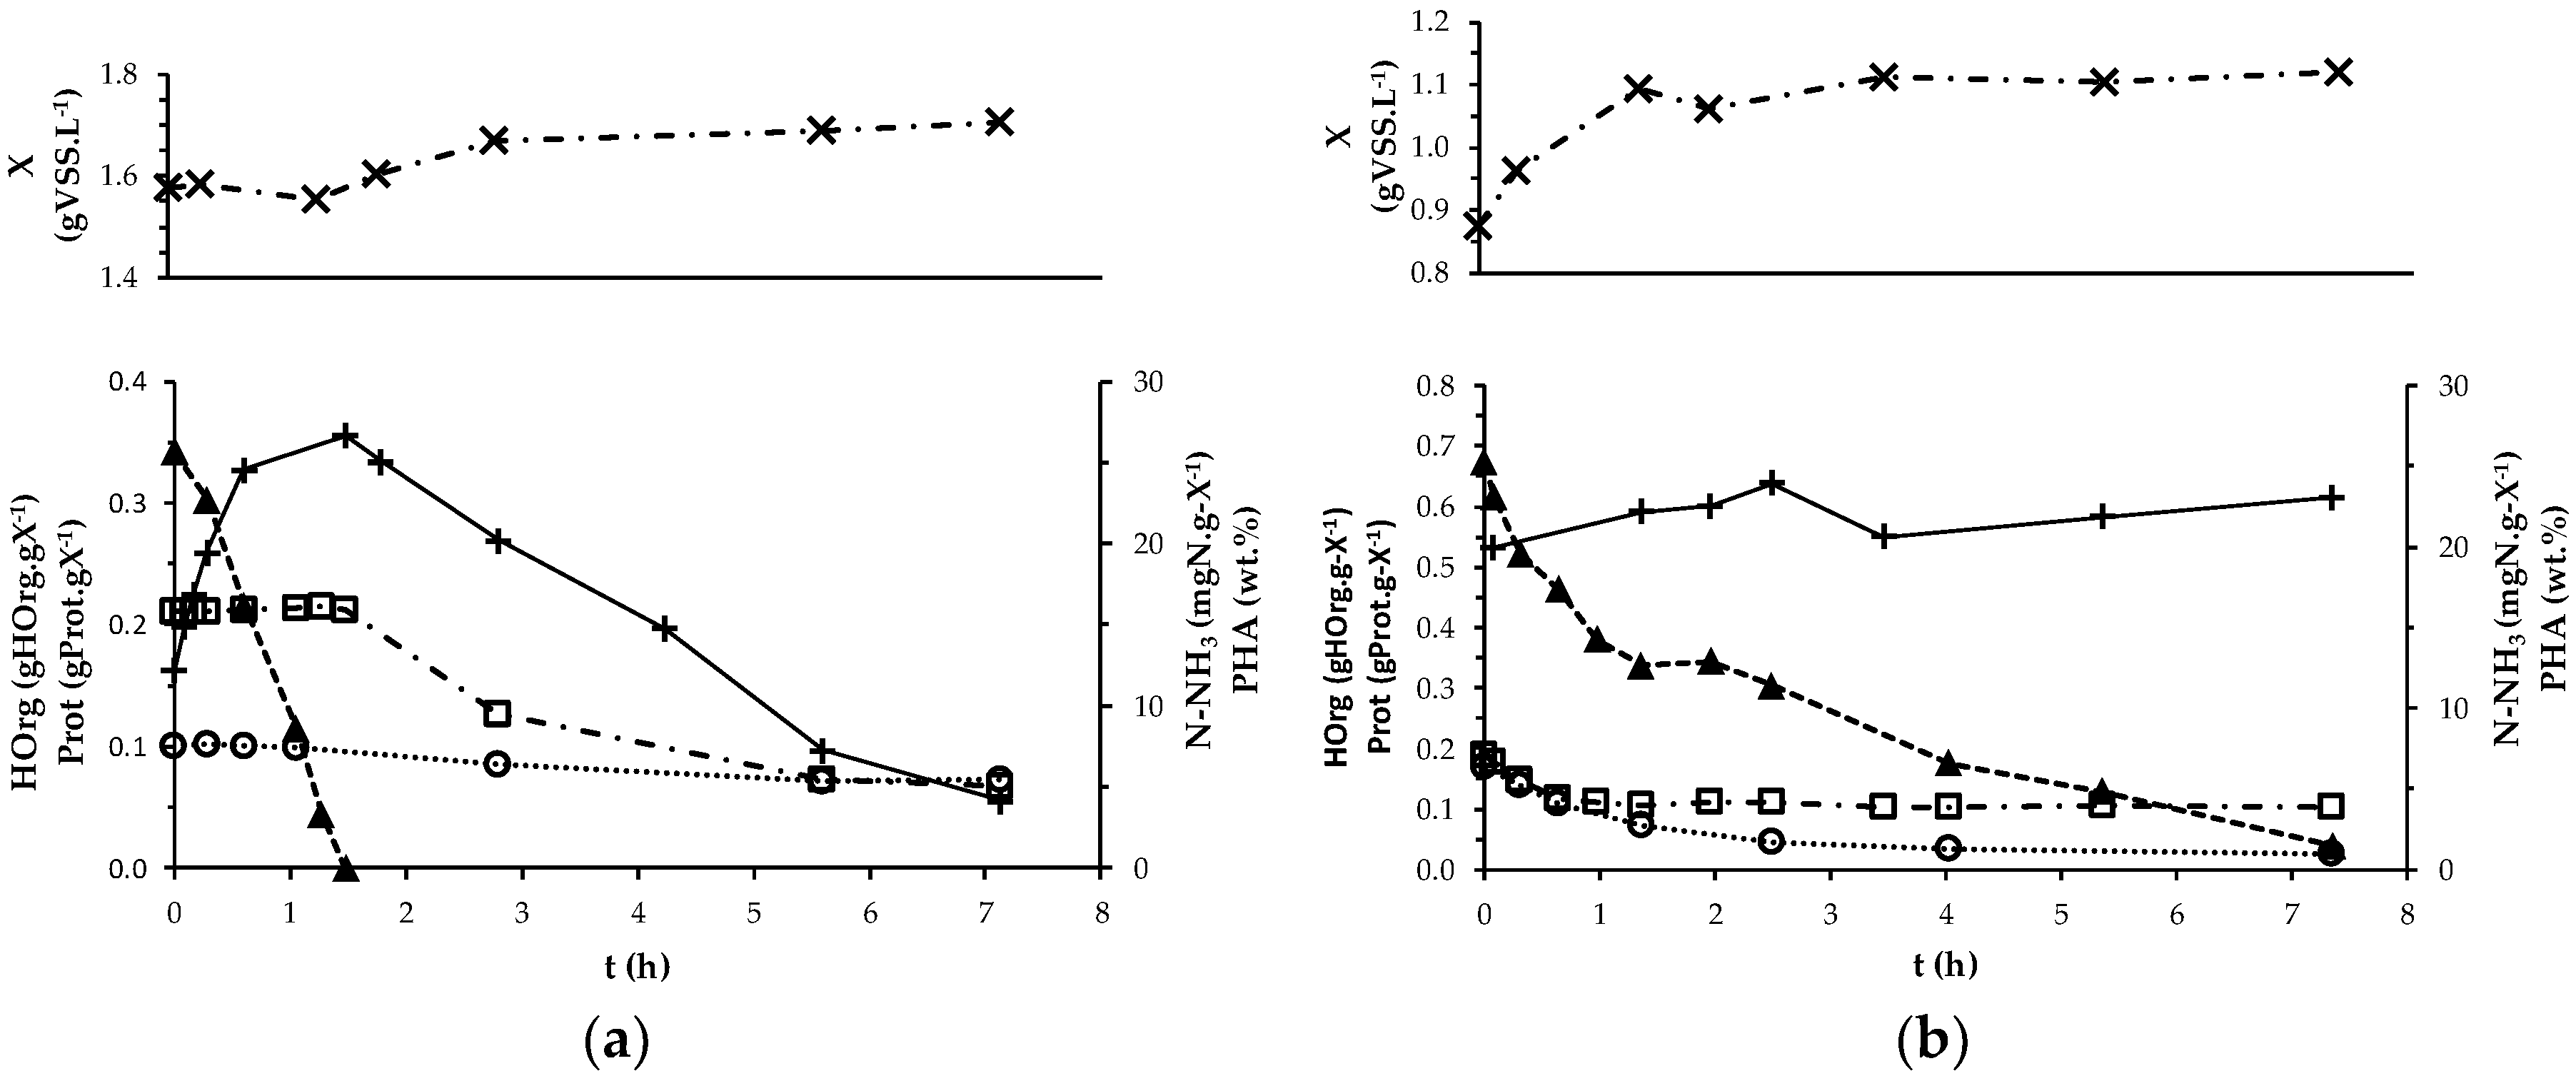
2.3. MMC PHA-Accumulation Performance
2.4. Analytical Procedures
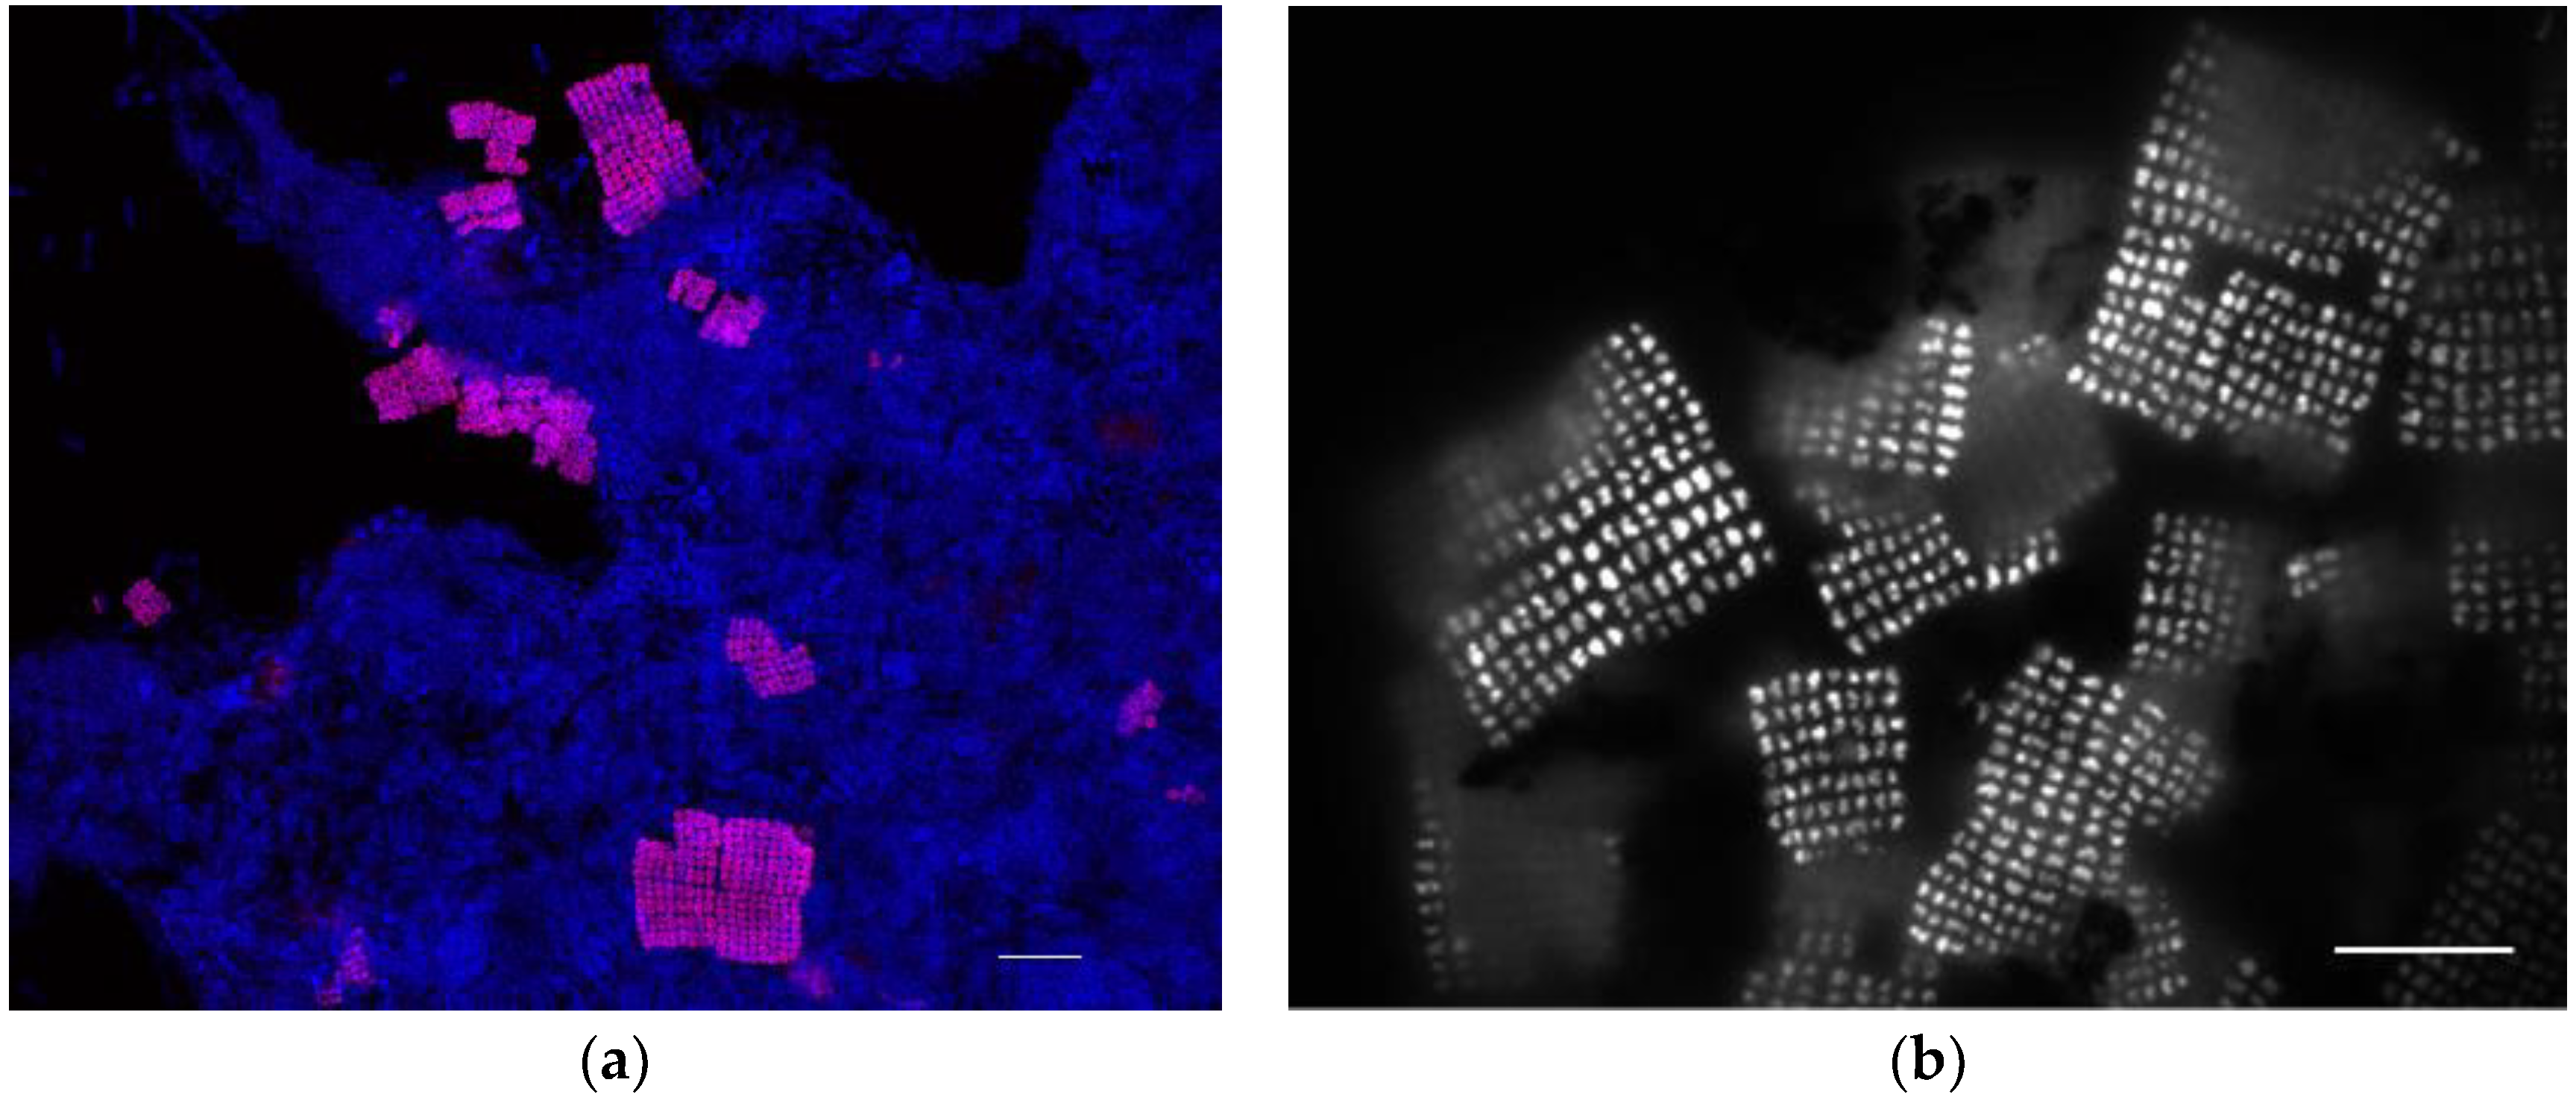
2.5. Microbial Community Assessment by Fluorescence In Situ Hybridisation (FISH)
2.6. Calculations
3. Results
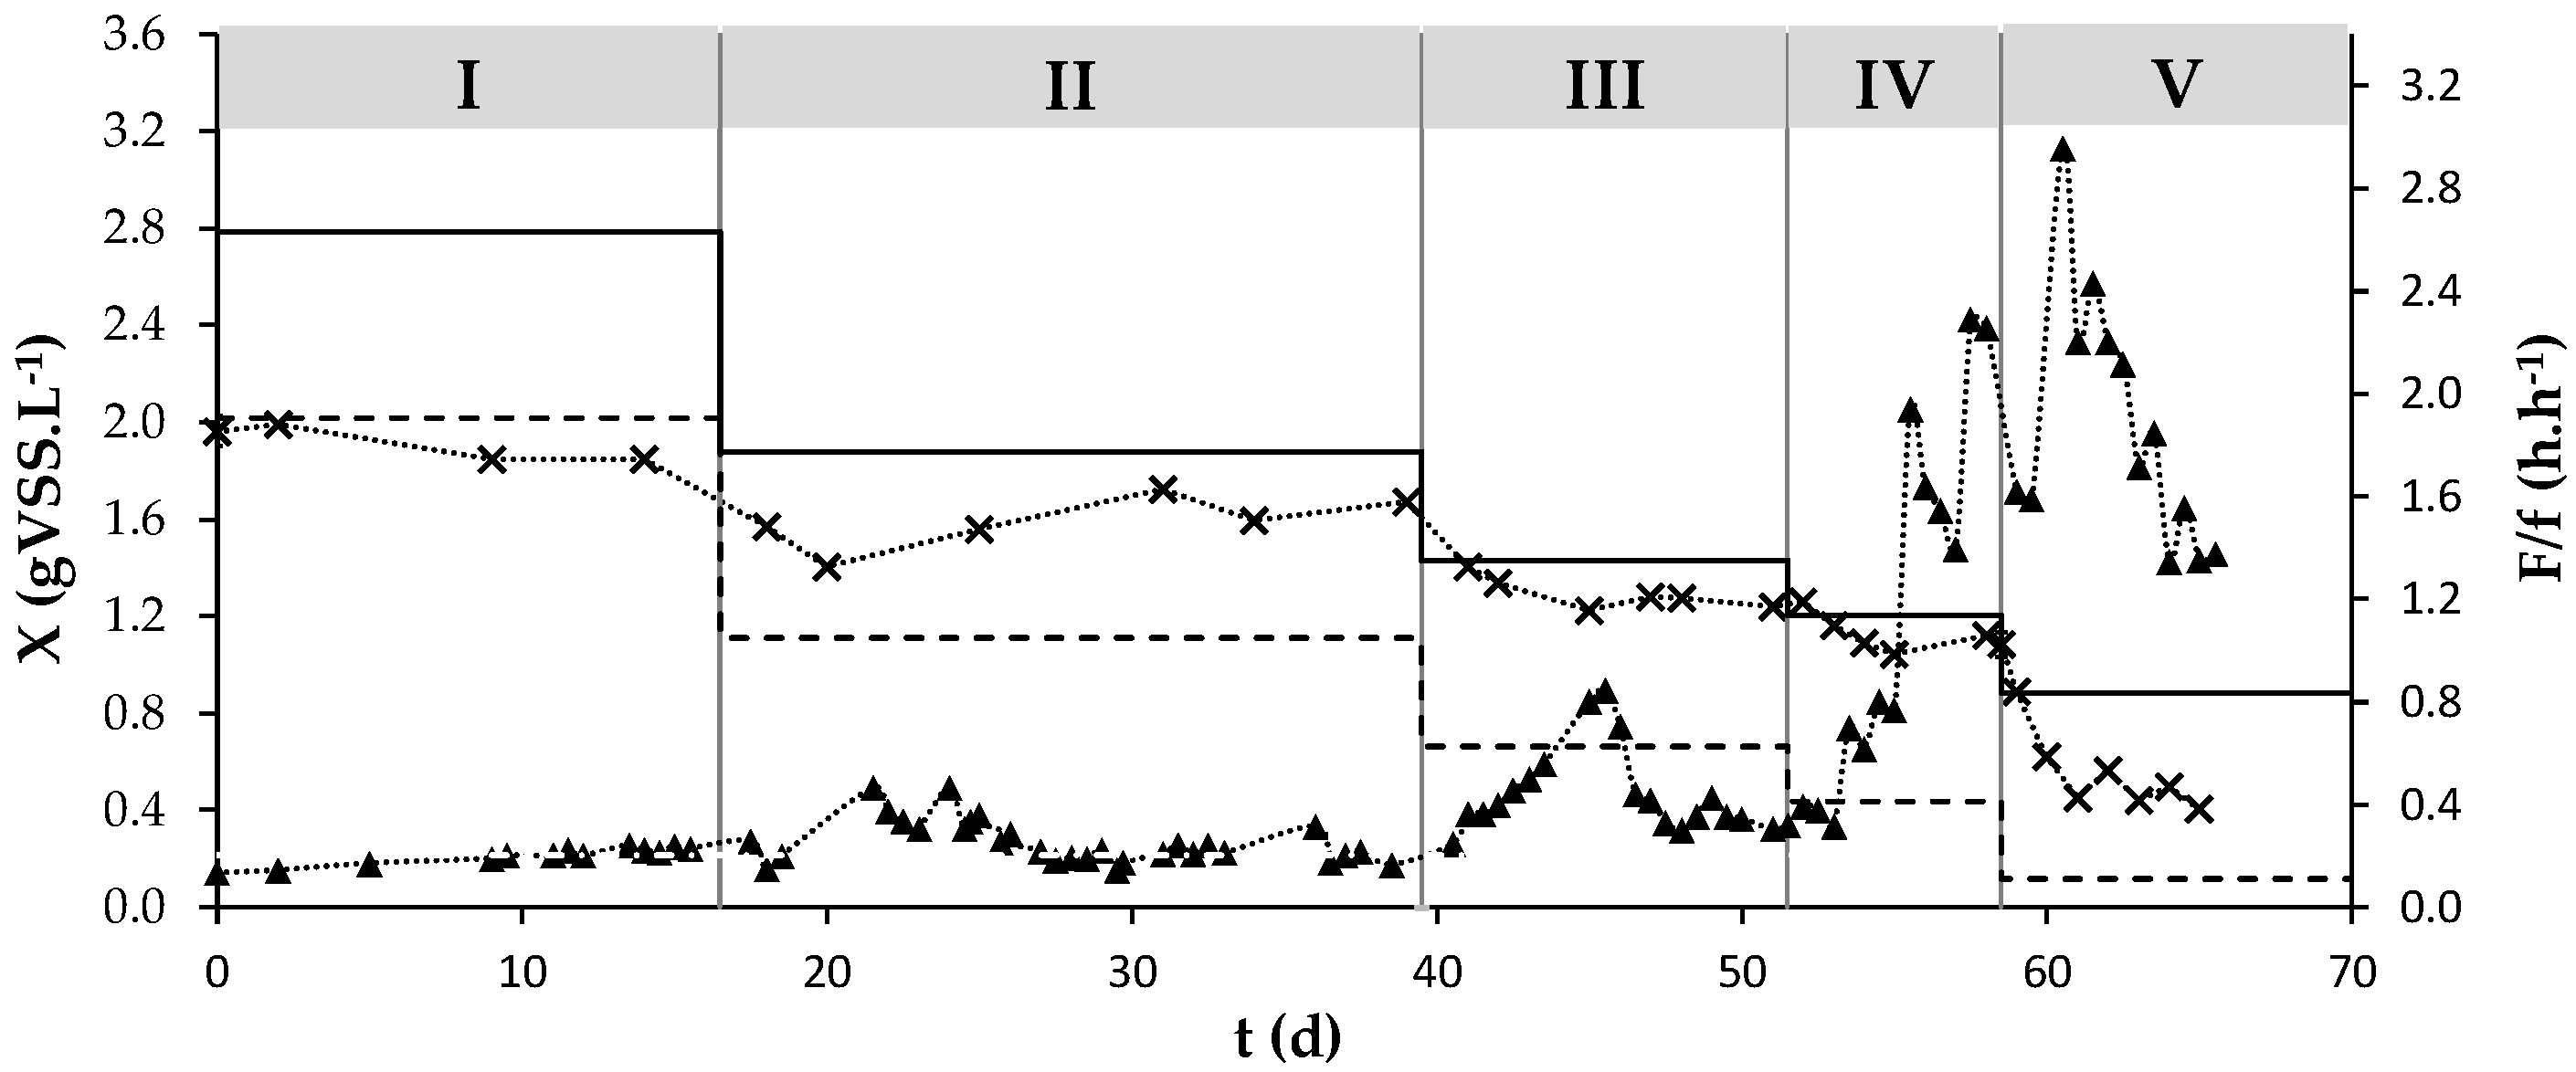
3.1. Culture’s Dynamic Performance
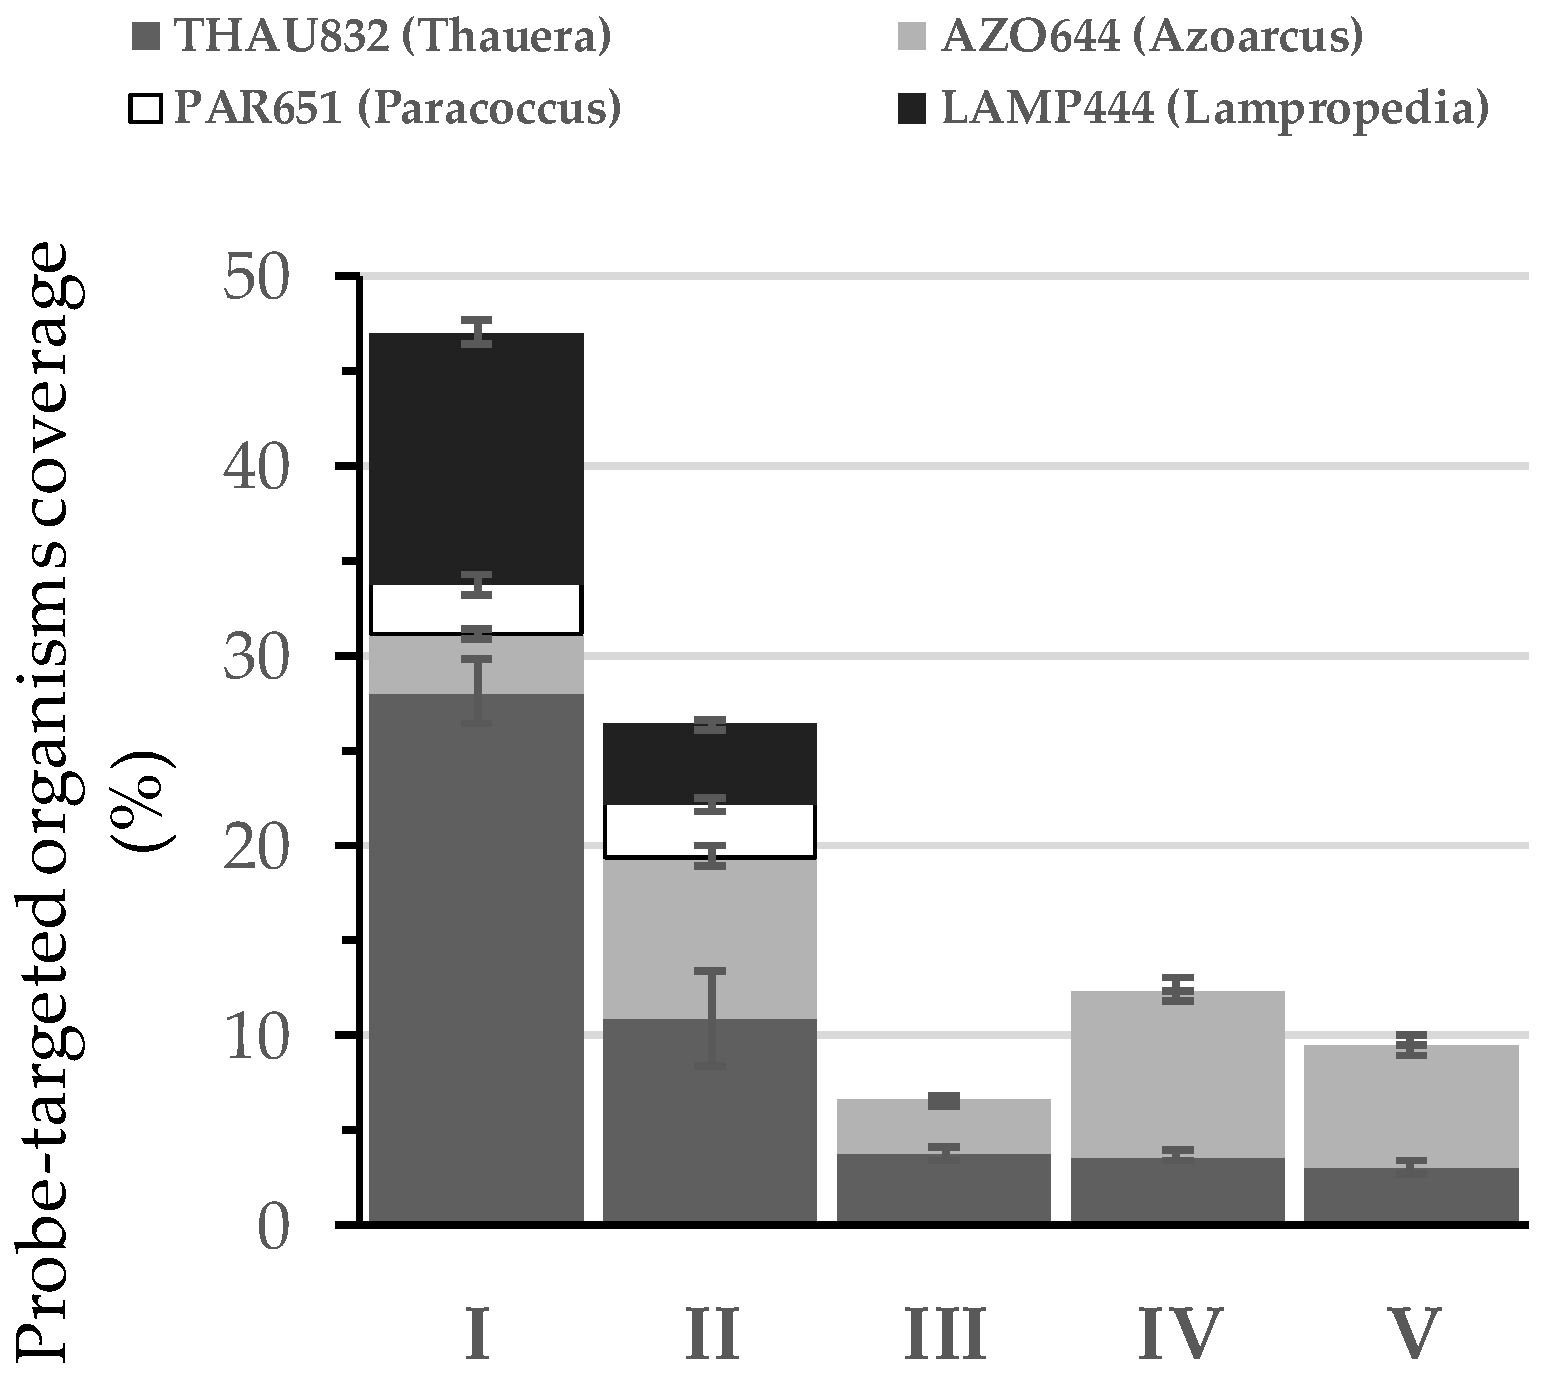
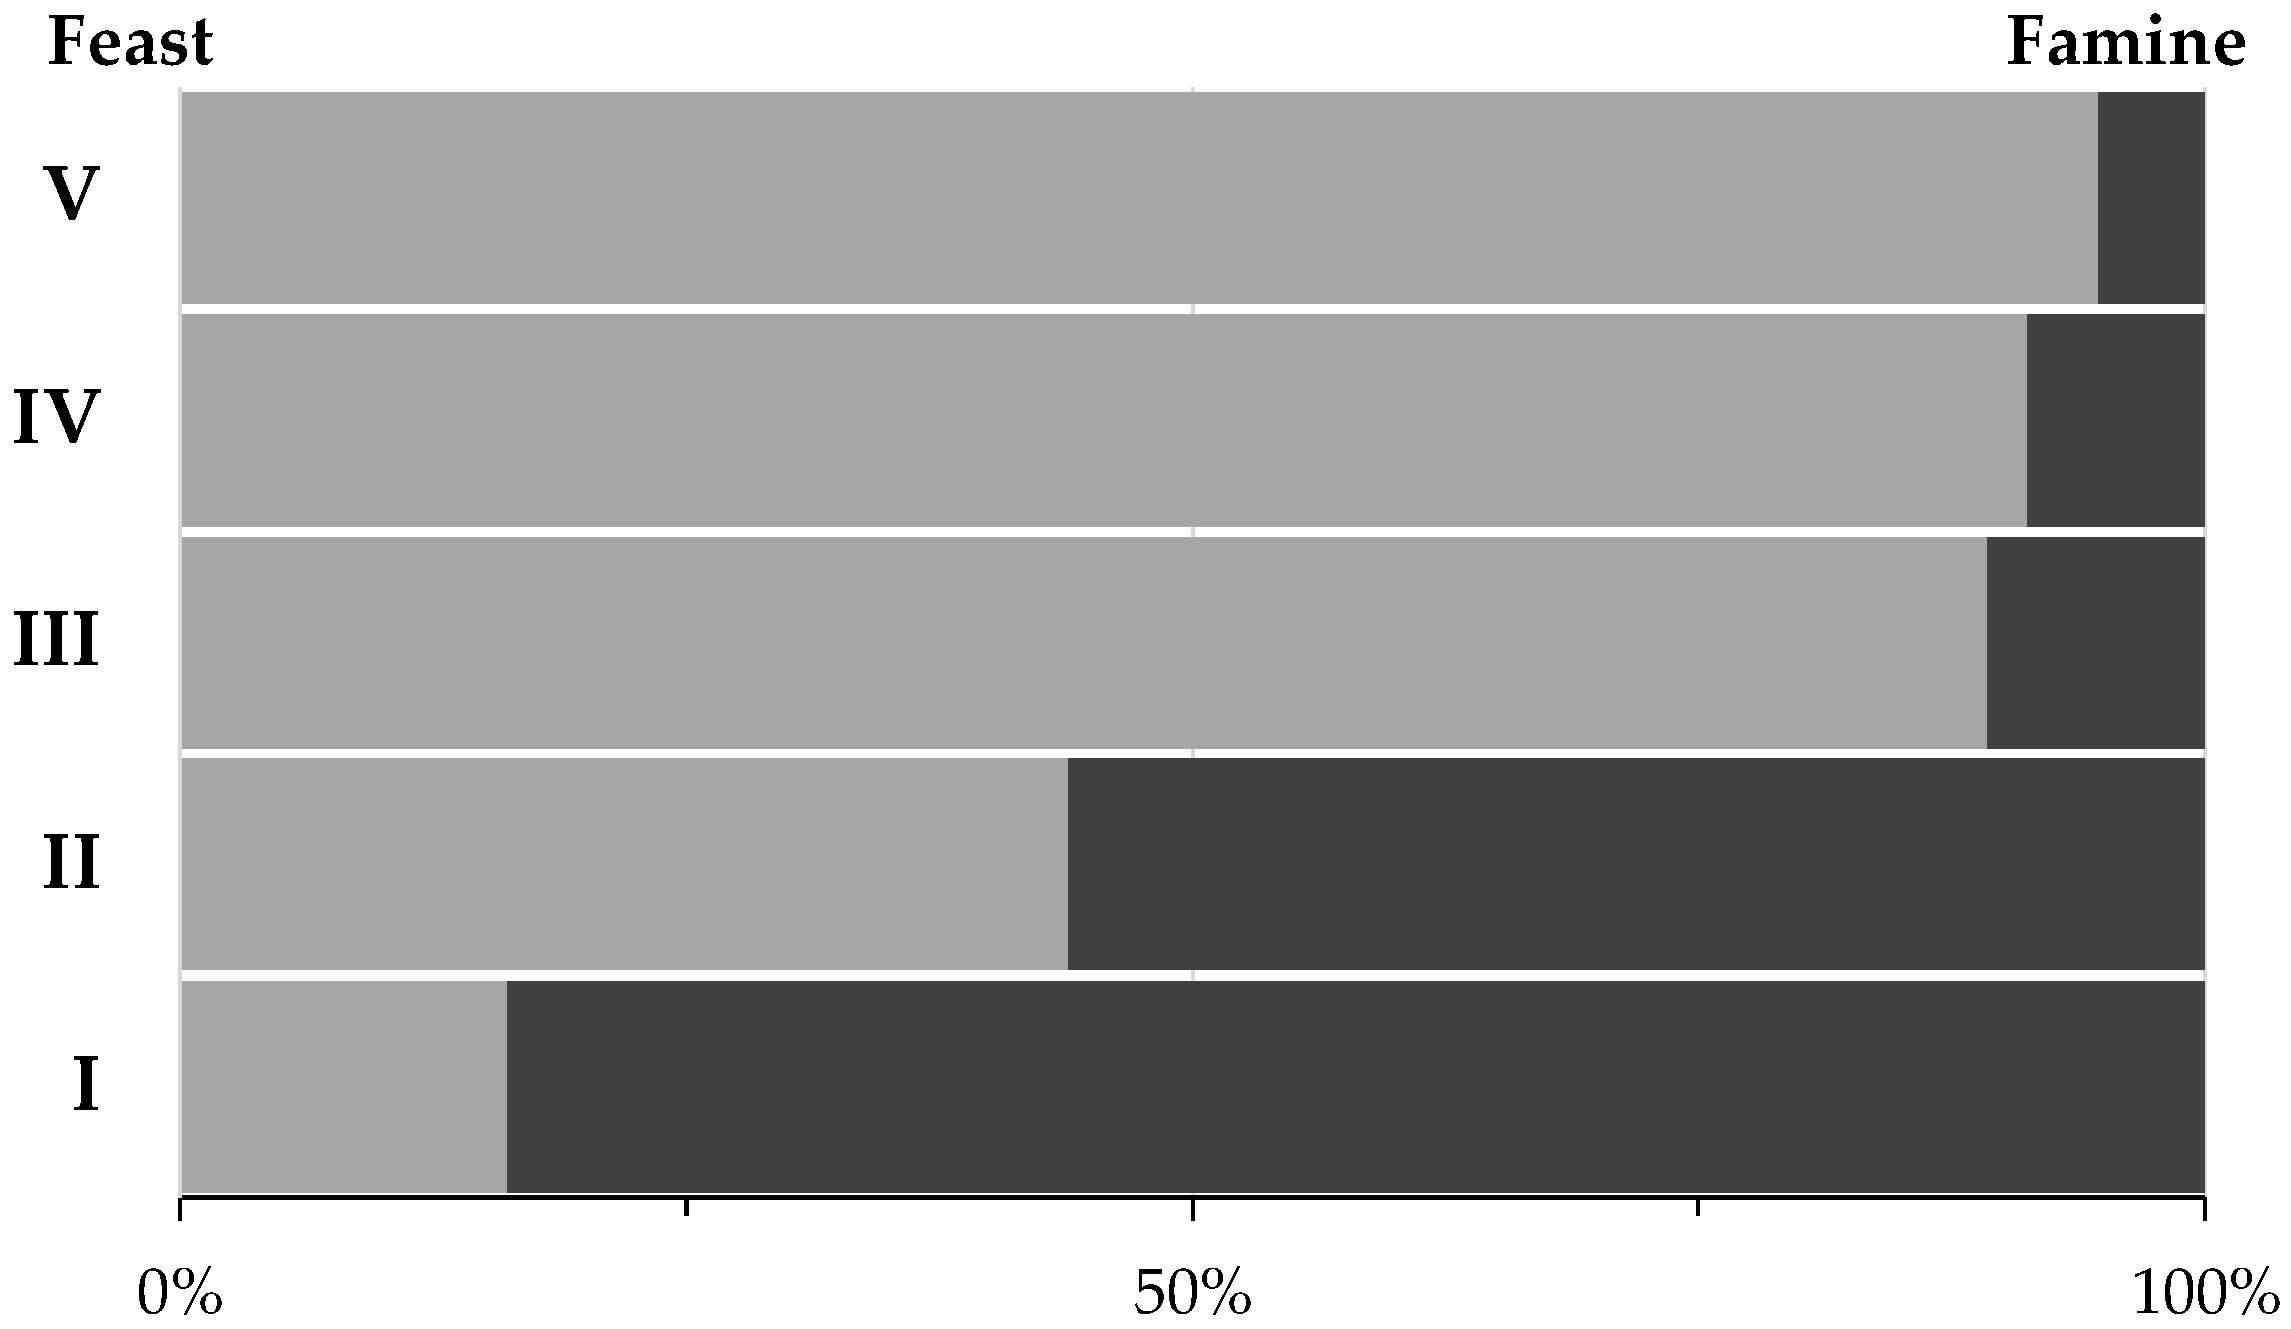
3.2. Microbial Community Assessment
4. Discussion
5. Conclusions
Supplementary Materials
Author Contributions
Funding
Acknowledgments
Conflicts of Interest
References
- Reis, M.; Albuquerque, M.; Villano, M.; Majone, M. Mixed culture processes for polyhydroxyalkanote production from agro-industrial surplus/organic wastes as feedstocks. In Comprehensive Biotechnology, 2nd ed.; Moo-Young, M., Ed.; Elsevier Inc.: Amsterdam, The Netherlands, 2011; Volume 6, pp. 669–683. ISBN 9780444533524. [Google Scholar]
- Reddy, M.V.; Mohan, S.V. Effect of substrate load and nutrients concentration on the polyhydroxyalkanoates (PHA) production using mixed consortia through wastewater treatment. Bioresour. Technol. 2012, 114, 573–582. [Google Scholar] [CrossRef] [PubMed]
- Bengtsson, S.; Werker, A.; Christensson, M.; Welander, T. Production of polyhydroxyalkanoates by activated sludge treating a paper mill wastewater. Bioresour. Technol. 2008, 99, 509–516. [Google Scholar] [CrossRef] [PubMed]
- Valentino, F.; Karabegovic, L.; Majone, M.; Morgan-Sagastume, F.; Werker, A. Polyhydroxyalkanoate (PHA) storage within a mixed-culture biomass with simultaneous growth as a function of accumulation substrate nitrogen and phosphorus levels. Water Res. 2015, 77, 49–63. [Google Scholar] [CrossRef] [PubMed]
- Albuquerque, M.G.E.; Eiroa, M.; Torres, C.; Nunes, B.R.; Reis, M.A.M. Strategies for the development of a side stream process for polyhydroxyalkanoate (PHA) production from sugar cane molasses. J. Biotechnol. 2007, 130, 411–421. [Google Scholar] [CrossRef] [PubMed]
- Campanari, S.; Silva, F.A.; Bertin, L.; Villano, M.; Majone, M. Effect of the organic loading rate on the production of polyhydroxyalkanoates in a multi-stage process aimed at the valorization of olive oil mill wastewater. Int. J. Biol. Macromol. 2014, 71, 34–41. [Google Scholar] [CrossRef] [PubMed]
- Freches, A.; Lemos, P.C. Microbial selection strategies for polyhydroxyalkanoates production from crude glycerol: Effect of OLR and cycle length. New Biotechnol. 2017, 39, 22–28. [Google Scholar] [CrossRef] [PubMed]
- White, C.; Laird, D.W.; Hughes, L.J. From carbon waste to carbon product: Converting oxalate to polyhydroxybutyrate using a mixed microbial culture. J. Environ. Chem. Eng. 2017, 5, 2362–2365. [Google Scholar] [CrossRef]
- Prazeres, A.R.; Carvalho, F.; Rivas, J. Cheese whey management: A review. J. Environ. Manag. 2012, 110, 48–68. [Google Scholar] [CrossRef] [PubMed]
- Domingues, L.; Lima, N.; Teixeira, J.A. Alcohol production from cheese whey permeate using genetically modified flocculent yeast cells. Biotechnol. Bioeng. 2001, 72, 507–514. [Google Scholar] [CrossRef] [Green Version]
- Horton, B. Wheys of recovery. Dairy Ind. Int. 1996, 61, 39–40. [Google Scholar]
- Baldasso, C.; Barros, T.C.; Tessaro, I.C. Concentration and purification of whey proteins by ultrafiltration. Desalination 2011, 278, 381–386. [Google Scholar] [CrossRef]
- Mollea, C.; Marmo, L.; Bosco, F. Valorisation of Cheese Whey, a By-Product from the Dairy Industry. In Food Industry; Mazzalupo, I., Ed.; InTECH: London, UK, 2013; Chapter 24; pp. 549–588. ISBN 978-953-51-0911-2. [Google Scholar]
- Koller, M.; Atlić, A.; Dias, M.; Reiterer, A.; Braunegg, G. Microbial PHA Production from Waste Raw Materials. In Plastics from Bacteria. Microbiology Monographs; Chen, G.Q., Ed.; Springer: Berlin/Heidelberg, Germany, 2010; Volume 14, pp. 85–119. ISBN 9783642032875. [Google Scholar]
- Duque, A.F.; Oliveira, C.S.S.; Carmo, I.T.D.; Gouveia, A.R.; Pardelha, F.; Ramos, A.M.; Reis, M.A.M. Response of a three-stage process for PHA production by mixed microbial cultures to feedstock shift: Impact on polymer composition. New Biotechnol. 2013, 31, 276–288. [Google Scholar] [CrossRef] [PubMed]
- Kim, I.; Kim, S.H.; Shin, H.S.; Jung, J.Y. Anaerobic lipid degradation through acidification and methanization. J. Microbiol. Biotechnol. 2010, 20, 179–186. [Google Scholar] [CrossRef] [PubMed]
- Tawfik, A.; El-Gohary, F.; Ohashi, A.; Harada, H. Optimization of the performance of an integrated anaerobic–aerobic system for domestic wastewater treatment. Water Sci. Technol. 2008, 58, 185–194. [Google Scholar] [CrossRef] [PubMed]
- Serafim, L.S.; Lemos, P.C.; Oliveira, R.; Reis, M.A.M. Optimization of polyhydroxybutyrate production by mixed cultures submitted to aerobic dynamic feeding conditions. Biotechnol. Bioeng. 2004, 87, 145–160. [Google Scholar] [CrossRef] [PubMed]
- APHA. Standard Methods for the Examination of Water and Wastewater, 22th ed.; American Public Health Association/American Water Works Association/Water Environment Federation: Washington, DC, USA, 2012; ISBN 0875530133. [Google Scholar]
- Lowry, O.H.; Rosebrough, N.J.; Farr, L.A.; Randall, R.J. Protein measurement with the folin phenol reagent. J. Biol. Chem. 1951, 193, 265–275. [Google Scholar] [PubMed]
- Amann, R.I. In situ identification of micro-organisms by whole cell hybridization with rRNA-targeted nucleic acid probes. In Molecular Microbial Ecology Manual; Van der Zijpp, A.J., van Elsas, J.D., de Bruijn, F., Eds.; Springer: Dordrecht, The Netherlands, 1995; pp. 331–3455. ISBN 978-94-010-4156-0. [Google Scholar]
- Amann, R.I.; Binder, B.J.; Olson, R.J.; Chisholm, S.W.; Devereux, R.; Stahl, D.A. Combination of 16S rRNA-targeted oligonucleotide probes with flow cytometry for analyzing mixed microbial populations. Appl. Environ. Microb. 1990, 56, 1919–1925. [Google Scholar]
- Daims, H.; Bruhl, A.; Amann, R.; Schleifer, K.H.; Wagner, M. The domain-specific probe EUB338 is insufficient for the detection of all Bacteria: Development and evaluation of a more comprehensive probe set. Syst. Appl. Microbiol. 1999, 22, 434–444. [Google Scholar] [CrossRef]
- Hess, A.; Zarda, B.; Hahn, D.; Haner, A.; Stax, D.; Hohener, P.; Zeyer, J. In situ analysis of denitrifying toluene- and m-xylene-degrading bacteria in a diesel fuel-contaminated laboratory aquifer column. Appl. Environ. Microbiol. 1997, 63, 2136–2141. [Google Scholar] [PubMed]
- Loy, A.; Schulz, C.; Lücker, S.; Schöpfer-Wendels, A.; Stoecker, K.; Baranyi, C.; Lehner, A.; Wagner, M. 16S rRNA gene-based oligonucleotide microarray for environmental monitoring of the betaproteobacterial order Rhodocyclales. Appl. Environ. Microbiol. 2005, 71, 1373–1386. [Google Scholar] [CrossRef] [PubMed]
- Neef, A.; Zaglauer, A.; Meier, H.; Amann, R.; Lemmer, H.; Schleifer, K.H. Population analysis in a denitrifying sand filter: Conventional and in situ identification of Paracoccus spp. in methanol-fed biofilms. Appl. Environ. Microbiol. 1996, 62, 4329–4339. [Google Scholar] [PubMed]
- Lee, N.; Cellamare, C.M.; Bastianutti, C.; Rossello-Mora, R.; Kampfer, P.; Ludwig, W.; Schleifer, K.H.; Stante, L. Emended description of the species Lampropedia hyaline. Int. J. Syst. Evol. Microbiol. 2004, 54 Pt 5, 1709–1715. [Google Scholar] [CrossRef]
- Albuquerque, M.G.E.; Carvalho, G.; Kragelund, C.; Silva, A.F.; Barreto Crespo, M.T.; Reis, M.A.M.; Nielsen, P.H. Link between microbial composition and carbon substrate uptake preferences in a PHA-storing mixed culture. ISME J. 2013, 7, 1–12. [Google Scholar] [CrossRef] [PubMed]
- Daims, H.; Lücker, S.; Wagner, M. Daime, a novel image analysis program for microbial ecology and biofilm research. Environ. Microbiol. 2006, 8, 200–213. [Google Scholar] [CrossRef] [PubMed]
- Ostle, A.G.; Holt, J.G. Nile blue A as a fluorescent stain for poly-β-hydroxybutyrate. Appl. Environ. Microbiol. 1982, 44, 238–241. [Google Scholar] [PubMed]
- Porges, N.; Jasewicz, L.; Hoover, S.R. Principles of Biological Oxidation. In Biological Treatment of Sewage and Industrial Waste; McCabe, J., Eckenfelder, W.W., Jr., Eds.; Reinhold Publishing Co.: New York, NY, USA, 1956; Volume I, pp. 35–48. [Google Scholar]
- Dionisi, D.; Majone, M.; Vallini, G.; Di Gregorio, S.; Beccari, M. Effect of the applied organic load rate on biodegradable polymer production by mixed microbial cultures in a sequencing batch reactor. Biotechnol. Bioeng. 2006, 93, 76–88. [Google Scholar] [CrossRef] [PubMed]
- Albuquerque, M.G.E.; Torres, C.; Reis, M.A.M. Polyhydroxyalkanoate (PHA) production by a mixed microbial culture using sugar molasses: Effect of the influent substrate concentration on culture selection. Water Res. 2010, 44, 3419–3433. [Google Scholar] [CrossRef] [PubMed]
- Gorini, D.; Choubert, J.M.; le Pimpec, P.; Heduit, A. Concentrations and fate of sugars, proteins and lipids during domestic and agro-industrial aerobic treatment. Water Sci. Technol. 2011, 63, 1669–1677. [Google Scholar] [CrossRef] [PubMed]
- Stante, L.; Cellamare, C.M.; Malaspina, F.; Bortone, G.; Tilche, A. Biological phosphorus removal by pure culture of Lampropedia spp. Water Res. 1997, 31, 1317–1324. [Google Scholar] [CrossRef]
- Valentino, F.; Beccari, M.; Fraraccio, S.; Zanaroli, G.; Majone, M. Feed frequency in a sequencing batch reactor strongly affects the production of polyhydroxyalkanoates (PHAs) from volatile fatty acids. New Biotechnol. 2014, 31, 264–275. [Google Scholar] [CrossRef] [PubMed]
- Standridge, I.H. Poor Sludge Settleability Caused by the Bacterium Lampropedia. Water Eng. Manag. 1981, 128, 41–43. [Google Scholar]


| Operational Parameters | |
| OLR | |
| (Cmol·L−1·d−1) | 0.53 |
| (gCOD·L−1·d−1) | 20 |
| Feed proteins | |
| (gProt·L−1) | 1.7 |
| Feed Total-N concentration | |
| (Nmmol·L−1) | 26.4 |
| HRT | |
| (d) | 1 |
| SRT | |
| (d) | 3 |
| Stable operation time | |
| (d) | 34 |
| Performance Parameters | |
| YFP/S | |
| (Cmol-FP·Cmol-S−1) | 0.64 (0.05) |
| (gCOD-FP·gCOD-S−1) | 0.72 (0.06) |
| Protein removal | |
| (gProt%) | 30 (7) |
| Collected fermented cheese whey | |
| Volume | |
| (L) | 20 |
| Time of AnMBR operation | |
| (d) | 3 |
| Substrates concentration | |
| (Cmmol-HOrgs·L−1) | 128 (9) |
| (gCOD-HOrgs·L−1) | 4.6 (0.3) |
| HOrgs [HAc/HBu/HVa/HPr/HLa] | |
| (Cmol%) | 46(1)/44(1)/5(1)/4(1)/0.3(0.2) |
| (gCOD%) | 41(1)/49(1)/6(1)/4(1)/0.3(0.2) |
| Ethanol concentration | |
| (Cmmol·L−1) | 2.9 (0.4) |
| (gCOD·L−1) | 0.37 (0.05) |
| Proteins concentration | |
| (gProt·L−1) | 1.3 (0.3) |
| Total-N concentration | |
| (Nmmol·L−1) | 6 |
| Ammonia-N concentration | |
| (Nmmol·L−1) | 0.78 (0.11) |
| Total-P | |
| (Pmmol·L−1) | 3.1 (0.8) |
| Phosphate phosphorus | |
| (Pmmol·L−1) | 0.89 |
| C/N/P ratio | |
| (Cmol/Nmol/Pmol) | 100/5/3 |
| Periods | I | II | III | IV | V |
|---|---|---|---|---|---|
| Operational Parameters | |||||
| OLR (Cmmol·L−1·d−1) | 42 (4) | 45 (1) | 44 (4) | 43 (1) | 38 (4) |
| fCW C/N ratio (Cmol/Nmol) | 100/5 | 100/5 | 100/5 | 100/5 | 100/5 |
| Supplemented C/N ratio (Cmol/Nmol) | 100/10 | 100/5 | 100/2.5 | 100/1.25 | 100/0 |
| Final C/N ratio (Cmol/Nmol) | 100/15 | 100/10 | 100/7.5 | 100/6.25 | 100/5 |
| Periods | I | II | III | IV | V |
|---|---|---|---|---|---|
| Selection Performance Parameters | |||||
| ΔPHA (wt.%) | 22 (1) | 22 (3) | 12 (1) | 5 (1) | 2 (1) |
| YPHA (Cmol-PHA·Cmol-HOrgs−1) | 0.50 (0.05) | 0.55 (0.06) | 0.35 (0.04) | 0.23 (0.05) | 0.06 (0.02) |
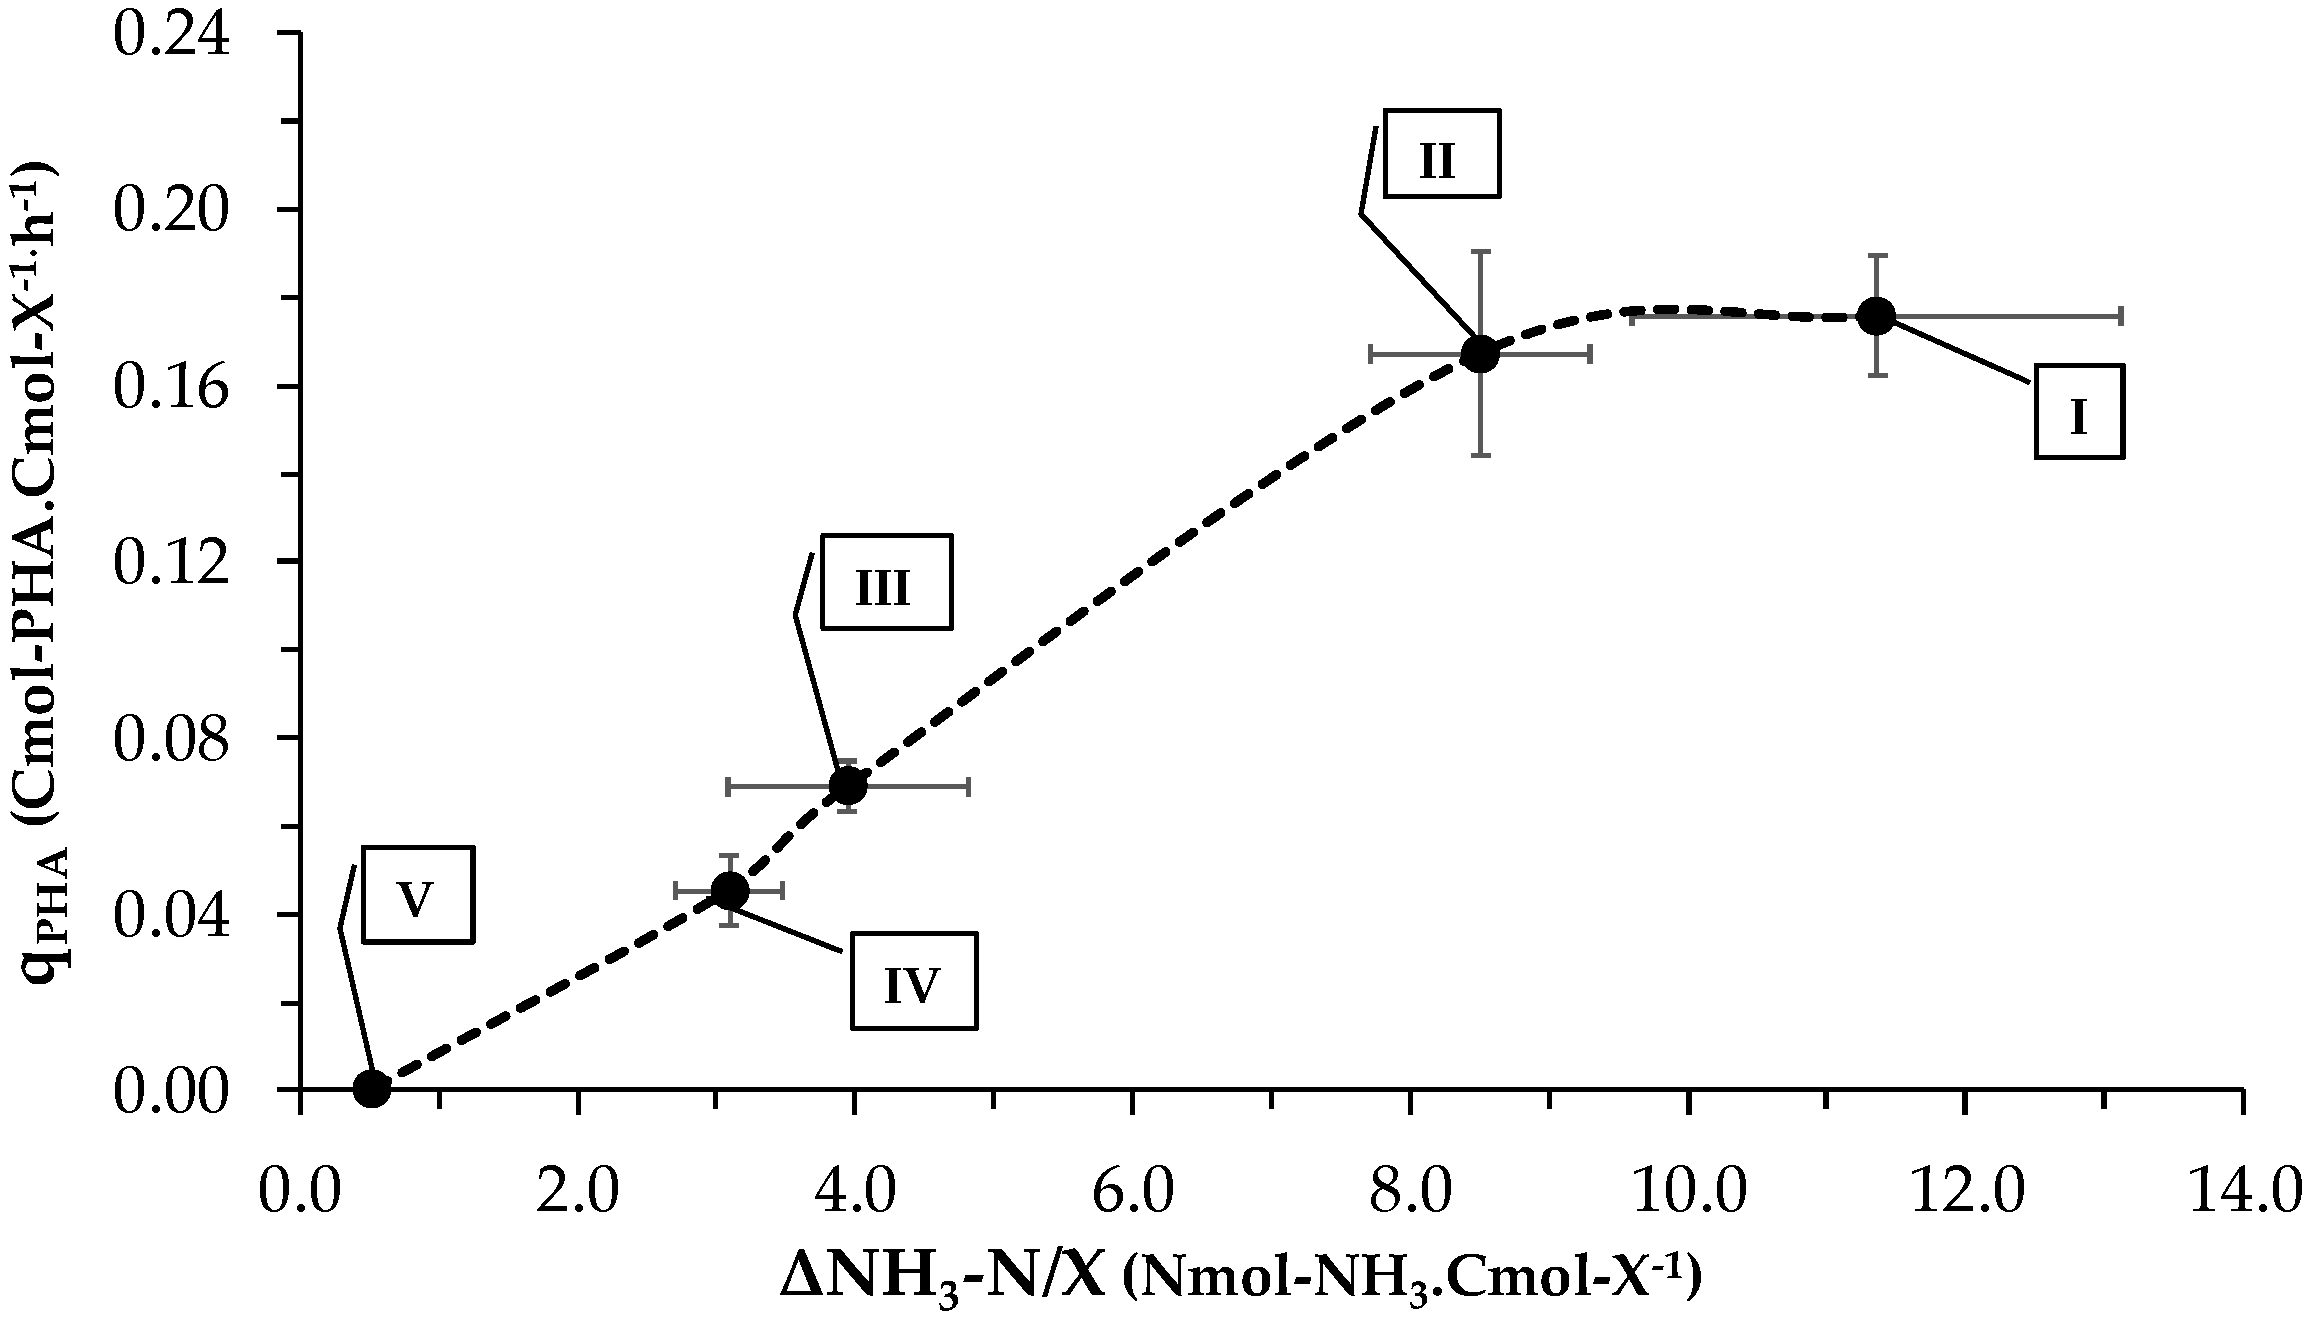
| qPHA (Cmol-PHA·Cmol-X−1·h−1) | 0.18 (0.01) | 0.17 (0.02) | 0.07 (0.01) | 0.05 (0.01) | 0.01 (0.00) |
| −qHOrgs (Cmol-HOrgs·Cmol-X−1·h−1) | 0.37 (0.03) | 0.24 (0.02) | 0.20 (0.01) | 0.12 (0.02) | 0.18 (0.13) |
| −qProt (mgProt·gX−1·h−1) | 6.2 (1.5) | 6.4 (2.1) | 11.6 (2.0) | 11.6 (2.4) | 16.7 (1.2) |
| ΔProt (mgProt·cycle−1) | 27.7 (0.2) | 32.5 (3.0) | 48.5 (2.3) | 76.2 (2.0) | 79.7 (1.4) |
| Accumulation Performance Parameters | |||||
| ΔPHA (wt.%) | 43 | 31 | 14 | - | - |
| PHA composition (wt.%HB/wt.%HV) | 89/11 | 92/8 | 92/8 | - | - |
| YPHA (Cmol-PHA·Cmol-HOrgs−1) | 0.85 (0.12) | 0.76 (0.13) | 0.52 (0.07) | - | - |
| qPHA (Cmol-PHA·Cmol-X−1 h−1) | 0.17 (0.02) | 0.18 (0.03) | 0.11 (0.00) | - | - |
| Productivity (gPHA·L−1·h−1) | 0.20 | 0.25 | 0.12 | - | - |
© 2018 by the authors. Licensee MDPI, Basel, Switzerland. This article is an open access article distributed under the terms and conditions of the Creative Commons Attribution (CC BY) license (http://creativecommons.org/licenses/by/4.0/).
Share and Cite
Oliveira, C.S.S.; Silva, M.O.D.; Silva, C.E.; Carvalho, G.; Reis, M.A.M. Assessment of Protein-Rich Cheese Whey Waste Stream as a Nutrients Source for Low-Cost Mixed Microbial PHA Production. Appl. Sci. 2018, 8, 1817. https://doi.org/10.3390/app8101817
Oliveira CSS, Silva MOD, Silva CE, Carvalho G, Reis MAM. Assessment of Protein-Rich Cheese Whey Waste Stream as a Nutrients Source for Low-Cost Mixed Microbial PHA Production. Applied Sciences. 2018; 8(10):1817. https://doi.org/10.3390/app8101817
Chicago/Turabian StyleOliveira, Catarina S. S., Marisa O. D. Silva, Carlos E. Silva, Gilda Carvalho, and Maria A. M. Reis. 2018. "Assessment of Protein-Rich Cheese Whey Waste Stream as a Nutrients Source for Low-Cost Mixed Microbial PHA Production" Applied Sciences 8, no. 10: 1817. https://doi.org/10.3390/app8101817