Phase-Only Optically Addressable Spatial-Light Modulator and On-Line Phase-Modulation Detection System

National Laboratory on High Power Laser and Physics, Shanghai Institute of Optics and Fine Mechanics, Chinese Academy of Sciences, Shanghai 201800, China
*
Authors to whom correspondence should be addressed.
Appl. Sci. 2018, 8(10), 1812; https://doi.org/10.3390/app8101812
Submission received: 3 September 2018
/
Revised: 26 September 2018
/
Accepted: 27 September 2018
/
Published: 3 October 2018
(This article belongs to the Special Issue Liquid Crystal on Silicon Devices: Modeling and Advanced Spatial Light Modulation Applications)
Abstract
:The influence of driving conditions on the phase-modulation ability of an optically addressable spatial-light modulator (OASLM) is investigated using an equivalent circuit method and a system for measuring wave-front modulation that uses a phase-unwrapping data-processing method, and is constructed with a charge-coupled device and wave-front sensor. 1λ peak-to-valley phase change for a 1053 nm laser beam is acquired with the home-made OASLM at the optimal driving voltage of 14 V at 200 Hz. The detection system for wave-front modulation has a spatial resolution of 200 µm for binary images and a minimum distinguishable contrast of 1 mm. On-line phase modulation with feedback control can be acquired with the OASLM and the corresponding measuring system.
1. Introduction
Liquid crystals (LCs) [1], as tunable elements, are increasingly being used for non-display applications, including intelligent windows, tunable phase-retarders, terahertz bandgap fibers, and spatial-light modulators [2,3,4,5]. Owing to the advantages of low cost and high compactness, phase-only spatial light-modulators (SLMs) have additional potential applications in areas such as adaptive optics and wave-front control [6,7,8]. Two of the most common are liquid crystal on silicon (LCOS) and optically addressable types. The LCOS type is reflective and is an electrically addressed type, which means it can easily cause spectral distortion because of Fabry–Perot interference and the black-matrix effect generated by the two-dimensional (2D) periodic opaque electrodes, which can make the beam quality worse. Compared to an electrically addressable spatial-light modulator, the optically addressable spatial-light modulator (OASLM) does not require complex addressable electrode circuits. The filling factor of this type reaches 100%, which means that the generated phase distribution is continuous, not multistep. Its high resolution and simple manufacturing process renders OASLM an ideal alternative for wave-front modulation of laser beams [9].
An OASLM with parallel-aligned liquid-crystal light valves (LCLVs) works in phase-only mode and the influence of driving conditions on the phase-modulation capability of the OASLM is decisive for its performance. Traditional measurement of the phase retardation of a laser is performed using a Mach–Zehnder interferometer [10], Twyman–Green interferometer [11], and wave-front sensor (WFS) [12]. The first two devices are very sensitive to mechanical vibration and air turbulence, and the WFS is limited by its inherently restrictive measurement accuracy range. López-Téllez et al. proposed the unwrapping method to characterize the retardance function of liquid-crystal variable retarders (LCVRs) [13]. This method can quickly and accurately obtain the original, continuous function of the voltage-retardance relationship by removing discontinuities and is applicable to measure the retardance variation of the SLM.
In this study, the impact of driving conditions, including the frequency of the applied voltage and the write-light irradiance on the modulation ability of phase-only OASLM, is investigated. 1λ phase-control ability can be acquired using the home-made OASLM under an applied voltage of 14 V at 200 Hz. In order to monitor the phase-control ability of the OASLM, a detection system including a charge-coupled device (CCD) and WFS was constructed and the aforementioned unwrapping procedure was applied to deduce the phase modulation from the transmittance. The modulation result of a binary image with variable frequencies, and the modulation transfer function (MTF), indicate that the proposed system has a spatial resolution of 200 μm for modulation measurement and a minimum distinguishable contrast of 1 mm. This detection system can correctly monitor the modulation results of the 2D chessboard grayscale image.
2. The Influence of the Driving Conditions on the Performance of a Phase-Only OASLM
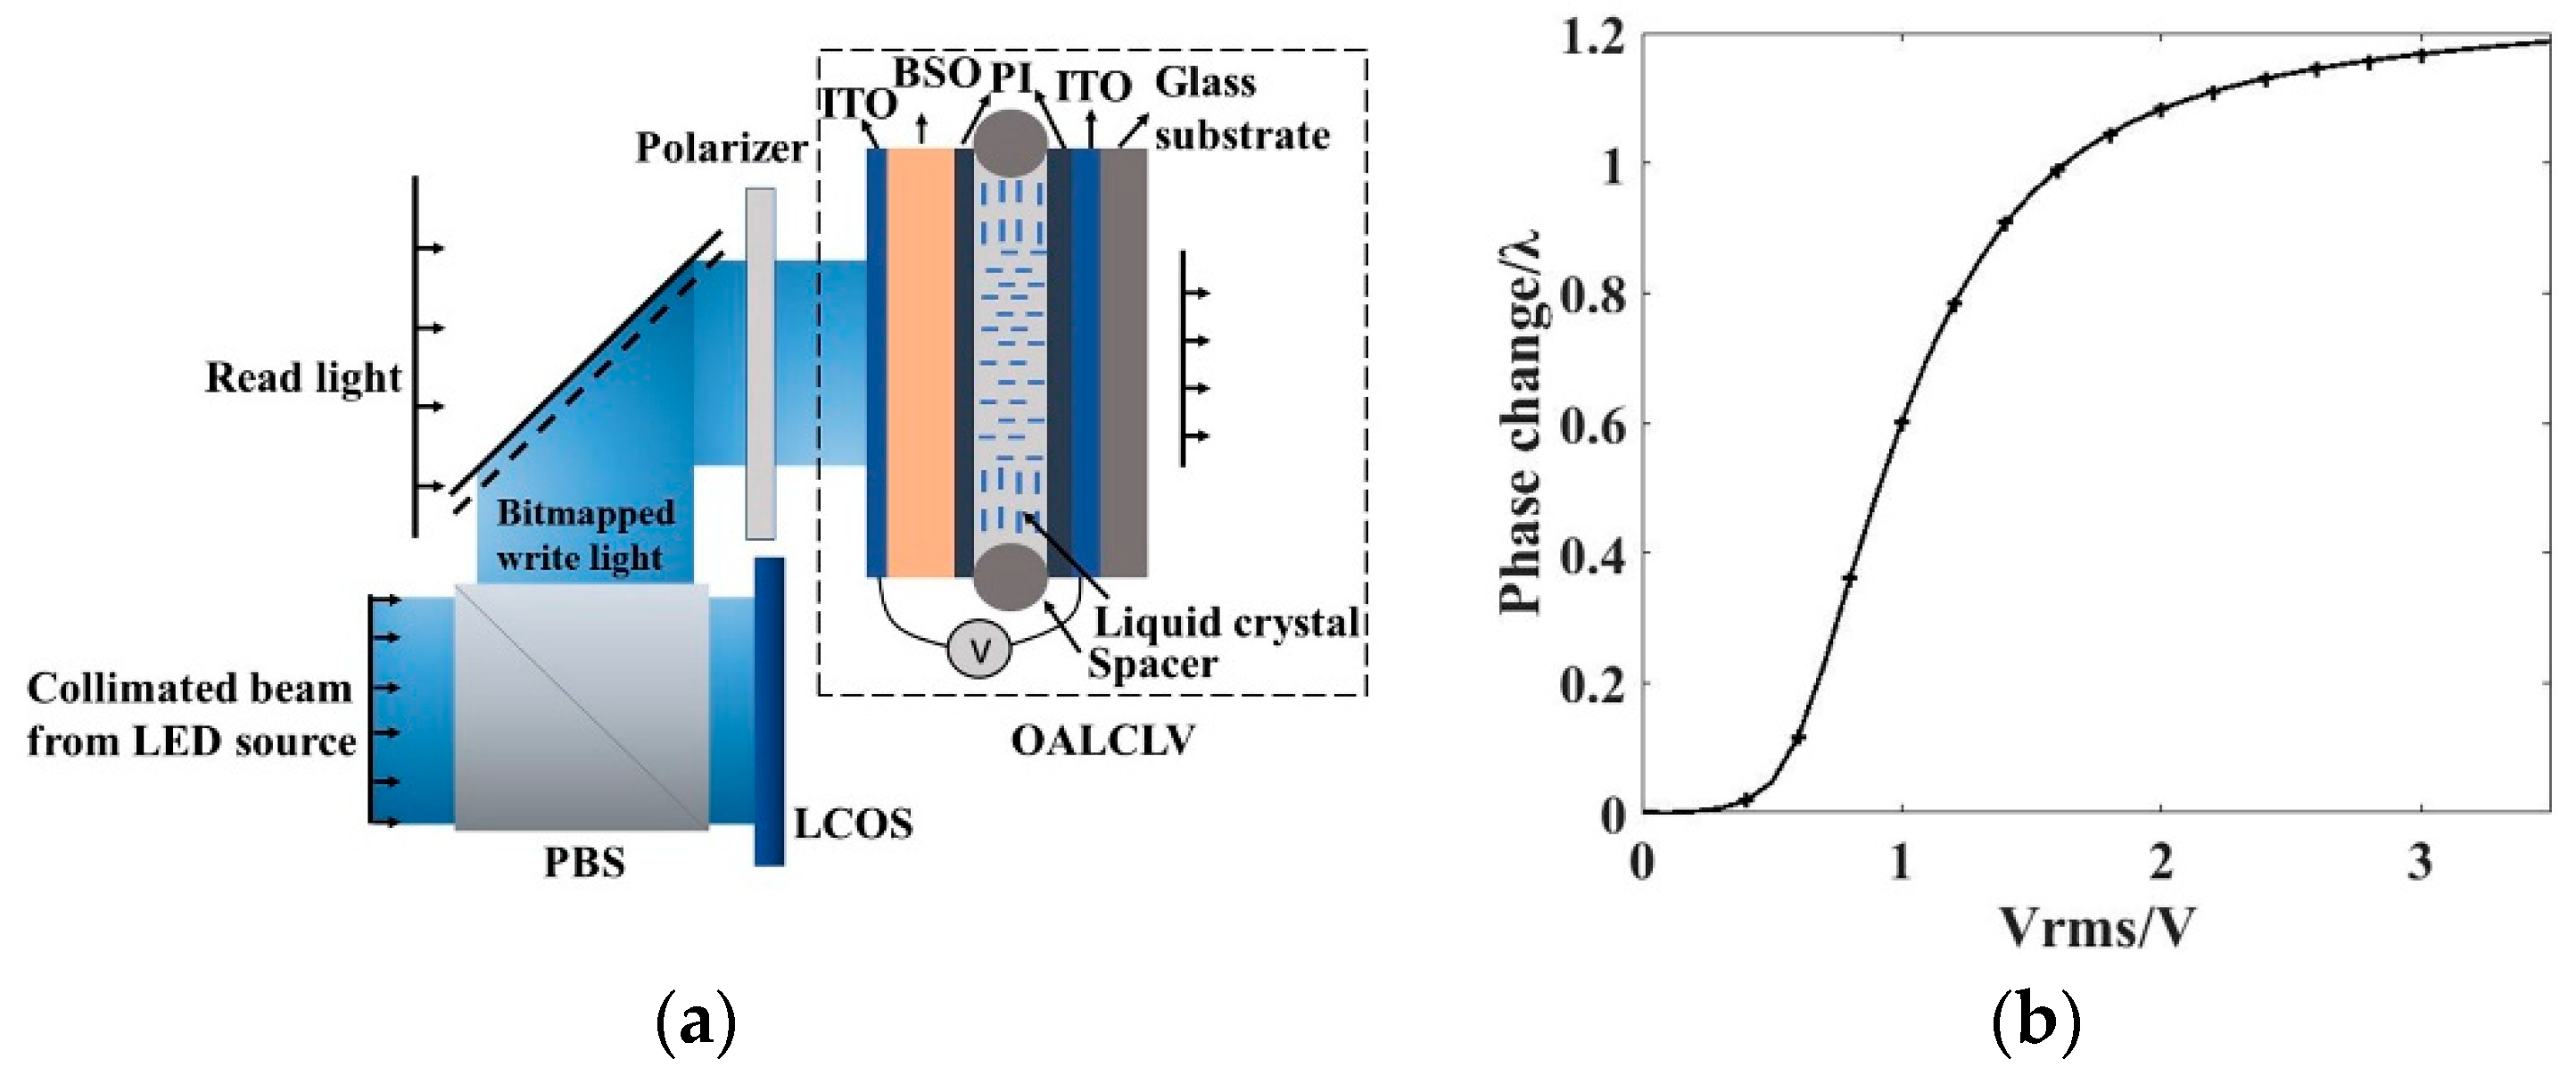
The phase-only OASLM is schematically depicted in Figure 1a. Considering the photoconductive characteristic and spectral absorption coefficient of Bi12SiO20 (BSO) crystal [14], we use the light-emitting diode (LED) with a wavelength of 470 nm as the light source of the write light. An amplitude-modulating LCOS SLM (Rui Like Co., WXGA Active Matrix LCD, the pixel pitch is 20 μm) has been used to control the collimated beam from the LED source. The bitmapped image is then projected onto the BSO layer through an imaging system. We can control the wave-front of the transmissive read light (with a wavelength of 1053 nm the photoconductive effect of the BSO crystal at 1053 nm is almost negligible) by setting an appropriate bitmap in the LCOS modulator.
When the BSO layer (1 mm thickness, 20 × 20 mm2 effective area) is illuminated with the write light, and an electric field is applied across the optically addressable liquid-crystal light valve (OALCLV), the resistance of the BSO decreases and the voltage begins to act on the LC layer, so the LC director is redirected towards the applied field [15]. As the voltage increases, the director rotates further, which changes the extraordinary refractive index of the LC and results in a reduction in the phase retardance of the OASLM [16]. In this way, the voltage on the LC layer affects the phase controllability of the OASLM.
The voltage response of the LC causes a phase change of the OALCLV, so first we studied the relationship between the phase change and the voltage of the LC cell without BSO. We oriented the test cell at 45° between crossed polarizers and applied the alternating voltage. The intensity value of the modulated 1053-nm laser was obtained using a CCD, and the average value of all pixels was taken as the effective value, which is expressed as follows [17].
where T refers to the transmittance. Phase change is added to the laser beam by the OASLM according to the loaded grayscale images of the write light. The retardance δ of the liquid crystal layer is expressed as follows:
The phase change is deduced from the transmittance according to Equation (2). Because of the periodicity, δ can only be within the range of 0 − π, so in the data processing, the phase unwrapping [18] is performed to calculate the actual phase change.
We measured the voltage response curve of an LC cell with 6-μm-thick LC layer (HCCH Co., Jiangsu, China, ne = 1.820 and no = 1.515 at λ = 589 nm, with the same thickness as the LC layer in OALCLV) and two glass substrates. The voltage response shown in Figure 1b will be used as a reference in the phase change-voltage relationship of the OALCLV. According to this figure, we can acquire the threshold voltage of LC molecule rotation as Vthr = 0.4 V and the saturated voltage as Vsat = 3 V, and the peak-to-valley (PV) value of the phase change is approximately 1.1λ.
The OALCLV, the main component of the OASLM, can be modelled with an equivalent circuit in Figure 2a. The resistance and capacitance of the LC layer are RLC and CLC respectively. The dark BSO crystal resistance is R0. The resistance of the BSO under-uniform illumination level ϕ is Rϕ. The value of R1C1 is inversely proportional to the illumination level ϕ. Similar models have been introduced in our previous work in Reference [19]. With the input voltage = , the voltage drop across the LC layer, VLC, can be calculated using the following equation.
These VLC values as a function of the frequency of the VAC, when the OALCLV is illuminated with different write-light irradiances, are shown in Figure 2b, and are solved using Equation (3) with an root mean square (RMS) value of VAC = 3.5 V. Several physical parameters have been used in the model as follows [20]: and are the density and relative dielectric constant of the LC, respectively, and is the dark BSO crystal conductivity. The dotted line indicates Vthr. These marked points correspond to the experimental values, which are basically consistent with the simulated values and confirm the validity of Equation (3). From the figure we can see that VLC decreases with increase in frequency when the OALCLV is under the same write-light irradiance. Meanwhile, VLC increases with increase in write-light irradiance when the OALCLV is under the same driving voltage frequency.
The VLC of the OALCLV must be greater than Vthr to ensure the voltage response and the maximum value of VLC directly determines the PV value of the phase change, that is the phase modulation ability of the OASLM. However, VLC on the LC layer of the OALCLV is difficult to measure directly in the experiment, so we have experimentally verified the effect of four write-light irradiances and four kinds of frequencies of VAC on the phase change ability, and simulated these results using Equation (3), which are depicted in Figure 3.
In Figure 3a, the solid lines show the relation between the phase change and VAC at 200 Hz when the OASLM is subjected to four different write-light irradiances of 3.25 mW/cm2, 5.75 mW/cm2, 7.75 mW/cm2, and 9.5 mW/cm2. The dashed line shows the simulated phase-change relation deduced from the voltage response of the LC and Equation (3). The average error-rate between the simulated and experimental values is 3.5%. The figure illustrates that as the write-light irradiance decreases in the range of 9.5–3.25 mW/cm2, the reduction of VLC being approximately 1 V in Figure 2b, which results in a decrease in phase-change PV value of 0.4λ.
In Figure 3b, the solid lines show the relation between the phase change and VAC at four different driving frequencies, namely 50 Hz, 100 Hz, 150 Hz, and 200 Hz when the OALCLV is uniformly illuminated with the write-light of irradiance 9.6 mW/cm2. The dashed line shows the simulated phase-change relation. The average error-rate between the simulated and experimental values is 2%. This figure illustrates that the reduction of the PV value is 0.1λ with the frequency increases from 50 Hz to 200 Hz, which corresponds to a decrease in VLC of 1 V in Figure 2b.
In summary, the write-light irradiance and frequency of VAC simultaneously affect the phase-change ability of the OALCLV in the form of change in VLC, the voltage of the LC layer. At the same time, Equation (3) is a reliable formula to simulate VLC and, when it is combined with the voltage response of the LC, the theoretical phase distribution can be accurately derived when the OALCLV is under different driving conditions.
The voltage across the LC layer affects the phase-modulation ability, which can be controlled by changing the write-light irradiance in the form of a grayscale image loaded on the LCOS in a practical application; therefore, we have experimentally verified the phase-modulation ability of the OASLM as a function of gray-level values when the LED is at different drive currents.
Figure 4a depicts the relationship between the phase change and grayscale values when the OASLM is under a VAC of 14 V at 100 Hz and separately loaded these single-value grayscale images with values from 0 to 0.79 (in the normalized 0–255 grayscale range, 0–0.79 is the linear region of write-light irradiance as a function of grayscale value); meanwhile, the driving current of the LED changes from 200 mA to 800 mA. The dashed line shows the simulated phase-change relation deduced from the voltage response of the LC and Equation (3). The average error-rate between the simulated and experimental values is 2.2%. The figure shows that, with an increase in current, the decrease in the PV value, which is the phase-change ability, is 0.23λ, mainly because of the increase in the phase-change values corresponding to the gray level 0, implying that the corresponding VLC is improved. In particular, we simulated the range of VLC, which corresponds to 0–0.79 gray level when the OASLM is subjected to different driving conditions; the results are depicted in Figure 4b. The marked points correspond to the experimental values, which are basically consistent with the simulated values.
Figure 4b shows that, when the drive current changes from 200 mA to 800 mA, the write-light irradiance corresponding to the gray level of 0.79 increases from 3.25 mW/cm2 to 9.50 mW/cm2, the VLC values at 100 Hz exceed the Vsat value, so all the phase-change values reach the maximum value of 0.97λ as depicted in Figure 4a; the increase in VLC at 100 Hz is approximately 0.4 V as the write-light irradiance corresponding to the gray level of 0 increases from 0.131 mW/cm2 to 0.388 mW/cm2, and results in a decrease of the PV values of 0.23λ as depicted in Figure 4a. When the frequency is greater than 200 Hz, the values of the VLC of the gray level 0 are all 0.5 V for different driving currents and do not change with increasing frequency. The current of the LED must be at least 400 mA at this time to ensure that the VLC value for the gray level 0.79 exceeds the Vsat value, so we set the driving current at 400 mA, the corresponding dynamic range of the write-light irradiance is 0.235–5.75 mW/cm2 to 0.388 mW/cm2 when the grayscale value changes from 0 to 0.79 and the frequency is set at 200 Hz in practical applications.
The above analysis reveals that the range of the VLC values corresponding to 0–0.79 gray level directly affects the phase-modulation capability of the OASLM. The ideal driving condition is that when the OASLM is loaded with 0–0.79 grayscale images, the range of Vthr–Vsat is at least contained in the variation range of VLC to obtain theoretical phase-change capability. The equivalent circuit method combined with the voltage response curve of the LC can reliably simulate the phase-change relationship of OASLM and help us select the appropriate driving conditions, which will guide the development of the modulator with large phase-modulation ability in our future work.
3. An On-Line Monitor System for OASLM Modulation
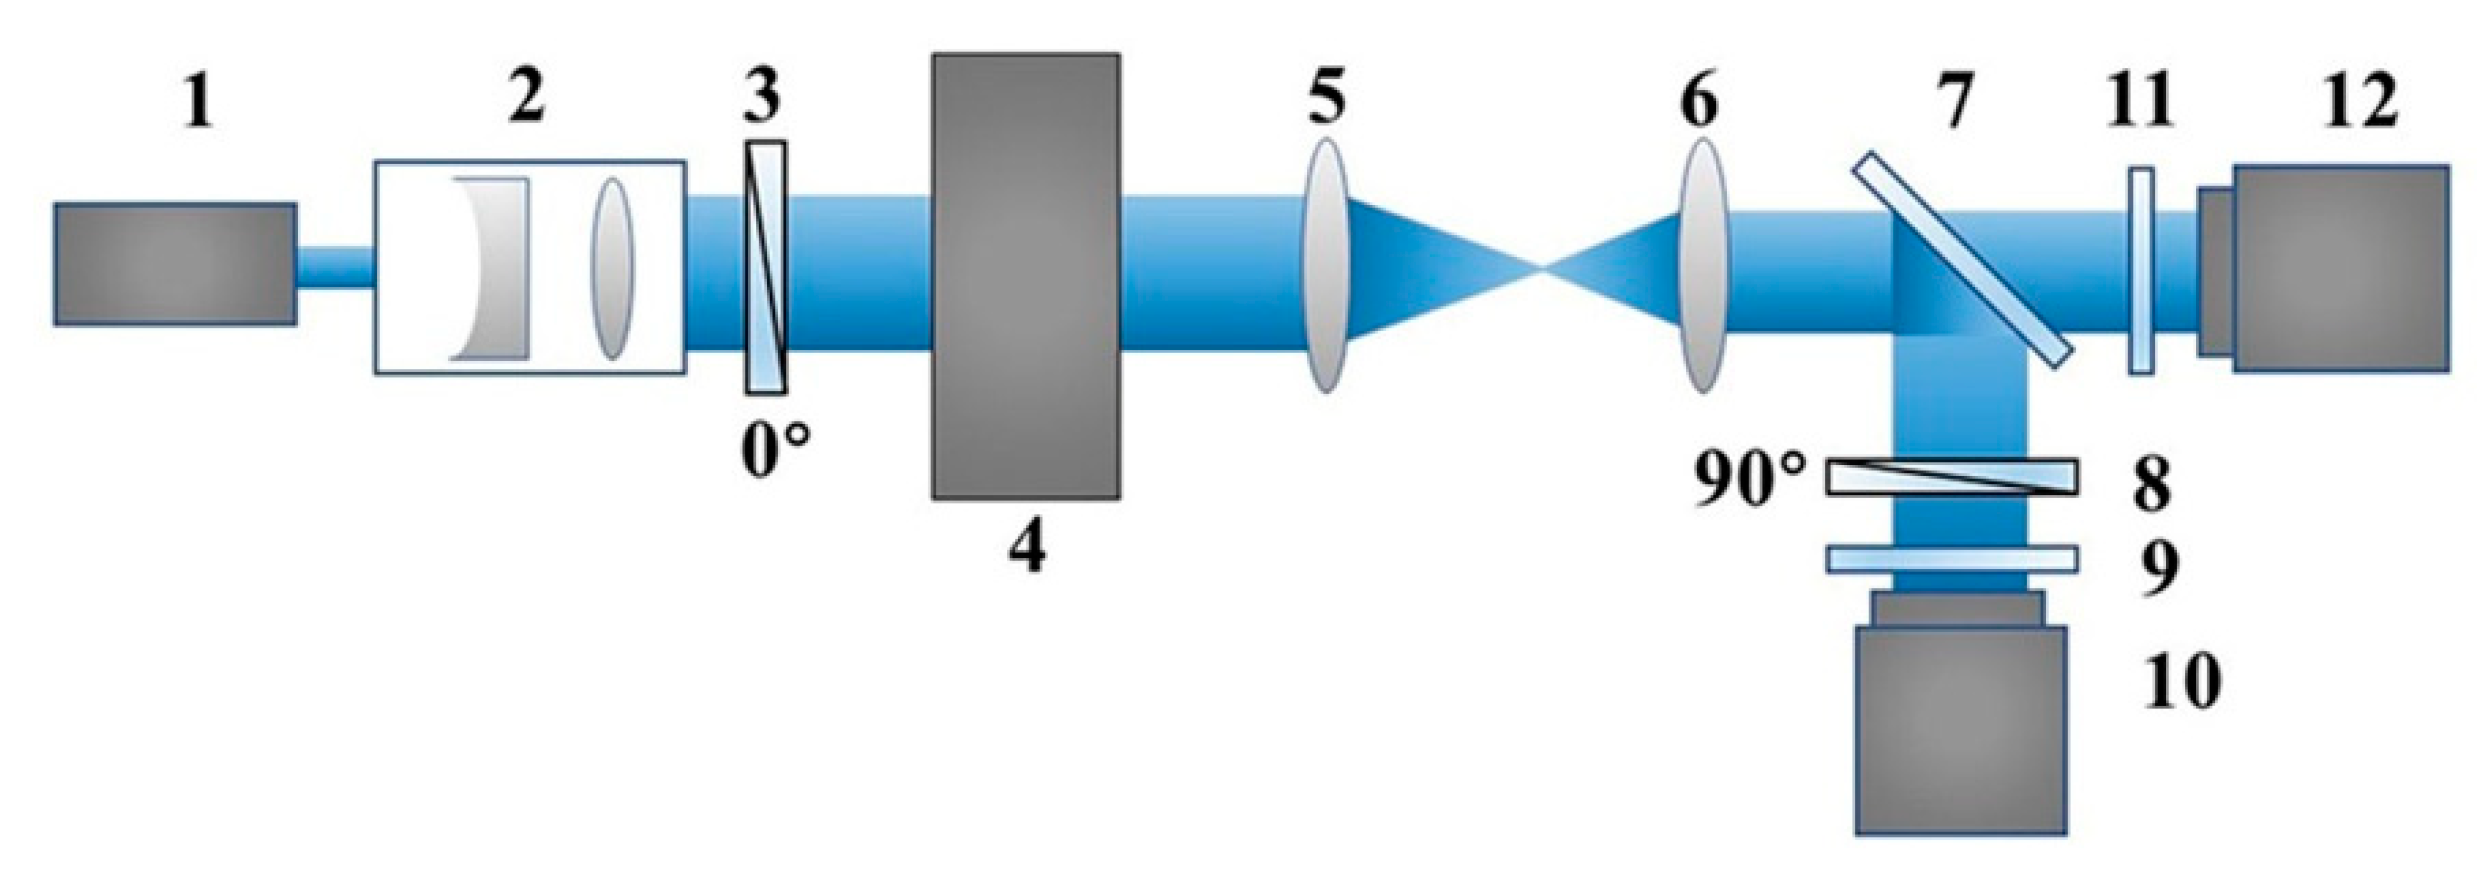
The optical setup in Figure 5 is constructed for on-line monitoring of the phase modulation of the OASLM. A CCD with a spatial resolution of 512 pixels × 512 pixels is used to monitor the OASLM phase modulation and a WFS is used to detect the actual wave-front after the OASLM. In order to achieve phase-only modulation, the relative angle of the optical axis direction between the polarizer and the OALCLV is set to 0° for WFS measurement. The transmittance is measured by the CCD, when the relative angle of the optical axis direction between the polarizer and the OALCLV is set to 45°, and the polarizer and the analyzer are perpendicular to each other.
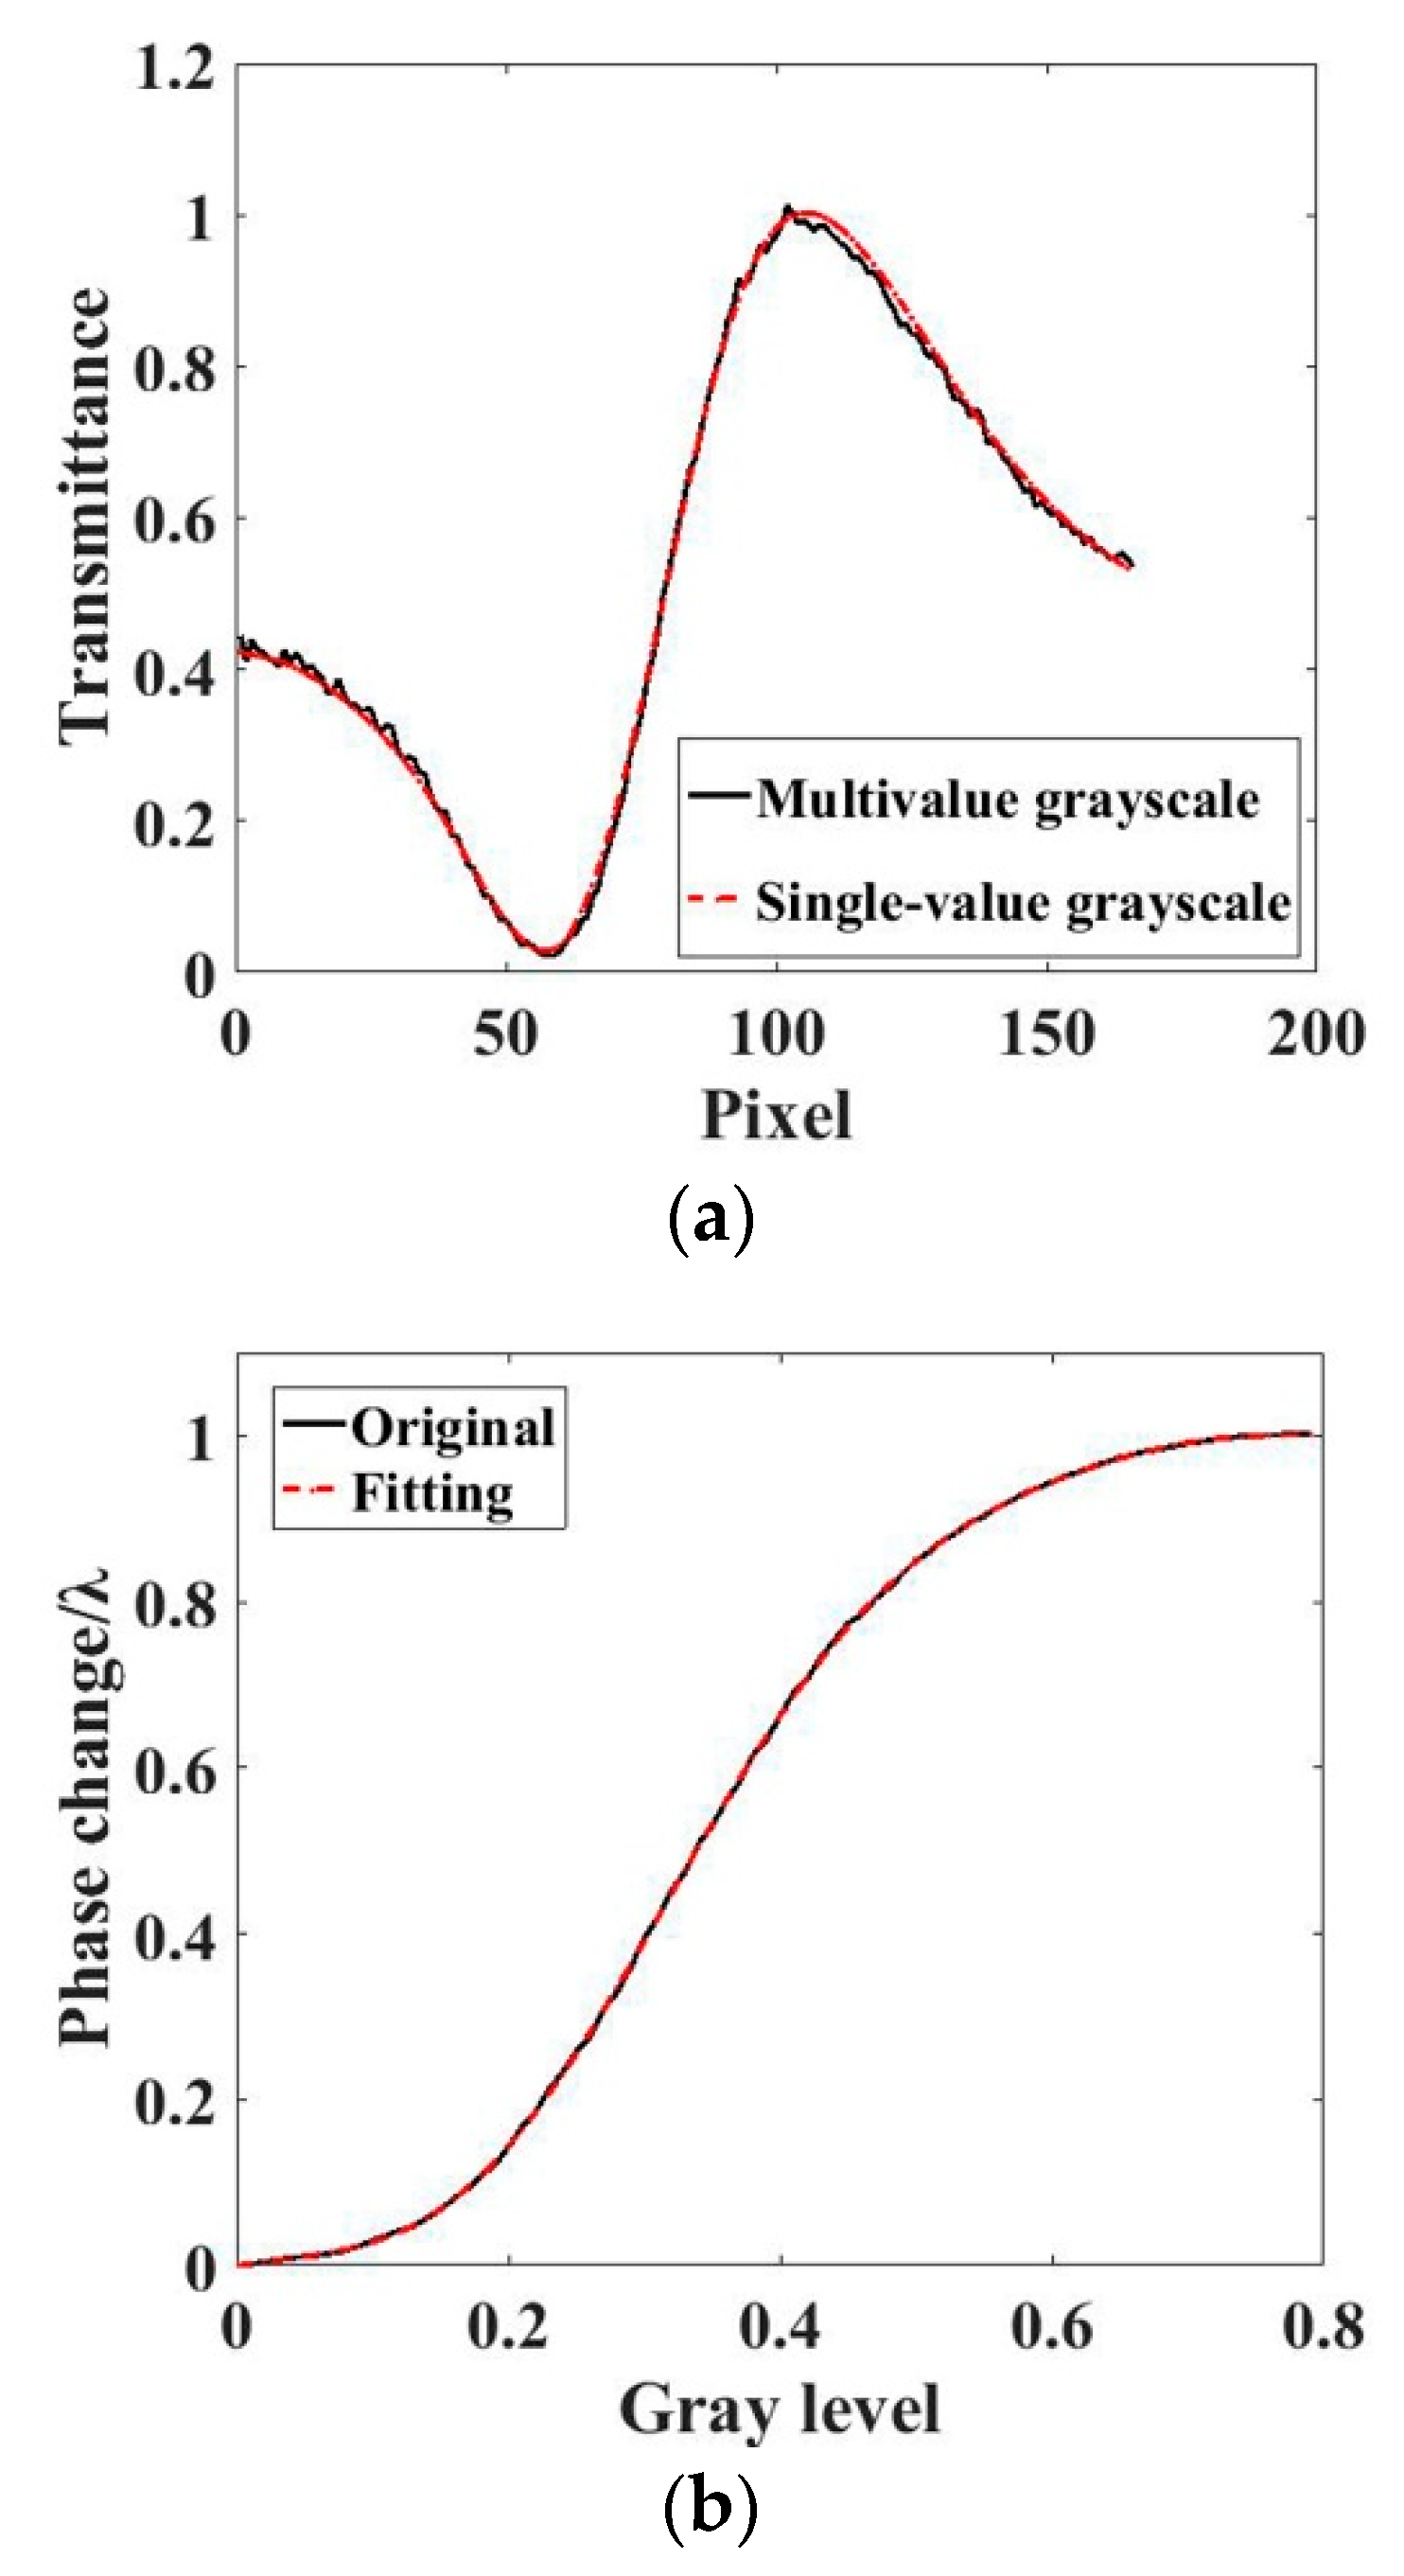
Figure 6a shows the transmittance when the OASLM is subjected to a current of write light of 400 mA and VAC of 14 V at 200 Hz. The red curve in the legend is the transmittance of a single-value grayscale modulation, from which we obtain the phase-change function shown in Figure 6b with a PV value of 1λ. After 8-order polynomial fitting, this function is expressed as follows.
The values of the fitting coefficients are:
In order to further prove that the modulation results of the multi-value grayscale still satisfy the aforementioned relationship, we designed a gray-level ramp image and loaded it onto the OASLM to modulate the laser beam. The black curve in Figure 6a shows the corresponding one-dimensional (1D) transmittance distribution of the central row measured by the CCD, which has good consistency with the red curve.
If we design a wave-front using Equation (4) and the actual modulation of the SLM loading the corresponding grayscale image is consistent with it, then we can assume that the transmittance measured by the CCD can monitor the phase-modulation result because the phase function in Equation (4) is directly derived from the transmittance. Figure 7a depicts a phase distribution designed with Equation (4), Figure 7b is the actual wave-front directly measured by the WFS and Figure 7c is a comparison of the 1D distribution of their central row. The modulated result is in good agreement with our designed wave-front.
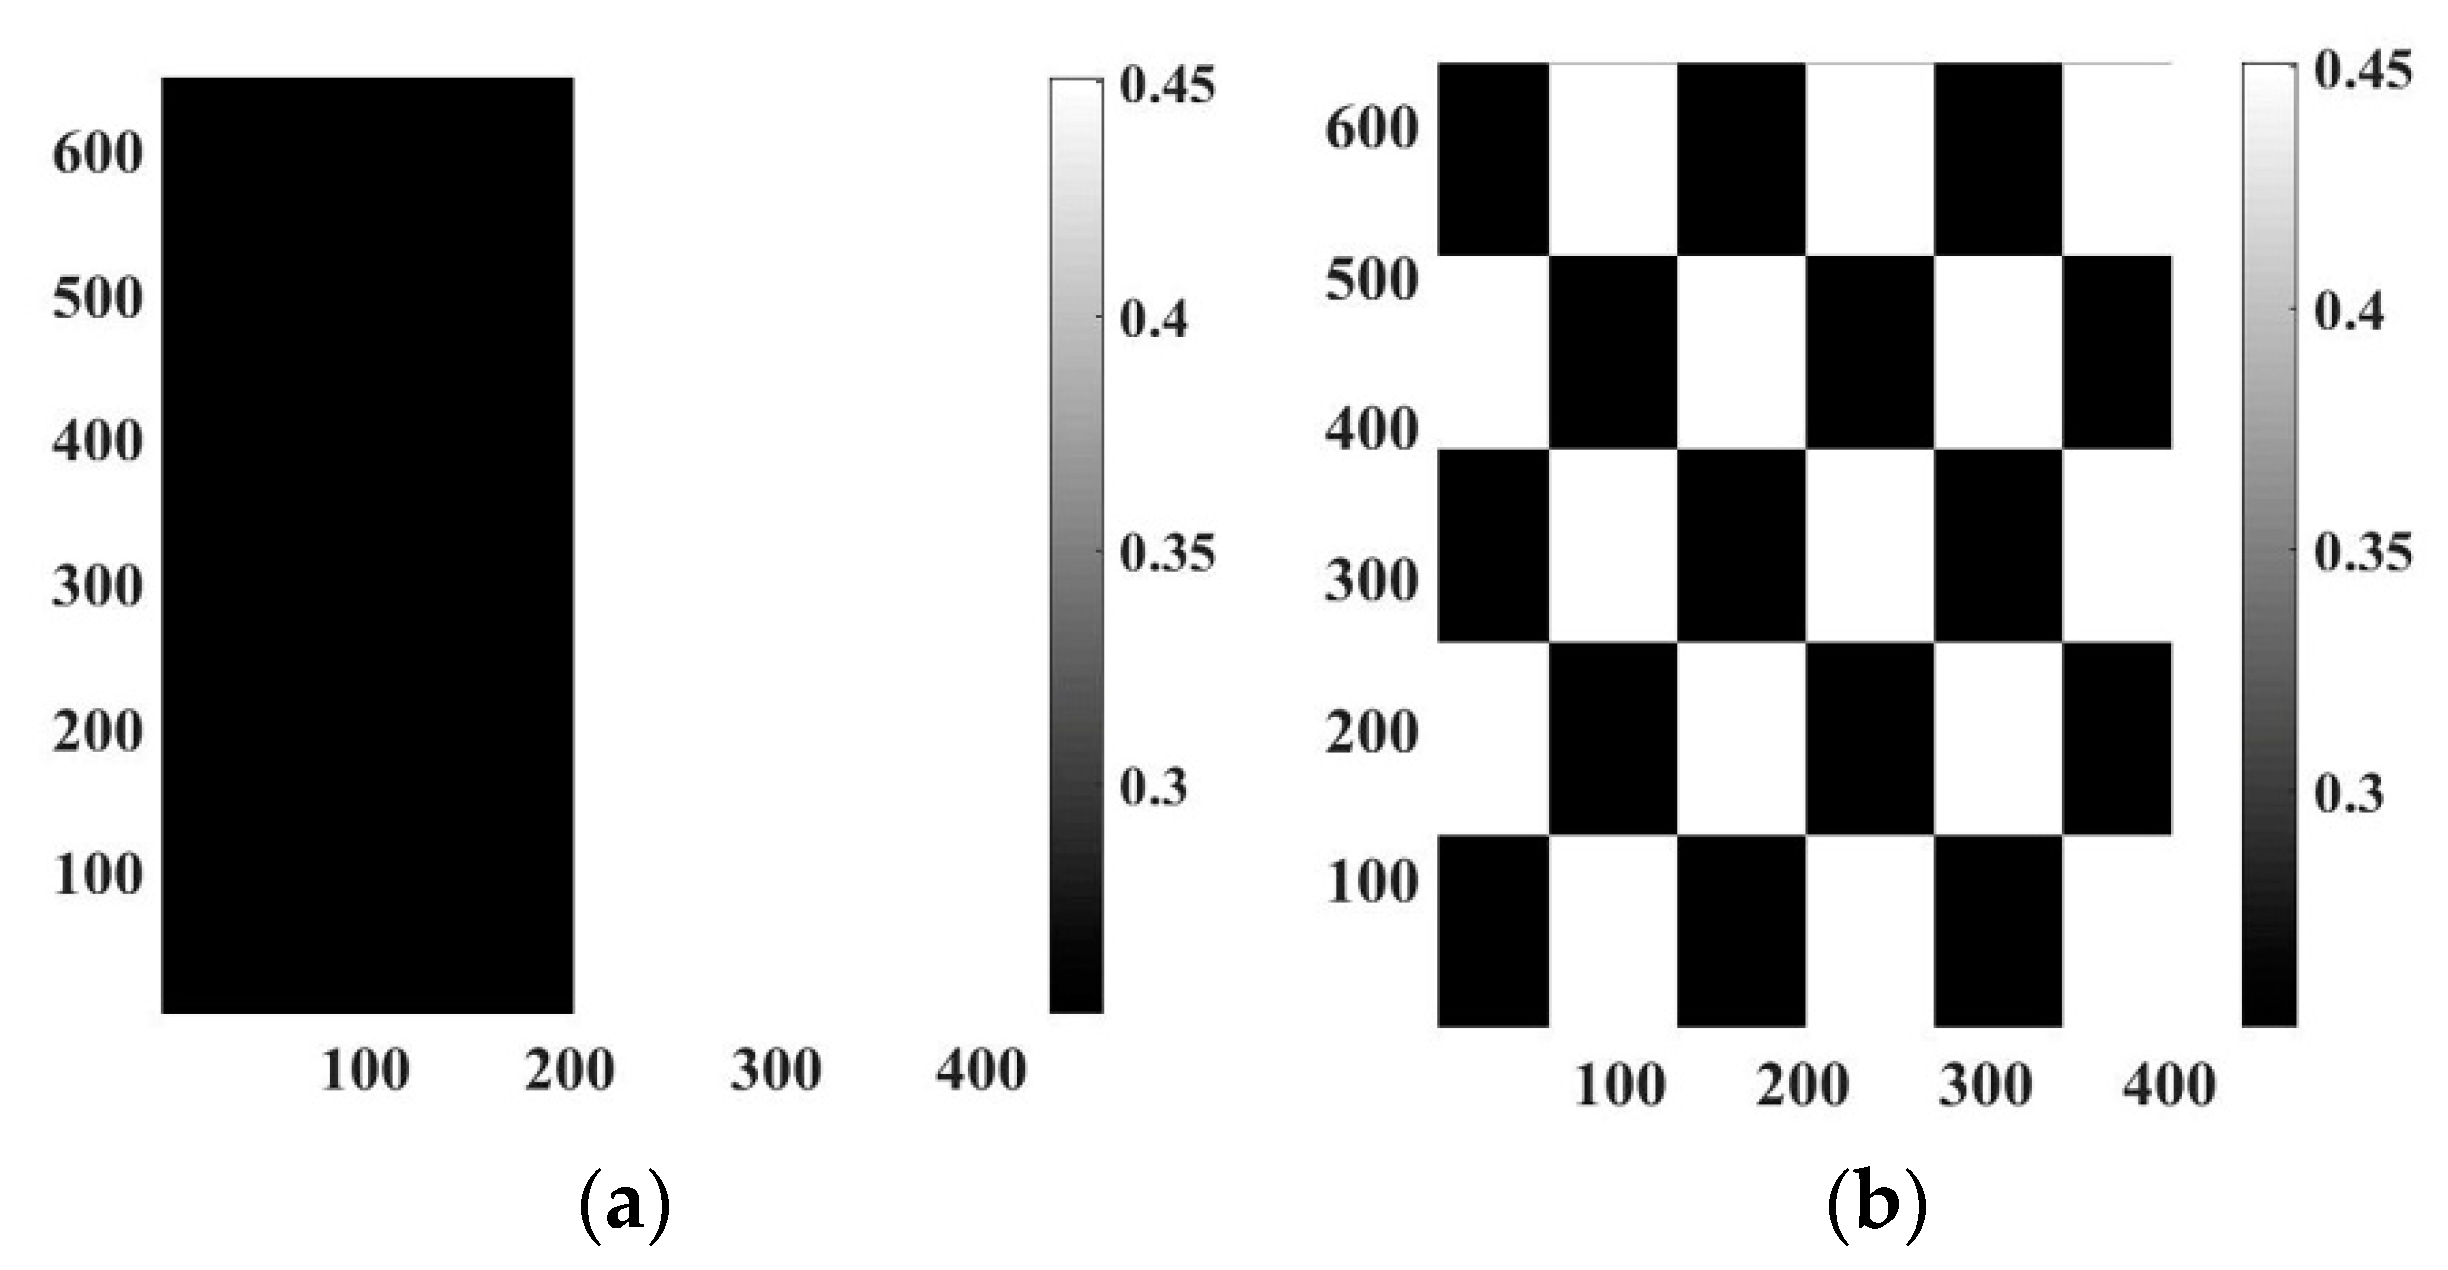
Spatial resolution is also a key parameter of the monitoring system. In Figure 6a, the gray values corresponding to the maximum and minimum values are 0.25 and 0.45, respectively. Therefore, in order to demonstrate the accuracy of the system, we designed binary grayscale images with these two values, and the modulation results obtained by the CCD and WFS are compared with their theoretical values. Figure 8 shows modulation results of the OASLM loading Figure 9a (a binary image with a gray-value mutation). Figure 8a is a comparison between the 1D wave-front results obtained from the WFS and the theoretical distribution. Since the Hartmann wave-front sensor uses the wave-front slope and the wave-front variation to calculate the actual wave-front indirectly, here the modulation result of the binary image exceeds its measurement dynamic range, so the wave-front directly measured has a large recovery error and serious discrepancies compared to the theoretical distribution. Figure 8b is a comparison of the 1D transmittance between the result measured by the CCD and the result deduced from the transmittance gray-level relationship. The two results demonstrate good consistency. This implies that the monitoring system has a good response to the modulation of binary grayscale images.
Furthermore, we loaded a binary image with varying periods on our SLM to determine the spatial resolution of the system; the modulation result is shown in Figure 8c, from which we can see that the spatial resolution is at least 200 µm. In Figure 8d, the normalized MTF can be calculated from the relation . From this we can also obtain the spatial resolution of 5 (period of 200 µm, the value of the MTF is 0). At the same time, we can see that the 1 (period of 1 mm, the value of the MTF is 1) is a division. When the value of the X-axis is larger than this, the MTF curve drops sharply to 0, so the minimum distinguishable contrast is 1 mm.
Figure 9b is a chessboard grayscale image with 70-pixel period in the horizontal direction and 128-pixel (the pixel-pitch of the write-light system is 20 µm) period in the vertical direction. The modulation results are shown in Figure 10. The black lines in (a) and (b) correspond to the transmittance measured by the CCD and are basically consistent with the red lines, the theoretical results of the transmittance gray-level relationship. The black lines in (c) and (d) are the 1D distributions of the wave-front measured by the WFS, which have significant differences compared to the theoretical values deduced from the phase-change function and represented by the red lines. Therefore, the monitoring system plays a very important role in the measurement of the modulation results on-line.
4. Conclusions
We applied an equivalent circuit of the OALCLV to study the influence of driving conditions, including the frequency of drive voltage and irradiance of write light on the voltage of the LC layer; at the same time, we investigated the influence of driving conditions on the modulation ability of the phase-only OASLM. We were able to acquire a PV of phase change of approximately 1λ when the home-made OASLM was at the optimal driving condition. The detection system, including a CCD and WFS, was constructed to monitor the phase-control ability of the OASLM. From the MTF of the monitor system, we got a spatial resolution of 200 μm for modulation measurements and a minimum distinguishable contrast of 1 mm. We found that wave-front on-line modulation with feedback control could be obtained with the OASLM and the corresponding monitoring system.
Author Contributions
Conceptualization, W.F. and D.H.; Methodology, L.P.; Software, L.P.; Validation, W.F., D.H. and L.P.; Formal Analysis, L.P.; Investigation, L.P.; Resources, H.C.; Data Curation, D.H.; Writing-Original Draft Preparation, L.P.; Writing-Review & Editing, W.F. and D.H.; Visualization, W.F.; Supervision, X.L.; Project Administration, W.F.; Funding Acquisition, W.F.
Conflicts of Interest
The authors declare no conflict of interest.
References
- Sala, F.A.; Karpierz, M.A. Modeling of molecular reorientation and beam propagation in chiral and non-chiral nematic liquid crystals. Opt. Express 2012, 20, 13923–13938. [Google Scholar] [CrossRef] [PubMed]
- Chen, C.W.; Brigeman, A.N.; Ho, T.J.; Khoo, I.C. Normally transparent smart window based on electrically induced instability in dielectrically negative cholesteric liquid crystal. Opt. Mater. Express 2018, 8, 691–697. [Google Scholar] [CrossRef]
- Saghaei, T.; Feiz, M.S.; Amjadi, A. Optical spatial phase retarder/modulator by a rotating freely suspended LC film. Opt. Commun. 2016, 380, 442–445. [Google Scholar] [CrossRef]
- Bai, J.; Ge, M.; Wang, S.; Yang, Y.; Li, Y.; Chang, S. Characteristics of a liquid-crystal-filled composite lattice terahertz bandgap fiber. Opt. Commun. 2018, 419, 8–12. [Google Scholar] [CrossRef]
- Huignard, J.P. Spatial light modulators and their applications. J. Opt. 1987, 18, 181–186. [Google Scholar] [CrossRef]
- Aleksanyan, A.; Kravets, N.; Brasselet, E. Multiple-star system adaptive vortex coronagraphy using a liquid crystal light valve. Phys. Rev. Lett. 2017, 118, 203902. [Google Scholar] [CrossRef] [PubMed]
- Peña, A.; Andersen, M.F. Complete polarization and phase control with a single spatial light modulator for the generation of complex light fields. Laser Phys. 2018, 28, 076201. [Google Scholar] [CrossRef]
- Bortolozzo, U.; Dolfi, D.; Huignard, J.; Molin, P.S.; Peigné, A.; Residori, S. Phase modulation detection with liquid crystal devices. Proc. SPIE 2015, 9378, 93781S. [Google Scholar] [CrossRef]
- Shrestha, P.K.; Chun, Y.T.; Chu, D. A high-resolution optically addressed spatial light modulator based on ZnO nanoparticles. Light Sci. Appl. 2015, 4, e259. [Google Scholar] [CrossRef]
- Huang, D.; Fan, W.; Cheng, H.; Xia, G.; Pei, L.; Li, X.; Lin, Z. Wavefront control of laser beam using optically addressed liquid crystal modulator. High Power Laser Sci. Eng. 2018, 6, e20. [Google Scholar] [CrossRef]
- Yamauchi, M.; Marquez, A.; Davis, J.A.; Franich, D.J. Interferometric phase measurements for polarization eigenvectors in twisted nematic liquid crystal spatial light modulators. Opt. Commun. 2000, 181, 1–6. [Google Scholar] [CrossRef]
- Zhang, H.; Zhang, J.; Wu, L. Evaluation of phase–only liquid crystal spatial light modulator for phase modulation performance using a Twyman–Green interferometer. Meas. Sci. Technol. 2007, 18, 1724–1728. [Google Scholar] [CrossRef]
- López-Téllez, J.M.; Bruce, N.C.; Rodríguez-Herrera, O.G. Characterization of optical polarization properties for liquid crystal-based retarders. Appl. Opt. 2016, 55, 6025–6033. [Google Scholar] [CrossRef] [PubMed]
- Aldrich, R.E.; Hou, S.L.; Harvill, M.L. Electrical and Optical Properties of Bi12SiO20. J. Appl. Phys. 1971, 42, 493. [Google Scholar] [CrossRef]
- Lu, K.; Saleh, B.E.A. Complex amplitude reflectance of the liquid crystal light valve. Appl. Opt. 1991, 30, 2354–2362. [Google Scholar] [CrossRef] [PubMed]
- Cao, Z.; Xuan, L.; Hu, L.; Liu, Y.; Mu, Q.; Li, D. Investigation of optical testing with a phase-only liquid crystal spatial light modulator. Opt. Express 2005, 13, 1059–1065. [Google Scholar] [CrossRef] [PubMed]
- López-Téllez, J.M.; Bruce, N.C.; Delgado-Aguillón, J.; Garduño-Mejía, J.; Avendaño-Alejo, M. Experimental method to characterize the retardance function of optical variable retarders. J. Phys. 2015, 83, 143–149. [Google Scholar] [CrossRef]
- López-Téllez, J.M.; Bruce, N.C. Stokes polarimetry using analysis of the nonlinear voltage-retardance relationship for liquid-crystal variable retarders. Rev. Sci. Instrum. 2014, 85, 033104. [Google Scholar] [CrossRef] [PubMed]
- Huang, D.; Fan, W.; Li, X.; Lin, Z. Performance of an optically addressed liquid crystal light valve and its application in optics damage protection. Chin. Opt. Lett. 2013, 11, 072301. [Google Scholar] [CrossRef]
- Aubourg, P.; Huignard, J.P.; Hareng, M.; Mullen, R.A. Liquid crystal light valve using bulk monocrystalline Bi12SiO20 as the photoconductive material. Appl. Opt. 1982, 21, 3706–3712. [Google Scholar] [CrossRef] [PubMed]
Figure 1.
(a) Working principle of the optically addressable spatial-light modulator (OASLM) and structure of the optically addressable liquid-crystal light valve (OALCLV) consisting of the glass substrate, 6-μm-thick liquid crystal (LC), and BSO photoconductor, PI (polyimide, the alignment layer); a reflective liquid crystal on silicon (LCOS) type is used to control the write light, PBS refers to the polarized beam splitter. (b) Phase change of a 6-μm-thick LC cell composed of two glass substrates. The LC has ne = 1.820 and no = 1.515.
Figure 2.
(a) Equivalent circuit of the OALCLV. (b) The voltage values on the LC layer of the OALCLV at the applied voltage of 3.5 V, experimental points and theoretical curves according to Equation (3), for different frequencies of the applied voltage.
Figure 2.
(a) Equivalent circuit of the OALCLV. (b) The voltage values on the LC layer of the OALCLV at the applied voltage of 3.5 V, experimental points and theoretical curves according to Equation (3), for different frequencies of the applied voltage.

Figure 3.
(a) Phase change varies with VAC at 200 Hz when the OALCLV is illuminated by the different write light, the Vrms is the RMS value of the VAC. (b) Phase change varies with VAC when the OALCLV is at the different drive frequencies and the write-light irradiance is 9.6 mW/cm2.
Figure 3.
(a) Phase change varies with VAC at 200 Hz when the OALCLV is illuminated by the different write light, the Vrms is the RMS value of the VAC. (b) Phase change varies with VAC when the OALCLV is at the different drive frequencies and the write-light irradiance is 9.6 mW/cm2.

Figure 4.
(a) Drive current of the write light affects the peak-to-valley (PV) value of the phase change when the OALCLV is at a VAC value of 14 V at 100 Hz. (b) The voltage on the LC layer of the OALCLV as determined by the drive current of the write light.
Figure 4.
(a) Drive current of the write light affects the peak-to-valley (PV) value of the phase change when the OALCLV is at a VAC value of 14 V at 100 Hz. (b) The voltage on the LC layer of the OALCLV as determined by the drive current of the write light.

Figure 5.
Optical setup used to measure the modulated wave-front. 1, 1053 nm continuous-wave Laser; 2, expander; 3, polarizer; 4, OASLM; 5, lens1, f1 = 150 mm; 6, lens2, f2 = 100 mm; 7, partially reflective mirror; 8, analyzer; 9, filter; 10, CCD; 11, filter; 12, wave-front sensor (WFS) (Physics Co., France, the spatial resolution is 29.6 μm).

Figure 6.
(a) Transmittance as a function of the grayscale. (b) Phase change as a function of the grayscale.
Figure 6.
(a) Transmittance as a function of the grayscale. (b) Phase change as a function of the grayscale.

Figure 7.
Comparison of the designed wave-front and the actual one. (a) Wave-front designed using Equation (4). (b)Actual wave-front measured by the WFS. (c) Comparison of the central row one-dimensional (1D) distribution.
Figure 7.
Comparison of the designed wave-front and the actual one. (a) Wave-front designed using Equation (4). (b)Actual wave-front measured by the WFS. (c) Comparison of the central row one-dimensional (1D) distribution.

Figure 8.
Modulation results of grayscale map with value mutation. (a) 1D wave-front. (b) 1D transmittance. (c) The modulated result obtained by CCD when the spatial-light modulator (SLM) is loaded with a binary image of varying variable periods. 1, 760 µm; 2, 520 µm; 3, 440 µm; 4, 320 µm; 5, 240 µm; 6, 200 µm; 7, 120 µm. (d) Modulation transfer function (MTF) of the OASLM as a function of spatial resolution.

Figure 9.
Binary images with gray values of 0.25 and 0.45. (a) 1D value change binary image. (b) Two-dimensional (2D) value change binary image.
Figure 9.
Binary images with gray values of 0.25 and 0.45. (a) 1D value change binary image. (b) Two-dimensional (2D) value change binary image.

Figure 10.
(a) 1D transmittance in the horizontal direction. (b) 1D transmittance in the vertical direction. (c) 1D wave-front in the horizontal direction. (d) 1D wave-front in the vertical direction.
Figure 10.
(a) 1D transmittance in the horizontal direction. (b) 1D transmittance in the vertical direction. (c) 1D wave-front in the horizontal direction. (d) 1D wave-front in the vertical direction.

© 2018 by the authors. Licensee MDPI, Basel, Switzerland. This article is an open access article distributed under the terms and conditions of the Creative Commons Attribution (CC BY) license (http://creativecommons.org/licenses/by/4.0/).
Share and Cite
MDPI and ACS Style
Pei, L.; Huang, D.; Fan, W.; Cheng, H.; Li, X. Phase-Only Optically Addressable Spatial-Light Modulator and On-Line Phase-Modulation Detection System. Appl. Sci. 2018, 8, 1812. https://doi.org/10.3390/app8101812
AMA Style
Pei L, Huang D, Fan W, Cheng H, Li X. Phase-Only Optically Addressable Spatial-Light Modulator and On-Line Phase-Modulation Detection System. Applied Sciences. 2018; 8(10):1812. https://doi.org/10.3390/app8101812
Chicago/Turabian StylePei, Lili, Dajie Huang, Wei Fan, He Cheng, and Xuechun Li. 2018. "Phase-Only Optically Addressable Spatial-Light Modulator and On-Line Phase-Modulation Detection System" Applied Sciences 8, no. 10: 1812. https://doi.org/10.3390/app8101812
Note that from the first issue of 2016, this journal uses article numbers instead of page numbers. See further details here.