Online Identification of Shearer Cutting State Using Infrared Thermal Images of Cutting Unit


1
School of Mechatronic Engineering, China University of Mining & Technology, Xuzhou 221116, China
2
Jiangsu Key Laboratory of Mine Mechanical and Electrical Equipment, China University of Mining & Technology, Xuzhou 221116, China
*
Author to whom correspondence should be addressed.
Appl. Sci. 2018, 8(10), 1772; https://doi.org/10.3390/app8101772
Submission received: 6 August 2018
/
Revised: 20 September 2018
/
Accepted: 21 September 2018
/
Published: 30 September 2018
Abstract
:In order to achieve accurate identification of a shearer cutting state, infrared thermal images were creatively adopted in this paper. As the position of a shearer cutting unit is constantly changing, and the temperature in the vicinity is obviously distinct, mathematical morphology theory was used to detect the cutting unit in an infrared thermal image. Furthermore, a target tracking method is put forward to achieve cutting unit tracking based on the combination of morphology and a spatio-temporal context (STC) algorithm. Then, the temperature field features of this tracking area were extracted, and an intelligent classifier based on a support vector machine (SVM) was constructed to identify the cutting state of the shearer. Some experiments are presented, and the results indicate the feasibility and superiority of the proposed method.
1. Introduction
At the longwall face, the shearer is an important piece of equipment, because it is responsible for cutting the coal and discharging the cut coal onto the armored face conveyor. The intelligence level of the shearer directly determines the mining efficiency of coal resources, and even affects the safety of coal miners and the service life of shearers. Theory and practice indicate that the accurate identification of a shearer cutting state is the prerequisite of, and basic guarantee for, achieving intelligent control of the shearer. Therefore, it is necessary to further study recognition technology for shearer cutting states [1].
Domestic and foreign scholars mainly focus on coal and rock recognition which is specific to the identification method of cutting states; this mainly includes γ ray detection [2], temperature detection of cutting picks [3], the vibration detection method [4,5], radar detection method [6], and so on. In recent years, many other methods have also been developed. In Reference [7], a coal and rock identification technology based on a Gaussian hybrid clustering algorithm was proposed according to the different characteristics of coal and rock. Tian L.Y. et al. [8] adopted the grey prediction theory, and put forward a comprehensive coal and rock identification method based on the force analysis of the shearer rocker-arm idler shaft. In Reference [9], the dual-tree complex wavelet transform was used to decompose the coal and rock images on multiple levels, and a coal and rock recognition method based on the statistical modeling of a dual-tree complex wavelet domain was proposed. In Reference [10], several signals of vibration, resistance moment, and the motor current of the shearer cutting coal wall were fused, and the coal and rock identification model was established. Furthermore, Xu J. et al. [11,12] put forward a cutting pattern recognition method based on the sound signal of a shearer cutting a coal wall, and achieved good simulation results. However, due to the poor working environment of a coal-mining face and the complex geological condition of coal seam, the above methods are still at the stage of theoretical research and laboratory tests, and application effects are unsatisfactory, which cannot meet the requirements of intelligent control for shearers.
During the coal-cutting process, the shearer cutting drum, as a roller, comes into direct contact with the coal wall. There is a strong impact and violent friction between them, resulting in huge friction heat, which leads to a change in temperature in the area near the cutting unit. The friction between the roller and the coal wall, both with different characteristics, generates distinct heat, so that the temperature of the coal wall is also different after cutting. Infrared thermal imaging technology has the characteristics of strong interference immunity, good target recognition ability, and easy collection, and has been widely used in military reconnaissance [13], video surveillance [14,15], nondestructive testing [16,17,18,19], medical inspections [20,21,22], fault diagnosis [23,24,25,26], and so on [27,28]. In Reference [29], the authors described the use of thermal infrared-based sensing to provide a means to automatically measure the vertical position of the mining machine with respect to the coal seam. Therefore, an infrared thermal imaging instrument is used to collect the infrared thermal imaging video near the shearer cutting unit, and then the temperature field characteristics of the key area in the image are extracted to achieve the cutting state recognition of the shearer.
This study shows that the temperature change near the shearer cutting unit is more sensitive to the properties of coal and rock. However, the location of the cutting unit varies with the distribution of the coal seam. In order to realize online identification of the shearer cutting state, the location of the cutting unit in the infrared video must be tracked in real time. Many scholars have devoted a lot of research to the field of image tracking, and have achieved satisfying results [30,31,32,33]. Most of the target-tracking methods adopt a filtering algorithm to find objects with high similarity to targets. However, when the position of the target changes or disappears, the target cannot be tracked accurately, and the tracking effect is also slightly insufficient. In this paper, a tracking method based on a combination of morphology and spatio-temporal context is put forward to track the location of a shearer cutting unit using infrared thermal-imaging video, allowing the characteristics of the temperature field in the tracking area to be obtained.
Finally, an intelligent classifier should be established to achieve the efficient recognition of the shearer cutting state. Various artificial intelligence pattern recognition techniques have been widely used for fault detection or condition monitoring, such as artificial neural networks [34], adaptive neuro-fuzzy inference systems [35], support vector machines (SVMs) [36], and so on. SVMs have good generalization abilities and robust performance under small sample conditions. They can effectively avoid the problems of overlearning, local minimum, nonlinearity, and dimension disasters which are found in traditional statistical methods [37]. In this paper, a SVM classifier is constructed based on extracted feature vectors to automatically identify the cutting state of a shearer. Experiments were performed to verify the applicability and effectiveness of the proposed method.
The rest of this paper is organized as follows. In Section 2, the location detection of the shearer cutting unit is presented in infrared thermal images. Section 3 introduces the tracking method based on the combination of morphology and spatio-temporal context. In Section 4, the online identification system for a shearer cutting state is provided. In Section 5, the experimental results for the proposed shearer-cutting-state recognition method are discussed. Finally, conclusions are summarized in Section 6.
2. Shearer Cutting Unit Detection in Infrared Thermal Images
In the mining process of a shearer, the cutting unit motor drives the roller to achieve coal breaking. The cutting load is very high, resulting in faster temperature rise of the cutting part. Meanwhile, the drastic friction between the roller and coal wall produces a large amount of heat, which makes the temperature of the whole cutting unit higher than that of the surrounding objects. When the shearer is in different cutting states, the temperature change of the cutting unit is very sensitive, and can be called a sensitive region. Therefore, the first step of our proposed method was to detect this sensitive region in an infrared thermal image based on mathematical morphology theory.
2.1. The Basic Theory of Mathematical Morphology
In image processing, morphology takes the morphological features of an image as its processing object, and describes the relationships among elements and parts in the image. When dealing with the related morphological features, the image region can be operated logically by using a structured element that can be segmented and extracted for various morphologies, making it easier to detect and identify the active parts in the image. As a field operation, the morphology of the image combines the structural elements with the pixels by logic operation. The output image is the result of the interaction between the structural element and the original image. In the morphology algorithm, corrosion and swell are two basic operations, as shown in Figure 1.
The corrosion operation reduces or refines the objects in the image, and can be regarded as a morphological filter. Some unimportant image details (smaller than a structural element) are removed so that key information elements can be retained. The swell operation will increase or coarsen the image objects, so that the key elements can be amplified to obtain more complete details.
Image morphology operations can be represented by mathematical set theory. Assuming that set B is a structural element, the corrosion of set B to set A can be defined as:
where z is a point in set A and (B)z is the translation of the central point of set B according to point z = (z1, z2). If B is completely contained by A, then this point is marked as a point of the new set; otherwise, the point will not belong to the new set.
Analogously, the swell of set B to set A can be defined as:
where is the reflection of set B, which can be obtained by the transformation from (x, y) to (−x, −y) of each point in set B. ()z is also the translation of the central point of set according to point z = (z1, z2). Some points covered by the translation of set will form a new set; this process is the swell of B to A.
2.2. Feature Capture of a Shearer Cutting Unit in Infrared Thermal Images
The infrared image of cutting a coal wall obtained through an infrared thermal imager demonstrates strong temperature information features. Therefore, this characteristic can be combined with morphology theory to capture the location features of a shearer cutting unit; the flowchart of this process is shown in Figure 2.
2.2.1. Binarization Processing
By setting the gray value of pixels in an image to 0 or 255, a binary image can be obtained. The amount of information in the image is greatly reduced, making the object features more obvious. Since the image is segmented, many pixels with similar gray values collectively form a specific region. For example, there is a distinct difference between the gray values of different objects, so we can reset the gray values of image pixels by a given threshold value. Because the infrared thermal image in this paper used the iron-red color palette, the rgb2gray function of MATLAB was first applied to gray-scale processing, and then the im2bw function was used to achieve binarization. The binarization result of an infrared thermal image is shown in Figure 3.
2.2.2. Morphological Corrosion and Swell
Through a corrosion operation, the insensitive area in the binary image can be removed, and the sensitive area (also called the ‘object area’) is reduced, as shown in Figure 4a. The reason is that the objects featured in infrared thermal images are not concentrated enough after binarization processing. There are not enough remaining points after the corrosion operation to reflect the whole object. So, we need to treat them with the morphological swell, the result of which is shown in Figure 4b. In addition, structural elements have a significant influence on corrosion and expansion effects, so suitable structural elements need to be selected for different images according to many simulations.
After the above processing, the position of the pixels in the image can be analyzed to detect and obtain the approximate position of the cutting unit, which can provide a powerful guarantee for subsequent processing.
2.2.3. Location Detection
In Section 2.2.2, the features of a shearer cutting unit are listed, but these features cannot fully represent the shape and accurate position of the cutting part. In this paper, the minimum enclosed rectangle method was used to measure the features in the image; as such, the location of the shearer cutting unit could be reasonably determined. The concrete steps are as follows:
- (1)
- First, we used the bwlabel function in MATLAB to search the connected components in the image, that is, the white block area or the cutting-unit features.
- (2)
- Then, the regionprops function was used to measure the properties of the white block area, and the BoundingBox function was used to make the minimum rectangle containing all cutting-unit features. The location information of the rectangle in the image could be obtained, which was a 1 × 4 matrix of [a, b, c, d]. Then, the position of the shearer cutting unit in the image processed by morphology could be roughly determined, as shown in Figure 5. In the matrix, a and b are the coordinates of point B in the image, and c and d are the length and width of the matrix, respectively.
3. Shearer Cutting Unit Tracking in Infrared Thermal Images
In order to achieve the online identification of a shearer cutting state, the position of the cutting unit in the infrared video must be tracked in real time so that cutting-temperature-characteristic information can be accurately extracted. In this paper, on the basis of the location detection of the cutting part, a space-time context algorithm was utilized to achieve cutting unit tracking.
3.1. Spatio-Temporal Context (STC) Target Tracking Algorithm
The core of the STC algorithm is to make full use of the STC information in the image sequence to track the target. By using the coherent information of time and space in a video image, any tracking problem can be described as a probability matter, in that the prediction target may appear at all locations in the scene. Thus, a confidence map can be calculated to represent the likelihood ratio of the predicted target location, as follows:
where x represents the predicted target location, and o denotes the STC information. Therefore, the location x* that makes the maximum value of confidence map c(x) is the target location predicted in the next frame. In addition, I(z) is the grayscale of point z and represents a local region of target x*.
Seen from Formula (3), the confidence map c(x) can be divided into two parts. First, the conditional probability establishes the spatial relationship between the target and the context information, which is called the spatial context model. The second part is the context priori probability of each point x in the modeling region. Conditional probability needs to be learned in advance. The schematic diagram of the STC tracking algorithm can be shown in Figure 6.
3.1.1. Spatial Context Model
The conditional probability function of the spatial context model can be defined as follows:
is a function that describes the relative distance and direction of the target x and local context location z, which can be obtained by continuous learning, and is constantly updated with the tracking of the target. In addition, is not a radial symmetric function. It can analyze the spatial relationship between the target and the local context, and solve the two heterogeneous problems of close-range similar target.
3.1.2. Context Priori Model
The priori probability of a context prior model can be defined as follows:
where I(z) represents the surface features of the pixels in the tracking context area, and is a weighting function. If point z in the region is closer to target x, the weight will be larger. The weight function is defined as:
where a is a normalized parameter, which can limit the range of prior probability to [0, 1], and σ represents a scale coefficient.
3.1.3. Confidence Map
The confidence map of the target location is defined as:
where b is also a normalized parameter, α is a scale coefficient, and β is a shape coefficient. Too large or too small β values lead to poor tracking results. Through a lot of tests, it was determined that when β was set to 1, the tracking effect was most stable.
3.1.4. Fast Learning of the Spatial Context Model
By merging Equations (3)–(5) and (7), the following formula could be obtained.
The convolution operation in the time domain can be converted into product calculation in the frequency domain by fast Fourier transform (FFT) so as to reduce computation. Therefore, Formula (8) can be changed to:
The spatial context model can be obtained through two FFTs and one inverse FFT.
In the t frame of a video, the spatio-temporal context model is updated through training the spatial context model , and is used to detect the location of the target in the t + 1 frame. In the image of the t + 1 frame, the local context area is delineated by the tracking position in the t frame, and the corresponding context feature set is formed as . The target location in the t + 1 frame is determined by the maximum likelihood estimation of the new confidence map.
The updating of the spatio-temporal context model is achieved as:
where ρ is the learning rate parameter.
The location of the target in the t + 1 frame is:
where the confidence map ct+1(x) in the t + 1 frame can be expressed as:
3.2. Shearer Cutting Unit Tracking Based on Combination of Morphology and STC
As per the analysis in Section 3.1, the STC algorithm was based on the relationship between the target and its surrounding space in the previous frame to find the location of the target in the next frame. Although the algorithm has good tracking ability for partial occlusion and deformation, the target is lost and cannot be found again if it is completely blocked, or its scale is changed significantly. In addition, the algorithm needs to locate the target ahead of time in order to achieve subsequent target tracking. Therefore, in order to improve the applicability of STC, this paper combines morphology and the STC algorithm to achieve the online tracking of a cutting unit during the shearer working process.
The flowchart of the shearer cutting unit tracking method is shown in Figure 7. Firstly, the initial location of the shearer cutting unit in the t − 1 frame image is obtained by morphology, and then the STC is utilized to automatically track the cutting unit in the t frame image. The new morphological positioning is carried out again when the maximum likelihood estimation value of the confidence map is lower than the threshold. The new location of the cutting unit is determined again, and re-tracking can be achieved.
4. Online Identification System of a Shearer Cutting State
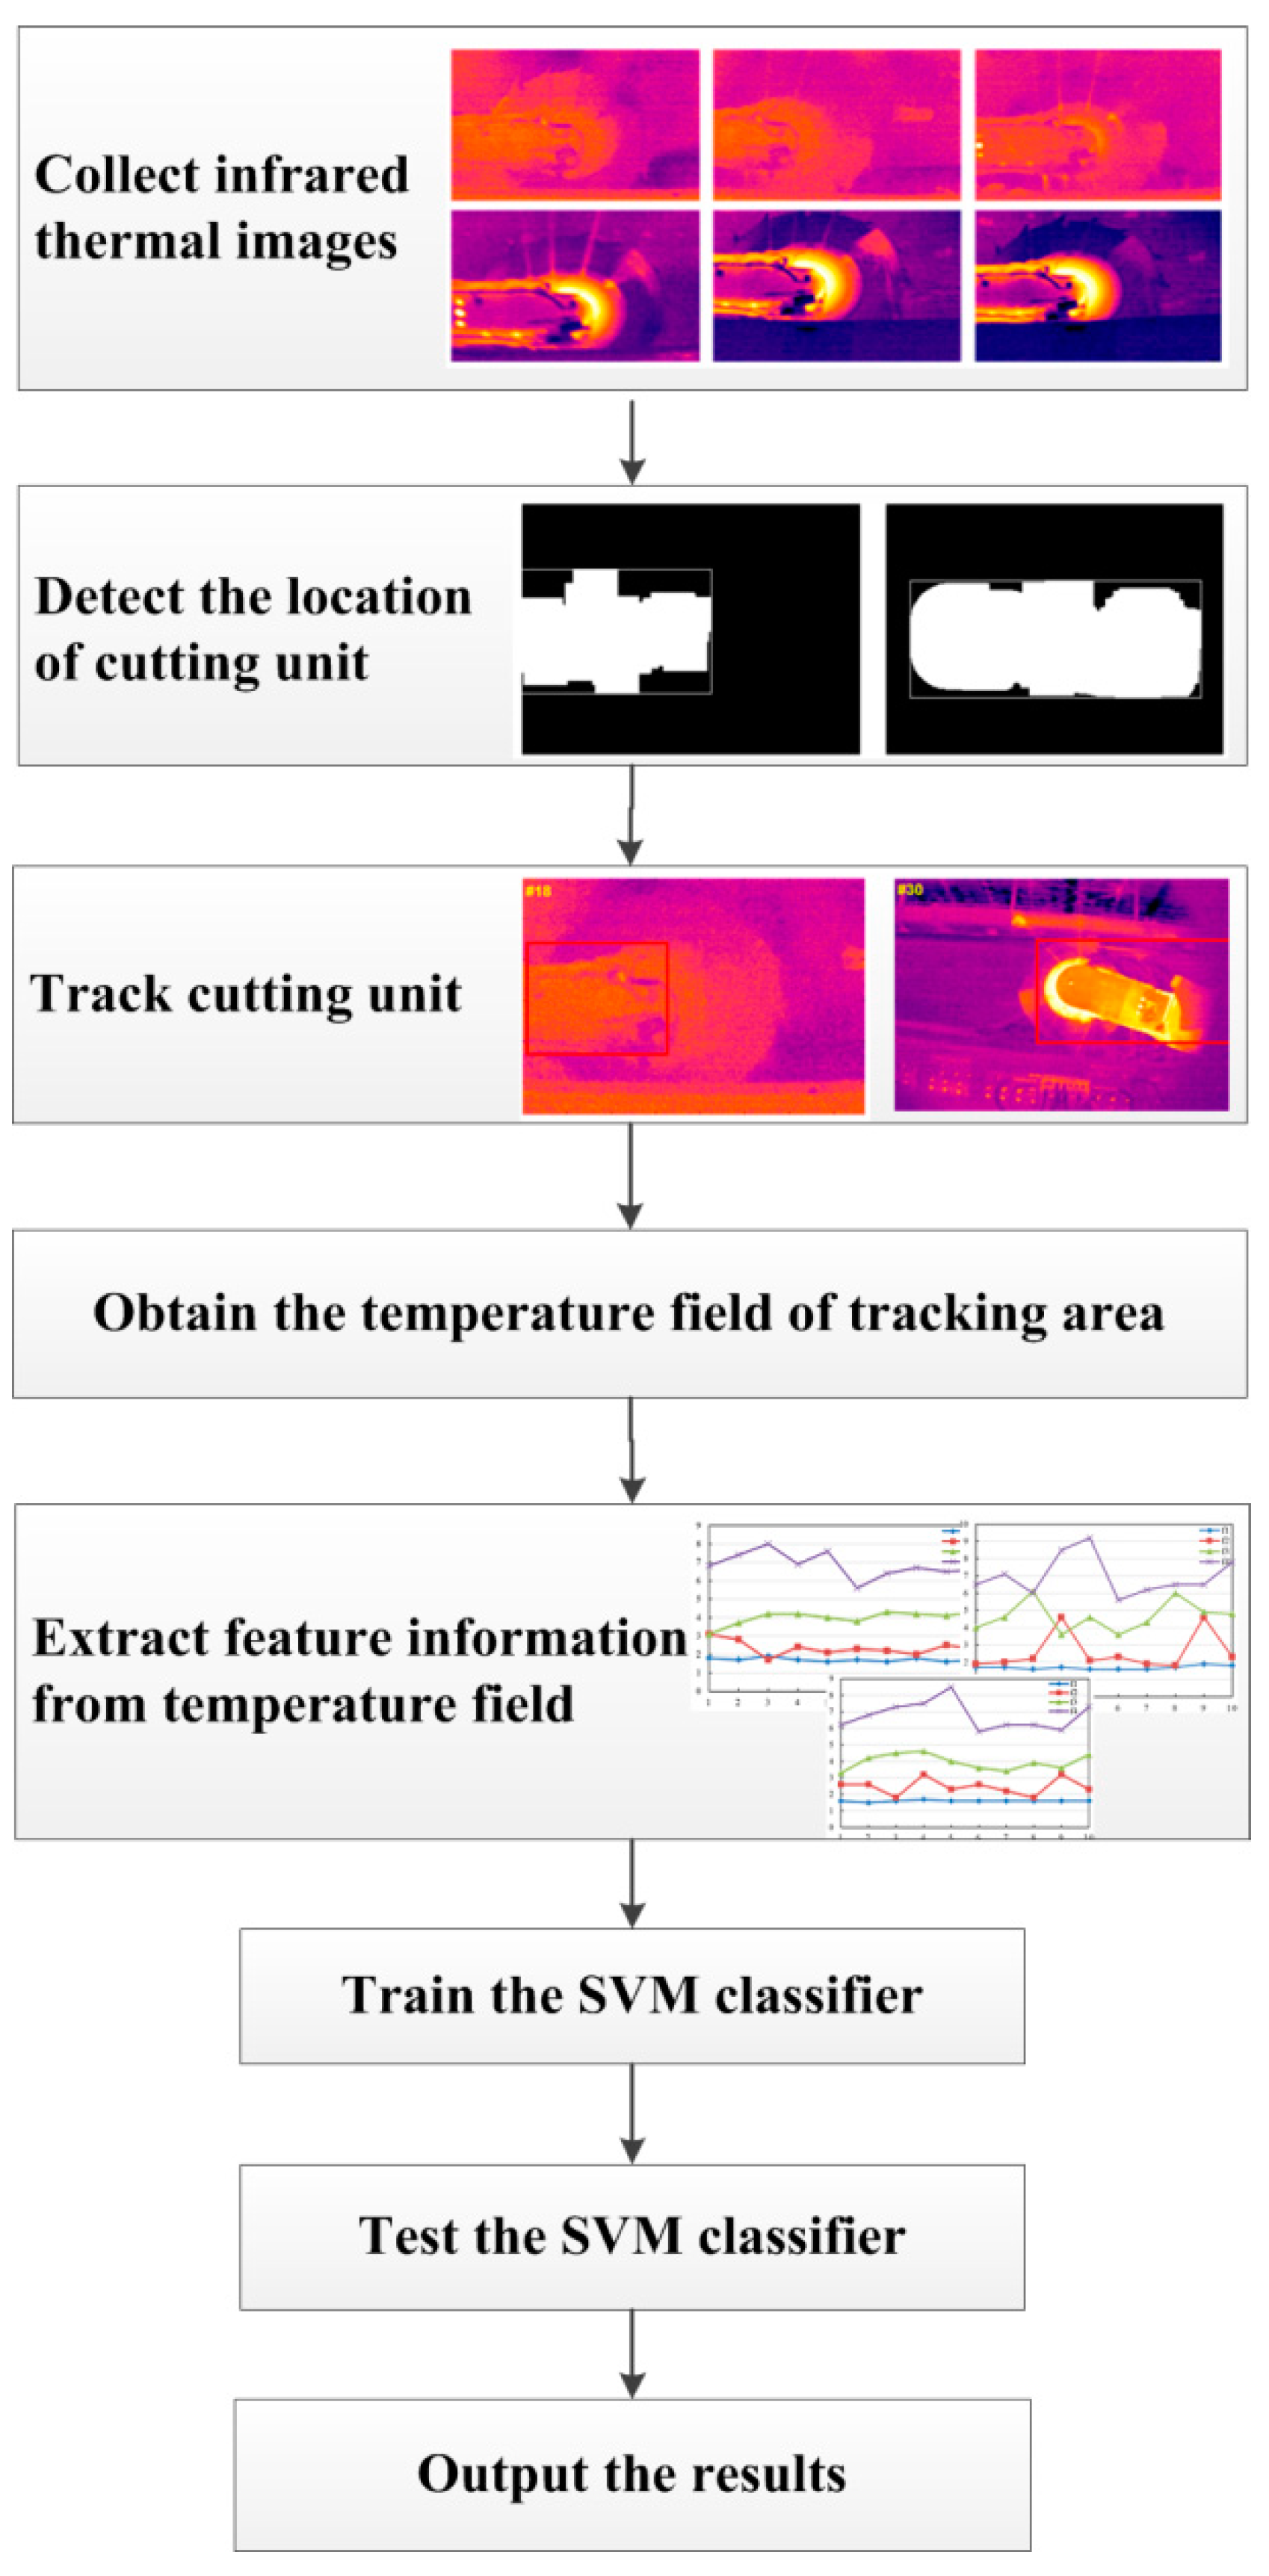
After the location and tracking of a shearer cutting unit in infrared thermal images, the infrared-image information of a shearer cutting coal at any time can be obtained, which contains a large amount of temperature information between the cutting unit and coal wall. Through the feature extraction of this temperature field and an intelligent classification algorithm such as SVM, online recognition of the shearer cutting state can be scientifically realized. In general, the online recognition system of a shearer cutting state can be illustrated as Figure 8.
5. Experiment Validations
5.1. Construction of Experiment Platform
In order to collect an infrared thermal-imaging video that is more consistent with actual working conditions, a self-designed experimental system for a shearer cutting coal was set up in Figure 9, which mainly contains a shearer, simulated coal wall, infrared thermal imager, and data acquisition software. When the shearer was cutting the coal wall, the dust cloud was very large and it was difficult for the personnel to get close. In this experiment, the model of the infrared thermal imager is MAG32, which has high image clarity and temperature sensitivity. It is widely used in industrial detection, research and development, on-line detection, human body temperature measurement, and other fields. MAG32 can realize automatic focusing, and can automatically correct emissivity, background temperature, input transmittance, and atmospheric transmittance, so that the measured temperature data is more accurate, and can display the punctuation temperature in real time. In the platform, the infrared thermal imager was fixed on a long rod to be close to the coal wall and collect the infrared thermal imaging signal. The shearer model is MG500/1130-AWD, the total installed power is 1130 KW, and the power of each cutting motor is 500 KW. The drum diameter is 1.2 m and the traction speed is set to 2.5 m/min during the experiment. Normally, the shearer is equipped with some water sprays for cooling cutting bits and dust suppression, and the spray pressure is 1 MPa. The length of the coal wall is 70 m and the height is 3 m. It was composed of four parts according to the Protodikonov’s hardness coefficient f, i.e., f = 1~2, f = 2~3 f = 3~4 and f = 4~5. Thus, the shearer mainly contained four cutting patterns, represented by F1, F2, F3 and F4, respectively.
In this paper, we simulated four typical harnesses of coal seams and the shearer was cutting only one type of material at a time with constant traction speed and drum height. The center height of the front drum was aligned with the center of the coal seam and the trailing drum was tangent to the bottom floor. An infrared thermal imager was used to observe the temperature changes when shearers cut each type of coal seam. In the obtained infrared thermal-imaging video, the iron-red was selected as the output color to better reflect the appreciation. The pixel size of the video was 384 × 288 and the rate was one frame per second. Some infrared thermal imaging-video screenshots of the shearer cutting a coal wall are shown in Figure 10.
5.2. Parameters Selection
In the proposed identification system, the real-time tracking of the cutting unit in infrared thermal images is the premise for accurate recognition of the shearer cutting state. A reasonable selection of parameters has great influence on the tracking effect, including the binarization threshold T1, the structure element [a1, b1] of the corrosion operation, the structure element [a2, b2] of the swell operation, and the maximum likelihood probability threshold T2.
- (1)
- Selection of parameter T1
In order to select a suitable T1, many experiments have been conducted, and some of the experimental results are shown in Figure 11. When T1 was set to 0.5, the cutting-unit characteristics in the binarization image were more distinct, and it had a better auxiliary effect on the following morphological processing. Therefore, T1 = was set as 0.5 in the following experiments.
- (2)
- Selection of parameters a1, b1, a2, and b2
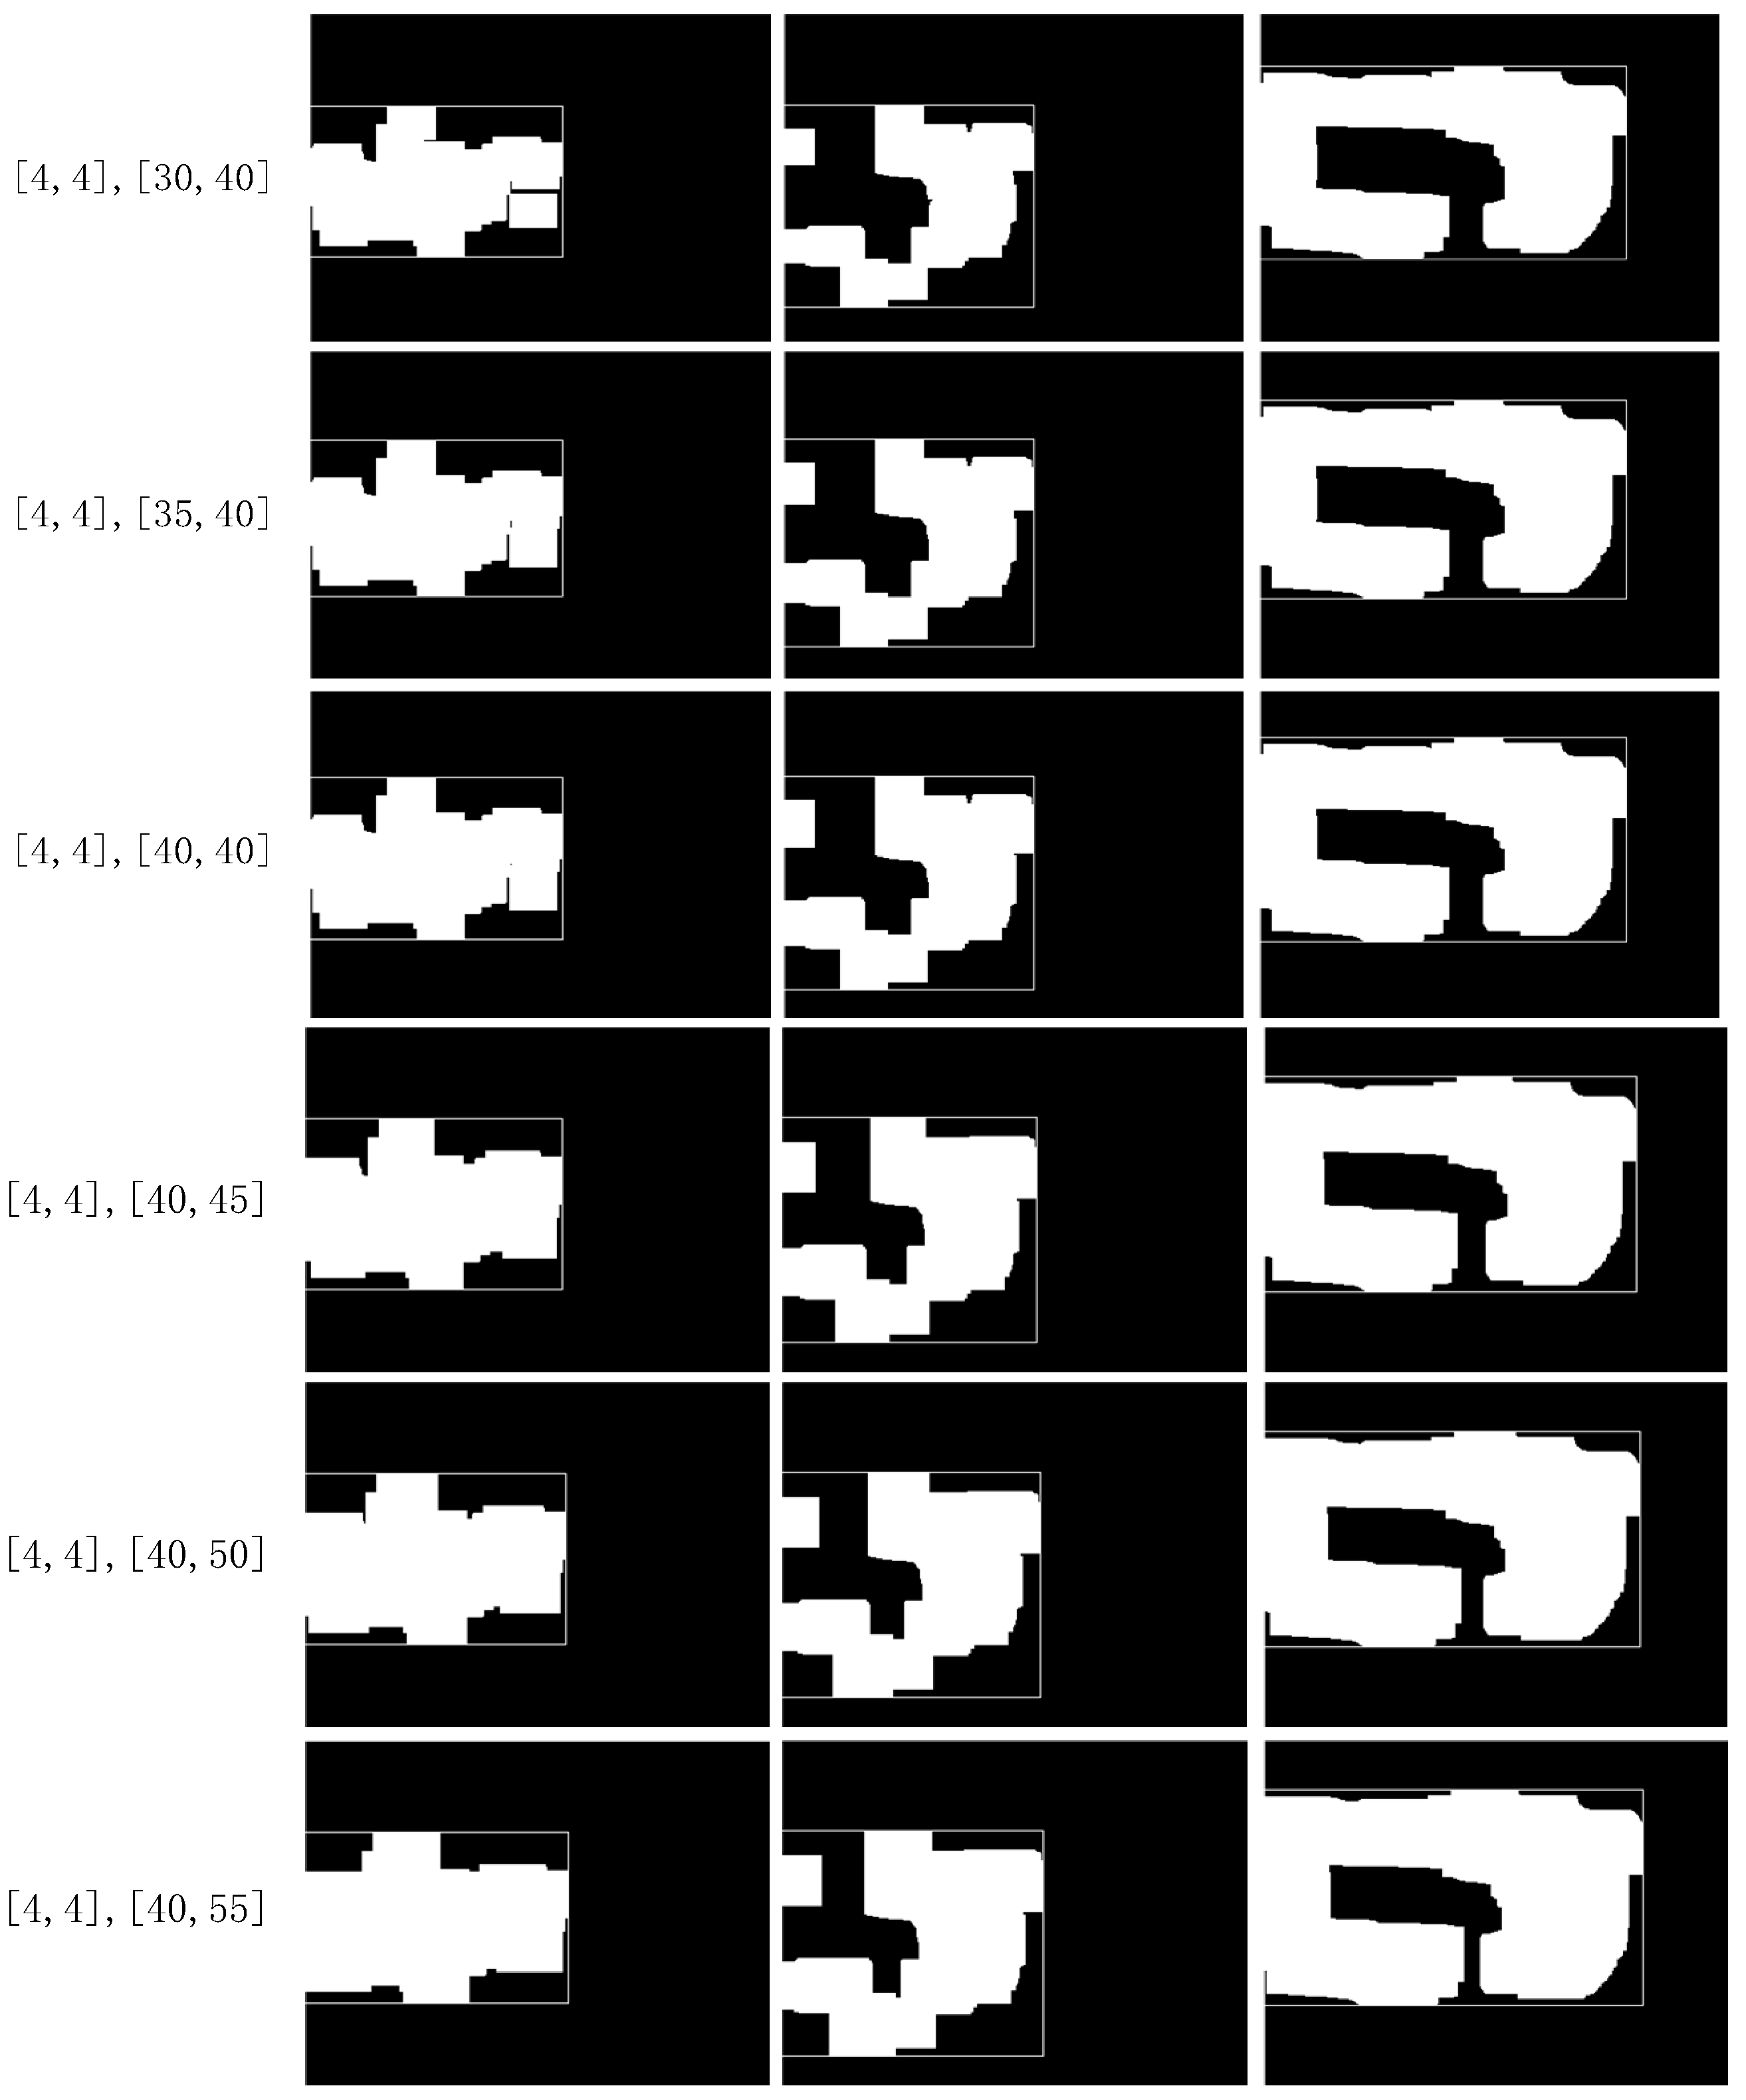
As the morphological structural elements have great influence on the processing results of the binary images, a group of structural elements with universal adaptability could be acquired through many simulations. Some infrared thermal images that were randomly intercepted from the video and the processing results are shown in Figure 12 and Figure 13. The optimal a1, b1, a2, and b2 of the rectangular structure element can be determined according to a comparison with original images.
As shown in Figure 12 and Figure 13, if the corrosion-structure elements were too small, there were many residual uncoherent points after the corrosion operation, and when the corrosion-structure elements were too large, many useful characteristics of the shearer cutting unit were removed, which was not conducive to follow-up tracking. In addition, when the width and length of the swell structural elements increased, the external dimensions of the cutting unit were also augmented. By comparing this with the cutting unit in the original image, the corrosion-structure elements were selected as [4, 4], and the swell-structural elements were selected as [40, 50].
- (3)
- Selection of the maximum likelihood probability threshold T2
In order to select the optimal maximum likelihood probability threshold, the infrared thermal imaging video containing the covered cutting unit was selected to carry out the tracking experiment. The maximum likelihood probability value of the confidence map in each frame was calculated, and some results are shown in Figure 14.
It can be found that the maximum likelihood probability values of the confidence maps from the 11th frame are lower than the first 10 frames in the video. The reason for this is that in the 11~15 frames, the shearer cutting unit is covered, resulting in target-tracking failure, and the target tracking from the 12th frame is actually wrong. After many experiments, T2 was set to 0.001 in this paper. When T2 was less than 0.001, it was necessary to change the location of the cutting unit by morphology, and then perform tracking again.
5.3. Tracking Effect Analysis of a Cutting Unit
In order to verify the superiority of the presented tracking algorithm, the single STC algorithm was also applied to the cutting unit tracking in an infrared thermal imaging video. The tracking results are shown in Figure 15 and Figure 16. Due to the limited space, only some tracking results in the key frames are listed in the paper.
In this infrared thermal-imaging video, the shearer cutting unit was completely blocked from the 12th frame, and did not reappear until the 17th frame. When the cutting section was tracked by the original STC algorithm, the target-tracking locations of the 13th to 16th frames were completely wrong and could not be re-tracked after the cutting unit reappeared. The reason for this is that the original STC was used to locate the target position in the next frame based on the relationship between the target and the surrounding space. When the cutting unit was completely obscured, the surrounding space information was insufficient, resulting in a failure to track the subsequent target location. However, the algorithm proposed in this paper can determine whether the target has disappeared by setting the maximum likelihood probability threshold, and then locating it by morphology. Even if the cutting unit is completely blocked in a few frames, it can still be re-tracked (from the 17th frame).
5.4. Identification Results of Shearer Cutting State
In the infrared thermal imaging video, different colors represent different cutting temperatures; the brighter the image, the higher the temperature. As shown in Figure 17, it was found that the brightness of the cutting unit was significantly higher than that of other parts during the cutting process, indicating that the location was the most calorific. However, under different cutting conditions, the temperature change is not conspicuous, and cannot be used as part of the temperature characteristics.
Therefore, in order to extract representative feature information, this paper tried to analyze the temperature difference before and after cutting the coal wall in the tracking area. Meanwhile, the maximum, minimum, and mean of the temperature differences were chosen as the temperature parameters in the tracking area. Ten groups of temperature data under each cutting state were randomly extracted, as shown in Figure 18.
From Figure 18, it can be found that when the hardness of a cutting coal wall increased, the temperature difference in the tracking area would also rise, and there would be obvious stratification in most sample data. This is because a coal wall with different hardness has greater force on the cutting part in the tracking area, and increases the work.
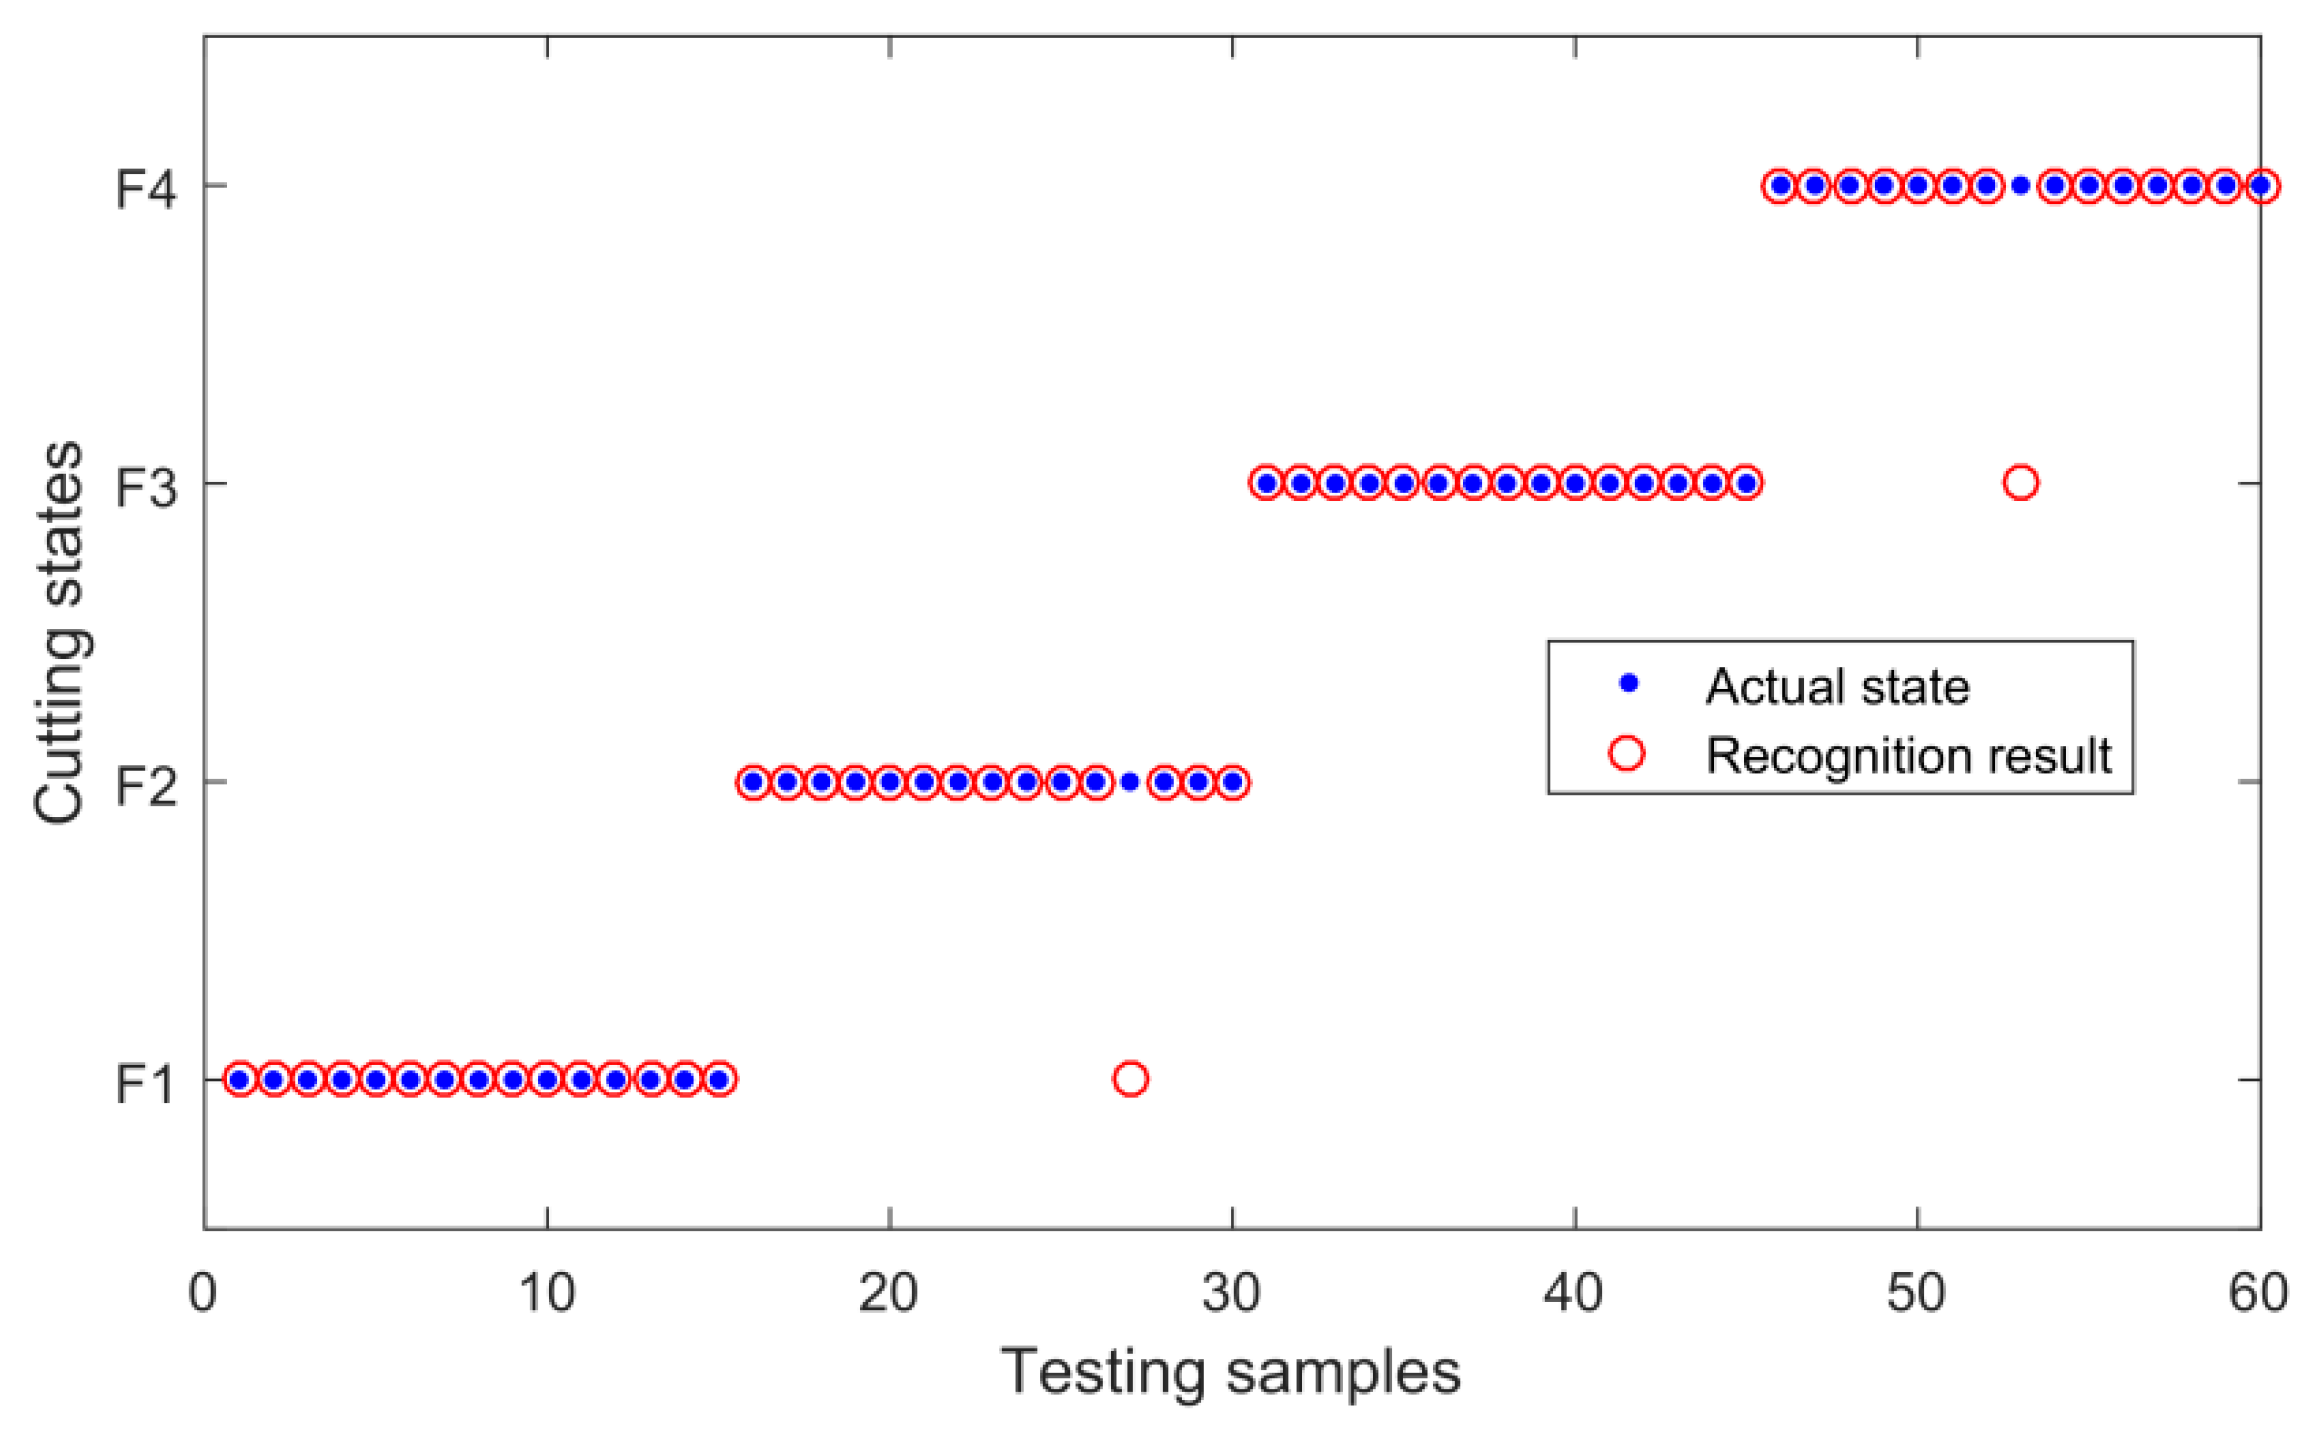
Furthermore, in order to improve the accuracy and efficiency of cutting state recognition, an SVM was utilized to carry out this goal in this paper. In this SVM, a radial basis function was selected as the Kernel function. The penalty factor and kernel parameter were optimized by cross-validation to avoid the overfitting phenomenon. For each cutting state, 30 samples were generated from the collected infrared thermal imaging video, and a total of 120 samples were used to train and test the SVM classifier. Without loss of generality, 15 samples were randomly selected from each cutting state as the training data, and the remaining 60 samples were utilized to test the classification performance. The identification results of cutting state based on the SVM are shown in Figure 19. In the following description, the identification accuracy is obtained by the formula: (number of testing samples − number of misclassified samples)/number of testing samples × 100%.
It can be observed from Figure 19 that only two samples were misclassified, and the comprehensive identification accuracy of the proposed method can reach 96.67%, which fully meets the requirements of automatic shearer control. In order to ascertain the cause of erroneous recognition, we observed the infrared images represented by the misidentified samples. In the two images, the location of the shearer cutting unit changed, resulting in a small blind area in the tracking area. The extracted features of the temperature field could not describe the cutting state of the shearer, which led to the wrong identification of samples. In general, the simulation results verify the feasibility and effectiveness of the proposed method.
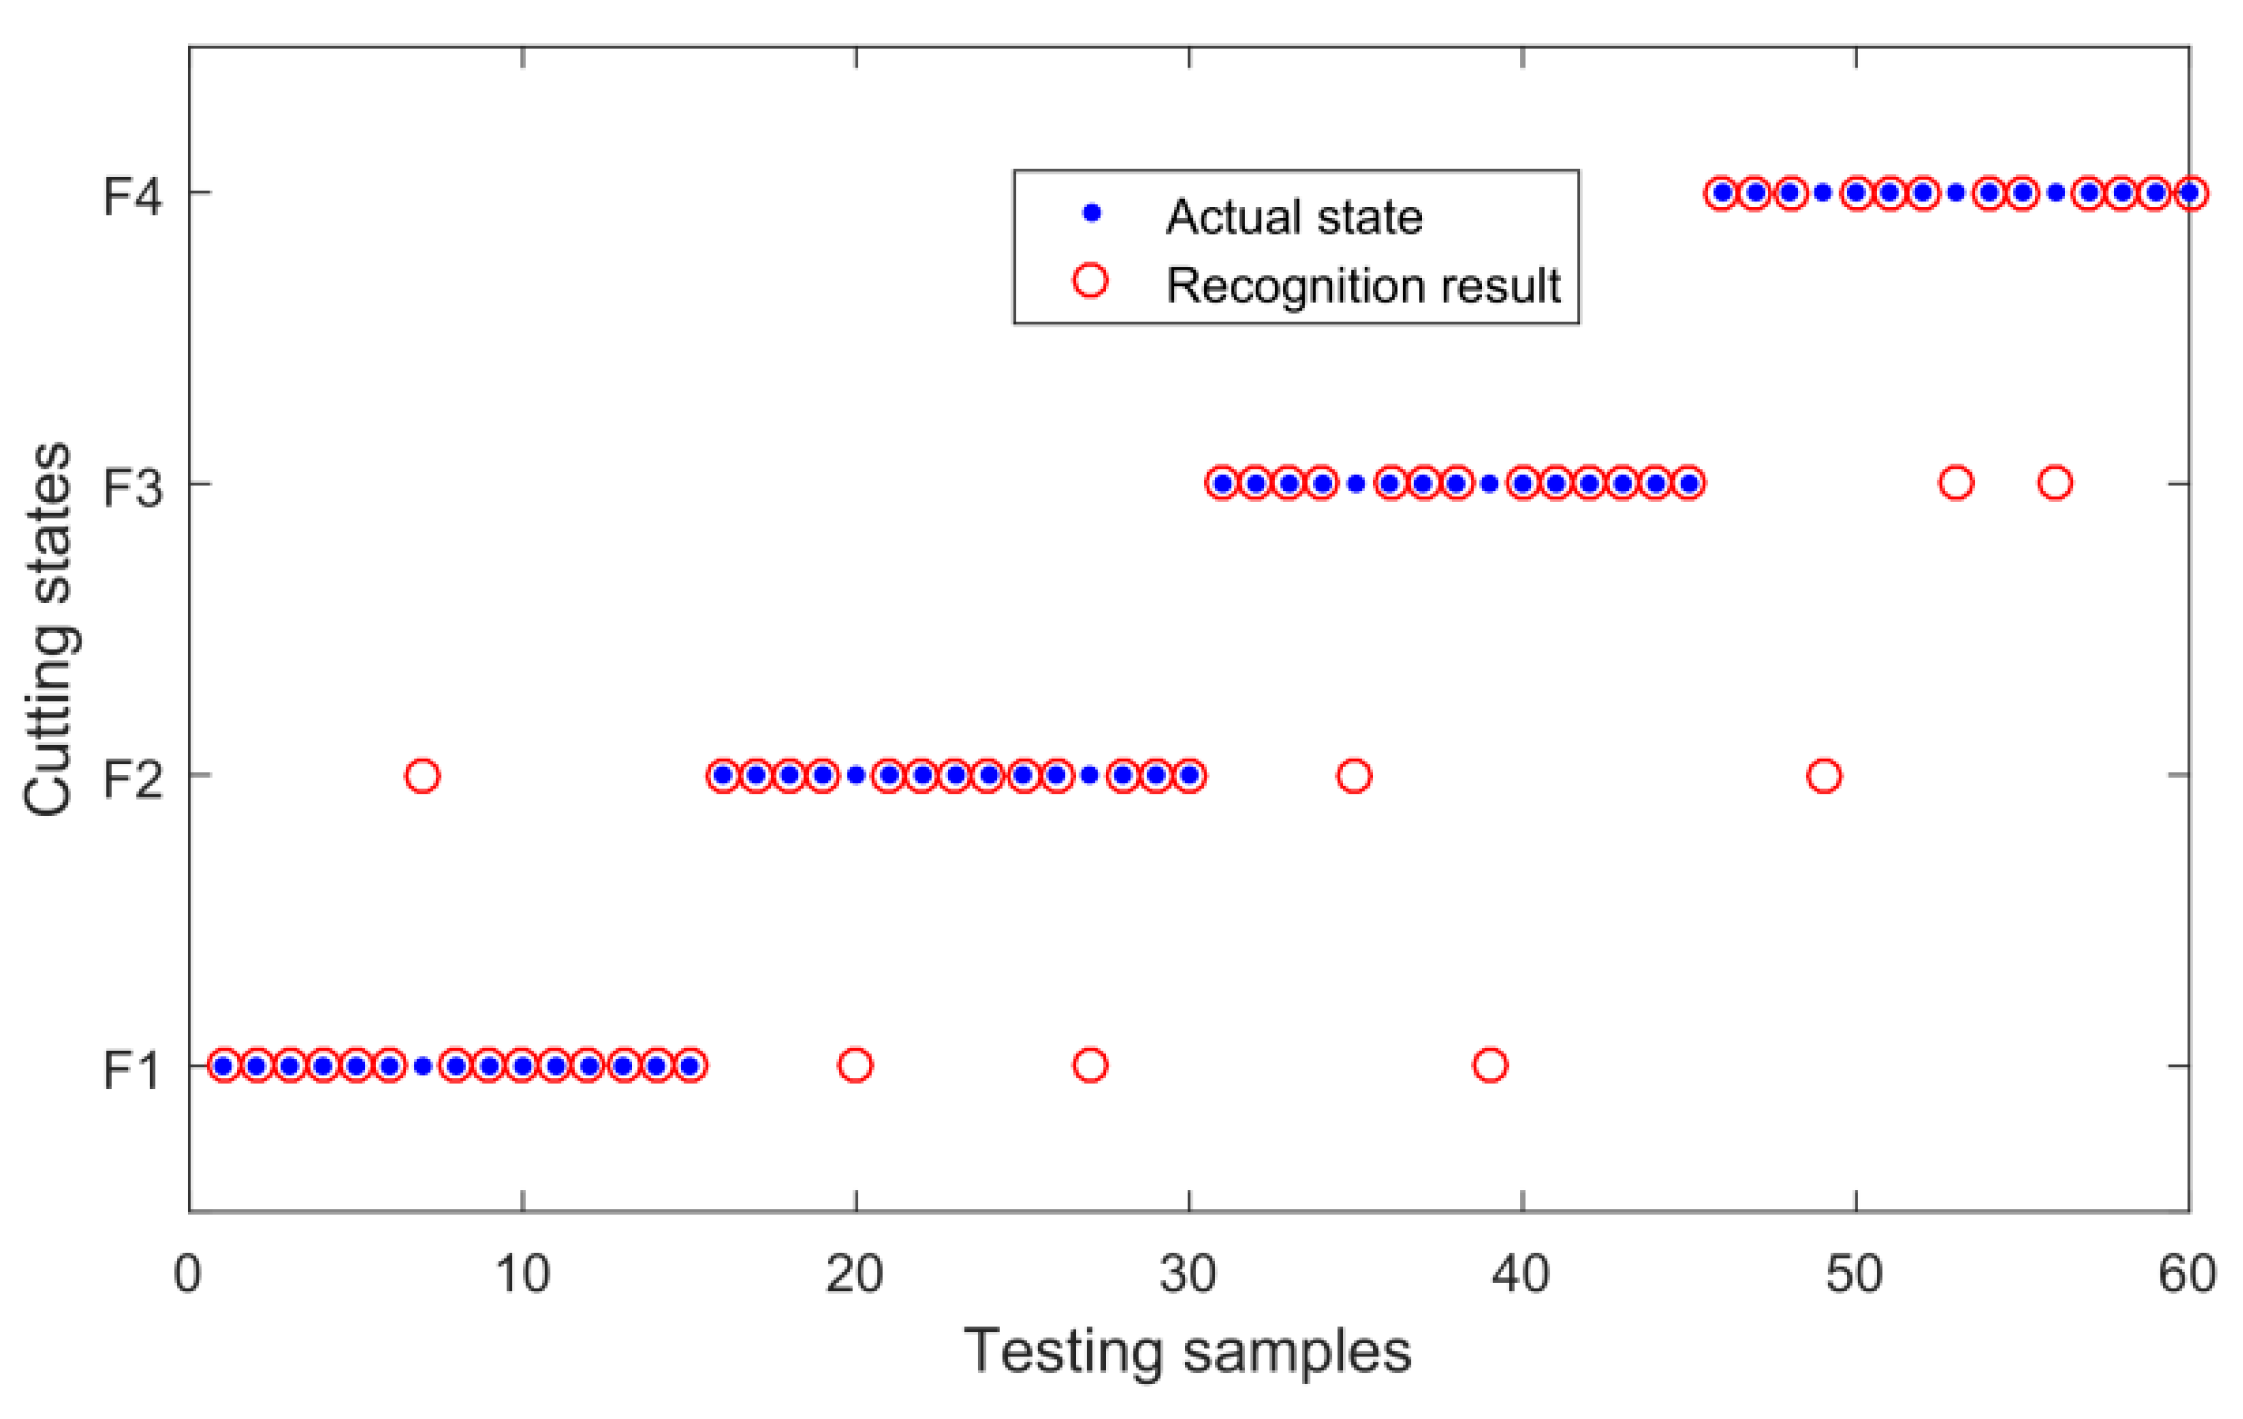
In the proposed recognition system, the characteristics of the temperature field were extracted from the tracking area containing the cutting unit. In order to verify the superiority of this feature extraction method, our paper directly extracted the temperature field features from the above 120 frames of infrared images. All the simulation parameters are consistent with the previous ones, and the recognition results can be obtained, as shown in Figure 20.
In Figure 20, the recognition accuracy is only 86.67%, far below the method proposed in this paper. The reason is that the temperature field features were extracted from the entire infrared image instead of the image in the tracking area. The sample information would contain some temperature characteristics that are irrelevant to the cutting state, thereby greatly reducing recognition accuracy. The simulation results show the necessity of tracking the cutting unit, and further verify the superiority of the proposed identification system.
6. Conclusions
Accurate identification of a shearer cutting state is the prerequisite of, and basic guarantee for, achieving intelligent shearer control. In this paper, infrared thermal imaging technology was utilized to capture the temperature changes of a shearer cutting a coal wall. The mathematical morphology and a spatio-temporal context algorithm were introduced to achieve the positioning and tracking of a shearer cutting unit. The related parameters were reasonably determined according to many simulations, and the experimental results indicate that the infrared thermal images can be used to accurately identify the cutting state of the shearer.
In future work, the authors will analyze the influence of different traction speeds and drum speeds on the temperature of coal wall, and deeply study the feature extraction method of infrared images.
Author Contributions
Conceptualization, L.S. and Z.W.; Methodology, L.S. and Z.W.; Software, L.S. and Y.L.; Writing-Original Draft Preparation, L.S.; Writing-Review & Editing, C.T. and L.S.
Funding
This research was funded by National Natural Science Foundation of China (grant numbers: 51605477 and U1510117) and the Priority Academic Program Development (PAPD) of Jiangsu Higher Education Institutions.
Acknowledgments
The authors would like to thank the National Natural Science Foundation of China for their supports to the research work. The authors also thank the reviewers for their suggestions and corrections to the original manuscript.
Conflicts of Interest
The authors declare no conflict of interest.
References
- Si, L.; Wang, Z.B.; Tan, C.; Liu, X.H. A novel approach for coal seam terrain prediction through information fusion of improved D–S evidence theory and neural network. Measurement 2014, 54, 140–151. [Google Scholar] [CrossRef]
- Asfahani, J.; Borsaru, M. Low-activity Spectrometric Gamma-ray Logging Technique for Delineation of Coal/Rock Interfaces in Dry Blast Holes. Appl. Radiat. Isot. 2007, 65, 748–755. [Google Scholar] [CrossRef] [PubMed]
- Markham, J.R.; Solomon, P.R.; Best, P.E. An FT—IR Based Instrument for Measuring Spectral Emittance of Material at High Temperature. Rev. Sci. Instrum. 1990, 61, 3700–3708. [Google Scholar] [CrossRef]
- Zhang, Q.Z.; Qiu, J.B.; Zhuang, D.Y. Vibration signal identification of coal-rock cutting of shearer based on cepstral distance. Ind. Mine Autom. 2017, 43, 9–12. [Google Scholar]
- Si, L.; Wang, Z.B.; Liu, X.H.; Tan, C.; Zhang, L. Cutting State Diagnosis for Shearer through the Vibration of Rocker Transmission Part with an Improved Probabilistic Neural Network. Sensors 2016, 16, 479. [Google Scholar] [CrossRef] [PubMed]
- Chufo, R.L.; Johnson, W.J. A Radar Coal Thickness Sensor. Ind. Appl. IEEE Trans. 1993, 29, 834–840. [Google Scholar] [CrossRef]
- Huang, S.J.; Liu, J.G. Research of coal-rock recognition technology based on GMM clustering analysis. J. China Coal Soc. 2015, 40, 576–582. [Google Scholar]
- Tian, L.Y.; Mao, J.; Wang, Q.M. Coal and rock identification method based on the force of idler shaft in shearer’s ranging arm. J. China Coal Soc. 2016, 41, 782–787. [Google Scholar]
- Sun, J.P.; Chen, B. An approach to coal-rock recognition via statistical modeling in dual-tree complex wavelet domain. J. China Coal Soc. 2016, 41, 1847–1858. [Google Scholar]
- Zhang, Q.; Wang, H.J.; Jing, W.; Mao, J.; Yuan, Z.; Hu, D.G. Shearer’s coal-rock identification system based on fuzzy neural network information fusion. China Mech. Eng. 2016, 27, 201–208. [Google Scholar]
- Xu, J.; Wang, Z.B.; Tan, C.; Si, L.; Zhang, L.; Liu, X.H. Adaptive wavelet threshold denoising method for machinery sound based on improved fruit fly optimization algorithm. Appl. Sci.-Basel 2016, 6, 199. [Google Scholar] [CrossRef]
- Xu, J.; Wang, Z.B.; Tan, C.; Si, L.; Liu, X.H. A cutting pattern recognition method for shearers based on improved ensemble empirical mode decomposition and a probabilistic neural network. Sensors 2015, 15, 27721–27737. [Google Scholar] [CrossRef] [PubMed]
- Su, Z.Z.; Cao, B.; Guo, W.; Yang, Y.L.; Li, J.X. Application of infrared thermography in electromagnetic railgun. Laser Infrared 2016, 46, 1080–1084. [Google Scholar]
- Ye, J.J. Design of infrared thermal imaging instrument in coal mine emergency rescue and patrol inspection. Coal Technol. 2017, 36, 229–231. [Google Scholar]
- Feng, J.Y.; Tang, H.; He, T.; Lu, Y.T. Infrared image monitoring and early-warning technology of coal mine conveyor belt fire. Coal Technol. 2016, 35, 280–282. [Google Scholar]
- Piasecka, M.; Strä, K.K.; Maciejewska, B. Calculations of flow boiling heat transfer in a minichannel based on liquid crystal and infrared thermography data. Heat Transf. Eng. 2017, 38, 332–346. [Google Scholar] [CrossRef]
- Francesco, C.; Pooya, M.; Fulvio, P.; Meo, M. Recent advances in active infrared thermography for non-destructive testing of aerospace components. Sensors 2018, 18, 609. [Google Scholar]
- Meola, C.; Boccardi, S.; Carlomagno, G.M.; Boffa, N.D.; Ricci, F.; Simeoli, G.; Russo, P. Impact damaging of composites through online monitoring and non-destructive evaluation with infrared thermography. NDT E Int. 2017, 85, 34–42. [Google Scholar]
- López-Pérez, D.; Antonino-Daviu, J. Application of infrared thermography to failure detection in industrial induction motors: Case stories. IEEE Trans. Ind. Appl. 2017, 53, 1901–1908. [Google Scholar] [CrossRef]
- Axel, S.; Karin, K.; Anne-Katrin, M. Infrared thermography as a non-invasive tool to explore differences in the musculoskeletal system of children with hemophilia compared to an age-matched healthy group. Sensors 2018, 18, 518. [Google Scholar]
- Kwok, G.; Yip, J.; Yick, K.L.; Cheung, M.C.; Tse, C.Y.; Ng, S.P.; Luximon, A. Postural screening for adolescent idiopathic scoliosis with infrared thermography. Sci. Rep. 2017, 7, 14431. [Google Scholar] [CrossRef] [PubMed]
- Liu, X.L.; Fu, B.R.; Xu, L.W.; Lu, N.; Yu, C.Y.; Bai, L.Y. Automatic assessment of facial nerve function based on infrared thermal imaging. Spectrosc. Spectr. Anal. 2016, 36, 1445–1450. [Google Scholar]
- Touret, T.; Changenet, C.; Ville, F.; Lalmi, M.; Becquerelle, S. On the use of temperature for online condition monitoring of geared systems—A review. Mech. Syst. Signal Process. 2018, 101, 197–210. [Google Scholar] [CrossRef]
- Glowacz, A.; Glowacz, Z. Diagnostics of stator faults of the single-phase induction motor using thermal images, MoASoS and selected classifiers. Measurement 2016, 93, 86–93. [Google Scholar] [CrossRef]
- Glowacz, A.; Glowacz, Z. Diagnosis of the three-phase induction motor using thermal imaging. Infrared Phys. Technol. 2017, 81, 7–16. [Google Scholar] [CrossRef]
- Mikolajczyk, T.; Nowicki, K.; Bustillo, A. Predicting tool life in turning operations using neural networks and image processing. Mech. Syst. Signal Process. 2018, 104, 503–513. [Google Scholar] [CrossRef]
- Liu, Z.; Chang, L.; Luo, Z.; Cascioli, V.; Heusch, A.I.; McCarthy, P.W. Design and development of a thermal imaging system based on a temperature sensor array for temperature measurements of enclosed surfaces and its use at the body-seat interface. Measurement 2017, 104, 123–131. [Google Scholar] [CrossRef]
- Koprowski, R.; Wilczynski, S. Thermal image analysis using the serpentine method. Infrared Phys. Technol. 2018, 89, 97–109. [Google Scholar] [CrossRef]
- Ralston, J.C.; Strange, A.D. Thermal infrared-based seam tracking for intelligent longwall shearer horizon control. In Proceedings of the 2012 Coal Operators Conference, Wollongong, Australia, 16–17 February 2012; pp. 79–86. [Google Scholar]
- Sakaino, H. Video-based tracking, learning, and recognition method for multiple moving objects. IEEE Trans. Circuits Syst. Video 2013, 23, 1661–1674. [Google Scholar] [CrossRef]
- Mithun, N.C.; Howlader, T.; Rahman, S.M.M. Video-based tracking of vehicles using multiple time-spatial images. Expert Syst. Appl. 2016, 62, 17–31. [Google Scholar] [CrossRef]
- Li, H.Y.; Bi, D.Y.; Zha, Y.F.; Yang, Y. An easily initialized visual tracking algorithm based on similar structure for convolutional neural network. J. Electron. Inf. Technol. 2015, 38, 1–7. [Google Scholar]
- Yu, W.S.; Tian, X.H.; Hou, Z.Q.; Huang, A.Q.; Liu, X. Visual tracking algorithm based on feature matching of key regions. Acta. Electron. Sin. 2014, 42, 2150–2156. [Google Scholar]
- Wu, J.D.; Tsai, Y.J. Speaker identification system using empirical mode decomposition and an artificial neural network. Expert Syst. Appl. 2011, 38, 6112–6117. [Google Scholar] [CrossRef]
- Polat, K.; Güneş, S. An expert system approach based on principal component analysis and adaptive neuro-fuzzy inference system to diagnosis of diabetes disease. Digit. Signal Process. 2007, 17, 702–710. [Google Scholar] [CrossRef]
- Si, L.; Wang, Z.B.; Liu, X.H.; Tan, C.; Liu, Z.; Xu, J. Identification of shearer cutting patterns using vibration signals based on a least squares support vector machine with an improved fruit fly optimization algorithm. Sensors 2016, 16, 90. [Google Scholar] [CrossRef] [PubMed]
- Ukil, A. Support Vector Machine. Comp. Sci. 2002, 1, 1–28. [Google Scholar]
Figure 1.
The corrosion and swell of the morphology.

Figure 2.
Flowchart of the cutting-unit location obtained based on the morphology.

Figure 3.
Binarization of an infrared thermal image containing the cutting unit: (a) original infrared thermal image; (b) binary image.
Figure 3.
Binarization of an infrared thermal image containing the cutting unit: (a) original infrared thermal image; (b) binary image.

Figure 4.
Morphological processing results of the binary image: (a) Corrosion operation; (b) Swell operation.
Figure 4.
Morphological processing results of the binary image: (a) Corrosion operation; (b) Swell operation.

Figure 5.
Enclosed rectangle of shearer cutting unit.

Figure 6.
Basic principle of the spatio-temporal context (STC) tracking algorithm.

Figure 7.
Flowchart of the shearer cutting unit tracking method.

Figure 8.
Online recognition system of a shearer cutting state using infrared thermal images.

Figure 9.
Built experimental system: (a) overall layout of experimental platform; (b) infrared thermal imager.
Figure 9.
Built experimental system: (a) overall layout of experimental platform; (b) infrared thermal imager.

Figure 10.
Infrared thermal imaging video screenshots of shearer cutting unit.

Figure 11.
Binarization processing results with different thresholds.

Figure 12.
Processing results with different corrosion structure elements.

Figure 13.
Processing results with different swell structural elements.

Figure 14.
Maximum likelihood probability value of confidence map in the tracking process.

Figure 15.
Tracking results of the cutting unit based on the single STC algorithm.

Figure 16.
Tracking results of the cutting unit based on the morphology and the STC algorithm.

Figure 17.
Temperature changes in the infrared thermal image of a continuously cutting shearer.

Figure 18.
Comparison of temperature difference data.

Figure 19.
Recognition results based on the proposed method.

Figure 20.
Recognition results without using the tracking area.

© 2018 by the authors. Licensee MDPI, Basel, Switzerland. This article is an open access article distributed under the terms and conditions of the Creative Commons Attribution (CC BY) license (http://creativecommons.org/licenses/by/4.0/).
Share and Cite
MDPI and ACS Style
Si, L.; Wang, Z.; Liu, Y.; Tan, C. Online Identification of Shearer Cutting State Using Infrared Thermal Images of Cutting Unit. Appl. Sci. 2018, 8, 1772. https://doi.org/10.3390/app8101772
AMA Style
Si L, Wang Z, Liu Y, Tan C. Online Identification of Shearer Cutting State Using Infrared Thermal Images of Cutting Unit. Applied Sciences. 2018; 8(10):1772. https://doi.org/10.3390/app8101772
Chicago/Turabian StyleSi, Lei, Zhongbin Wang, Yiwen Liu, and Chao Tan. 2018. "Online Identification of Shearer Cutting State Using Infrared Thermal Images of Cutting Unit" Applied Sciences 8, no. 10: 1772. https://doi.org/10.3390/app8101772
Note that from the first issue of 2016, this journal uses article numbers instead of page numbers. See further details here.