1. Introduction
With the rapid development of smart grid and sensing technology, China's power user side data showed high complexity and redundancy. Since 2011, the user side data volume of power distribution system in China has been booming, from GB to TB, even to PB level, and gradually forms a big data system. Facing the era of big data, power companies have not only improved traditional MySQL, Oracle, and other relational database systems, but also produced lots of new big data systems, such as HBase, GBase, and etc. All of these database systems mentioned above have already formed a multi-source heterogeneous big data system for intelligent power distribution and utilization (IPDU) [
1,
2,
3,
4]. On the other hand, affected by local economic levels, the monitoring and testing conditions in local power companies and manufacturers for distribution network equipment are quite different, while parts of the complex monitoring and testing equipment is unreasonable and impossible to repeat purchase, leading to the further heterogeneity of IPDU big data.
The IPDU big data contains operation data and external scene information of distribution network, and supports the further decision analysis for the planning, construction, operation, maintenance, and other business sectors of power distribution system. Through the deep mining of multi-source data, it would be easy to realize the accurate analysis of current situations and future trends of distribution networks, and operation control of intelligent power distribution network [
5,
6]. However, the traditional data analysis and decision technologies of distribution networks require that all the data samples share the same monitoring and testing indexes, which makes the IPDU heterogeneous big data difficult to be effectively utilized, resulting in a huge waste of data resources. Because of the structure heterogeneity among the existing database systems and the limitation of data qualities from both objective and subjective factors, the IPDU big data system could not directly meet the requirements of traditional data analysis and decision technologies. At the same time, it also comes into a small sample environment for parts of samples in IPDU big data, and brings out great challenges for the data quality management of distribution networks, which makes it difficult to guarantee the accuracy of analysis and decisions [
7,
8]. Therefore, the study on heterogeneous data integration technology has a significant influence on the future intelligent power distribution and utilization, which can also greatly improve the accuracy and efficiency of distribution network’s operation and decision-making.
So far, data integration researches in intelligent power distribution and utilization could be broadly divided into two categories, i.e., time-series data integration and index data integration. The research subjects of the former one mainly include load data, distributed power output, wind speed of wind turbine, and etc. These kinds of data integration technologies are relatively mature, and already form a relatively perfect research system, in which grey relational analysis, collaborative filtering, Markov chain, support vector machine and neural network are widely used as data analysis tools [
9,
10,
11,
12]. The research subjects of index data integration mainly include the structured and semi-structured data, in addition to time-series data. Many experts and scholars have also carried out some inspiring works in this research field, such as: Liu and et al. introduced low rank and sparsity theory for data integration to detect the false data injection in power grid [
13]; Xu and et al. proposed an XLPE power cable lifetime evaluation method by employing low-rank matrix completion technology [
14]; Mateos and et al. used robust nonparametric regression via sparsity control to perform data cleaning and repair tasks [
15].
Although the techniques mentioned above can meet the requirements of some engineering applications in accuracy, but still not be able to satisfy the efficiency requirement. In order to deal with IPDU big data problems, some experts and scholars turned their research directions to data integration based on machine learning. Yu and et al. proposed an extreme learning machine based missing data completion method [
16]. Li and Socher introduced deep learning theory to fulfill the incomplete data restoration and integration tasks, respectively [
17,
18]. However, these researches do not take the small sample environment of IPDU data into account, so it is difficult to be directly applied in the actual projects, and the integration of heterogeneous data in distribution network is not quite satisfying.
In order to solve the problem that heterogeneous data resources for intelligent power distribution and utilization are difficult to be effectively utilized in the small sample environment, a novel heterogeneous data integration technology that is based on generative adversarial networks (GANs-HDI) is proposed. In this proposed GANs-HDI method, the sample space expansion is realized by employing the generator of Goodfellow and et al.’s GANs [
19,
20], according to the targeted samples with all of the measurement indexes complete. In order to eliminate the heterogeneous characteristics, a so-called peak clustering algorithm is proposed to realize the finite open coverage of the expanded sample space, and repair those incomplete samples. Finally, the repaired samples are checked by using well-trained discriminator of GANs. By doing this, GANs learning together with clustering theory form a closed loop to improve heterogeneous data integration performance greatly. This proposed heterogeneous data integration method is helpful to realize the efficient integration of heterogeneous data, and also provides a novel perspective for the further data quality management in power companies.
2. Generative Adversarial Networks Based Sample Space Expansion
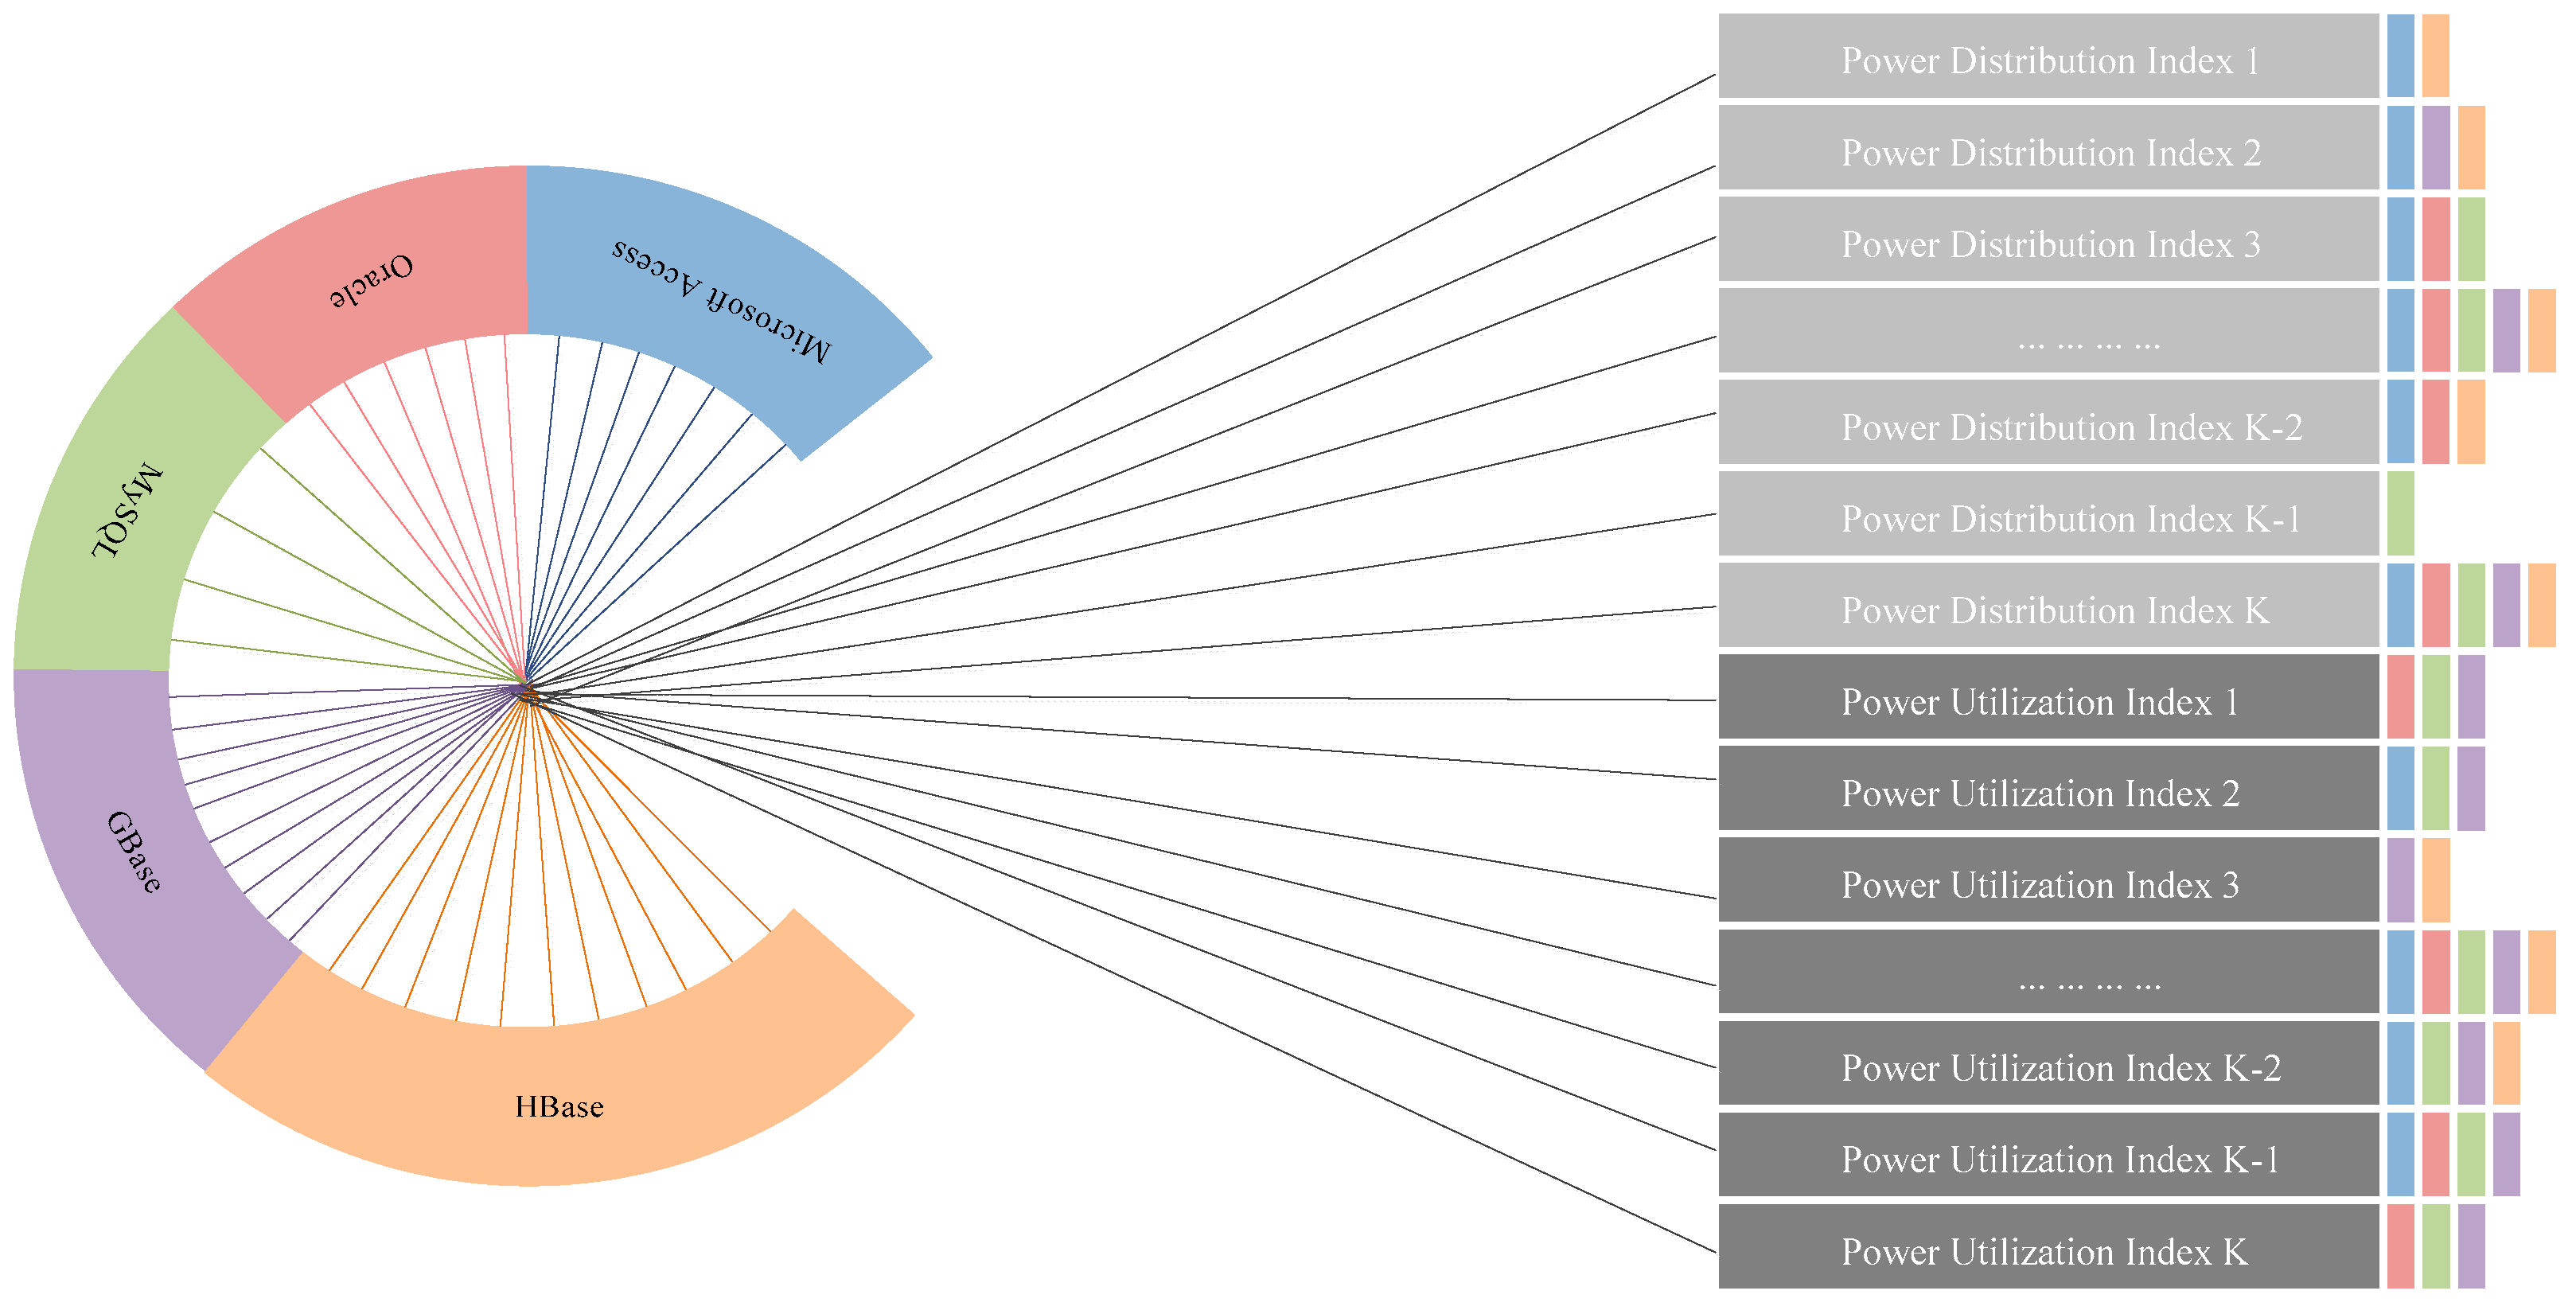
Facing the big data for intelligent power distribution and utilization (IPDU), power companies have not only improved traditional MySQL, Oracle, and other relational database systems, but also produced lots of new big data systems, such like HBase, GBase, and etc. All of these database systems mentioned above provide excessive multi-source heterogeneous samples, as shown in
Figure 1. These targeted samples together form a real space, in which, according to Heine-Borel theorem, a limited number of open intervals could be chosen to form a finite open coverage of this targeted sample set. In each open interval, the samples shall hold the same data characteristics, and be able to support other samples with missing indexes. However, in some small sample environments, the samples are not always enough for data completion and integration tasks in all of the open intervals. Therefore, in order to obtain satisfying data integration results, this paper introduces generative adversarial theory to enrich the sample space.
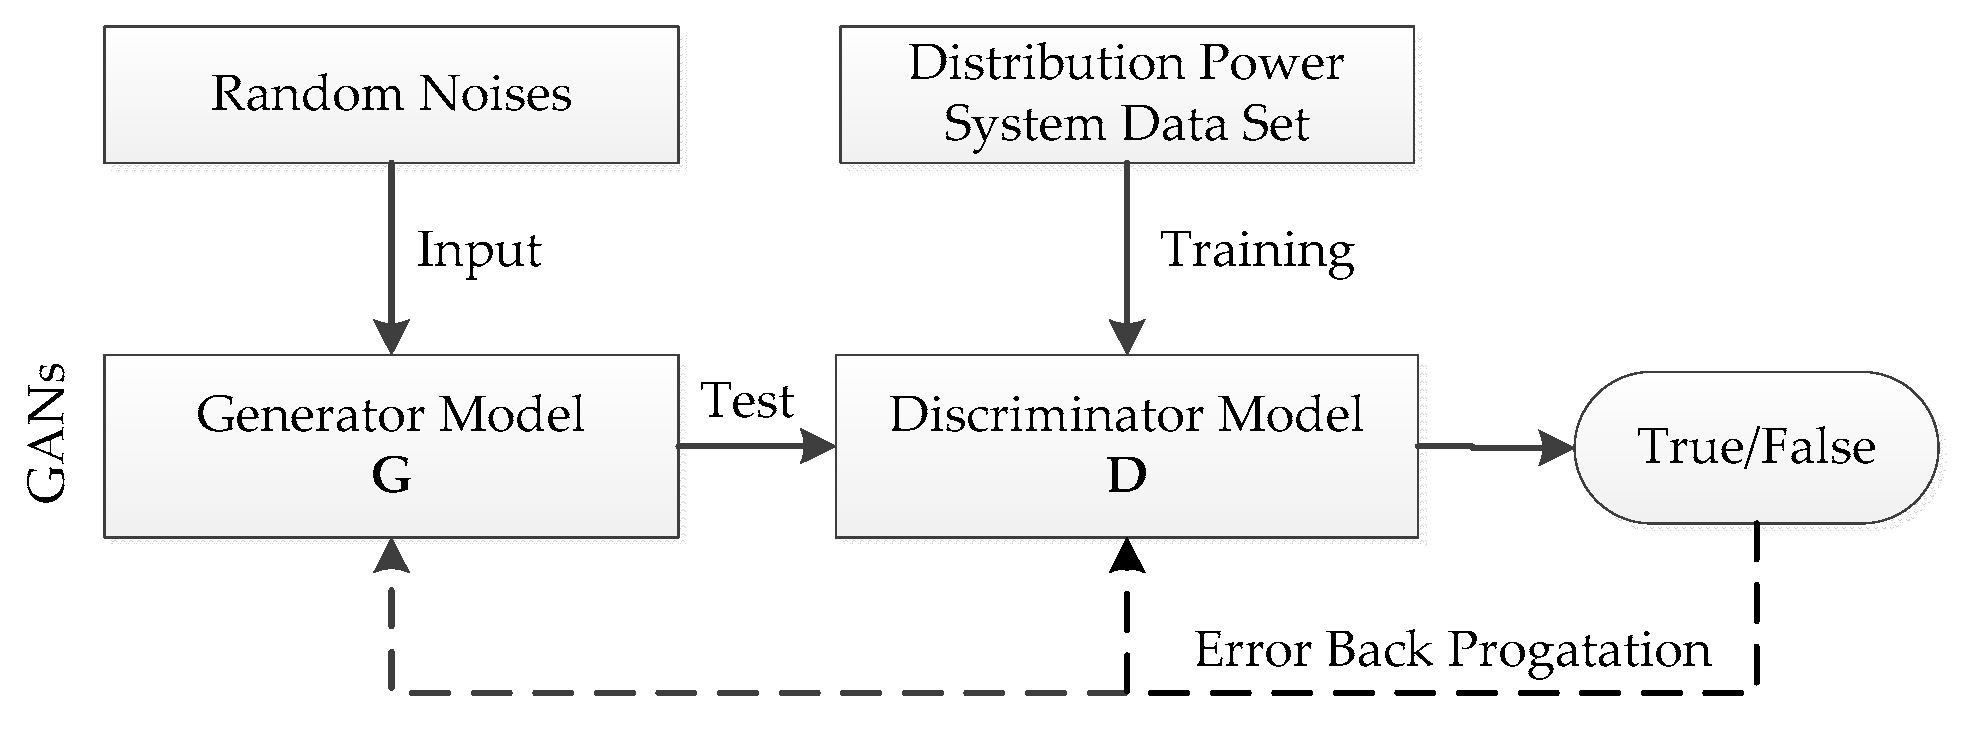
Generative adversarial networks (GANs) is a generative model derived from Nash zero-sum game, in which the generator model and discriminator model are invited to participate. The generator model is designed to learn the distribution of training data, while the discriminator is designed to estimate the probability that the targeted data sample comes from training data rather than the generator. Both of these two models could improve their performances in mutual confrontation and iterative optimization, extend the targeted sample set, improve the discrimination ability, and approach the Nash equilibrium eventually [
19]. As one of the most exciting ideas in the research field of machine learning over the last decade, the theory of GANs has been widely used in image and graphic processing, natural language processing, computer virus monitoring, chess game programming, and etc.
Inspired by Goodfellow and Springenberg’s works [
20,
21,
22], GANs theory is employed to realize the expansion of targeted sample space in this paper. First of all, a targeted data set
with all the measurement indexes is constructed, where
stands for the sample number of data set. GANs algorithm is used to train generator
and discriminator
in TensorFlow platform. Taking
as inputs and zeros as outputs, the discriminator
could be initialized in TensorFlow as the following equation:
where,
is the number of hidden neural nodes,
is the input weights of
i-th hidden neural node, and
and
represent the output weights and threshold values of
j-th hidden neural node respectively,
stands for the activation function in neural networks.
Furthermore, train the generator
and discriminator
simultaneously: adjusting parameters for
to minimize
and for
to minimize
, as if they are following the two-player min-max game with value function
[
21]:
where,
stands for the data set consisted of new generated samples from generator
;
is the number of hidden neural nodes;
is the input weights of
i-th hidden neural node,
and
represent the output weights and threshold values of
j-th hidden neural node. respectively, and
stands for the activation function in neural networks. By using the well-trained generator
,
new data samples could be generated with random vector set
as the inputs. Take
and
as inputs and zeros and ones as outputs respectively, train and renew the discriminator
.
Finally, determine whether the probability of newly generated samples falls within the interval
by using discriminator
. If this condition is satisfied, then it demonstrates that generator
performs well in convergence. Combine the new generated sample set
and original data set
, and denote the combination as
for the future data restoration. Otherwise, the discriminative error of
is back propagated to retraining of generator
. More obviously, the calculation processing of GANs could be shown as
Figure 2.
3. Peak Clustering Based Data Restoration
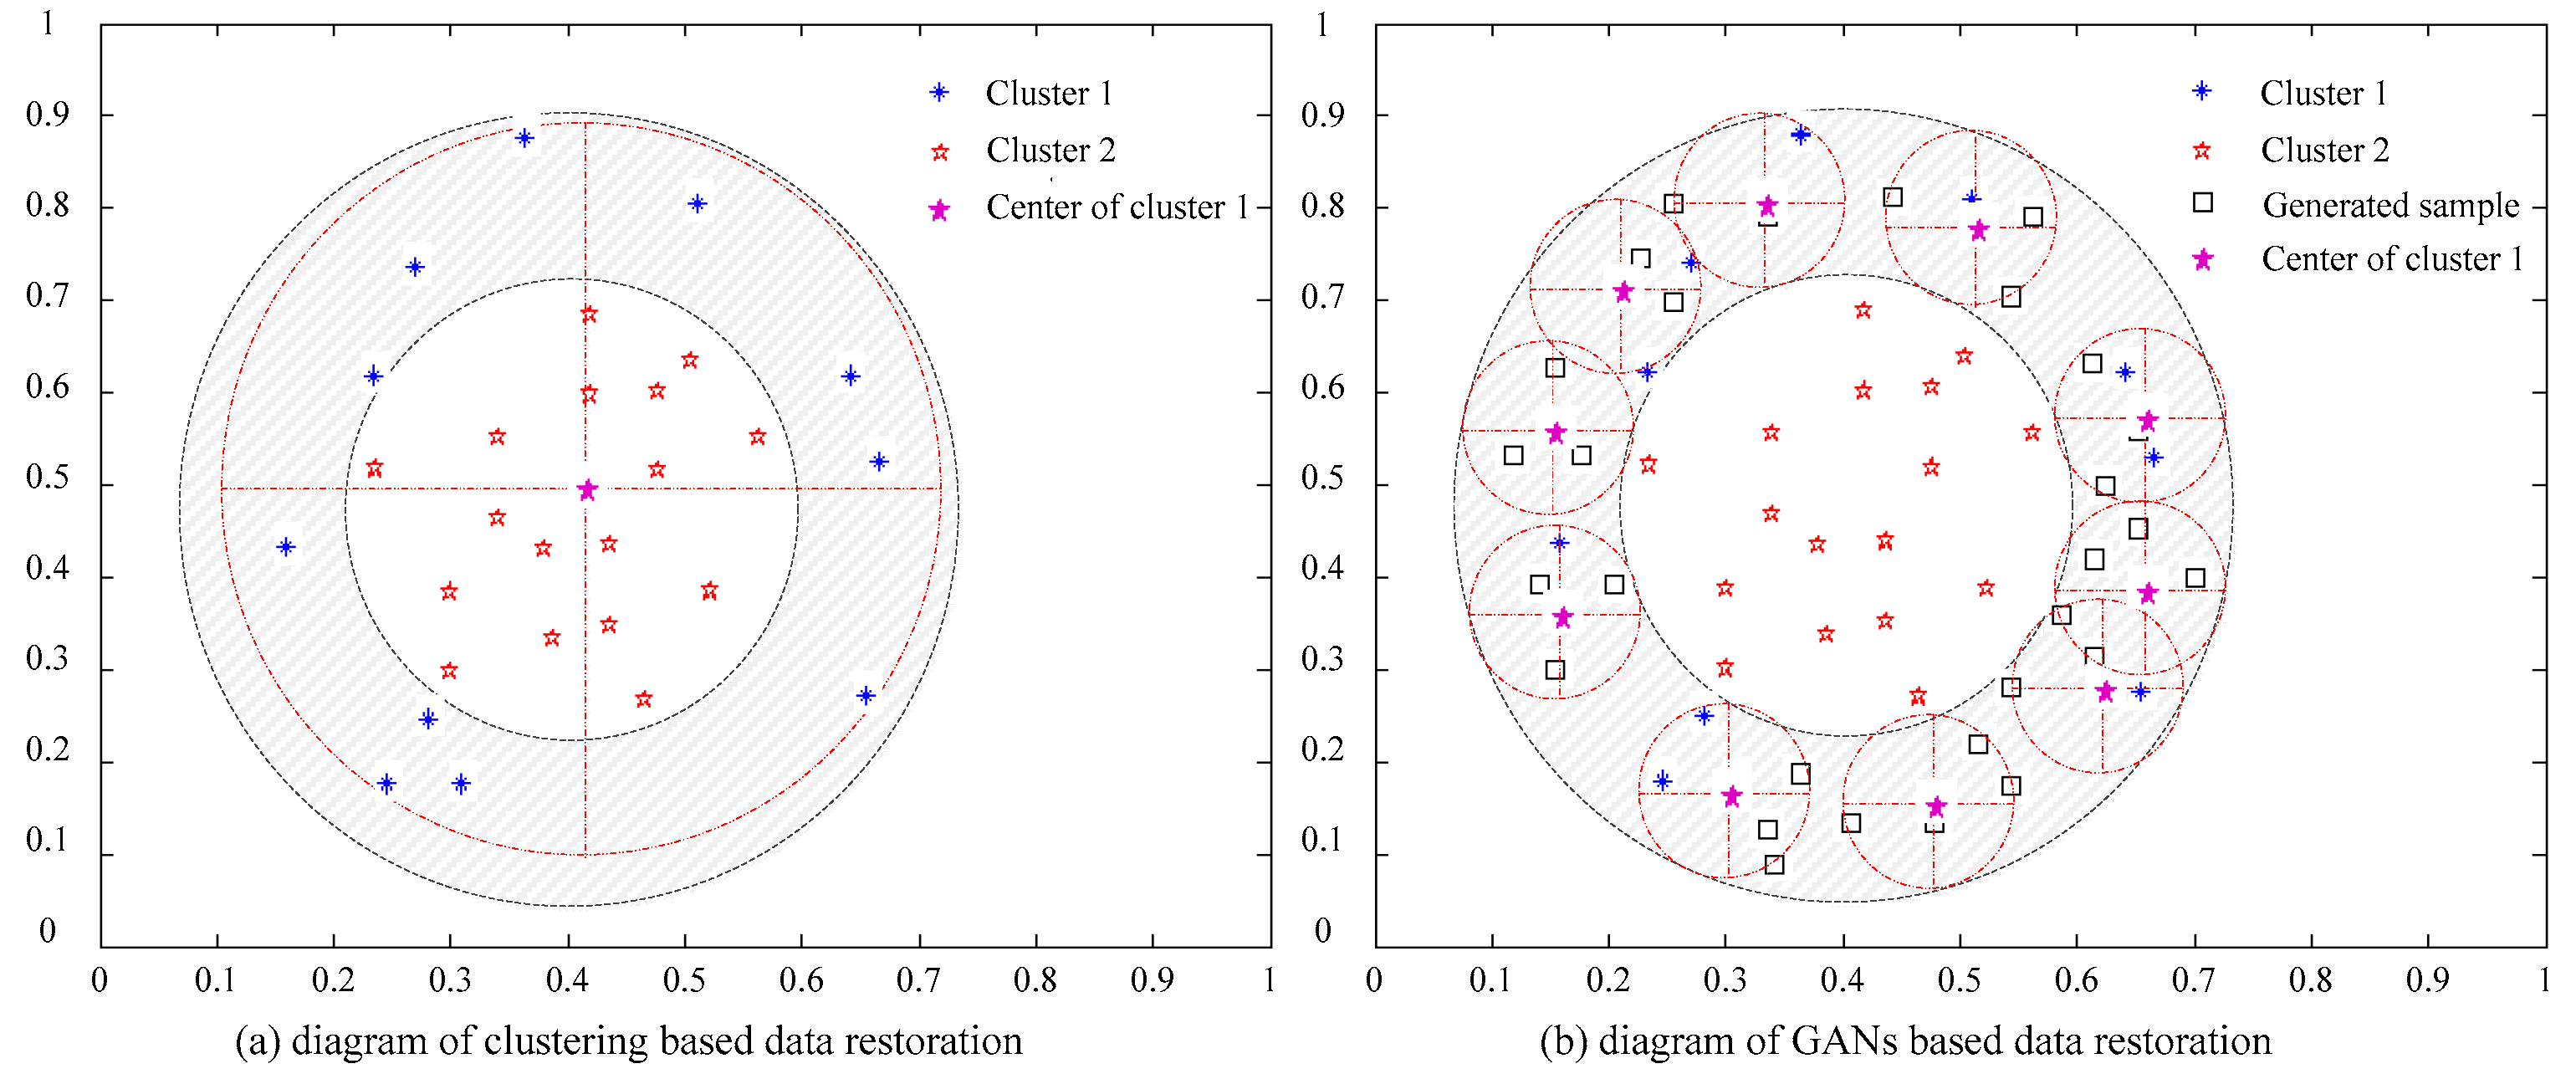
Based on the proliferation result of data samples by introducing generator discussed above, a so-called peak clustering based incomplete data restoration method is proposed in this section. In order to overcome the restoration failures of traditional algorithms with linear inseparable data, the proposed method constructs as few as possible open intervals with a fixed neighborhood radius for all of the data samples. Then, the set of open intervals form a finite open coverage, avoiding the interference of linear inseparable data samples on clustering results, as shown in
Figure 3.
Inspired by Rodriguez’s work in Reference [
23], peak clustering algorithm is proposed for incomplete data restoration to improve the calculation efficiency, while sustaining the restoration precision. Supposing the finite open coverage
contains
data samples
, calculate the peak distance of density peaks (distance between data sample and density peak point)
. Then,
clusters are constructed according to the phase angle with the density peak point as the center, and each cluster contains only one sample [
24]. If the absolute value of the peak distance difference of the cluster with similar phase angle is smaller than or equal to the threshold value, the two classes are merged, and the distance between the peak point of the new class and the peak to peak value of the density is calculated.
If the absolute value of the peak distance difference of the clusters with the similar phase angle is no larger than the threshold value , combine the two clusters and calculate new density peak points and peak distances. Repeat the operations above, until the absolute value of the peak distance difference of the clusters with the similar phase angle becomes larger than the threshold value , or the total cluster number becomes 1. Then, end the iteration and output the clustering result of the last iteration.
Finally, after the peak clustering of targeted data samples, the weighted averages of corresponding values in complete samples could be used as the predictive values of missing data. The concept of entropy in information theory is introduced, and the weighting coefficient is determined by the similarity between data samples. Generally speaking, the process of peak clustering based data restoration could be shown in the following
Table 1.
4. Realization of GANs Based Heterogeneous Data Integration
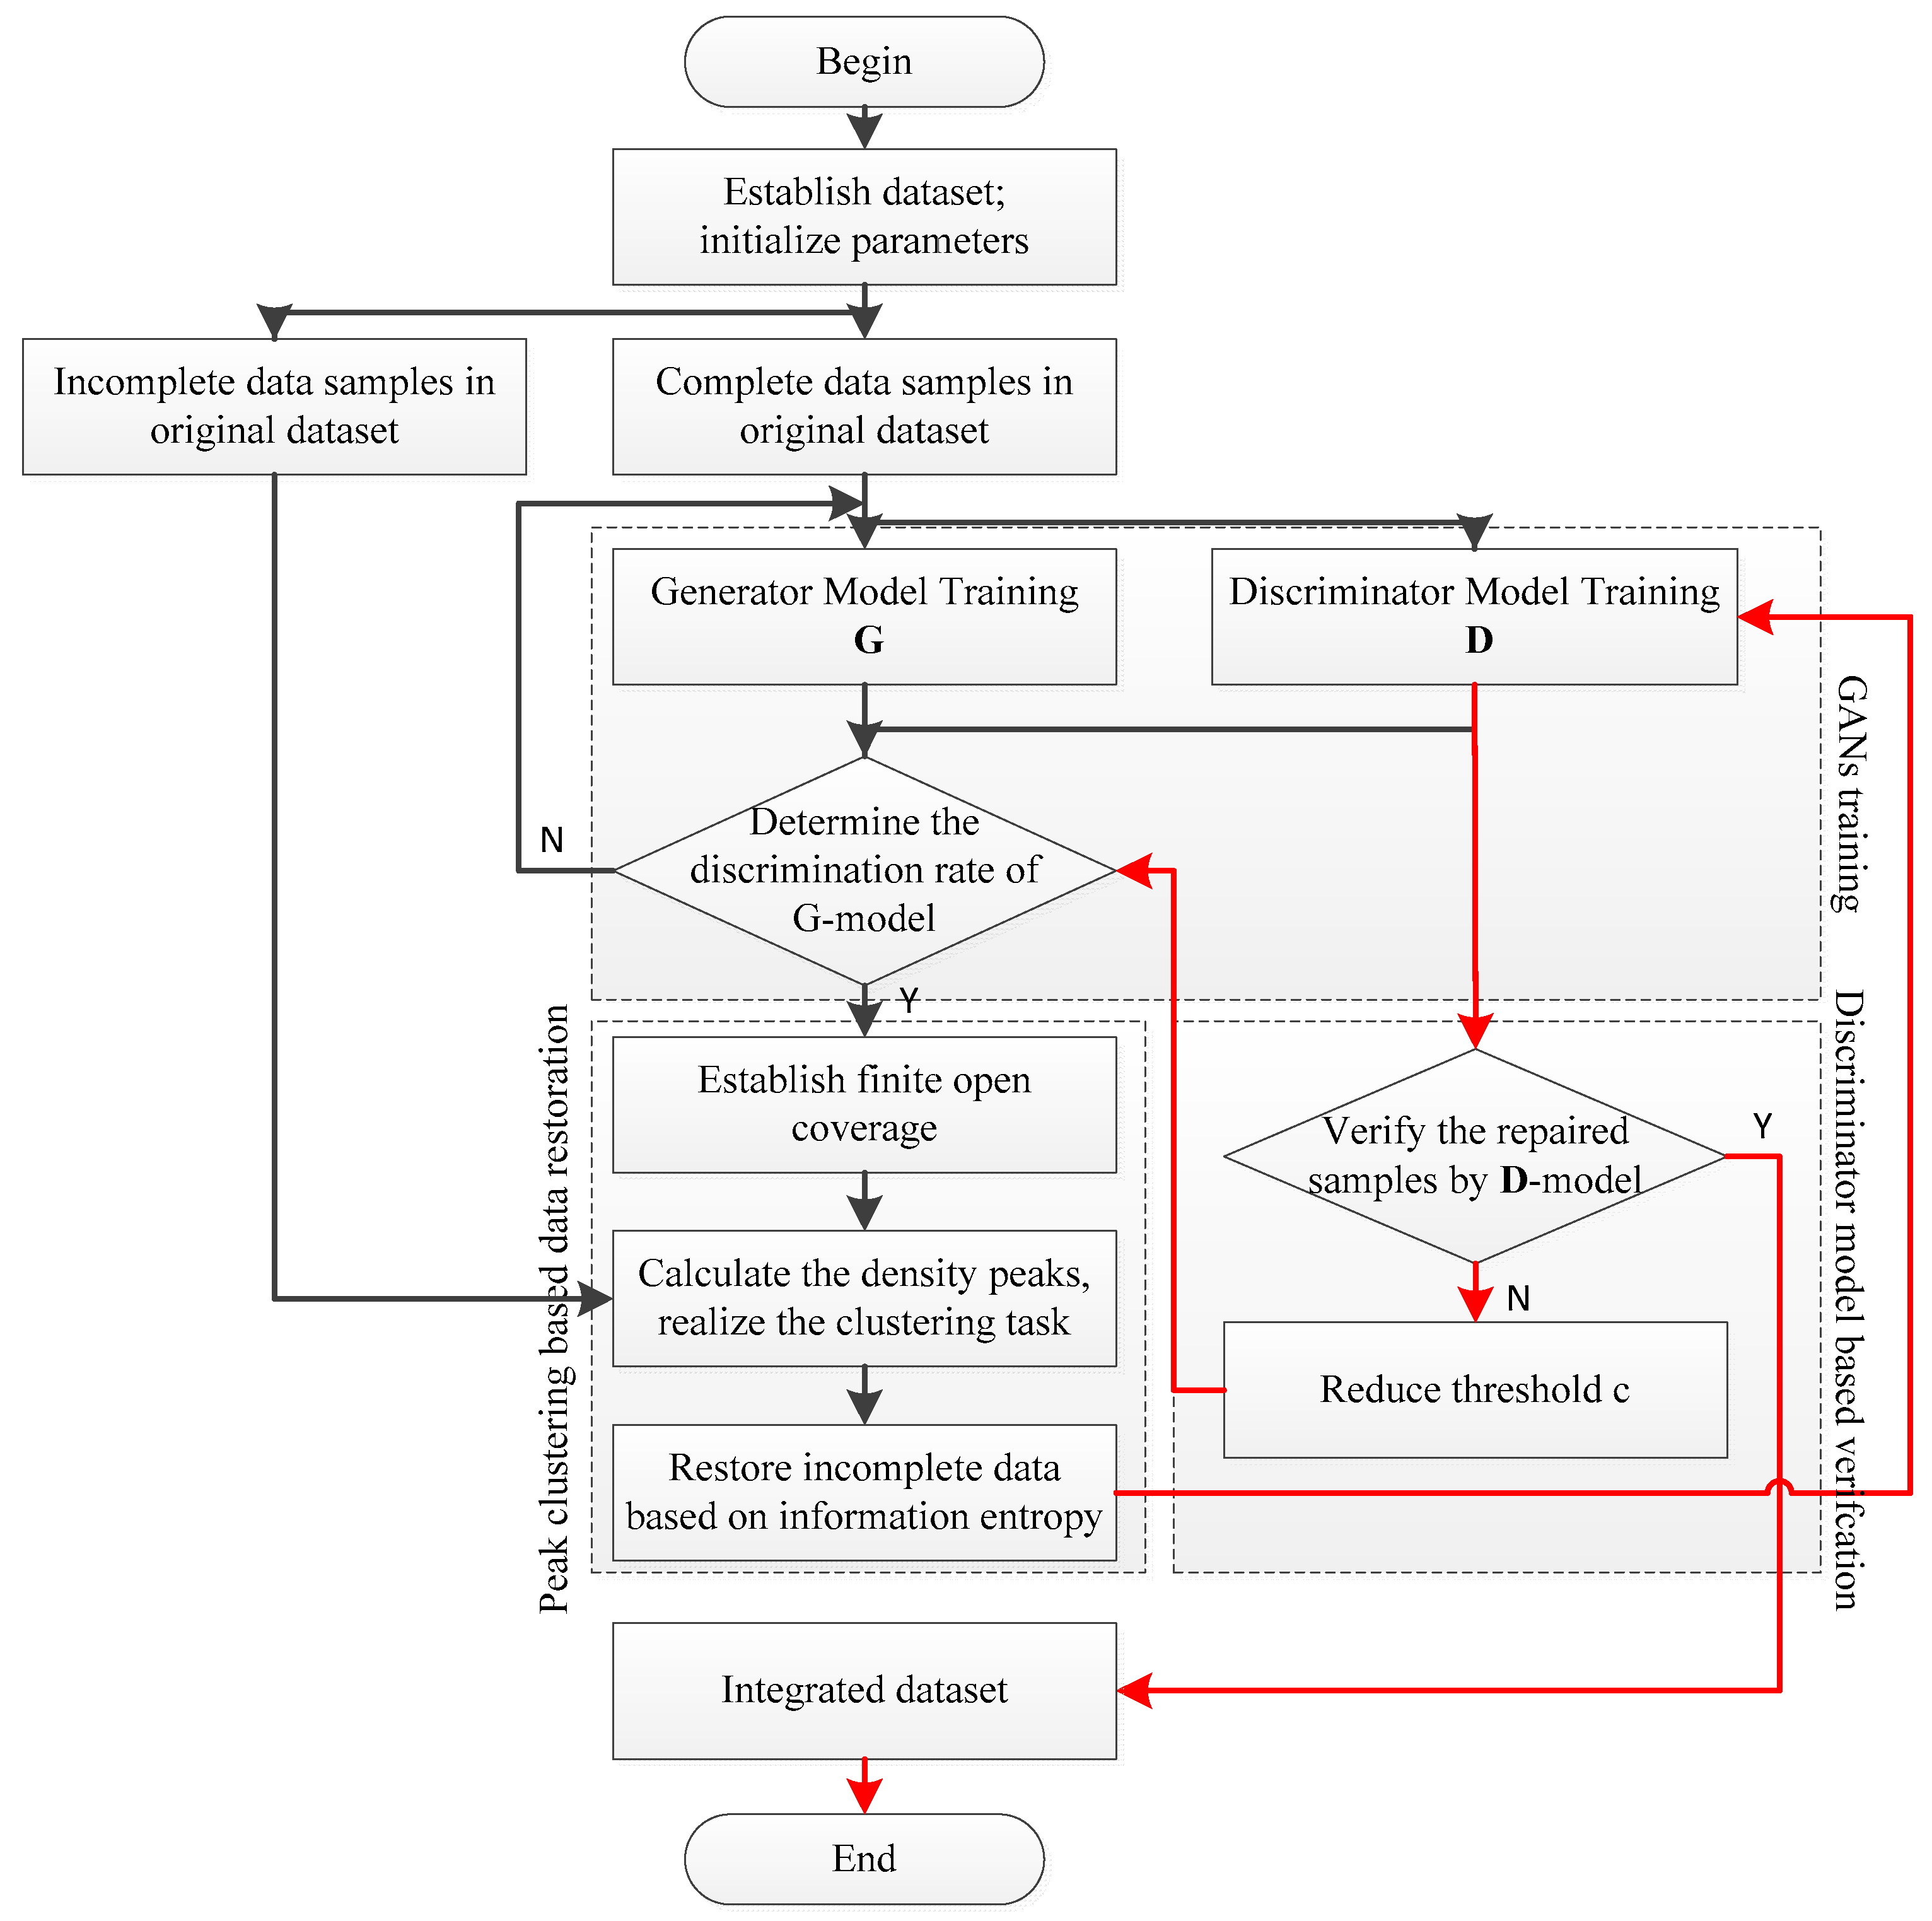
In order to solve the problem that the IPDU heterogeneous data resources are difficult to be effectively utilized in the small sample environment, a novel generative adversarial networks based heterogeneous data integration technology (GANs-HDI) is proposed in this paper. In the GANs-HDI method, the sample space is expanded by introducing GANs, according to the targeted samples with all of the measurement indexes complete. According to all of the complete and fixed samples, peak clustering and information entropy are employed to restore the incomplete ones. Based on the new sample set expanded by the generative model of GANs, this method constructs a peak clustering model to realize the finite open coverage of the restored sample space, and repair those incomplete samples with entropy function. Finally, all of the repaired samples would be checked by using well-trained discriminator of GANs to guarantee the heterogeneous data integration performances. Generally speaking, the process of GANs based heterogeneous data integration could be presented, as shown in
Figure 4.
In this paper, select all the data samples with all measurement indexes complete from heterogeneous database
, and denote them as a dataset
for the further generator
and discriminator
’s training in GANs. Then, taking
and
generated by generator
as inputs and zeros and ones as outputs respectively, train and renew the discriminator
. Finally, if the data samples generated by
could meet iterative termination condition, combine the new generated sample set
and original dataset
, and denote the combination as
, perform the peak clustering based data restoration task; otherwise, the discriminant error of discriminator
would be back propagated to re-train the generator
, as shown in
Table 2.
5. Simulation Experiments and Result Analysis
In this section, the simulation experiments are divided into two parts, i.e., data restoration on University of California Irvine (UCI) standard datasets and heterogeneous data integration on intelligent power distribution and utilization datasets. The former one is performed to verify the validity and stability of our proposed GANs-HDI algorithm, while the latter one is performed to test the actual effect of our proposed GANs-HDI algorithm for intelligent power distribution and utilization heterogeneous data in TensorFlow platform. All of the following simulation experiments were performed in Matlab 2012a and JetBrains PyCharm 2017.2 environment with Core-TM i3-M330@2.13GHz and NVIDIA GeForce 840M processor, respectively.
5.1. Simulation Experiments on UCI Standard Datasets
The simulation experiment introduced three UCI standard datasets, i.e., ’
Abalone’, ‘
Heart Disease’, and ‘
Bank Marketing’, for performance comparison of data restoration in the Matlab 2012a environment. In this simulation experiment, the incomplete sample proportion in the total samples was set as 20%, and the information loss rate was 25%. Incomplete data sample and missing indexes were randomly selected. The detailed information of the three UCI standard datasets is as shown in
Table 3. Taking ‘
Abalone’ dataset as an example, 60 samples were randomly selected from a total of 4177 data samples as the incomplete samples. In these 60 samples, two indexes were randomly picked out to delete their corresponding information, and formed a data sample set that to be repaired.
In order to verify the data restoration performance of the proposed GANs-HDI algorithm on UCI standard datasets, k-nearest neighbors (k-NN), error-back propagation (BP), matrix completion [
14], Deep Learning [
18], and proposed Peak Clustering in
Section 2 were chosen as control groups with parts of the model parameters selected by experience. Specifically speaking, the cluster number was equal to the sample class number in k-NN algorithm. The numbers of hidden neural nodes were set to be 10/25/12 and the layer number set to be 8 for three UCI standard datasets in BP algorithm with Sigmodal function as the activation function. The layer number set to be 8, and the numbers of hidden neural nodes were set to be [15, 12, 12, 10, 10, 8, 8, 8]/[35, 24, 24, 17, 17, 15, 15, 15]/[20, 18, 18, 15, 15, 12, 12, 12] for three UCI standard datasets in Deep Learning algorithm with Sigmodal function as the activation function. In the proposed Peak Clustering and GANs-HDI algorithms, the threshold of discrimination rate was set to be
= 0.05, the reducing pace was set to be
= 0.0015, the numbers of hidden neural nodes were set to be
= 10/25/12, initialized threshold values as
= 0.85 and
= 0.6, clustering thresholds as
= 2, select Sigmodal function and new generation proportion
= 0.5.
Repair the incomplete data samples with k-NN, Peak Clustering, BP, Matrix Completion [
14], Deep Learning [
18], and GANs-HDI algorithms, respectively. Then, determine whether the categories of restored samples were correct or not by using support vector machine (SVM), and calculate the accuracy values. Repeat 10 trials independently, and calculate the averages and root mean squared error (RMSE) of the accuracy values of data restoration results, as shown in
Table 4 (more details in
Table A1).
According to the data shown in
Table 4, it is obvious that the time-consuming of both k-NN, matrix completion, Peak Clustering algorithms held the almost same quantity level, while Peak Clustering performed much better than the traditional k-NN algorithm and matrix completion algorithm on the accuracy of data restoration, especially held a more prominent repair effect for linear inseparable data samples. The data restoration performances of BP and Deep Learning [
18] algorithm succeeded to beat Peak Clustering algorithm on UCI datasets. However, its RMSE was far from requirement, so the BP algorithm is not stable enough to carry out the engineering application directly. It is worth noting that the GANs-HDI algorithm is far superior to the other control groups in both of the accuracy and RMSE with 20–35 percentage points ahead. However, the algorithm takes a longer time to run, and needs to rely on regularization constraints and distributed computing technologies to improve its convergence efficiency.
In summary, the data restoration performances of GANs-HDI on UCI standard datasets were outstanding when compared with k-NN, BP, matrix completion, Peak Clustering, and deep learning algorithms. The validity and stability of our proposed GANs-HDI algorithm are verified through the simulation comparison experiments. Furthermore, the experimental results from UCI standard data also showed that the sample number might have a great influence on the final performances of the GANs-HDI algorithm.
5.2. Simulation Experiments on Intelligent Power Distribution and Utilization Dataset (I)
In this section, the simulation experiment took power cable test data of sixty 22 kV XLPE power cable samples for performance comparison of heterogeneous data integration in the JetBrains PyCharm 2017.2 environment. The power cable tests include the accelerated thermal aging tensile fracture test, accelerated thermal extension test, differential scanning calorimetry test, breakdown test, and DC leakage current test. In this simulation experiment, the incomplete sample proportion in the total samples was set to be 20%, and information loss rates were set to be 15%. Incomplete data sample and missing indexes were randomly selected. According to the incomplete sample proportion, 12 samples were randomly selected from total 60 data samples as the incomplete samples. Then, in these chosen samples, two indexes were randomly picked out to delete their corresponding information, and formed a set of data samples to be repaired, according to the information loss rate. Insulating state test indicators of 22 kV XLPE power cable are as shown in
Table 5. After the data restoration, this section employed support vector machine (SVM) to predict targeted power cable samples’ relative aging times, where 15 samples were treated as the test group, and the other 45 samples were the training ones.
In order to verify the data integration performance of the proposed GANs-HDI algorithm, k-nearest neighbors (k-NN), and error-back propagation (BP) were chosen as control groups with parts of the model parameters selected by experience. The cluster number was equal to the sample class number in k-NN algorithm. The number of hidden neural nodes was set to be 10 in BP algorithm with Sigmodal function as the activation function. In the proposed GANs-HDI algorithm, the threshold of discrimination rate was set to be = 0.05, the reducing pace was set to be = 0.0005, the number of hidden neural nodes was set to be = 10, initialized threshold values as = 0.85 and = 0.6, clustering threshold values as = 2, Sigmodal function was chosen as the activation function, and new generation proportion was set to be 0.5.
Repair the incomplete data samples with k-NN, BP, and GANs-HDI algorithms, respectively, and calculated the deviation rate with the real values. After the data restoration, employ SVM to perform the relative aging time prediction tasks. Repeat 10 trials independently, and calculate the averages and RMSE of the accuracy values of data restoration results, as shown in
Table 6.
According to the data shown in
Table 6, life prediction results could be greatly improve by the data restoration of missing information in this case. It also demonstrated that the newly proposed GANs-HDI algorithm can effectively deal with small sample sized life prediction problems, which cannot be handled by the combinations of traditional algorithms, as caused by the disunity on cable test categories of different manufacturers.
5.3. Simulation Experiments on Intelligent Power Distribution and Utilization Dataset (II)
In this section, the simulation experiment took the medium voltage basic data of 171 towns in power quality on-line monitoring system, from 2015 to 2016, for performance comparison of heterogeneous data integration in the JetBrains PyCharm 2017.2 environment. In this simulation experiment, the incomplete sample proportion in the total samples was set to be 20%, and information loss rates were set to be 5%, 15%, 30%, respectively. Incomplete data sample and missing indexes were randomly selected. According to the incomplete sample proportion, parts of samples were randomly selected from total 342 data samples as the incomplete samples. Then, in these chosen samples, parts of indexes were randomly picked out to delete their corresponding information, and formed a set of data samples to be repaired, according to the information loss rate. Normalized data of typical samples is as shown in
Table 7 (original data in
Table A2).
In order to verify the data integration performance of the proposed GANs-HDI algorithm on IPDU heterogeneous dataset, k-nearest neighbors (k-NN), and error-back propagation (BP) were chosen as control groups with parts of the model parameters selected by experience. The cluster number was equal to the sample class number in k-NN algorithm. The number of hidden neural nodes was set to be 10 in BP algorithm with Sigmodal function as the activation function. In the proposed GANs-HDI algorithm, the threshold of discrimination rate was set to be = 0.05, the reducing pace was set to be = 0.0005, the number of hidden neural nodes was set to be = 10, initialized threshold values as = 0.85 and = 0.6, clustering threshold values as = 2, and Sigmodal function was chosen as the activation function.
Repair the incomplete data samples with k-NN, BP, and GANs-HDI algorithms, respectively, and calculated the deviation rate with the real values. Repeat 10 trials independently, and calculate the averages and RMSE of the accuracy values of data restoration results, as shown in
Table 8.
According to the data shown in
Table 6, information loss rate and deviation rate shown a significant proportional relationship. Since there is no strong causal link between the indexes in IPDU heterogeneous datasets, the performance of traditional BP algorithm was not satisfactory in the experiments. On the other side, the performance of GANs-HDI algorithm was much better than k-NN and BP on deviation rate with 15 percentage points ahead. Moreover, when the information loss rate took 30%, the deviation rate of k-NN algorithm zoomed up, and the integration results were far away from the real sample space. However, the new proposed GANs-HDI algorithm holds good resistance to the changes of information loss rates, and showed its outstanding stability.
When considering the influence of sample number on the algorithm performances shown in
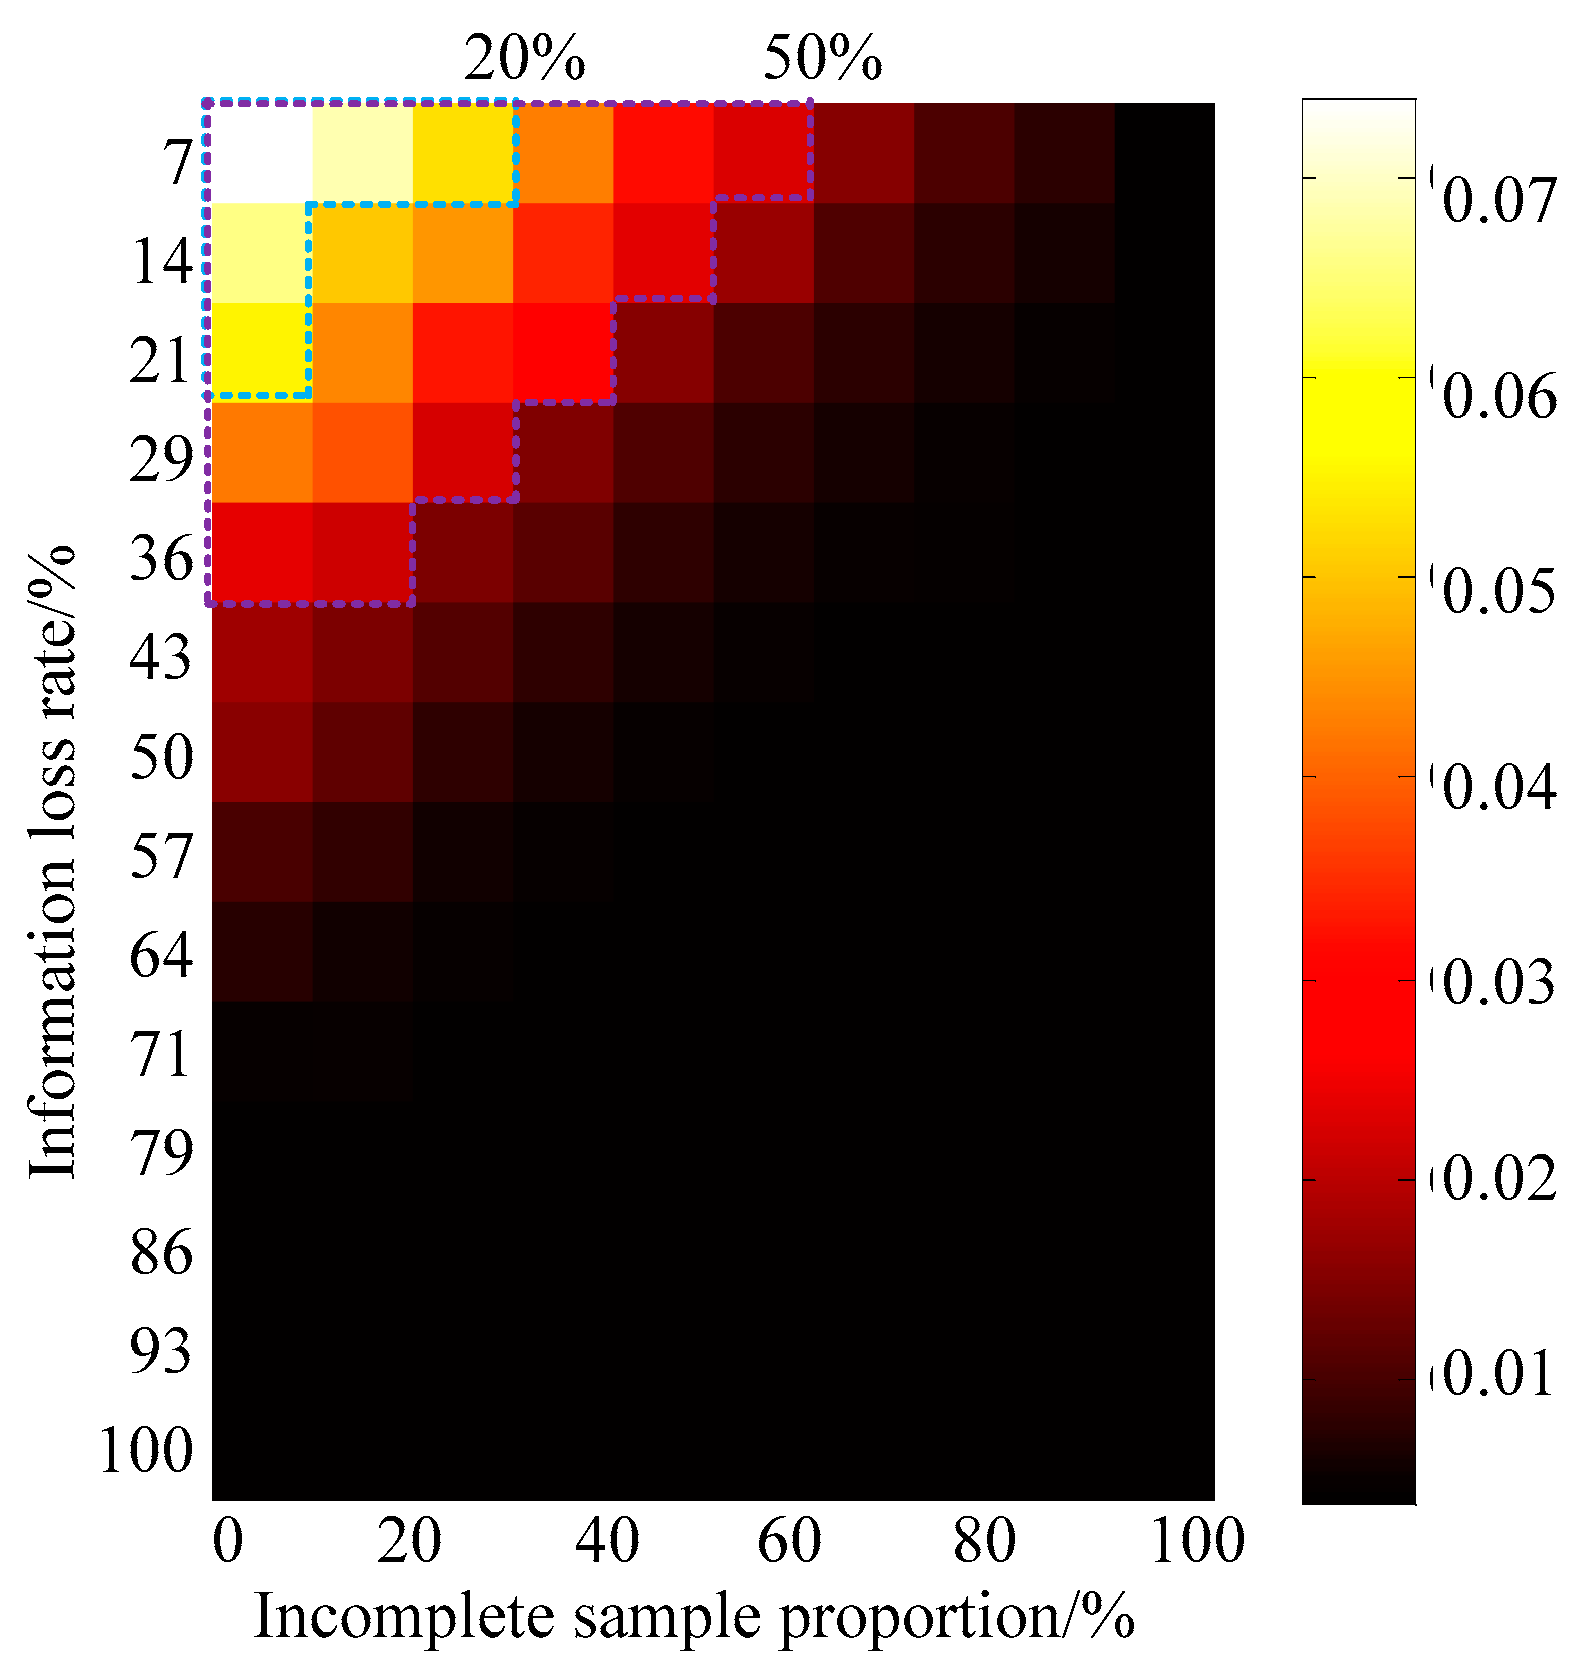
Section 4, it would be necessary to study on the relationship between data integration performance and parameters in GANs-HDI. In order to further proof the influences of incomplete sample proportion and information loss rate on the heterogeneous data integration performance of GANs-HDI, deviation rates were calculated with different incomplete sample proportions and information loss rates on IPDU heterogeneous datasets, as shown in
Figure 5.
In
Figure 5, the color of each color block indicates the reciprocal of the mean of deviation rates from 10 independent repeated experiments with same incomplete sample proportion and information loss rate. The brighter the color, the better the algorithm works. With the decreases of incomplete sample proportion and information loss rate, data integration performance of GANs-HDI algorithm gradually improves. In
Figure 4, the boundaries of deviation rate 20% and 50% were marked. It is obvious that, when the incomplete sample proportion is less than 30%, and the information loss rate is less than 20%, the confidence of IPDU heterogeneous data integration is considerably higher. Generally speaking, the larger volume of dataset is, the higher accuracy of data integration would be, and the confidence level of the results of heterogeneous data integration of distribution network will also show an overall upward trend.
6. Summary
Aiming at the low utilization efficiency problem of heterogeneous data resources for intelligent power distribution and utilization in the small sample environment, this paper proposed a so-called GANs based heterogeneous data integration technology. In this proposed method, the sample space is expanded by introducing GANs theory, according to the targeted samples with all of the measurement indexes complete. Then, a novel peak clustering model is constructed to realize the finite open coverage of the expanded sample space, and repair those incomplete samples. At last, the repaired samples are checked by using well-trained discriminator of GANs. Generally speaking, according to creative establishment the finite open coverage of targeted sample space, this paper succeeded in combining of GANs learning and clustering theory, and provided a novel heterogeneous data integration, which cannot be realized by any individual theory alone.
It is worth noting that, as an important part of this work, generative adversarial network models’ convergence has not been perfectly proved in theory by any experts and scholars yet, and its convergence rate still needs further improvement. In the next stage of our team’s works, we would like to study on the improved convergence schemes of GANs for vector data samples, and the distributed learning schemes of GANs with heterogeneous hardware.

