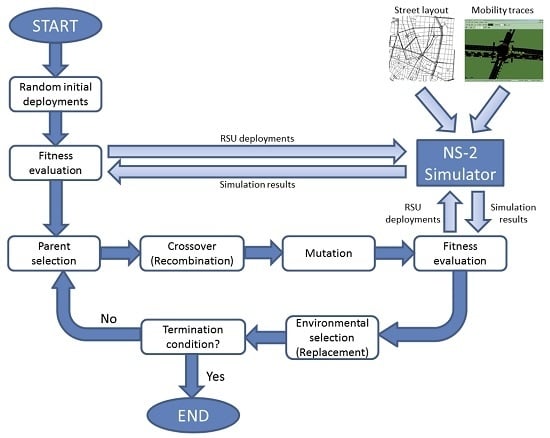
In this section, we present the results obtained by our proposal. First, we study the performance of the genetic algorithm used within the GARSUD approach to search the solution among all the available locations for the RSUs. Second, we present a comparison between GARSUD and other existing RSU deployment strategies (i.e., geographic and the D-RSU). To ensure that the results we have obtained are representative, all the results included in this paper represent an average of three runs.
5.1. Performance of the Genetic Algorithm Used by GARSUD
We tested GARSUD for both the Madrid and Valencia layouts using different vehicle densities, representing diverse traffic flows in different time periods during a given day. Existing approaches are able to perform well considering one single vehicle density only; our proposal, GARSUD, is capable of finding a suitable RSU deployment strategy for a wide range of densities and map layouts.
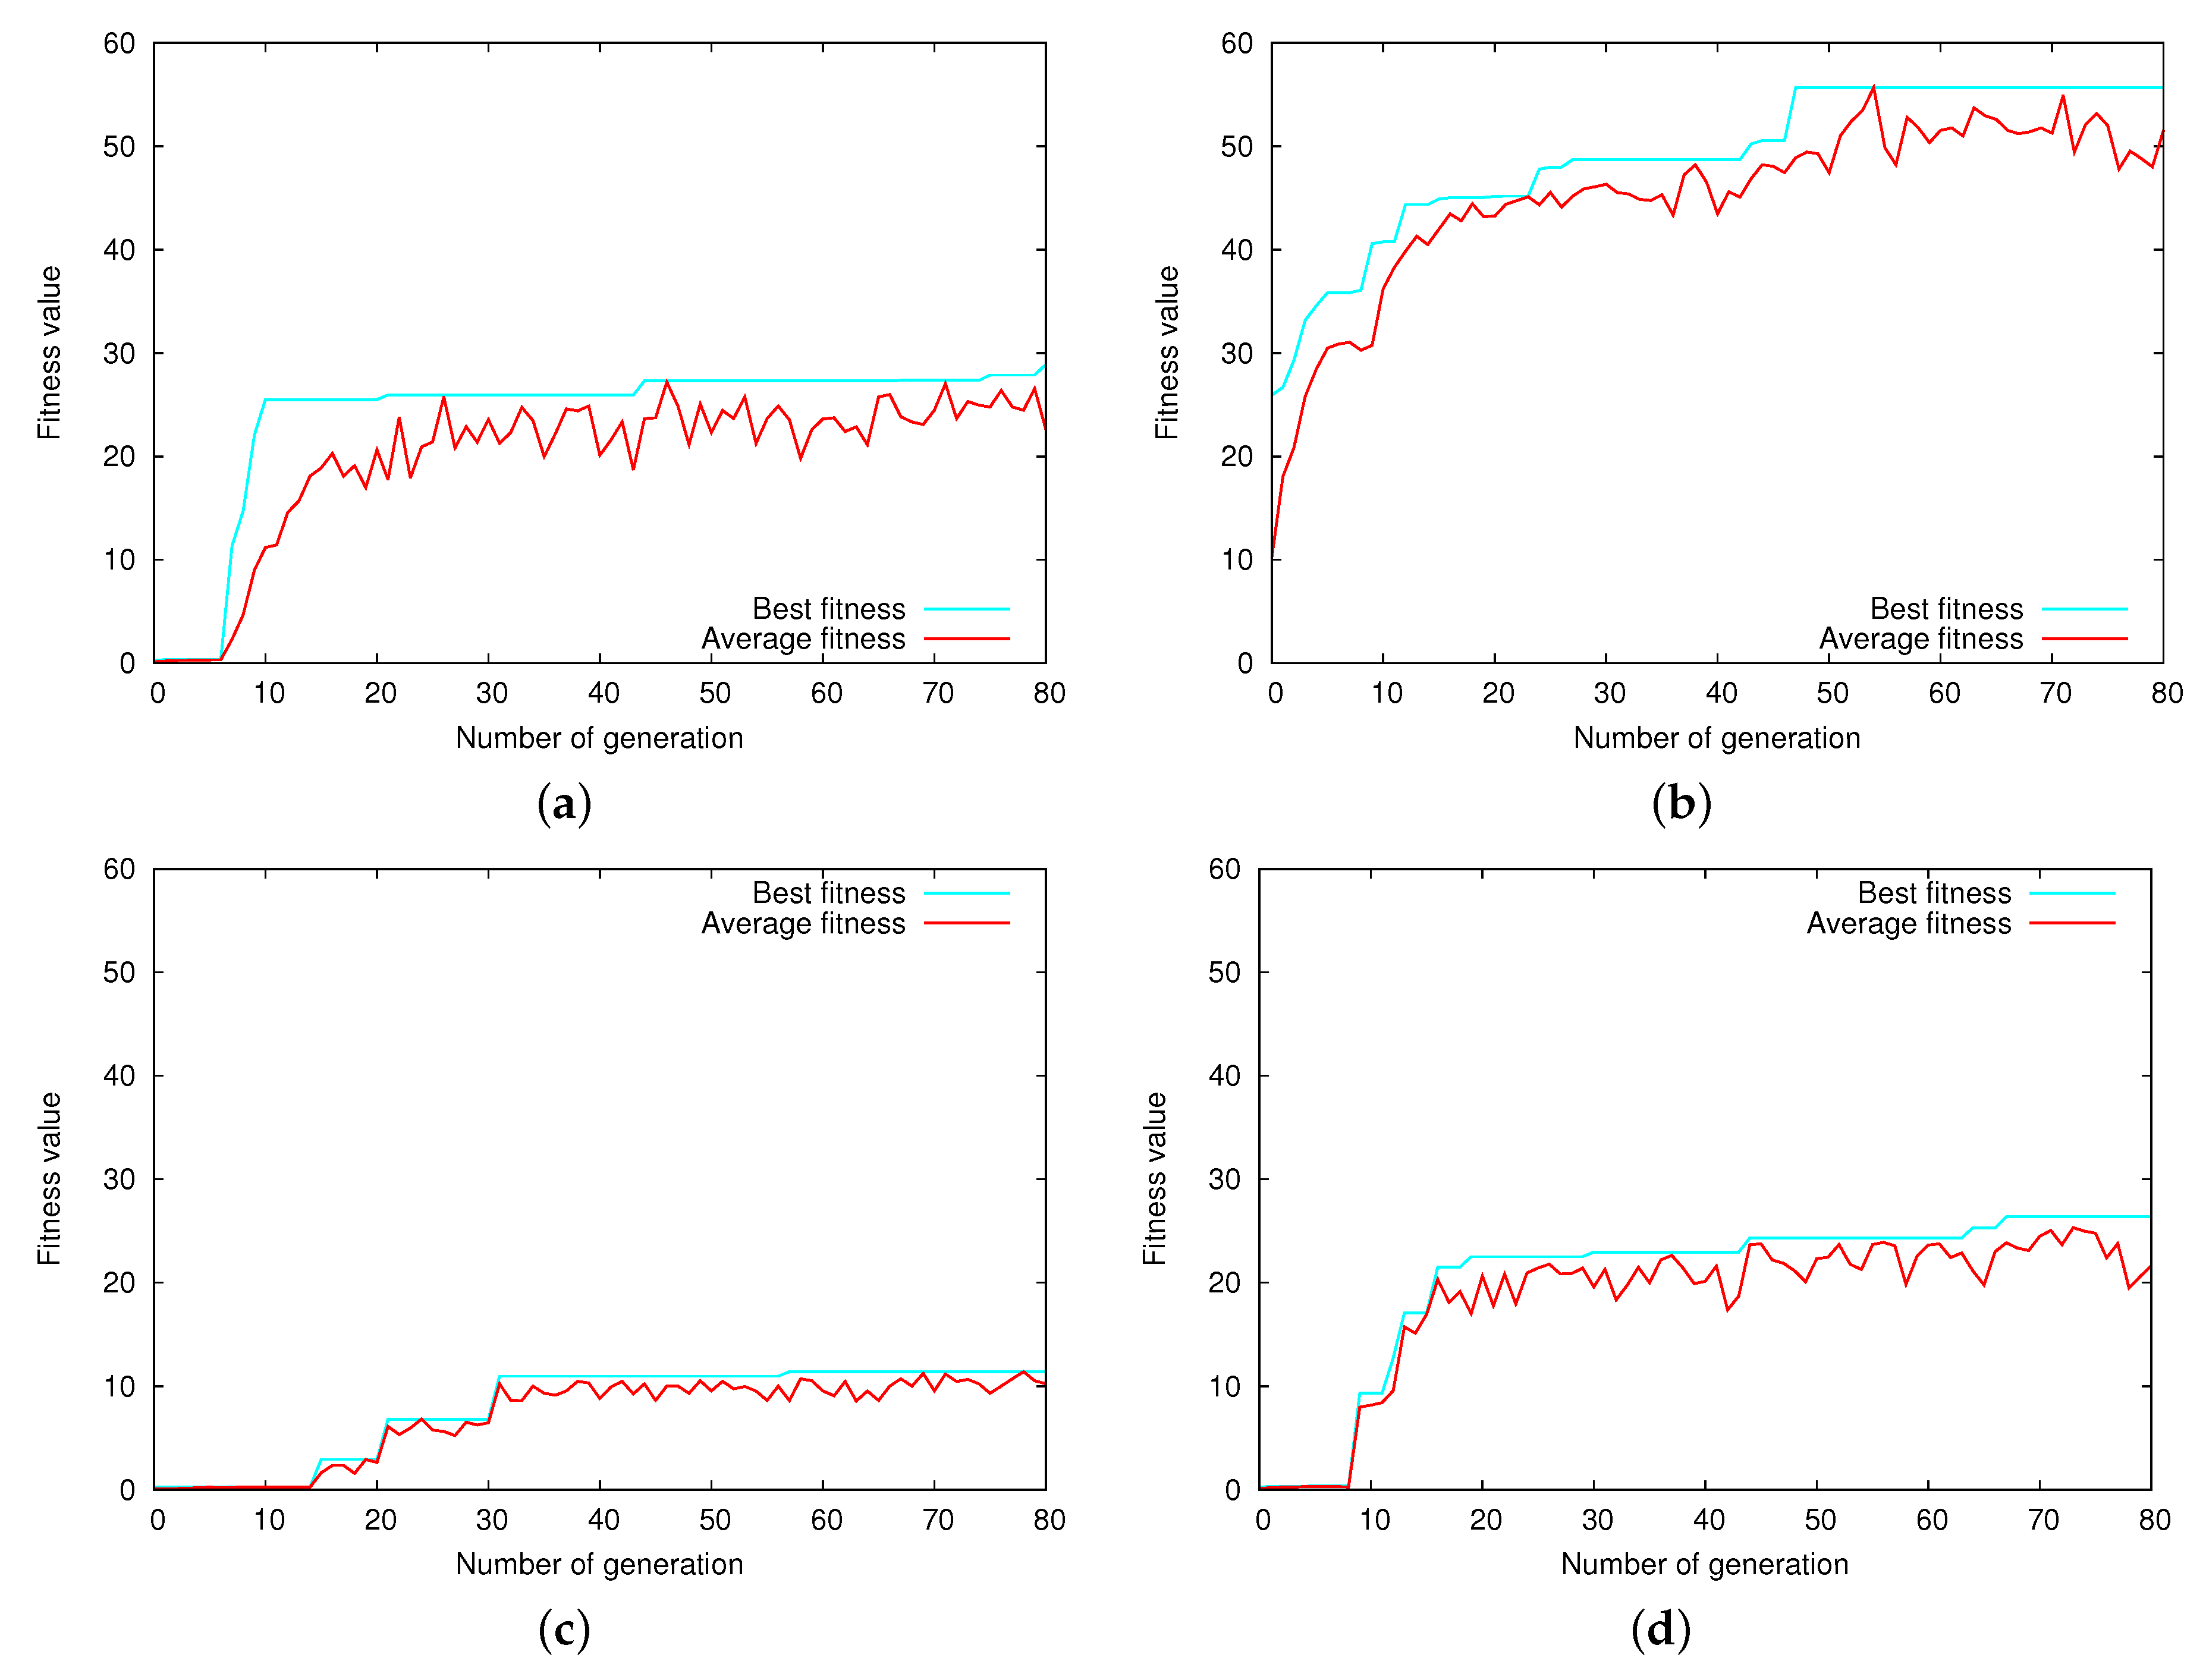
Figure 6 presents the evolutionary process, in terms of the fitness of the best and average individuals (representing possible deployments) using GARSUD in two different situations (i.e., deploying four RSUs and nine RSUs) and two different scenarios (i.e., Madrid and Valencia). The fitness function is related to the average warning notification time of the messages heading towards the RSUs, as expressed in Equation (
1); however, the algorithm is designed for function maximization, and hence, the fitness function is inversely proportional to the measured warning notification time, which should present the lowest value possible. Notice that the main objective is to reduce the warning notification time, and a fitness value of 100 represents a warning notification time equal to 0 s.
As shown in
Figure 6, the genetic algorithm is able to guide the search process, obtaining improved solutions as generations advance by every iteration. The shape of the function is typical of this sort of algorithm: the first generations provide a steep improvement of the target function until the solutions start to converge towards the nearest maximum. However, there are some sudden improvements in the best value, as the mutation operator allows searching new areas of the solution space where new maximums can be found.
Concerning the fitness values obtained, it is distinguishable how increasing the number of RSUs deployed improves the value of the target function of the solutions, especially in Madrid, as using more RSUs allows warning messages covering a broader area with fewer hops. It is also noticeable that the maximum fitness values are obtained in Madrid. This confirms that more time is required to inform the rest of the vehicles in Valencia since its map layout is more complex in terms of communication capabilities (i.e., the warning notification time is higher when compared to Madrid).
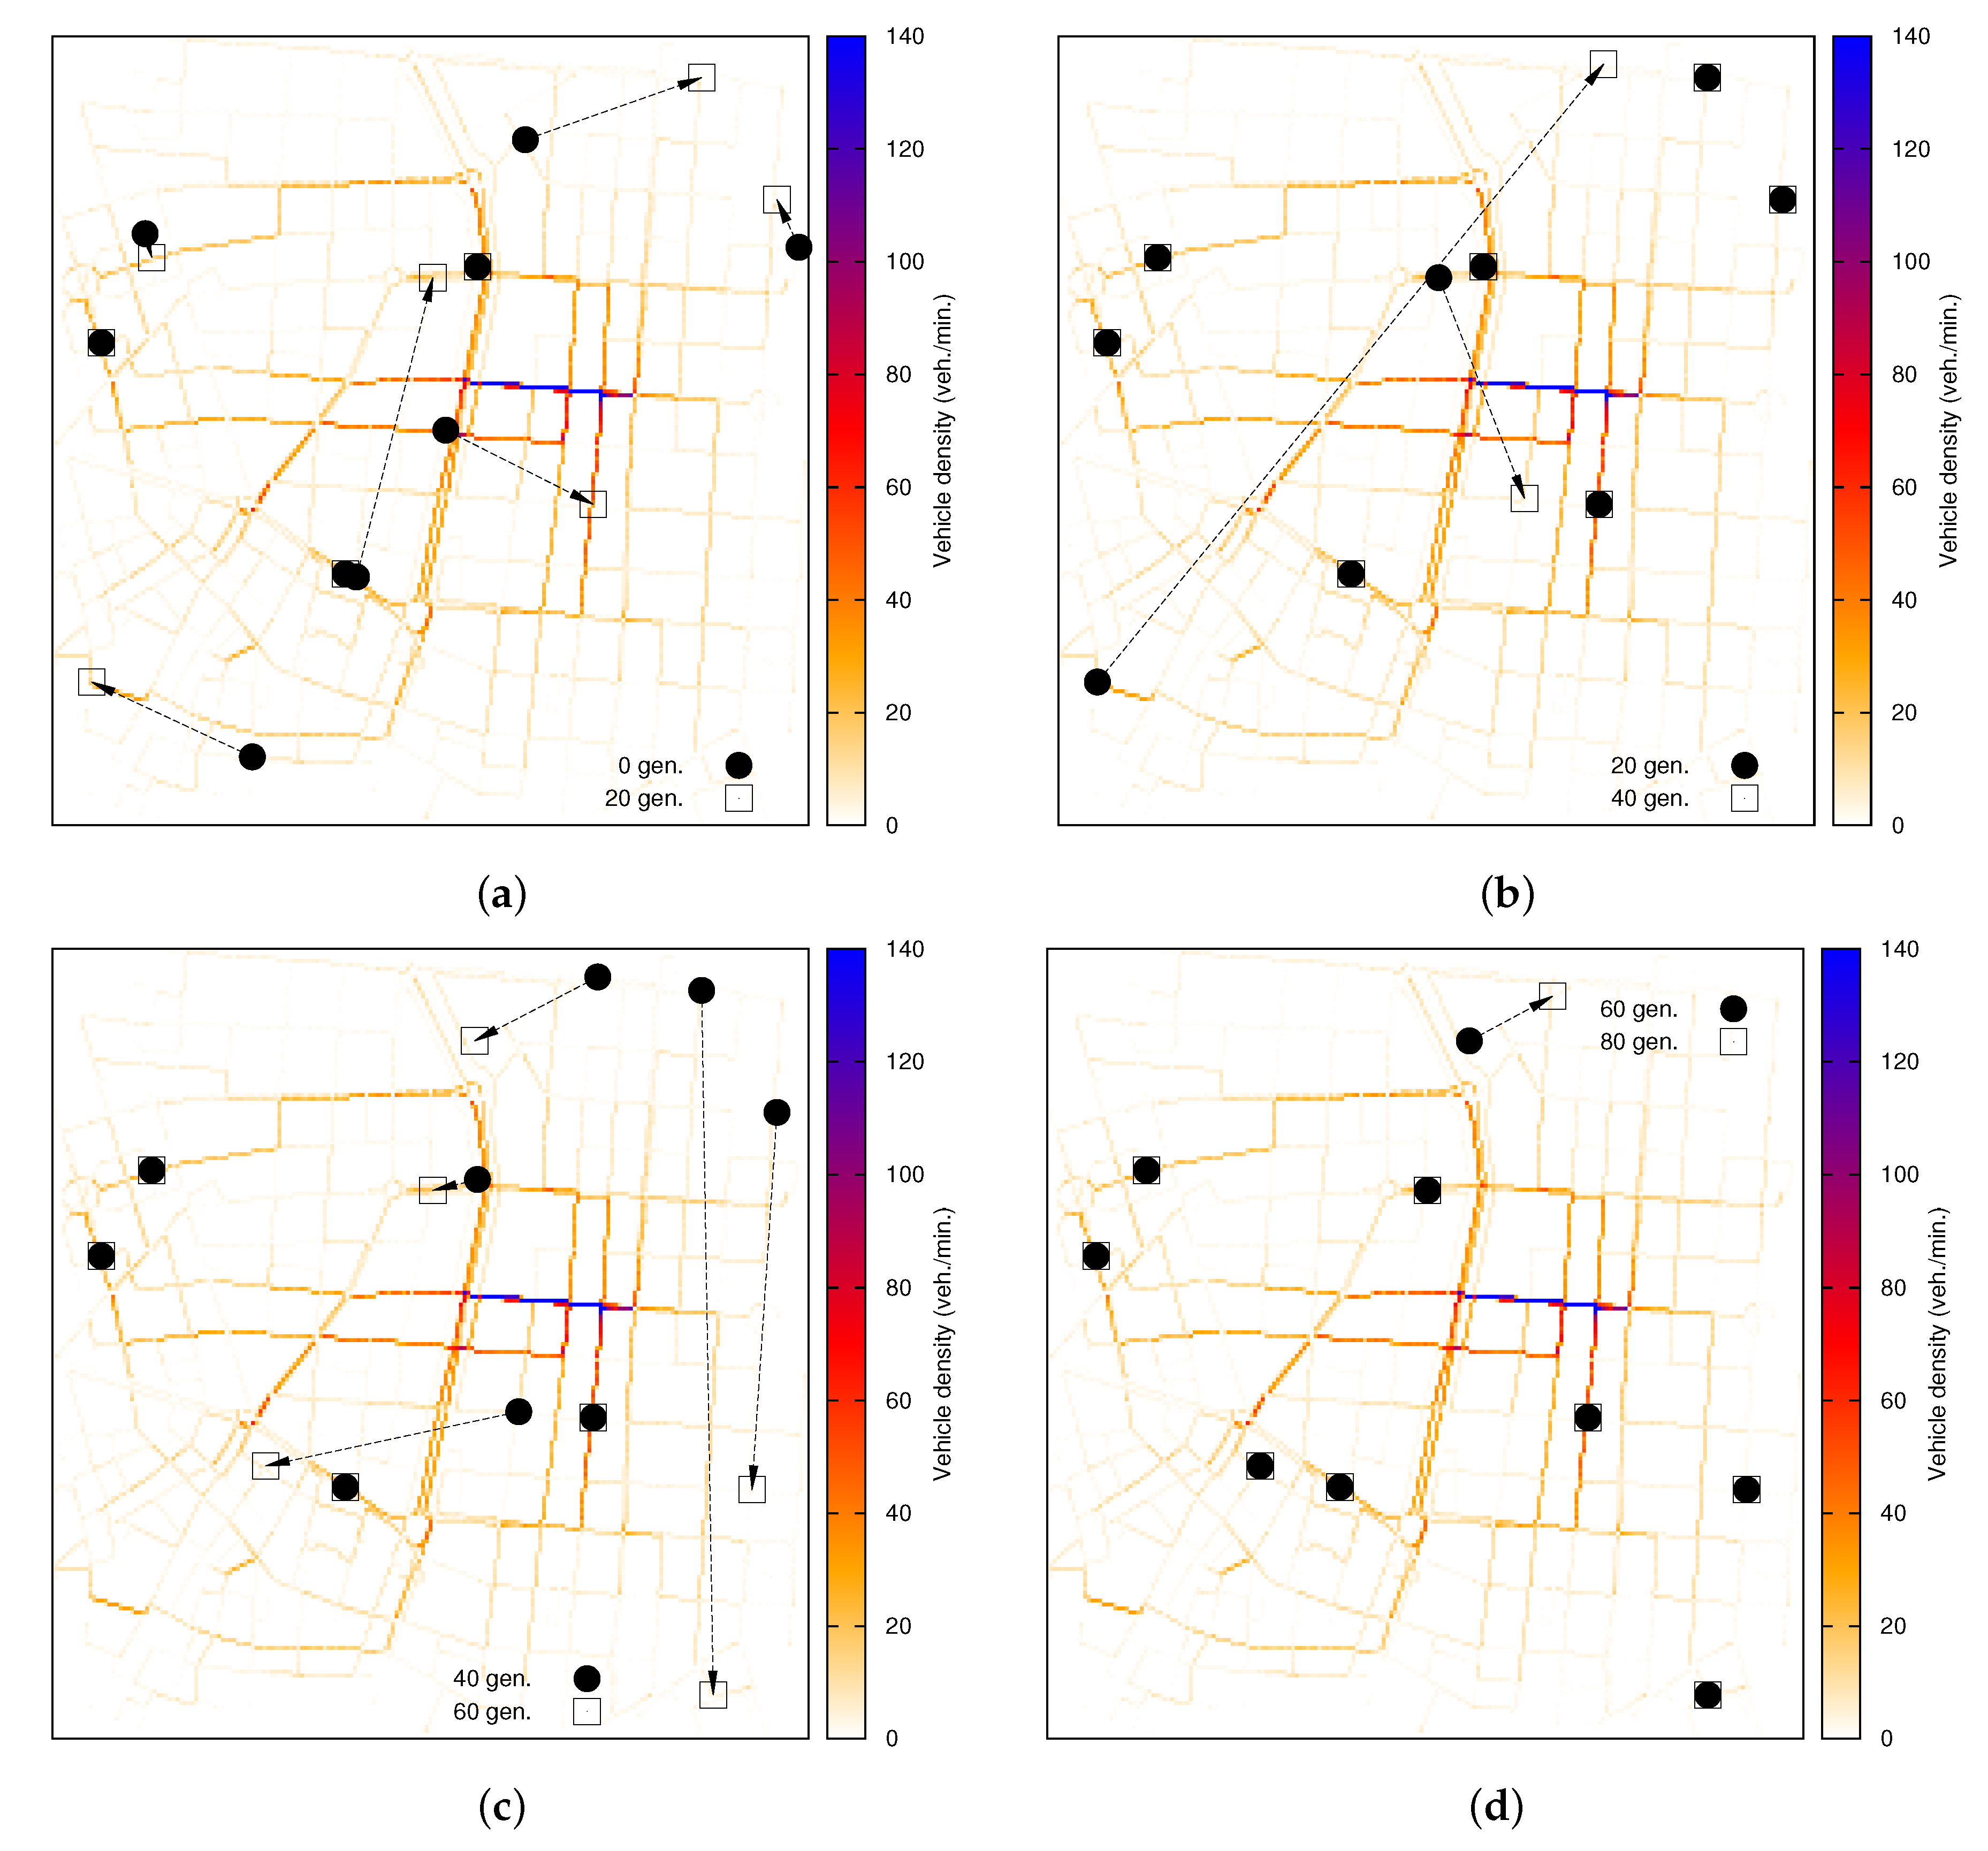
A detailed view of the evolutionary process is presented in
Figure 7 and
Figure 8. These figures depict the RSU locations provided by GARSUD when deploying nine RSUs in Madrid and Valencia, respectively. To enhance the understanding of the evolutionary process, four intermediate locations selected during the first stages of the algorithm are presented (i.e., from Generation 0 to 20, from Generation 20 to 40, from Generation 40 to 60 and, finally, from Generation 60 to 80).
Figure 7 shows the evolution of the algorithm when deploying nine RSUs in Madrid. The number of potential deployments grows drastically when more RSUs are considered; thus, more generations are needed until convergence (as previously evidenced by
Figure 6). The search space is bigger, and the random nature of the process makes it possible to find new optima during further stages of the algorithm. As observed, the locations of several RSUs are modified during the first 60 generations, and after that, eight RSUs are placed in their final location; the remaining one is moved.
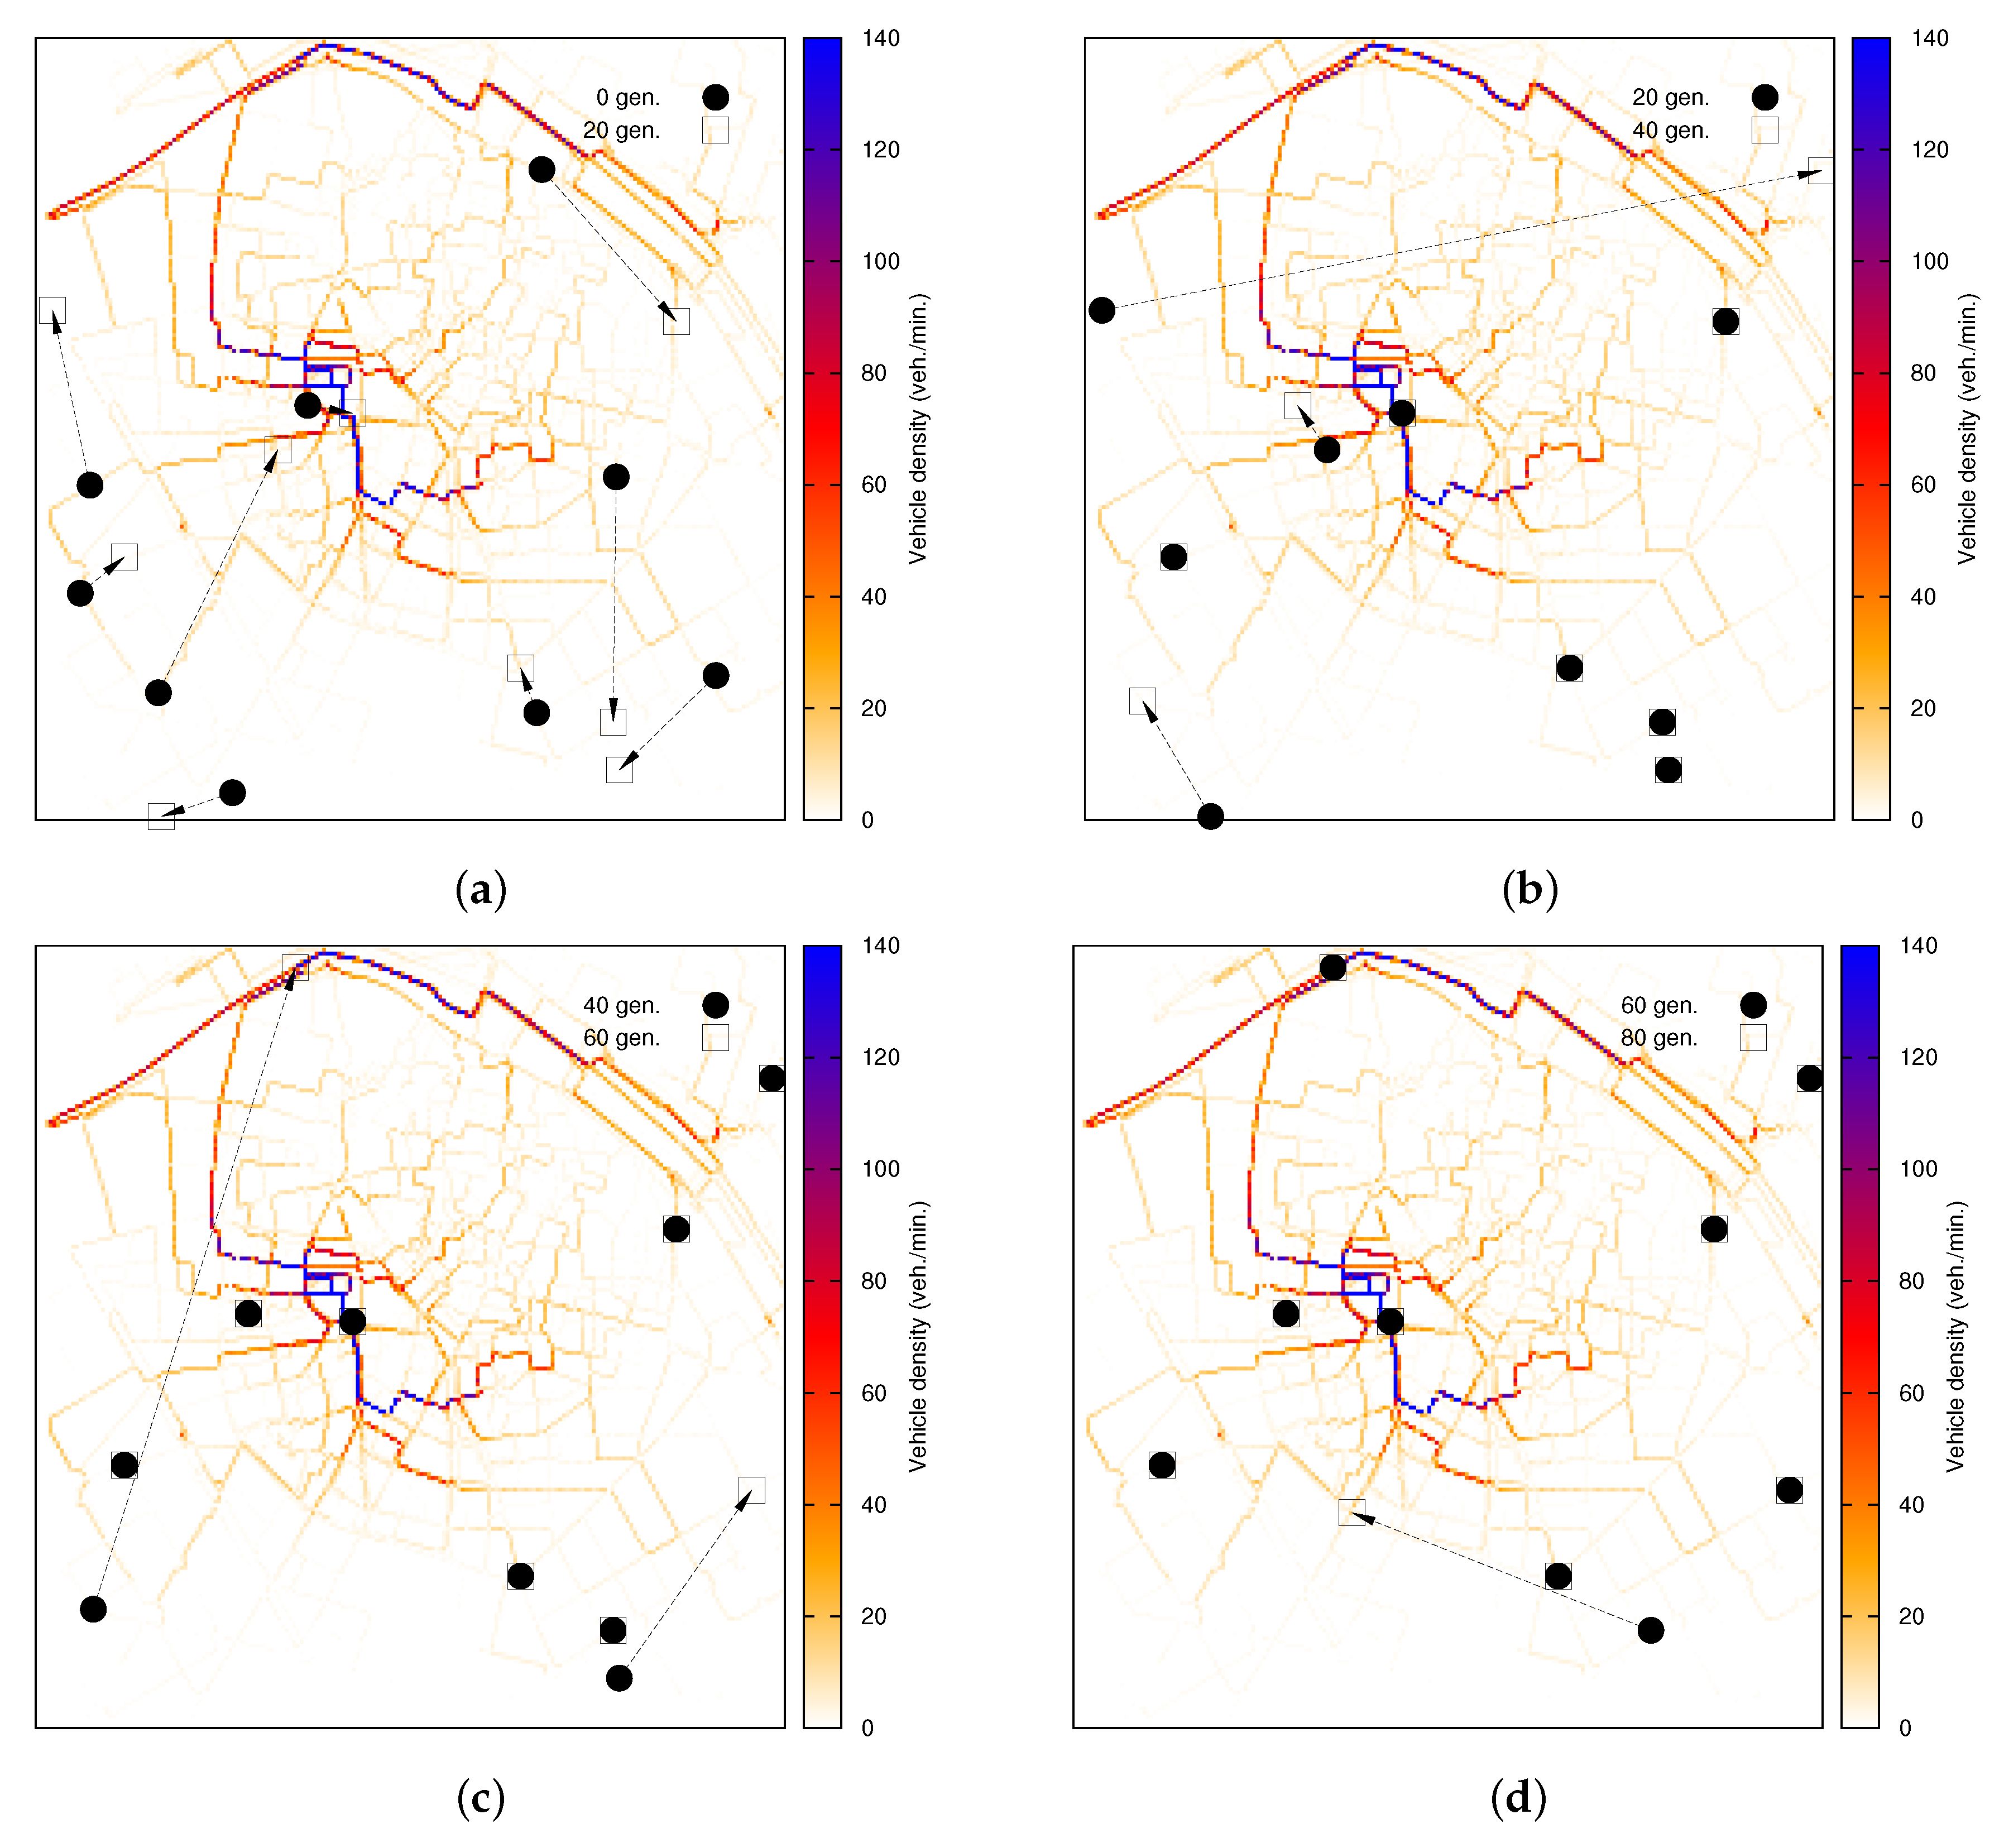
As depicted by
Figure 8, when nine RSUs are available to be deployed in Valencia, we find a slightly different behavior trend compared to Madrid. In particular, the initial random deployment is widely modified during the first generations, achieving a completely different distribution of RSUs after 20 generations. This corresponds to the major gain in the fitness of the solutions as previously mentioned. After this stage, the variability of the solutions is reduced, and some RSUs are assigned to their final position, whereas some others still vary their location to slightly reduce the warning notification time in the solution. As expected, genetic algorithms progressively reduce the variation of the solutions until they converge towards their final solution.
Figure 9 presents the average warning notification time when deploying four and nine RSUs, in both map layouts (i.e., Madrid and Valencia), where different vehicle densities are considered. As shown, the warning notification time is reduced with each new generation of solutions for almost all the selected densities, in particular in low-density scenarios. It is reduced in Madrid from 30.25 s to 5 s when only 100 vehicles are present in the scenario, which represents over an 80% improvement. The final reduction is also about 80% for 200 vehicles and about 60% for 300 vehicles. The improvement when simulating 400 vehicles is very reduced, since increasing the density of vehicles over this threshold increases the probability of finding a connected path of vehicles between a sender vehicle and an RSU. As shown, the biggest improvement in terms of warning notification time is obtained during the first 40 generations, whereas the last 20 generations only provide a slight reduction when 100 vehicles are simulated.
Studying the results in Valencia, we observe that similar to Madrid, the biggest improvement in terms of warning notification time takes place during the first 40 generations of the search process, reducing by about 85% the warning notification time when 100 vehicles are simulated and by about 60% when 200 vehicles are present in the scenario. The improvement during the final part of the process is lower because the genetic algorithm is mostly refining the solutions instead of exploring new areas of the search space. Again, the improvement for high vehicle densities is less noticeable as it is more likely to find a forward path from the warning nodes to the RSUs. Nevertheless, the number of hops needed to overcome the complex layout and reach an RSU is higher, thus increasing the warning notification in all vehicle densities compared to Madrid. These results prove that random RSU deployments are highly inefficient, particularly for low vehicle densities, and the effect of traffic distribution should be taken into account to obtain efficient RSU deployment policies.
5.2. Performance Comparison between GARSUD and Other Existing Approaches
Several schemes have been proposed in order to achieve an efficient RSU deployment in a given scenario, but most of them do not provide enough details to perform a fair comparison. In order to obtain relevant performance results, two well-known algorithms were chosen: (i) geographic deployment and (ii) D-RSU. The geographic approach [
4] provides a uniform coverage of an area by maximizing the distance between RSUs. We slightly modified the geographic approach to place each RSU in main street crosses, facilitating the communication with vehicles. On the contrary, the D-RSU scheme [
4] requires previous knowledge of the distribution of vehicular traffic to perform an asymmetric deployment, assigning less RSUs to the areas with higher vehicle densities (where the wireless multi-hop communication is easier), while increasing the number of RSUs to cover areas with fewer vehicles where communication is often blocked by buildings, urban fixtures and other obstacles. We have compared, in both the Madrid and Valencia scenarios, the performance of our proposed GARSUD algorithm against these two existing schemes (i.e., geographic and D-RSU) in terms of warning notification time.
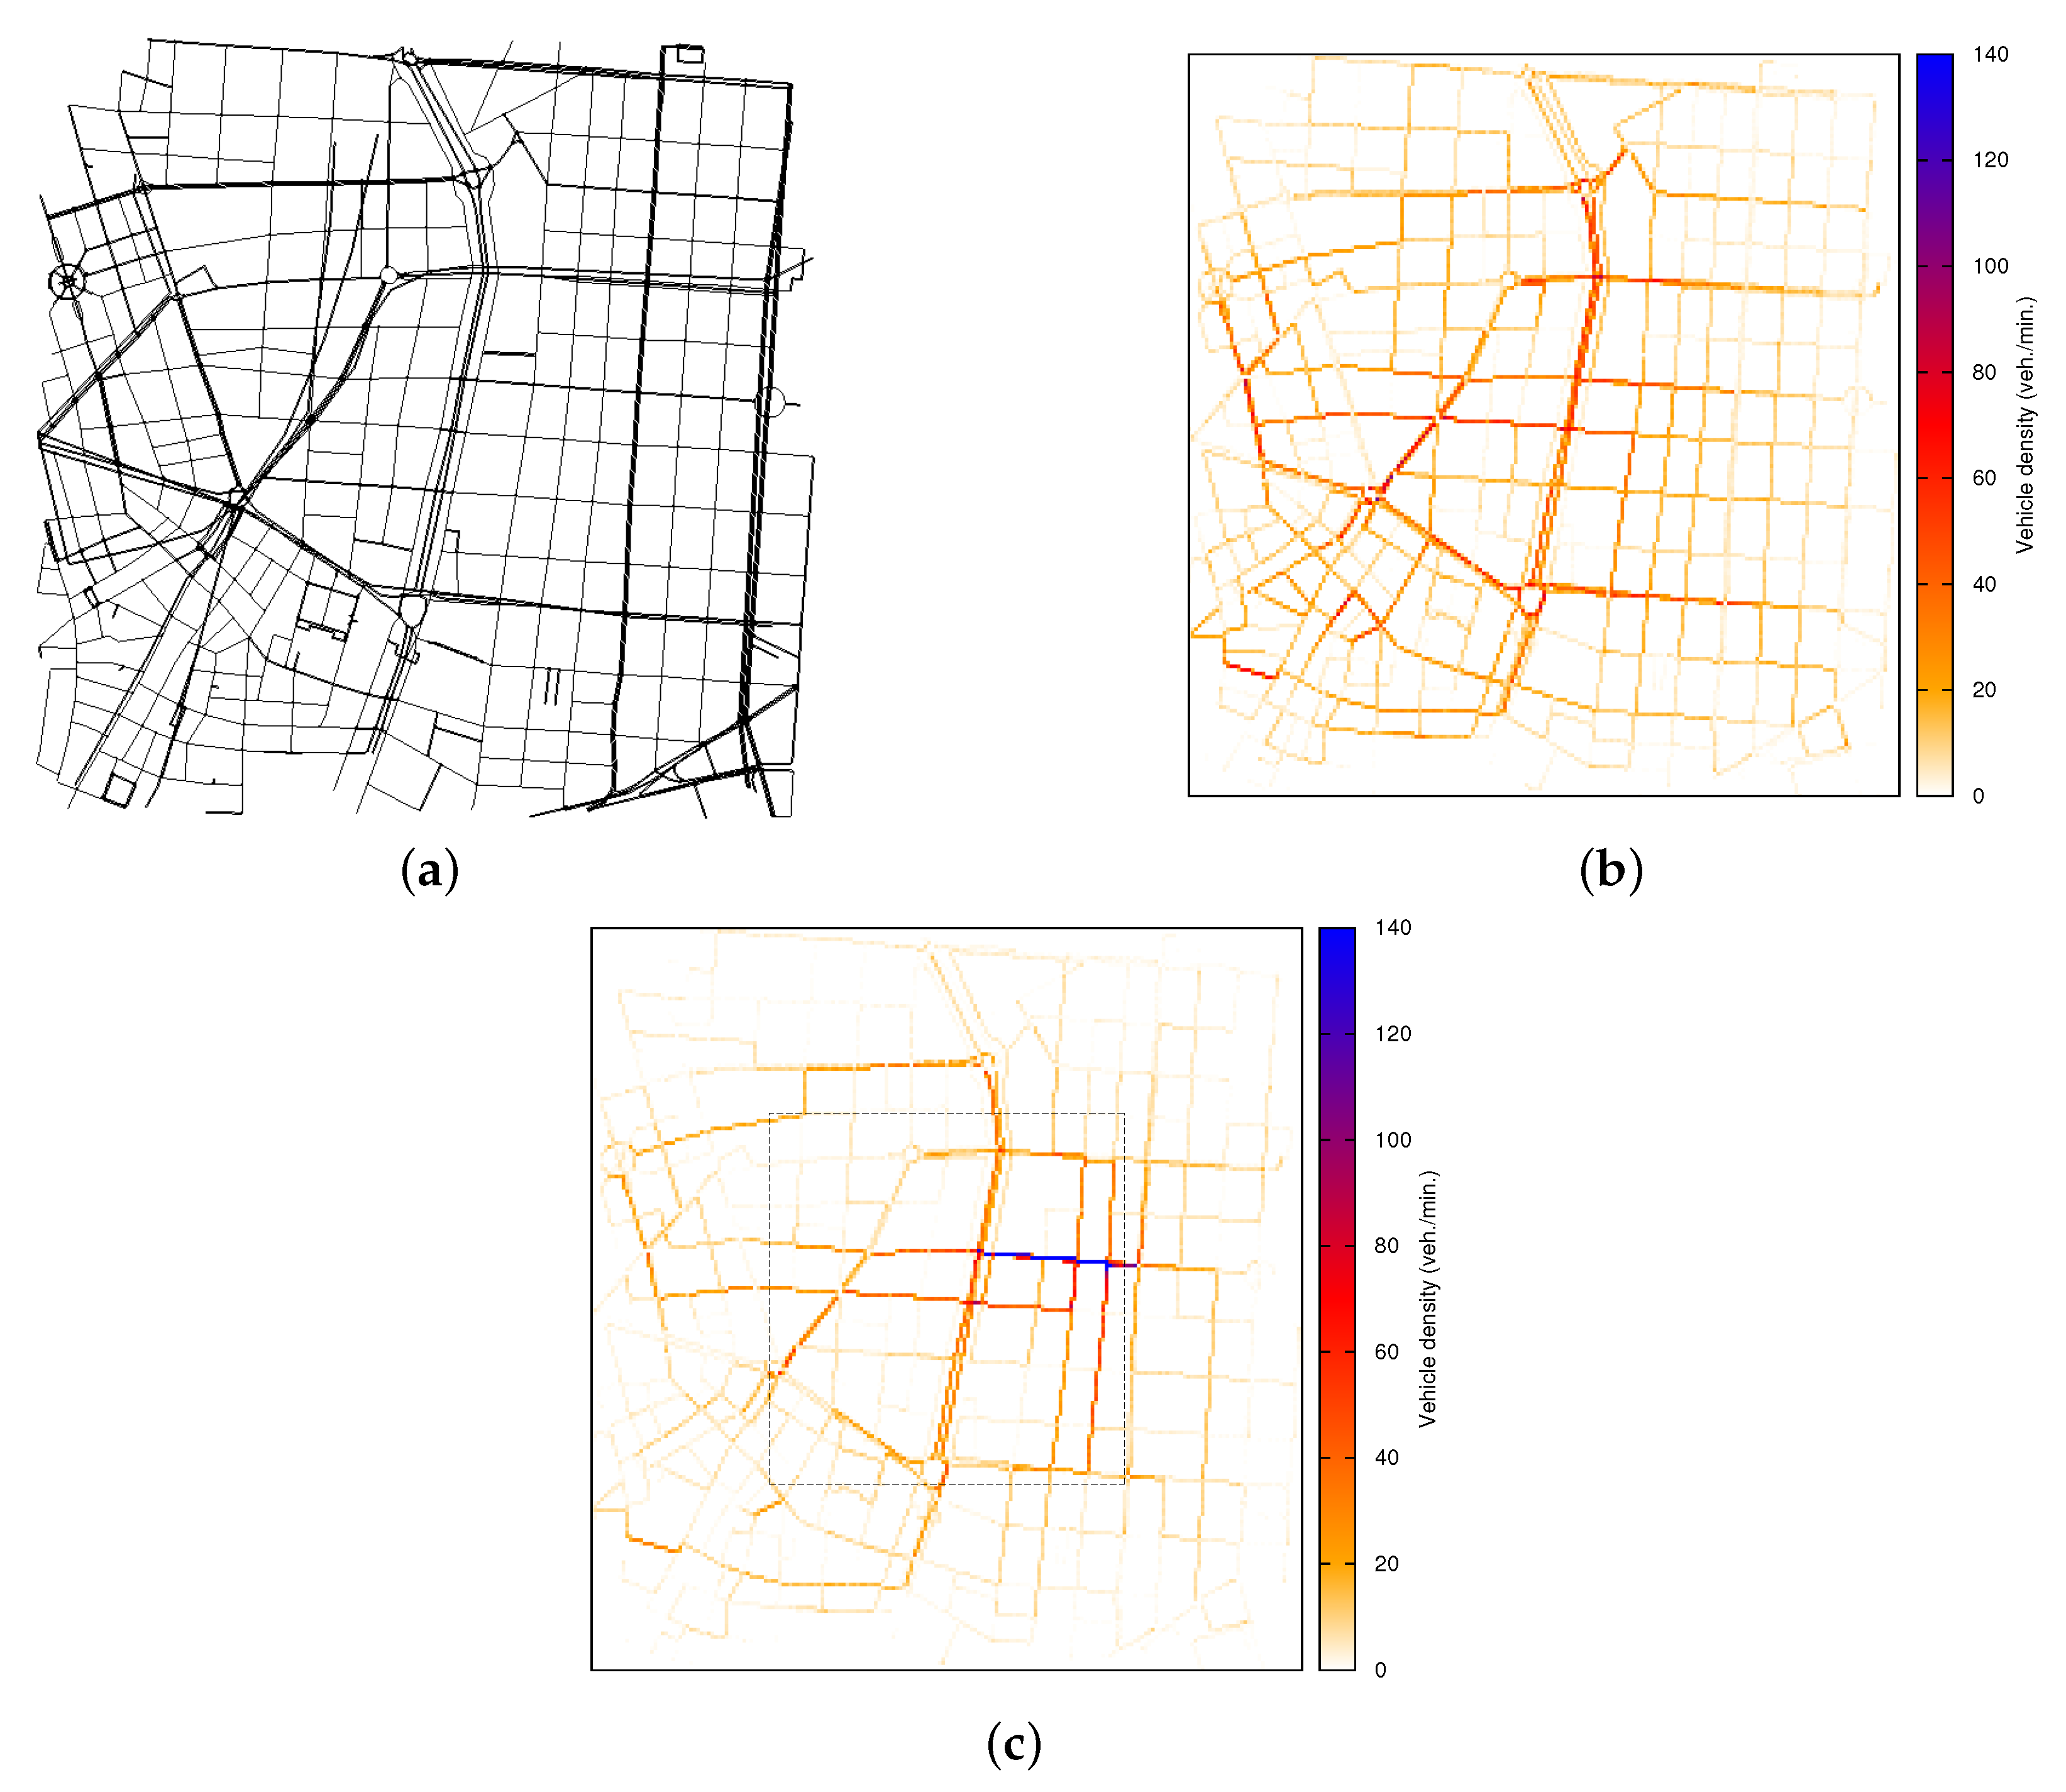
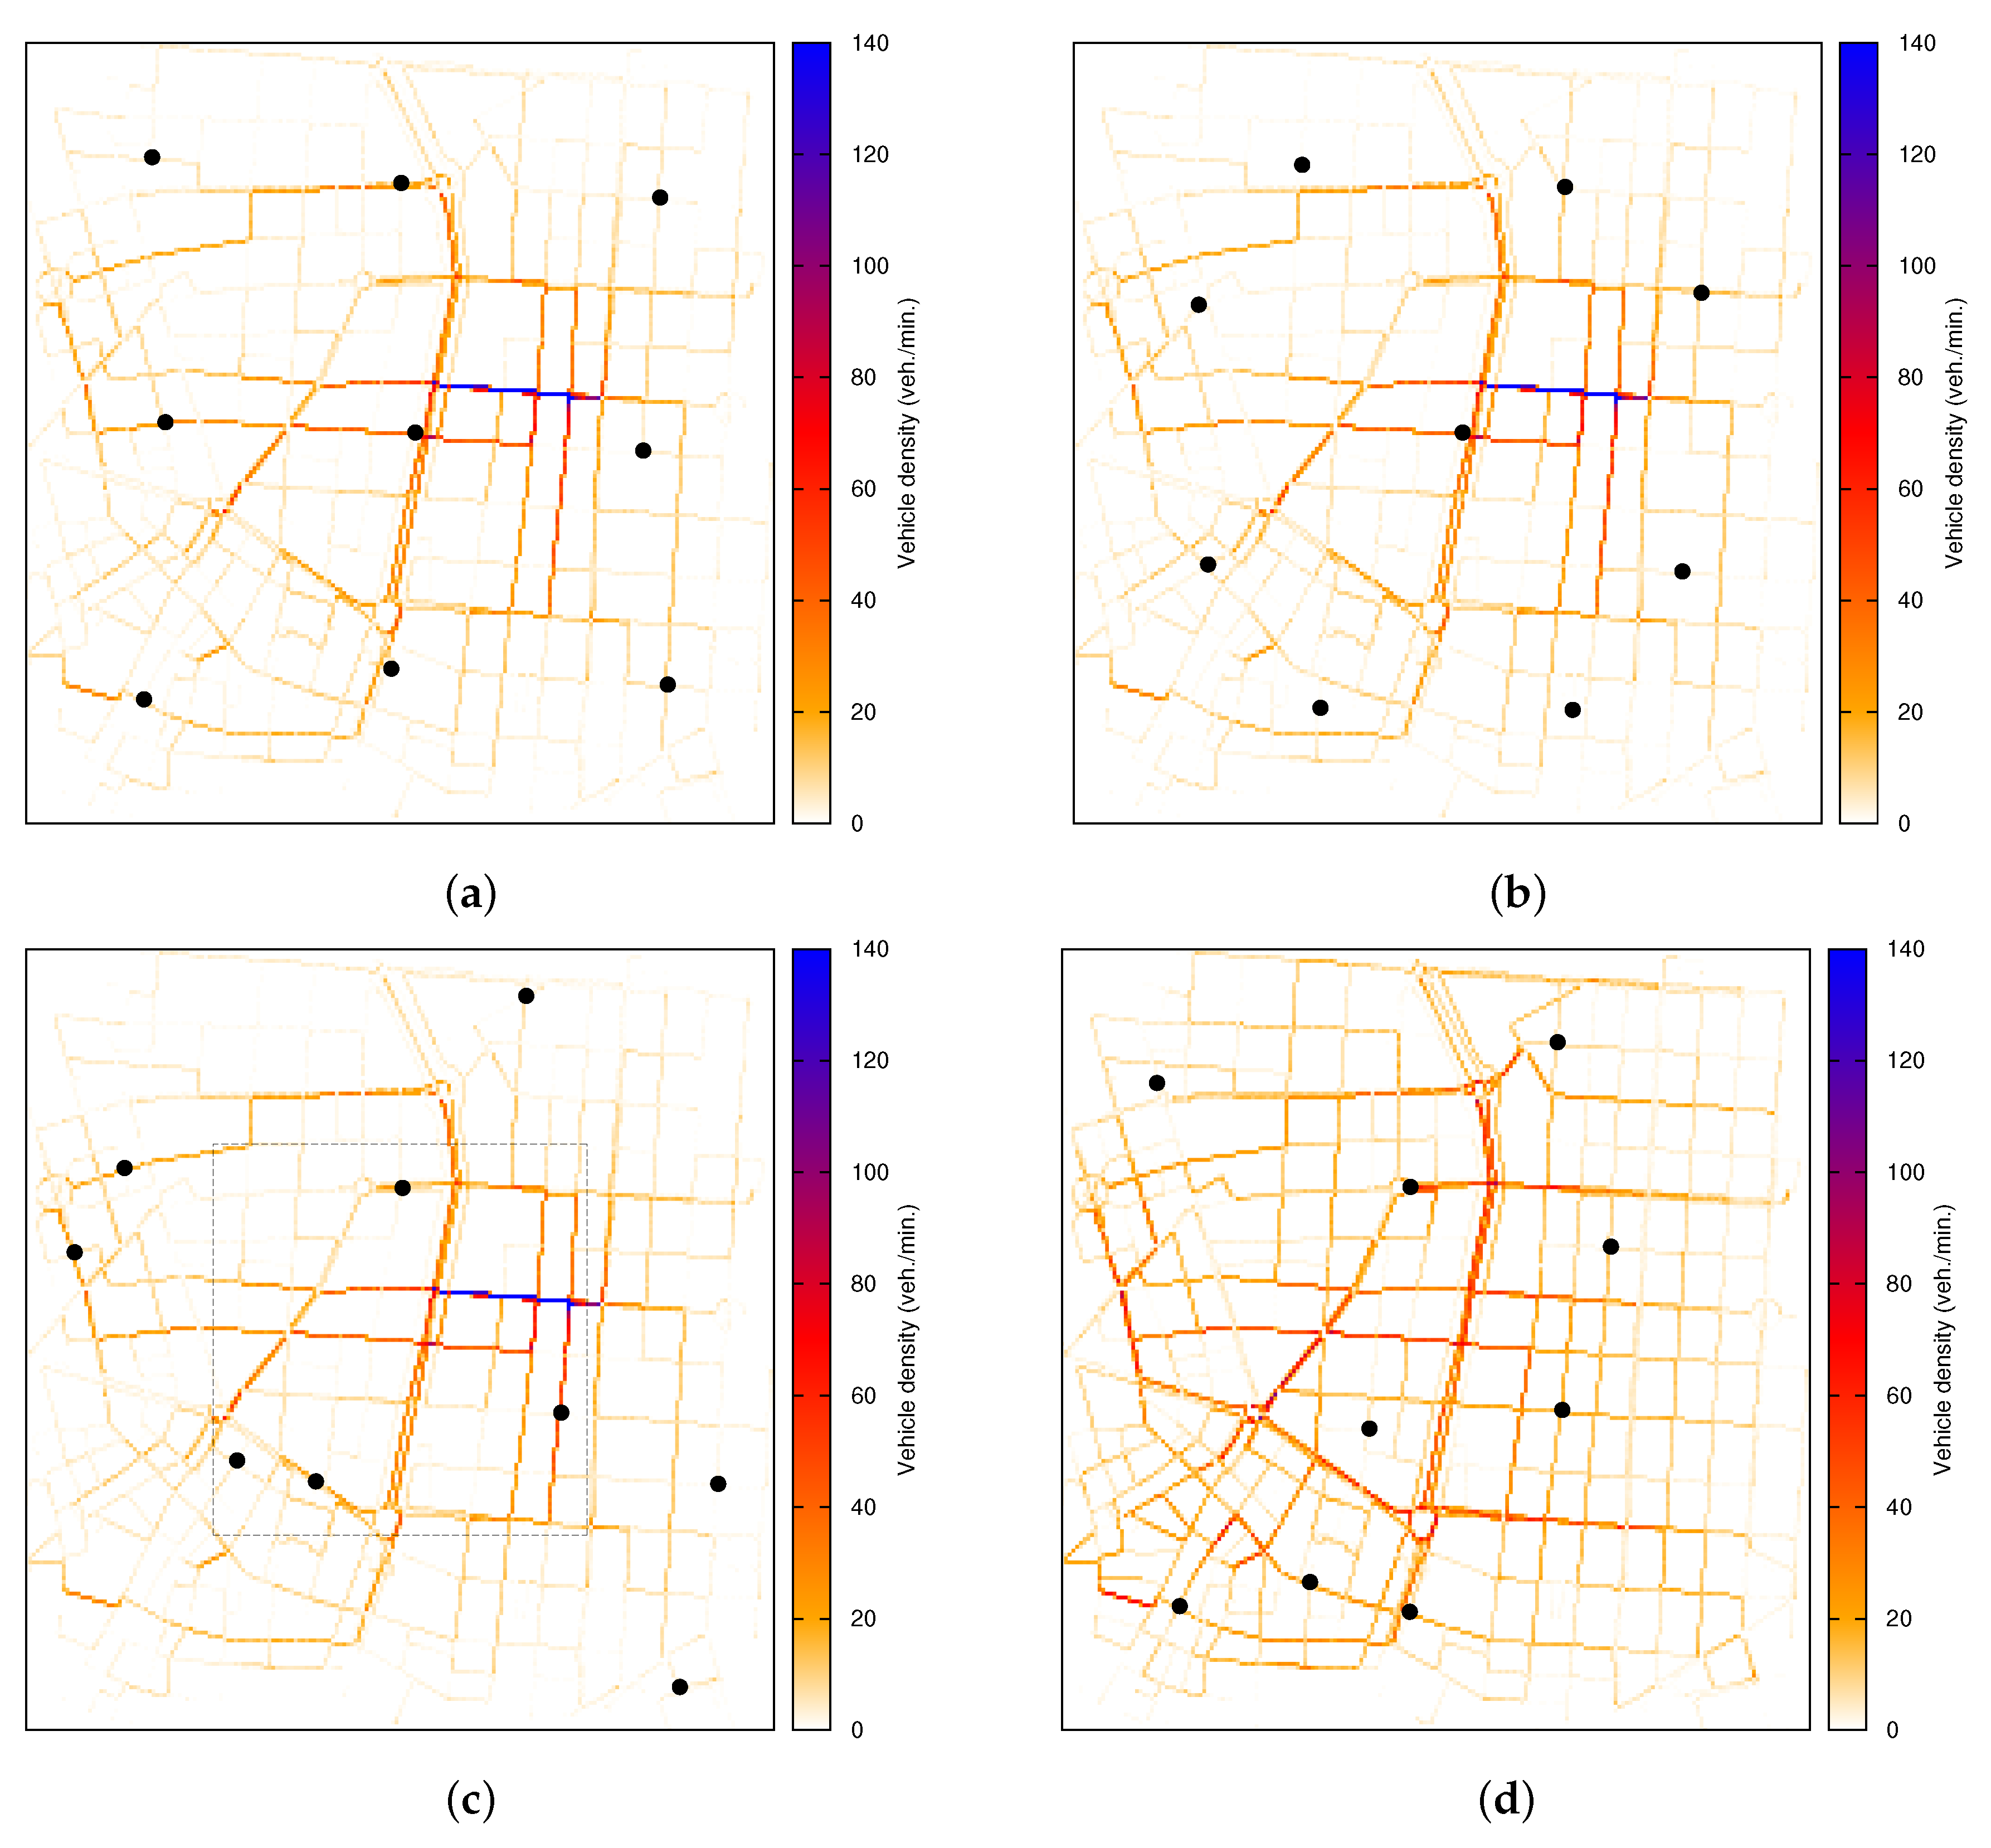
Figure 10 depicts the different deployment schemes. As shown, the geographic distribution does not account for different traffic densities in different areas of the cities; it tries to increase the coverage area by deploying RSUs in a grid fashion. On the other hand, the D-RSU assigns a fixed number of RSUs to each subarea (i.e., downtown and outskirts) as a function of the expected vehicle densities. The D-RSU does not consider the street layout of each area to find the most suitable location for the available RSUs, but it applies a geographic mechanism to each individual subarea given the number of RSUs to be deployed.
Regarding GARSUD, in order to better observe the effect of different traffic flows on RSU deployment and to further explore the flexibility of our proposal,
Figure 10c,d and
Figure 11c,d show the final positions of the nine RSUs, in Madrid and Valencia, computed by GARSUD in the two cases: (a) accounting for a central downtown area commonly observed in real cities and (b) a more uniform traffic distribution where no clear attraction points exist in the vicinity, a traffic pattern more likely to be found in the outskirts of cities and rural areas.
Noticeable differences in the computed deployment can be detected in the results, since RSUs in
Figure 10c are located mainly in the areas with low density where communication is often blocked by buildings, and incomplete paths between the sender and the RSUs can be found in a reasonable time. However, the distribution of RSUs is more compact in
Figure 10d, where only a few selected locations in the surrounding areas are enough to reduce the warning notification time. This philosophy is the basis of the D-RSU deployment scheme where the RSUs are distributed inversely proportional to the vehicle density, but unlike GARSUD, the specific locations in each area are determined using geographic uniform distribution, not exploiting the street layout of the scenario.
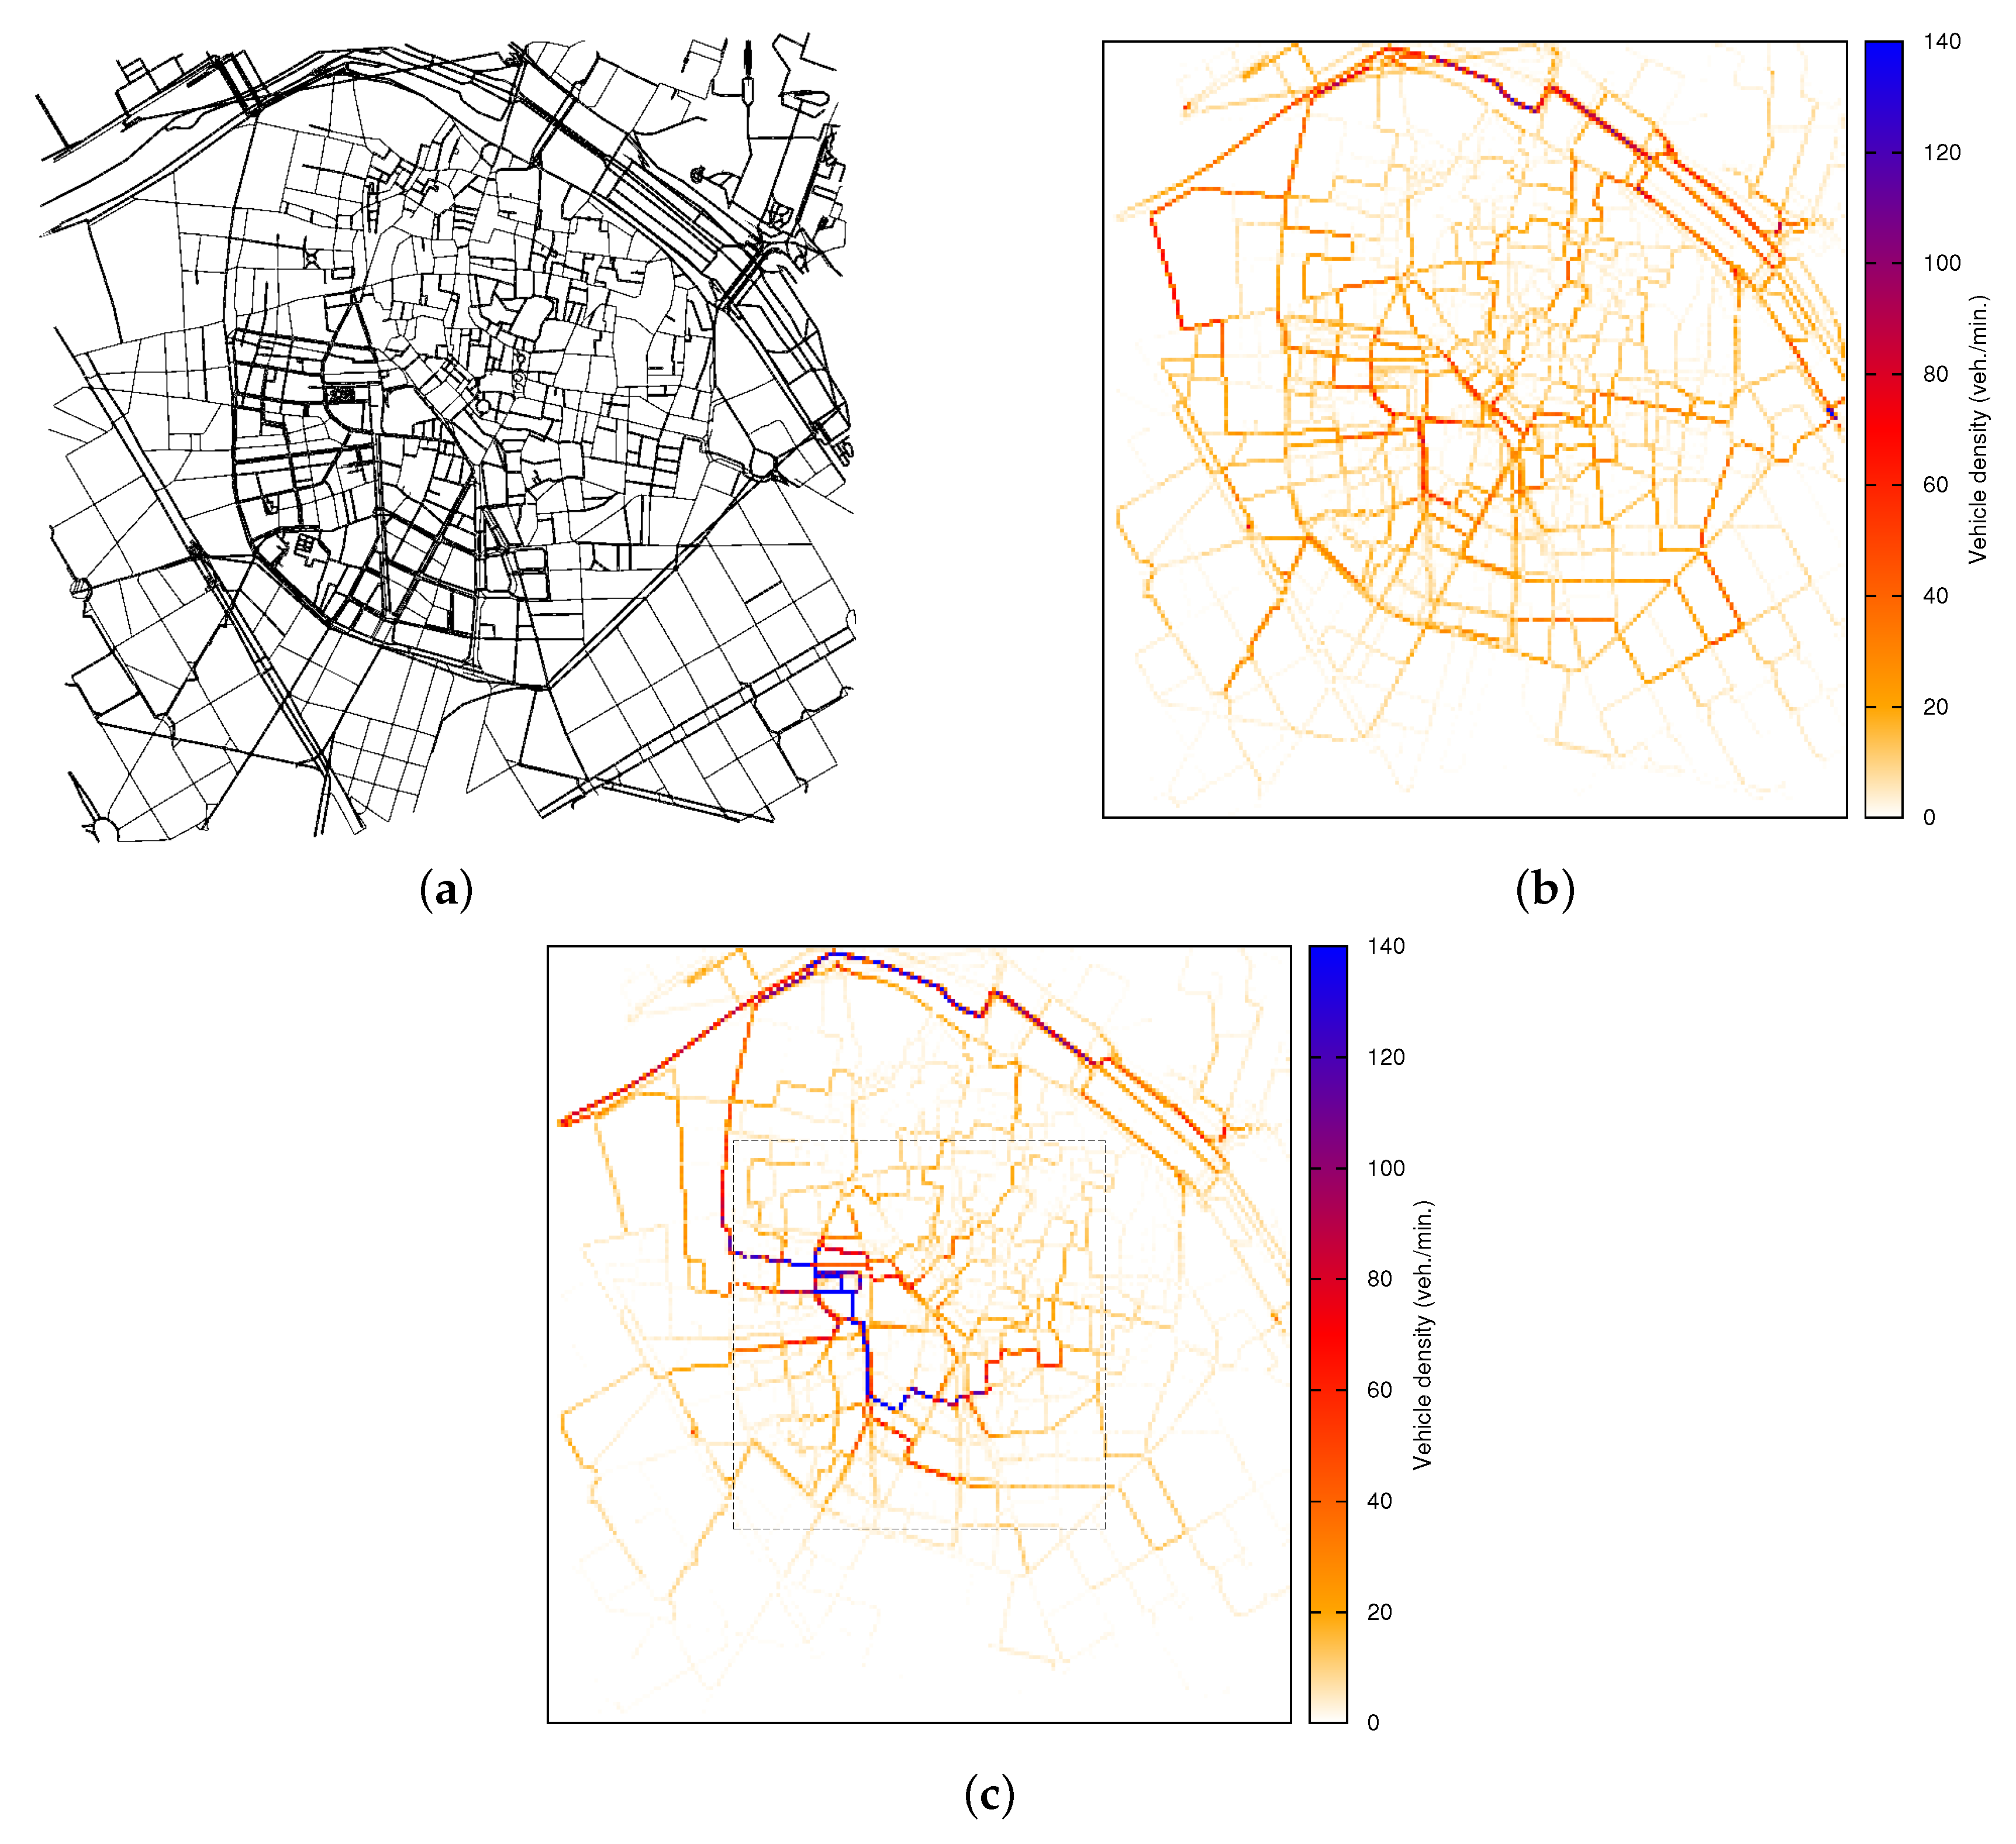
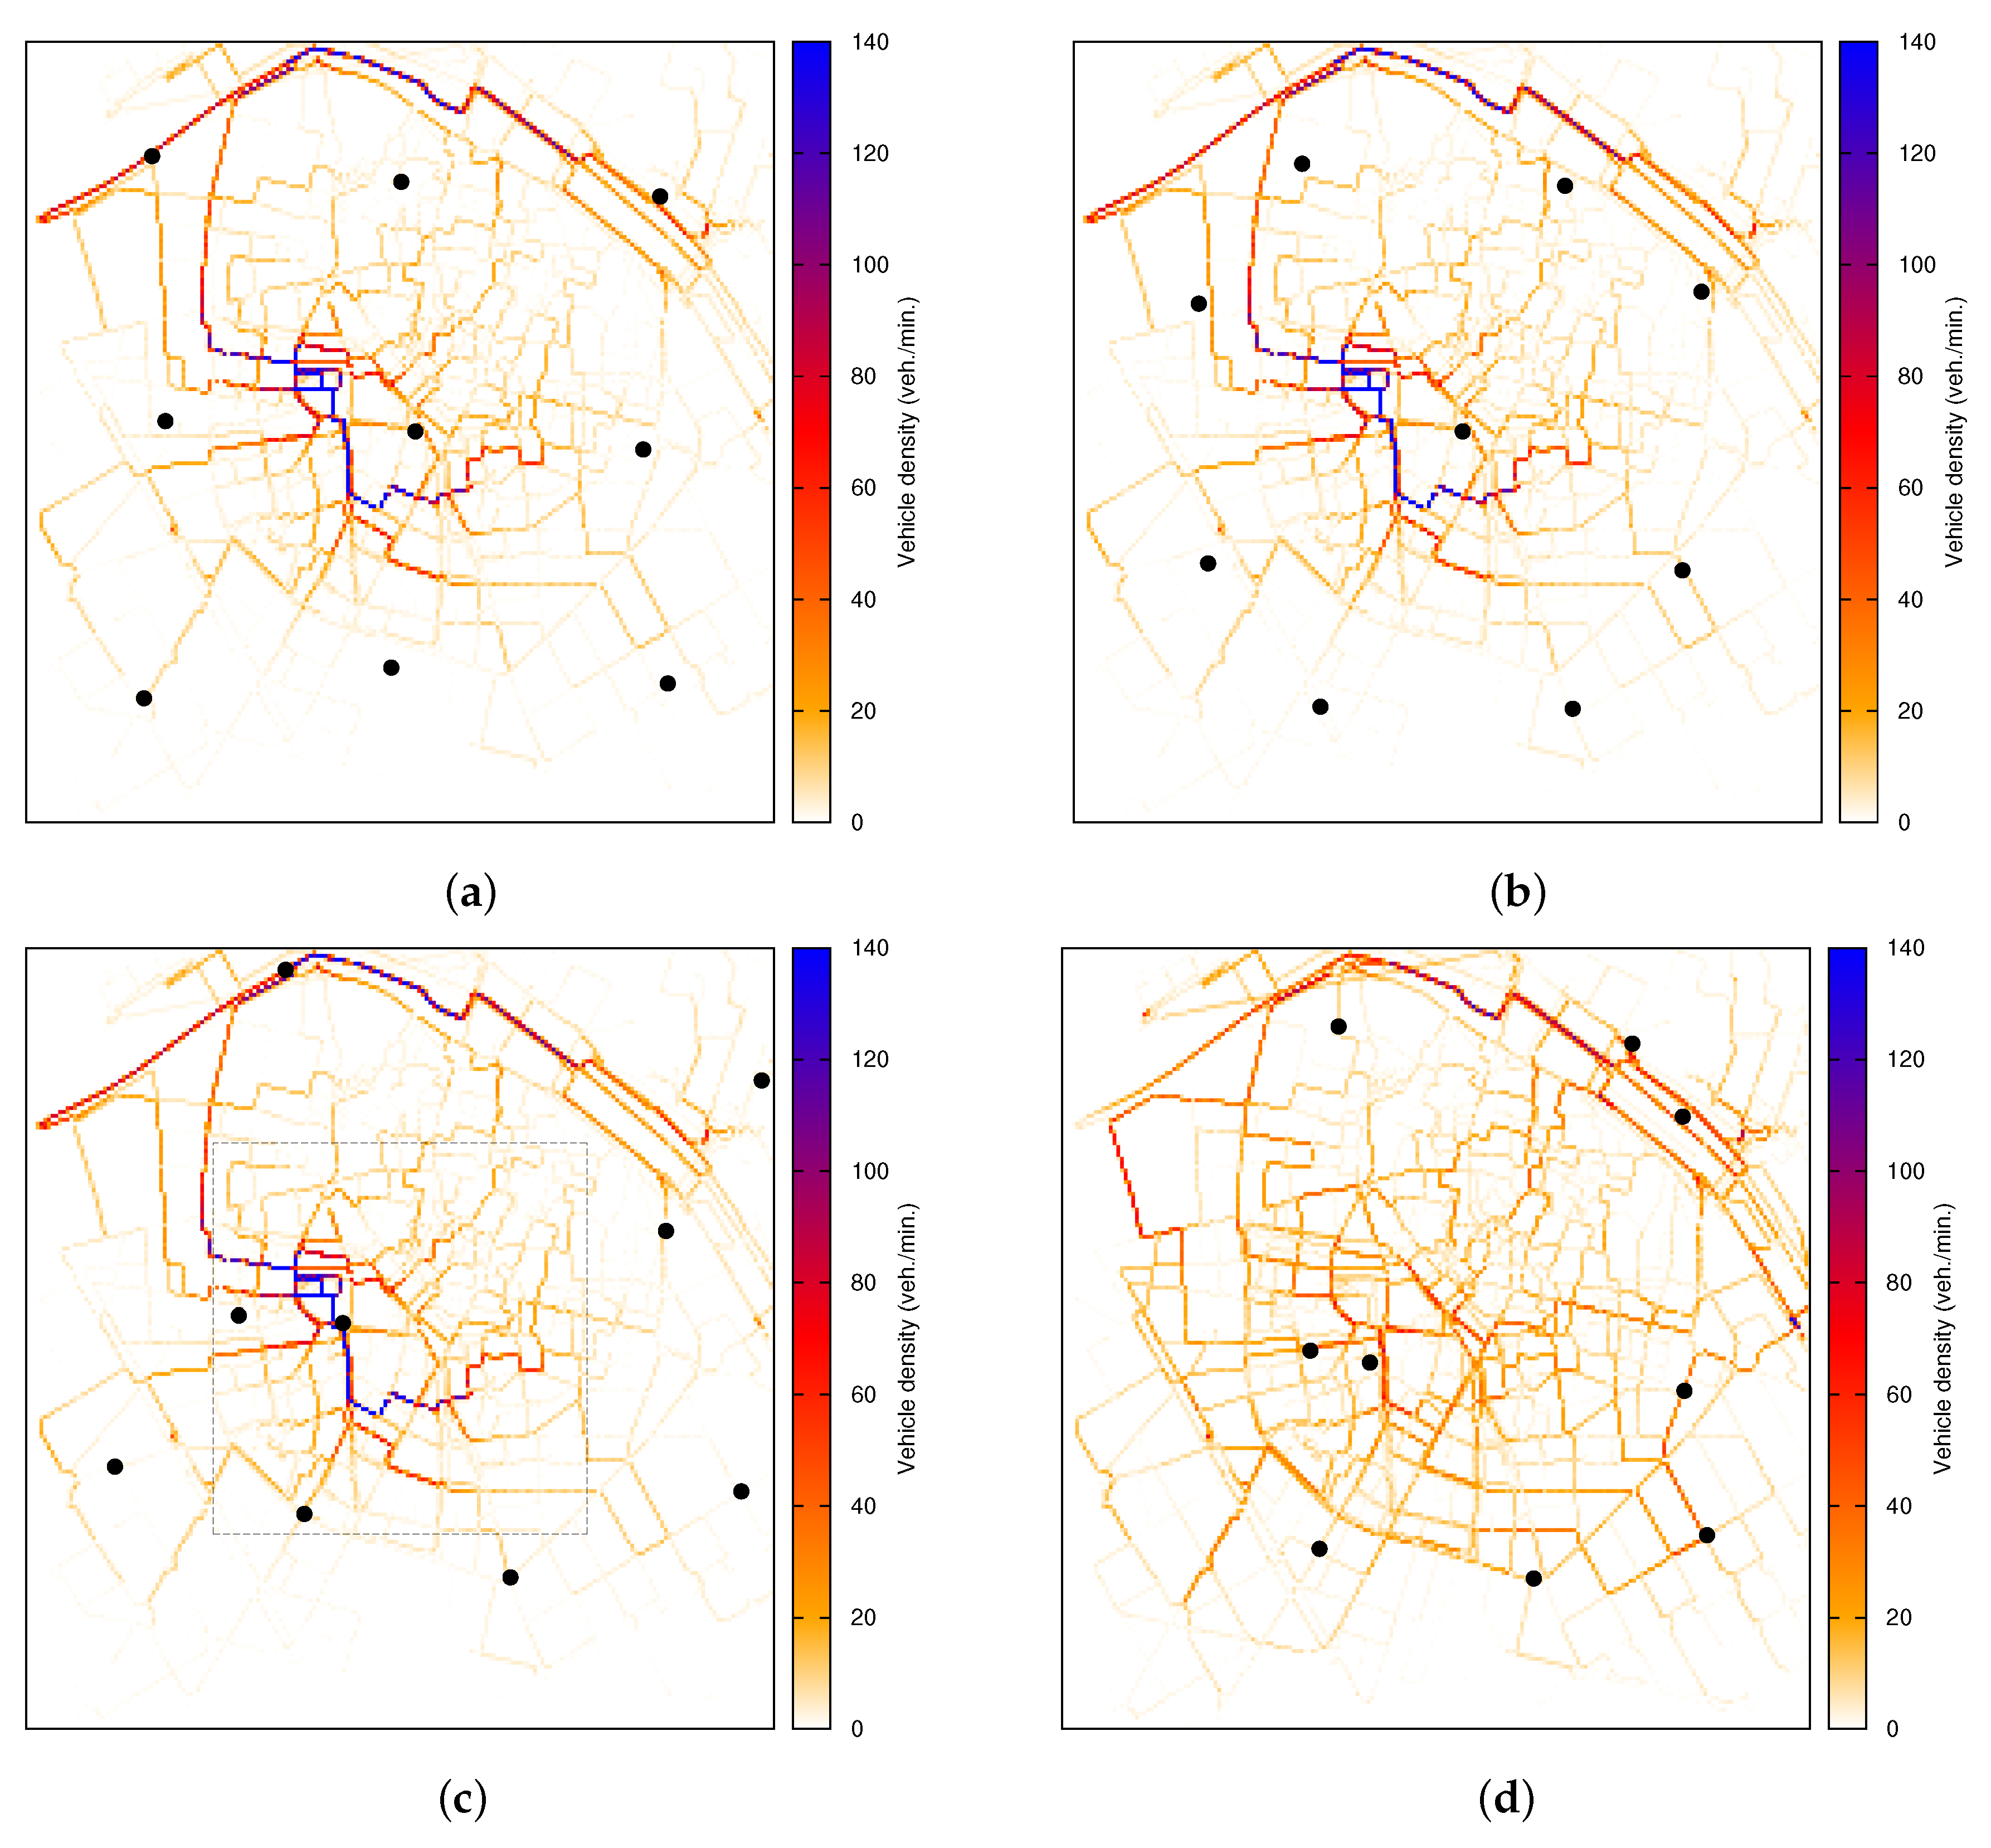
Figure 11 shows the same results for the Valencia map layout, and again, the distribution of RSUs computed by GARSUD is coherent with the principles followed by D-RSU, with more RSUs covering areas with low vehicle density where successful communications are harder to achieve, but the deployment obtained is far from following a geographic distribution.
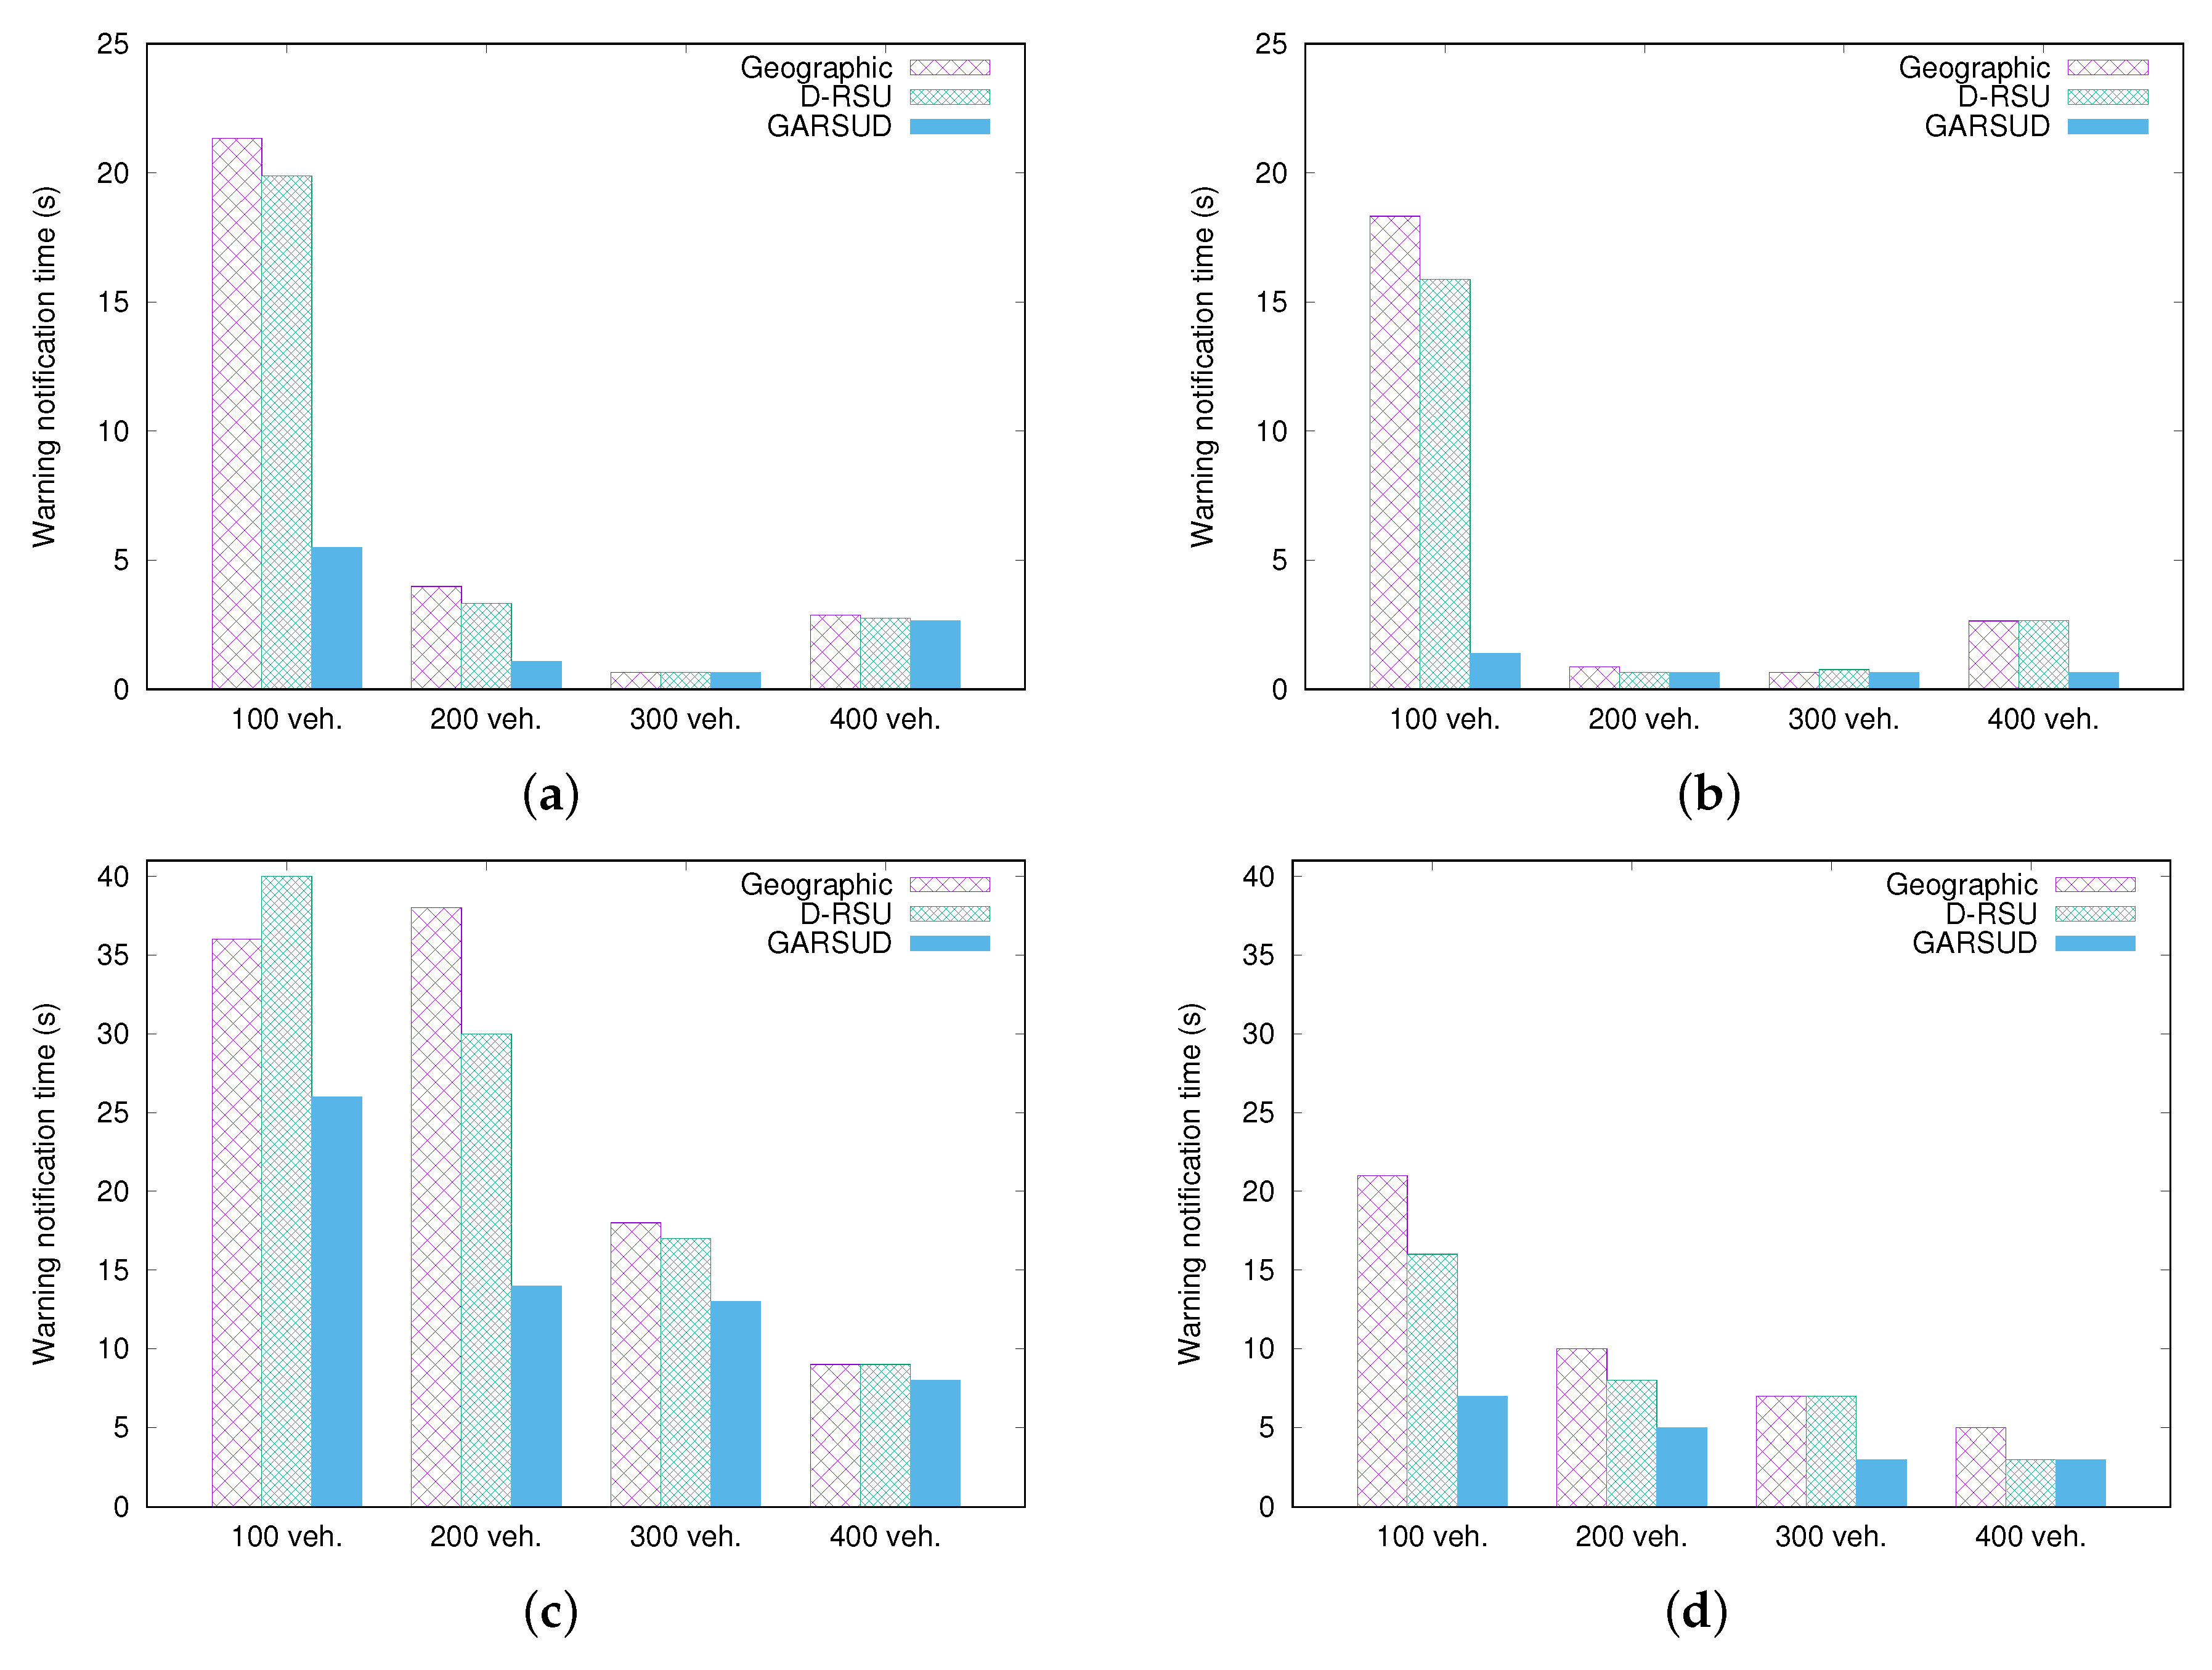
Figure 12 presents the average warning notification time using the geographic deployment, the D-RSU and our GARSUD approach for both the Madrid and Valencia map layouts. These results confirm the potential of GARSUD, i.e., that our approach provides suitable solutions for different layout complexities, varying vehicle densities, as well as different mobility patterns.
As demonstrated, GARSUD outperforms both the geographic and the D-RSU schemes, reducing the time required to notify safety authorities about dangerous situation, by testing the computed deployments against several realistic traffic patterns until the best result is found.
Regarding Madrid (see
Figure 12a,b), the improvement is particularly noticeable in low-density situations, where our GARSUD approach only requires 25% and 15% of the time needed by the other two RSU placement schemes, when deploying 4 and 9 RSUs, respectively. Notice that increasing the vehicular density over 400 vehicles (i.e., 100 vehicles/km
) in Madrid, the overall performance of the three schemes is reduced. This is due to high densities increasing the communication packets’ contention and collisions in the shared transmission medium, forcing packet retransmission and delaying the overall dissemination system. Nevertheless, this effect is reduced by GARSUD (see
Figure 12b) since it selects the most adequate location for the RSUs (e.g., RSUs are placed on the junctions where the average wireless traffic does not exceed the capacity of the channel).
As for Valencia (see
Figure 12c,d), GARSUD clearly outperforms both the geographic and D-RSU schemes in all the vehicle densities tested. Compared to Madrid, the warning notification time obtained is noticeably higher due to the increased complexity of the map, therefore creating blind areas where vehicles are isolated without access to RSUs. As an example, the average warning notification time in simulations involving 200 vehicles was below 5 s for all schemes when the scenario was the Madrid layout, whereas this time ranges between 14.57 s for GARSUD and 38.28 s using the geographic deployment. However, the results obtained by our proposal are the most suitable in all the tested scenarios. As demonstrated, the RSU deployment determined by GARSUD is suitable under a wide range of vehicle densities, ranging from rush hours to off-peak traffic times.
Regarding the performance of GARSUD in Valencia when using the Krauss mobility model to simulate a more uniform traffic distribution in the map, the probability of isolated clusters of vehicles unable to reach RSUs is increased, especially when the number of RSUs is too low to cover a significant portion of the area. Comparing warning notification time between approaches is complicated in this kind of complex environment since there are many situations where vehicles are not able to communicate with any available RSU during all the simulation time. To illustrate this condition,
Table 3 and
Table 4 show the results of three warning mode vehicles in a given scenario using the three different RSU deployment policies studied, including GARSUD. As can be seen, those vehicles not being able to communicate with any available RSU are marked with a hyphen (-). The final deployments provided by each policy (i.e., geographic, D-RSU and GARSUD) were previously presented in
Figure 11.
As demonstrated, using a simple geographic distribution is highly ineffective under these especially adverse conditions. In fact, several vehicles are not able to reach any deployed RSU even under high vehicle density conditions. This confirms that the traffic flow is a crucial part of the scenario and should be taken into account to achieve adequate RSU deployments.
The amount of communications having failed using the D-RSU is more reduced, although several vehicles that are not able to report their information can be found when using four RSUs, as well. On the contrary, the deployments obtained with GARSUD allow communication for all the densities analyzed.
In order to provide a comprehensive performance analysis of the GARSUD solution, we also performed the same study in the Madrid scenario.
Table 5 and
Table 6 present the study applying the Krauss mobility model considering four and nine RSU deployments, respectively. As mentioned along the paper, the Madrid map layout presents a less complex scenario than Valencia; therefore, all vehicles were able to communicate and to transmit their messages under all RSU deployment policies. As observed in both tables, GARSUD always performs better than the other two solutions, allowing vehicles to transmit the warning notification messages faster.
Figure 10 presents the final deployments for the Madrid scenario achieved by each RSU deployment policy (i.e., geographic, D-RSU and GARSUD).
Overall, as demonstrated across the different sets of experiments, our approach outperforms others in a variety of scenarios such as different vehicular densities, map layouts and considering different mobility models.


