Structural Health Monitoring and Time-Dependent Effects Analysis of Self-Anchored Suspension Bridge with Extra-Wide Concrete Girder

1
School of Civil Engineering, Southeast University, No. 2 Sipailou Road, Nanjing 210096, China
2
Beijing Advanced Innovation Center for Future Urban Design, Beijing University of Civil Engineering and Architecture, No. 1 Zhanlanguan Road, Beijing 100044, China
3
School of Civil Engineering, Nanjing Forestry University, No. 159 Longpan Road, Nanjing 210037, China
*
Author to whom correspondence should be addressed.
Appl. Sci. 2018, 8(1), 115; https://doi.org/10.3390/app8010115
Submission received: 8 December 2017
/
Revised: 7 January 2018
/
Accepted: 13 January 2018
/
Published: 15 January 2018
(This article belongs to the Section Materials Science and Engineering)
Abstract
:The present work is aimed at studying the structural health status of Hunan Road Bridge, which is currently the widest concrete self-anchored suspension bridge in China. The monitoring data included the structural deformations, internal forces, and vibration characteristics from April 2015 to April 2016 were analyzed to evaluate the structural changes and safety. The influences brought by the ambient temperature changes and the dual effects composed of concrete shrinkage & creep (S&C) and seasonal temperature changes were analyzed based on the measured data. The long-time effects of concrete S&C were predicted using the CEB-FIP 90 model and the age-adjusted effective modulus method based on the ANSYS beam finite element model. The measured data showed that the transverse displacements of towers were more significant than the longitudinal ones. The spatial effect of the extra-wide girder is significant, which performs as the longitudinal stresses change unevenly along the transverse direction. The seasonal ambient warming caused overall increases in girder compressive stresses, and the cooling resulted in decreases along with significant temperature gradient effects. The prediction results show that the cable anchoring positions at girder ends and tower tops will move towards the mid-span affected by concrete S&C. In terms of the middle region of mid-span girder, significant increases in longitudinal stresses of top plate and decreases in the ones of bottom plate will be caused by the significant deflection. Comprehensively, the increases in the girder compressive stresses of side-span bottom plate and mid-span top plate are worthy of attention when confronted with extreme high temperature during the bridge service life cycle.
1. Introduction
It has become a trend to put equal emphasis on bridge’s attractiveness and practicability. The concrete self-anchored suspension bridge is becoming competitive among the numerous bridge types, because of its economy, elegant appearance, and reasonable force transmission form [1,2,3]. Since most of the self-anchored suspension bridges are built in the thoroughfare of city transportation, the growth of traffic volume prompts the girder width to increase to 50 m or even more to meet the increasing lane requirements. The reliability of bridge is related to the lives of thousands of people and significant social impacts. The inevitable structural damages that are caused by the human factors, vehicle loads, and time-dependent effects will affect the bearing capacity and the durability of bridge [4]. The structural health monitoring (SHM) and safety evaluation are very necessary during the bridge service period.
The research methods to grasp the bridge’s mechanical properties mainly include the numerical simulation [5], lab experiment using reduced scale model [6], and field measurement [7]. The numerical simulation is difficult to obtain the stress states of structure details exactly. The lab experiment is limited by lab condition and model’s fine level and it is difficult to reflect the actual bridge state. The way of integrating the numeric simulation predictions and field measured data is more appropriate. Kim [8] presented a prediction model using the artificial neural network to assess the performance of Yonjung high-speed bridge. A short-term health monitoring system is used to collect the bridge behavior with different high-speed train’s speeds. The statistical analysis is adopted to evaluate the girder displacement under speeds 165 to 403 Km/h. Kaloop [9] investigated the prediction efficiency of two nonlinear system-identification models, in assessing the behavior of a coupled structure-passive vibration controller. The behavior of an experimentally scaled three-story building incorporated with a tuned mass damper (TMD) subjected to seismic loads was studied.
The development of SHM tools is showing a trend of diversification. The wireless smart sensor network has been used widely because of its high flexibility and robust data management ability [10,11,12]. Alavi [13,14,15] presented a smart self-powered wireless sensor system and a data interpretation algorithm to detect the structural damages. Kaloop [16] compared three common nonlinear methods that are used in the adjustment of Global Positioning System (GPS) positioning to improve the quality of GPS time series observations. Kumberg [17] presented a novel SHM system based on the global navigation satellite system receivers to determine the modal properties of the Neckartal Bridge. Kong [18] utilized the piezoceramic-based smart aggregates to perform the SHM for a reinforced concrete bridge column subjected to pseudo-dynamic loading. Jiao [19] developed a novel device consist of a bilaterally constrained beam and a piezoelectric polyvinylidene fluoride transducer to measure the thermal response of prestressed concrete bridge girders. Hu [20] presented a fiber Bragg grating (FBG) vibration sensor for online monitoring of the cable vibration characteristics of Tongwamen bridge. Raeisi [21] developed a new low-cost and accurate binary sensor comprised of wire bonded onto the girder using an adhesive to detect cracks in steel girders. A connected pipe system was used in the vertical deflection monitoring for a suspension bridge in China [22]. The fiber optic sensor [23,24], acoustic emission technique [25], and ultrasonic monitoring technique [26] are also important tools in SHM field.
The structural deformations and vibration properties of the already completed bridges can be monitored utilizing the nondestructive measurement tools. However, the stable and exact measurement of the stress values of structure details may then only be obtained by the durable and sensitive strain gauges embedded in the structure during the construction phase [27,28,29]. In addition, the influences on the bridge safety brought by the vehicle loads [30,31], seismic loads [32,33], environmental corrosions [34,35], and thermal effects [36] had be investigated widely, and the concrete shrinkage & creep (S&C) effects of the laboratory specimens [37] and simple bridge types [38,39] were also widely reported. However, the field measurement for the complicated self-anchored suspension bridge, including the detailed stress and geometry evolution associated with time-dependent effects were rarely reported, especially for the one having such an extra-wide concrete girder [40,41]. Moreover, the concrete S&C effects during the construction phase and the prestress relaxation during long-time service life should also be taken into account in the prediction of time-dependent effects.
In this paper, the health monitoring data and finite element simulation predictions were integrated to study the stress and geometry evolution associated with time-dependent effects of the self-anchored suspension bridge, Hunan Road Bridge, which was opened to traffic in 1 May 2015. The prestressed concrete girder of Hunan Road Bridge is currently the widest among similar bridges in China. The changes of alignments, detailed stresses, and vibration characteristics were monitored utilizing the SHM system established during the construction phase. The single and dual effects on the stress and geometry brought by the concrete S&C and ambient temperature changes were analyzed based on the measured data from April 2015 to April 2016. The long-time concrete S&C effects were predicted using the CEB-FIP 90 model [42,43] and age-adjusted effective modulus method [44] based on the ANSYS beam finite element model. In addition, the prestress relaxation during the long-time service life was considered in the prediction analysis through the sequential calculation and gradual accumulation. Moreover, the structural changes that are caused by the concrete S&C during the construction phases were considered in the bridge completion state based on the field construction time from the cast of concrete to the completion state of the bridge.
2. Hunan Road Bridge
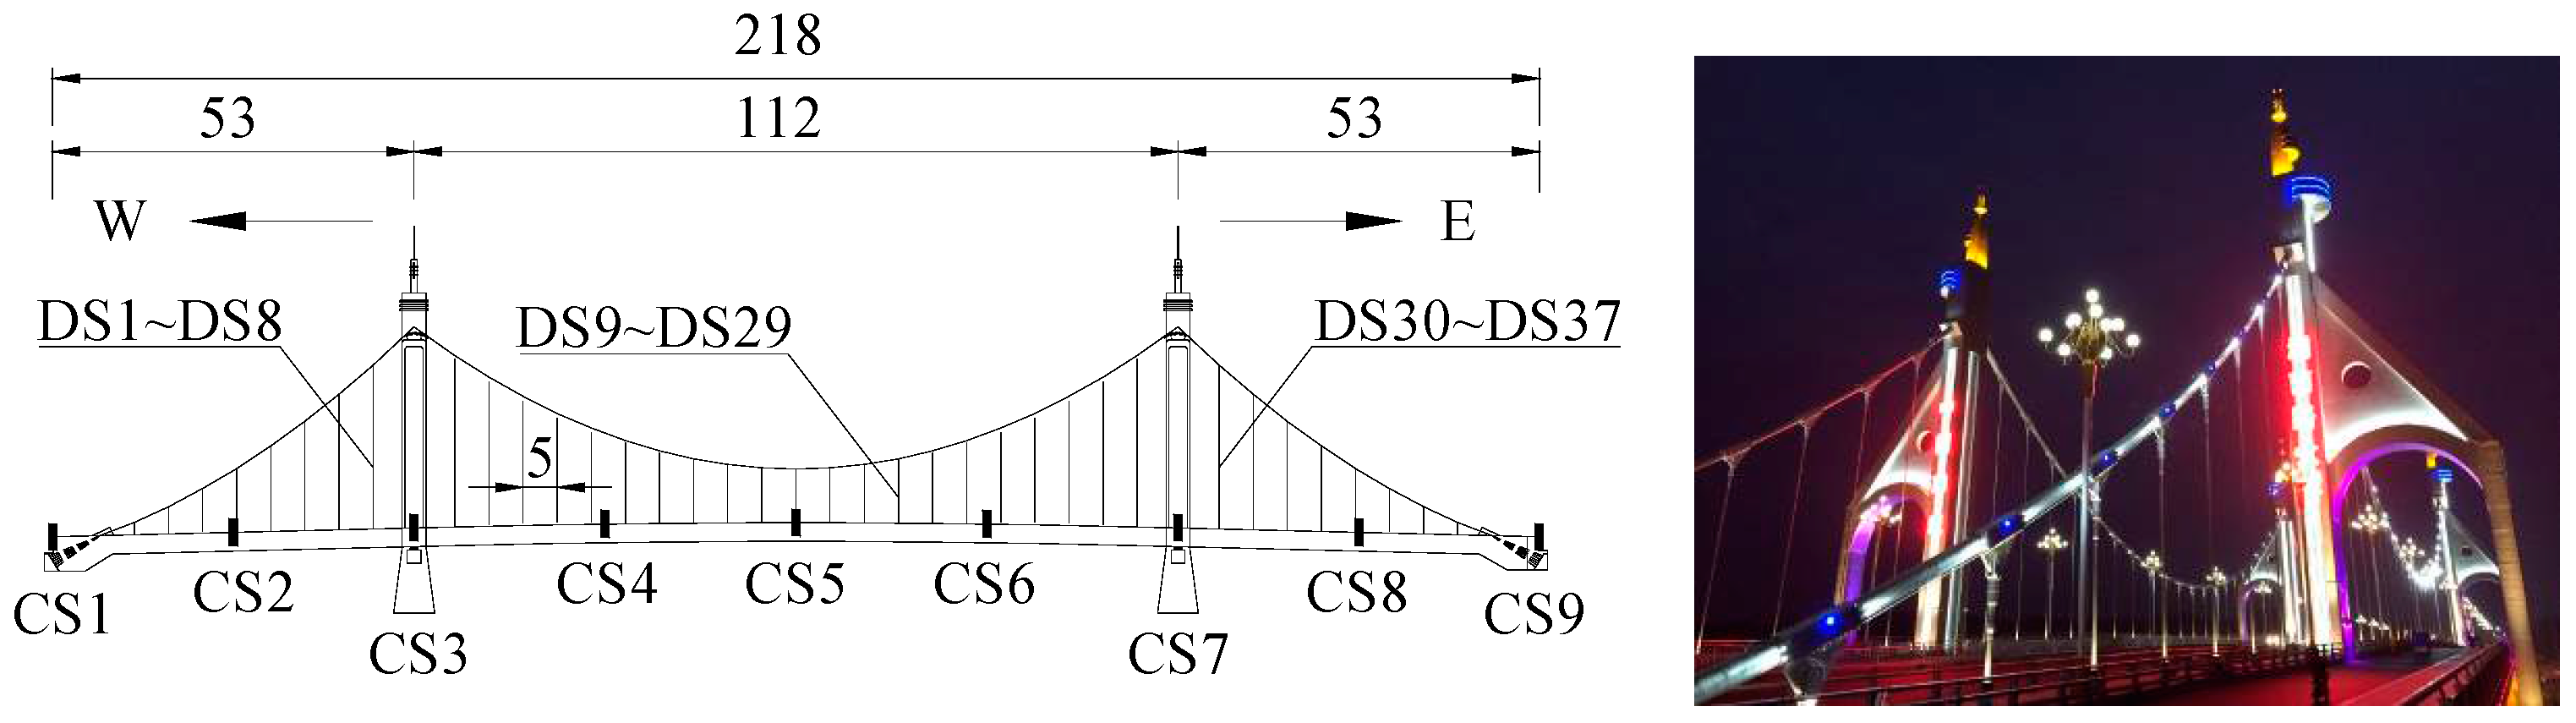
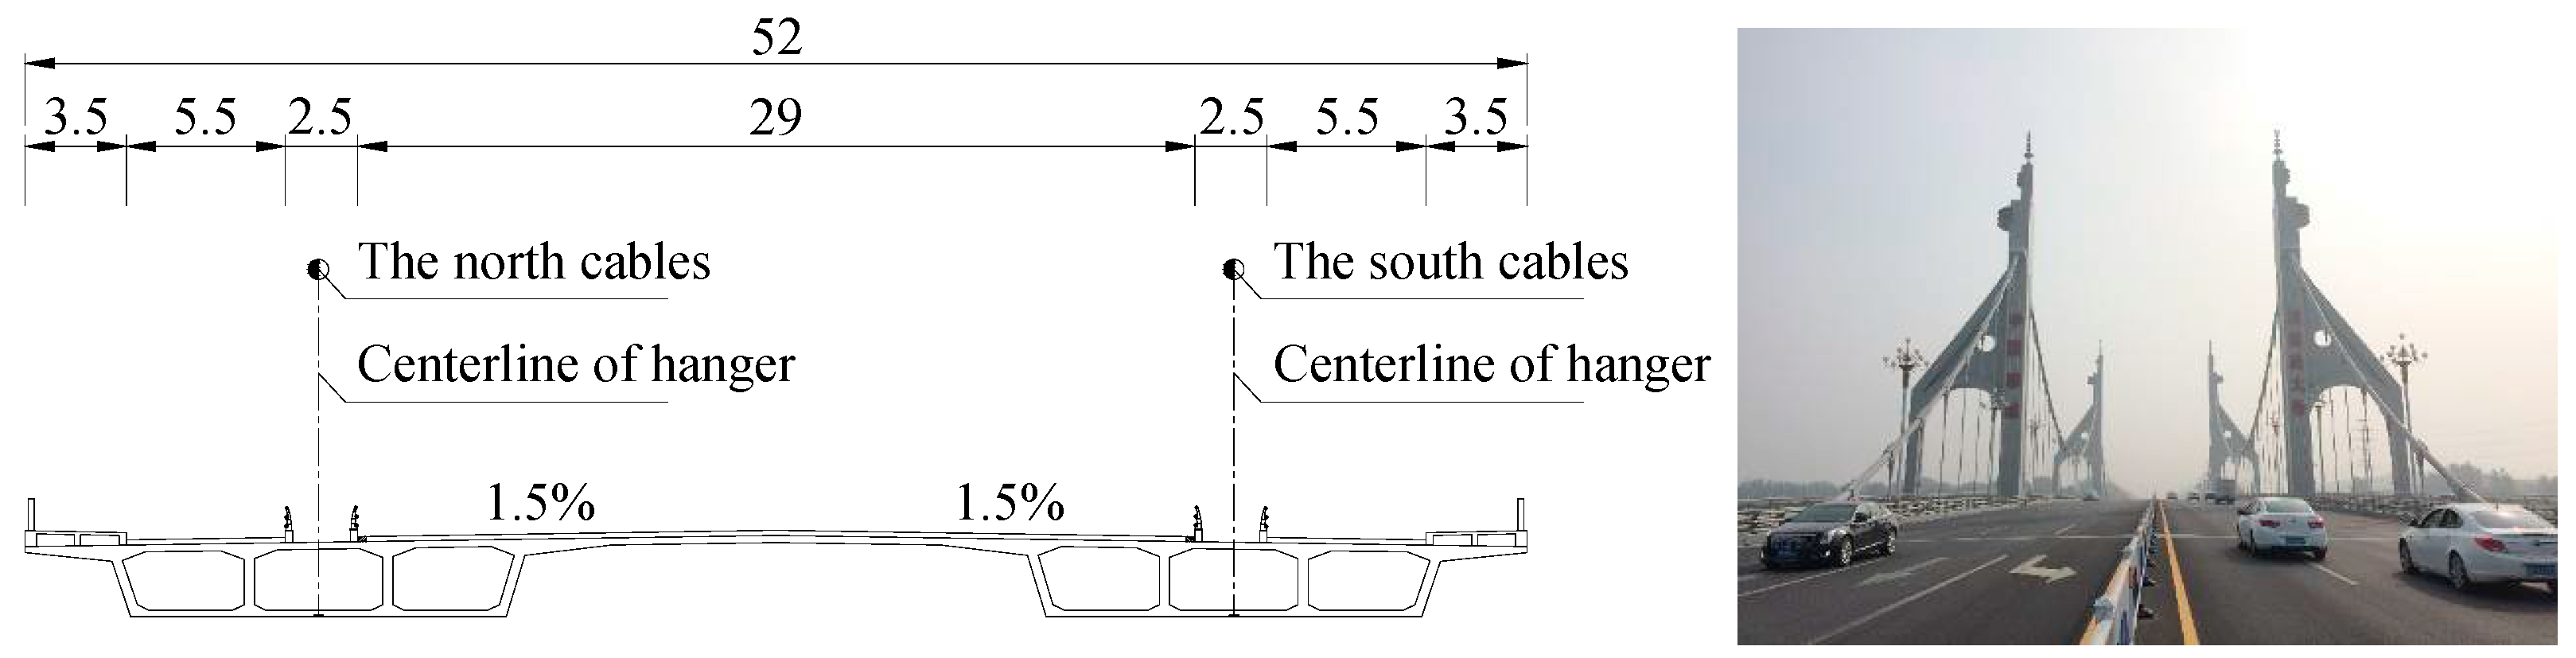
The layout of Hunan Road Bridge and girder geometry are shown in Figure 1 and Figure 2, respectively. The span arrangement is 53 m + 112 m + 53 m = 218 m. The prestressed concrete girder is composed of two box beams having three cells. The main girder with a width of 52 m is currently the widest among similar bridges in China. The longitudinal and transverse slopes of main girder are 2.5% and 1.5%, respectively. The rise-span ratio of the mid-span and side-span are 1/5.276 and 1/12.965, respectively. The towers are transversely connected by the crossbeams. The lateral distance between the two cable planes is 31.7 m. Crossbeams are densely arranged with an interval of 5 m in the main girder corresponding to the hangers. The numbers beginning with CS in Figure 1 represent the girder cross section located at the towers, girder endpoints, sidespan midpoints, and the quarter points of mid-span, respectively. The hangers on the north and south side are numbered as DS1-N–DS37-N and DS1-S–DS37-S, respectively, which will be used in the following analysis.
The detailed cross sections of the key components are shown in Figure 3, including the main girder, tower, hanger, and cable. The standard cube compressive strengths of the concrete materials used in the main girder and tower are 50 MPa and 40 MPa, respectively. The tensile strengths of the steel wires used in the prestressed tendon and cable system are 1860 MPa and 1670 MPa, respectively.
3. Health Monitoring System
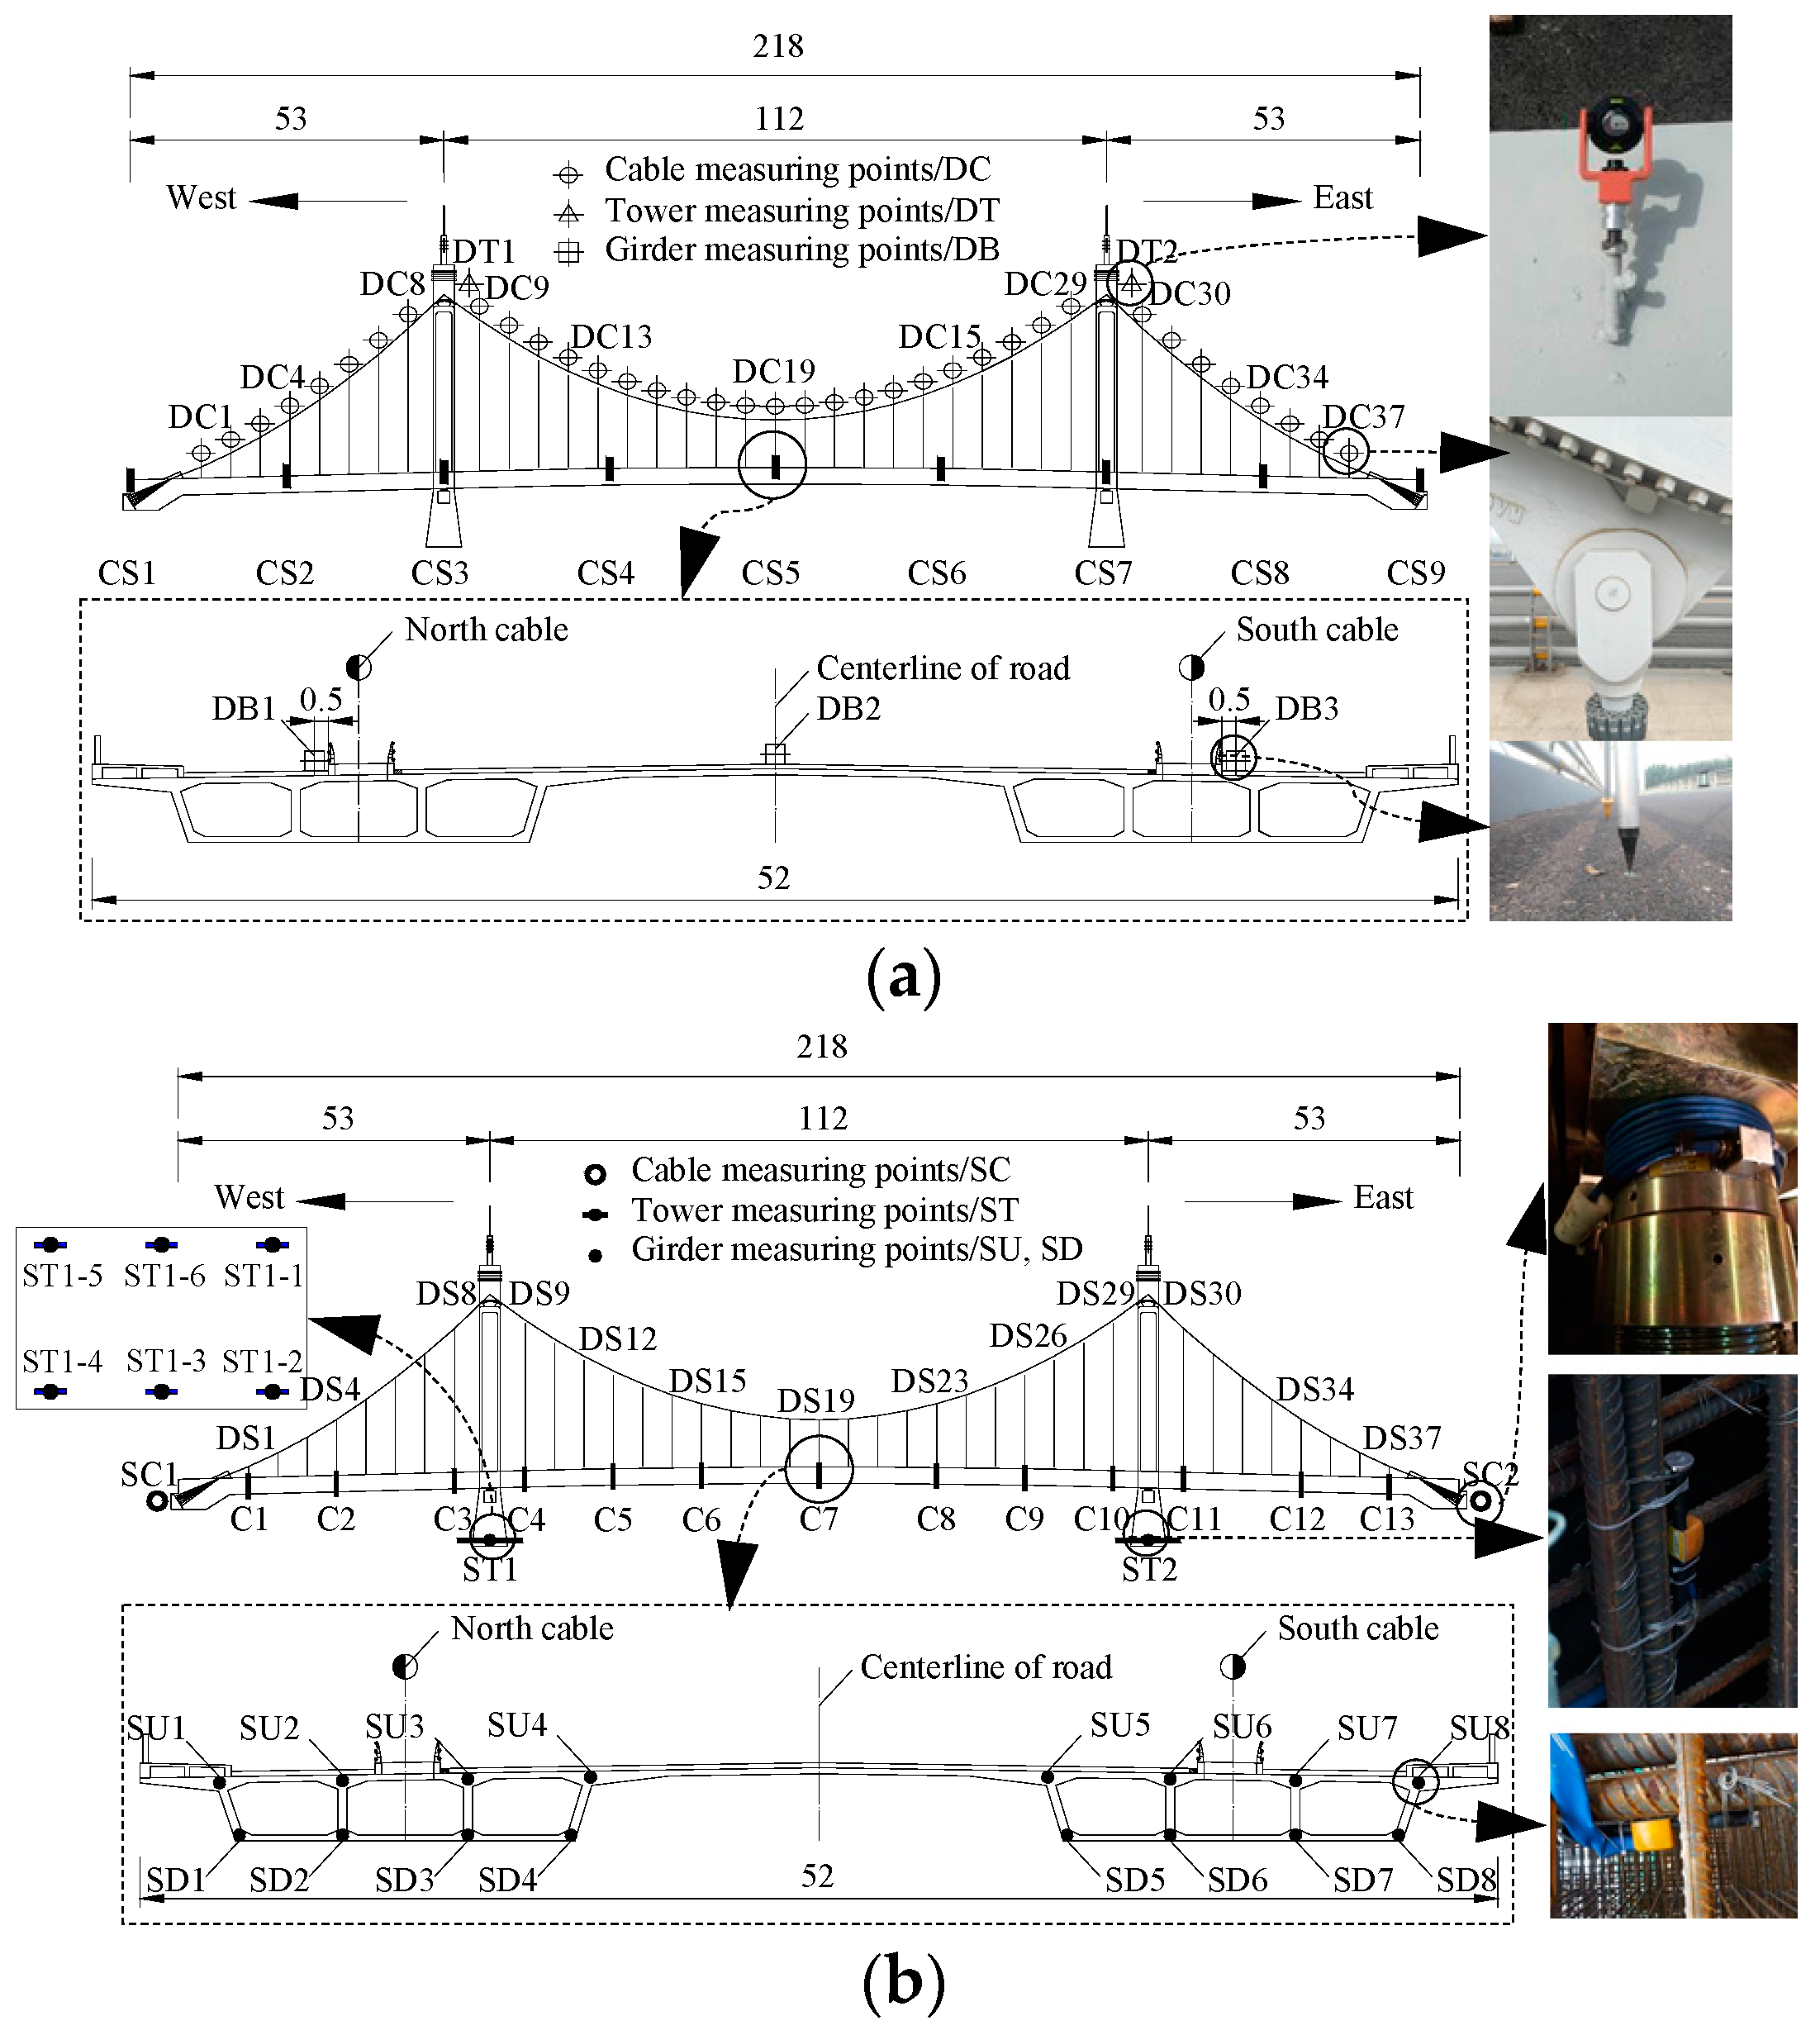
This section introduces the health monitoring system for the Hunan Road Bridge. The measured data obtained from this system will be analyzed in the following sections. The sensing variables contained the ambient temperature, structural temperature field, and structural responses. The structural responses included the deformations, stresses, and vibration characteristics of key components. The sensing variables were measured periodically every three months using the devices deployed during the construction control period. The layouts of measuring points are shown as Figure 4.
4. Simulation and Prediction Methods
4.1. Finite Element Model
The finite element (FE) model of Hunan Road Bridge was established using the ANSYS program as shown in Figure 5. The hanger forces and cable alignments were set based on the field measured data in the bridge completion state [45,46].
The Timoshenko beam element (No. 188) in ANSYS was adopted to simulate the tower, crossbeam, and girder. The link element (No. 10) that only considers the tension deformation was used to simulate the cable, hanger, and prestressed tendon. The mass element (No. 21) was adopted to simulate the weights of the deck pavement, saddle, clip, approach bridge, and the decorative segment of tower. The beam 188 element with no mass was used to establish the rigid arms connecting the girder and cable, and the tower’ top and cable. The compression amounts of the girder and tower were simulated through changing the material temperatures of the rigid arms. The internal forces of the cable, hanger, and prestressed tendon were exerted by defining the initial strains. The bottom sections of towers were completely consolidated. The DOF between the girder, tower, and approach bridge were constrained according to the actual bearing types. The FE model contained 711 nodes and 960 elements, and the static equilibrium analysis required 3 s.
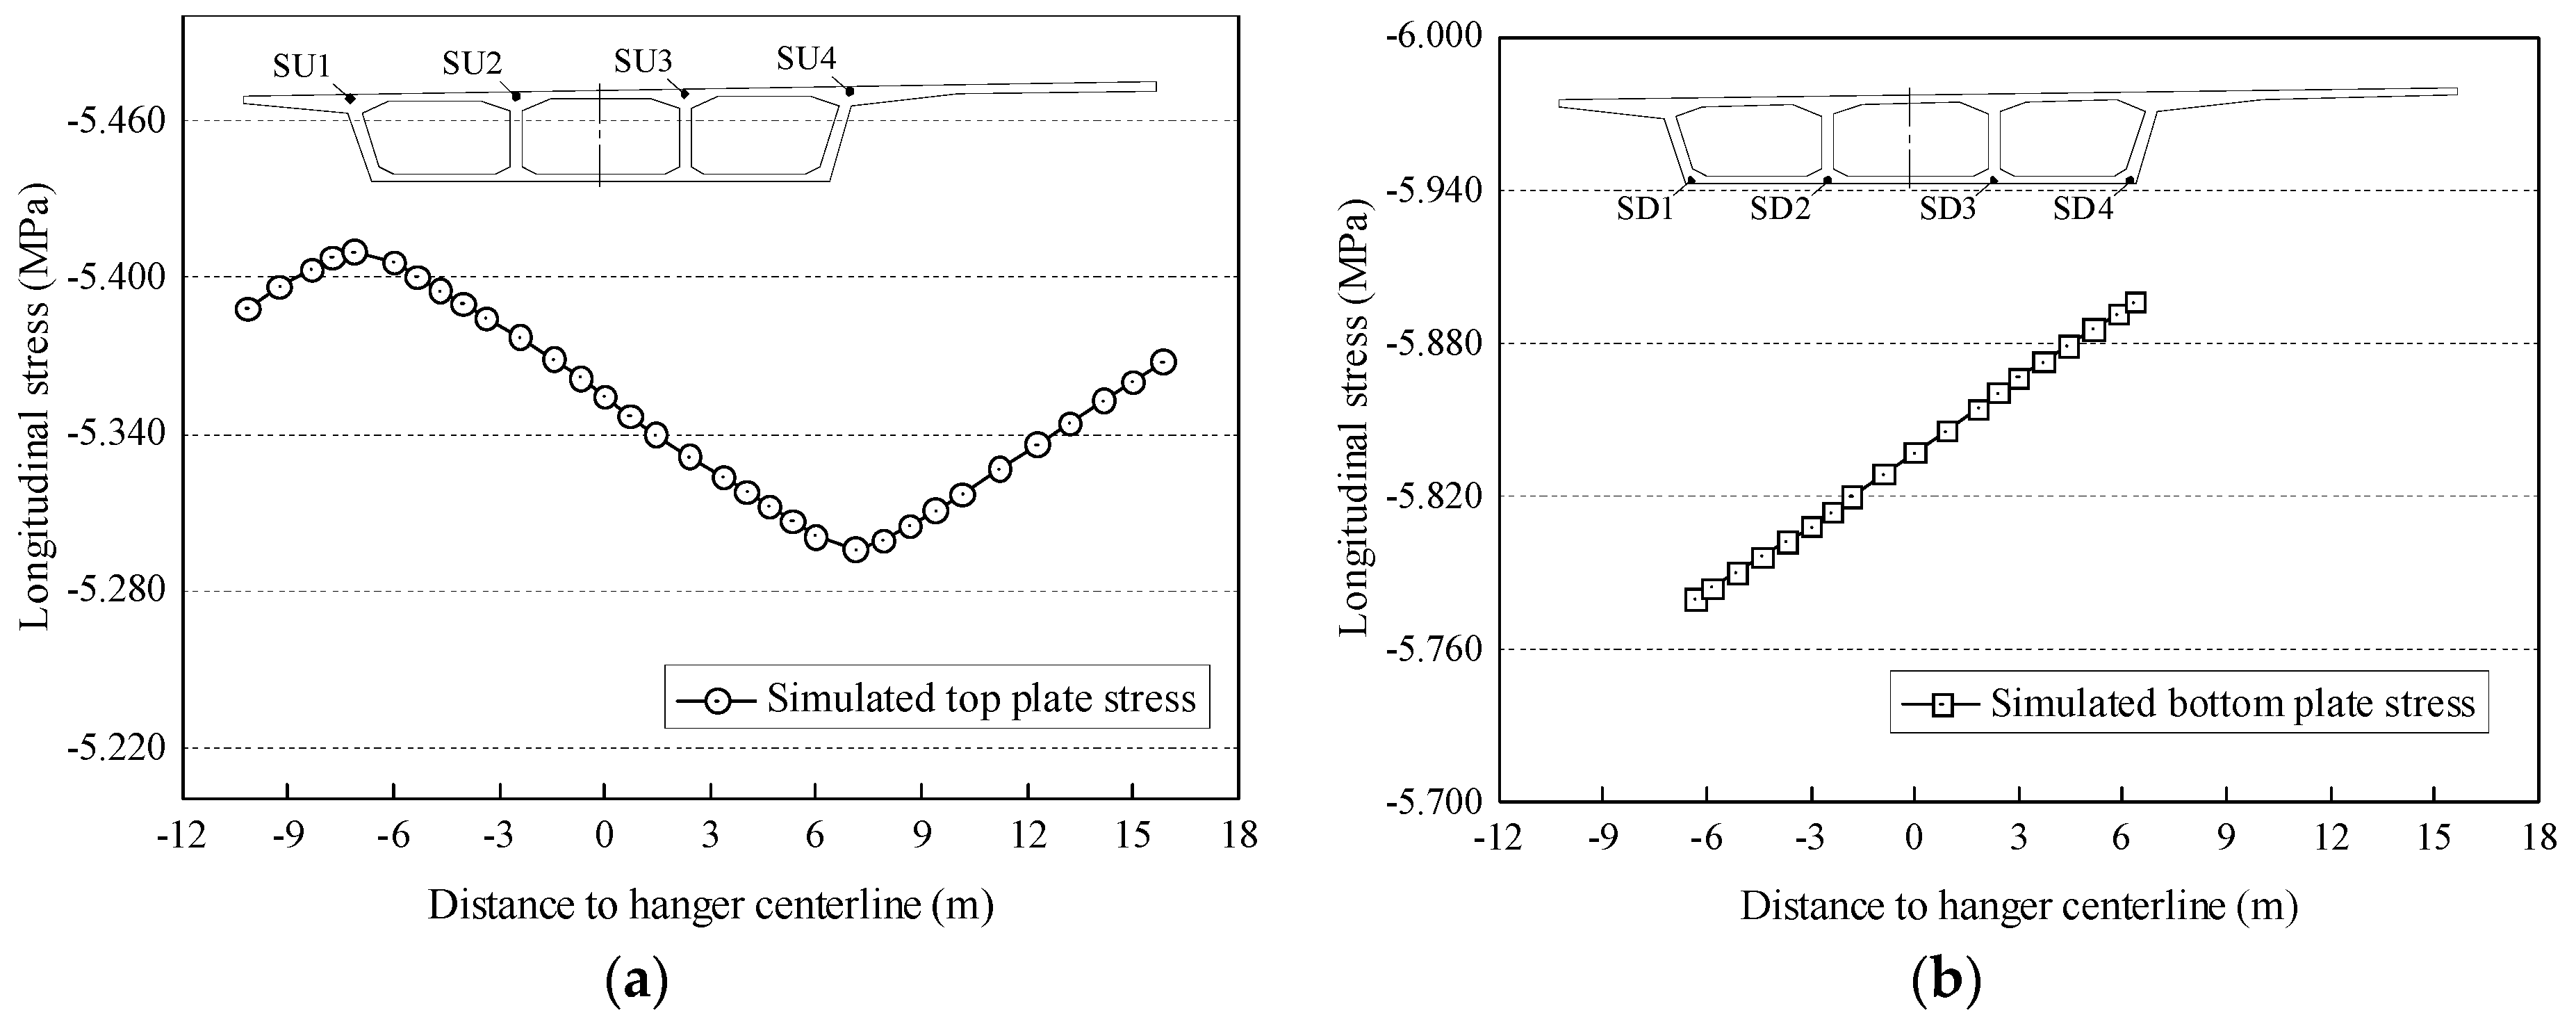
The simulation results of the girder longitudinal stresses at mid-span section CS5 in bridge completion state are shown in Figure 6, which demonstrates the distributions of the stresses of the top and bottom plate along transverse direction. The stresses of the hotspots were obtained through controlling the section mesh of beam 188 element. In addition, the torsional effects of the extra-wide concrete girder were captured by the beam element adopted, while the shear lag effects were neglected, which may only be caught with a refined FE model using the solid of shell finite element. However, the refined FE model is not suitable for the prediction analysis of long-time concrete S&C effects for such a complicated self-anchored suspension bridge because of the huge computational time that is required.
To verify the reliability of the beam FE model, the simulated results of the natural frequencies, deflections, and stresses obtained from the initial equilibrium analysis of the model were compared with the measured data as shown in Table 1. The coincidences show that the beam FE model can accurately realize the actual final state of Hunan Road Bridge.
4.2. Prediction Methods of Concrete Shrinkage and Creep Effects
The long-time influences brought by concrete S&C were predicted adopting the calculation method in the CEB-FIP 90 code [18,19] and the age-adjusted effective modulus method [20]. The relationship between the final concrete creep deformation and initial instantaneous elastic deformation is approximately linear when the concrete stress does not exceed 40% of the ultimate strength. The superposition principle is suitable for the calculation of the strain that is caused by the stress applied step by step. The relationship between the strain increment Δεc(i, i − 1) and stress increment Δσc(i, i − 1) of concrete caused by creep during the time interval of (ti, ti−1) is shown in Equation (1),
where, the c represents the creep effect, E is the elastic modulus, χ(i, i − 1) is the aging coefficient, and φ(i, i − 1) is the creep coefficient. The age-adjusted effective modulus Eφ(ti, ti−1) can be defined as Equation (2),
Firstly, the concrete elastic modulus was replaced by the age-adjusted effective modulus Eφ(ti, ti−1) during each time interval of (ti, ti−1). Then, the structural stress changes and deformations that are caused by concrete creep of each step were obtained by the sequential calculation and gradual accumulation. The concrete shrinkage effects were calculated adopting the analogous means used in temperature effect analysis based on the shrinkage strain of each step. In addition, the prestress relaxation was considered through updating the applied initial strains in the prestressed tendons during each time interval (ti+1, ti) based on the calculated prestresses of the former time interval (ti, ti−1). Moreover, the changes in stress and geometry caused by the concrete S&C effects during the construction phases were considered in the bridge completion state. This part of stress and geometry evolution was calculated using the same method as the method described above, based on the actual field construction time from the cast of concrete to the completion state of the bridge.
5. Results of Health Monitoring
5.1. Global Deformation
The deformation monitoring data measured in 15 April 2015 (the initial state), 15 October 2015, and 15 April 2016 were chosen to analyze the variation amounts of structural deformations during the first operation year. Since the filed measurement were conducted at 3 p.m.~4 p.m. of the foregoing dates to avoid the traffic peaks, the live load effects were small and stochastic. Moreover, the measured ambient temperatures of the foregoing moments were the same, which were 28 °C, and then the changes of structural alignments were mainly caused by the concrete S&C effects.
5.1.1. Cable Alignments
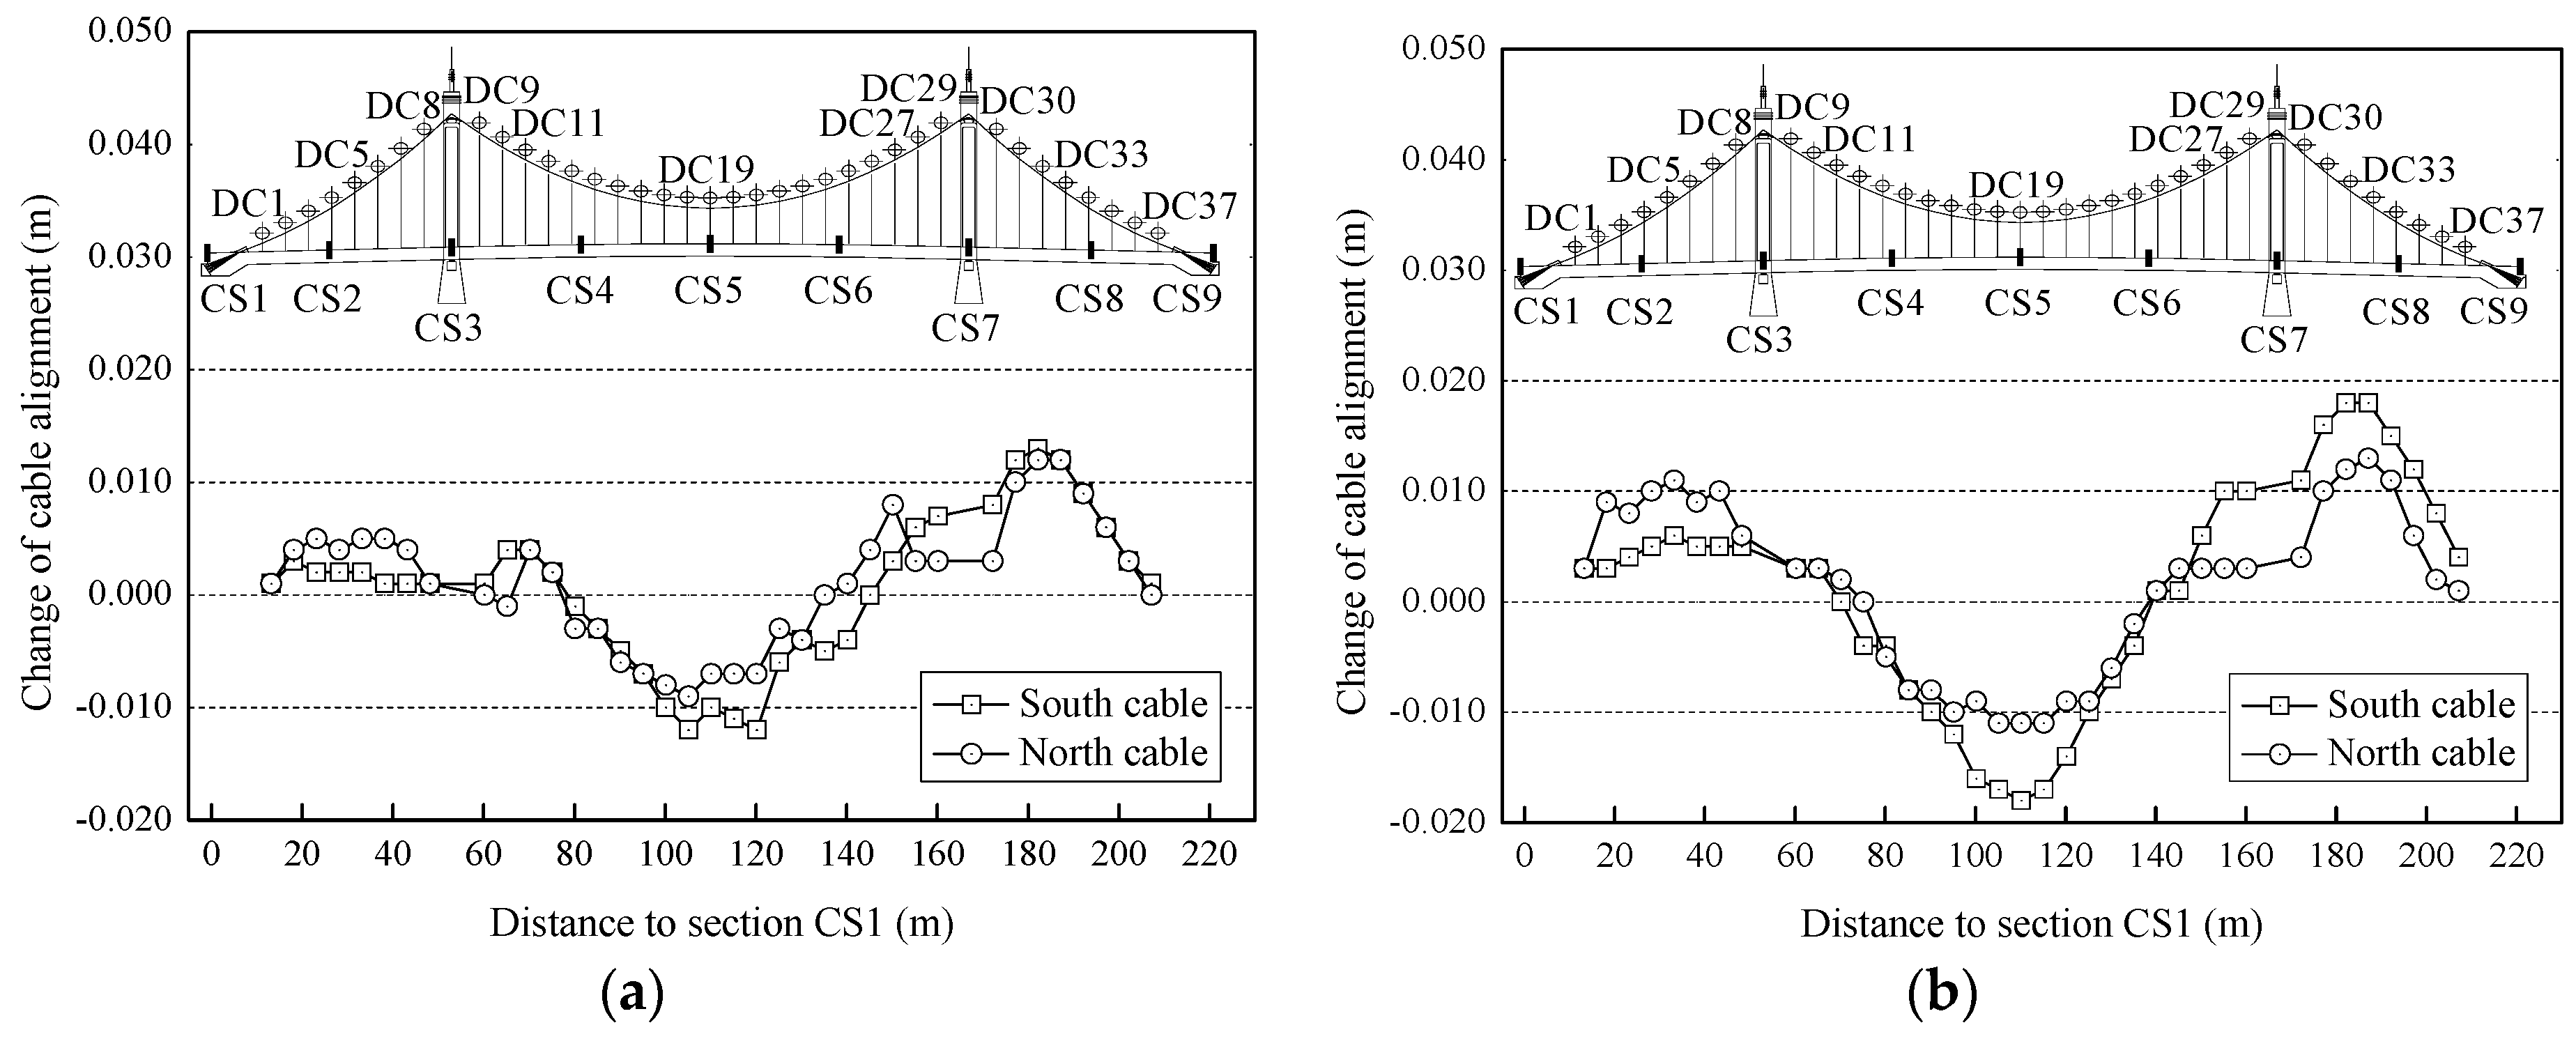
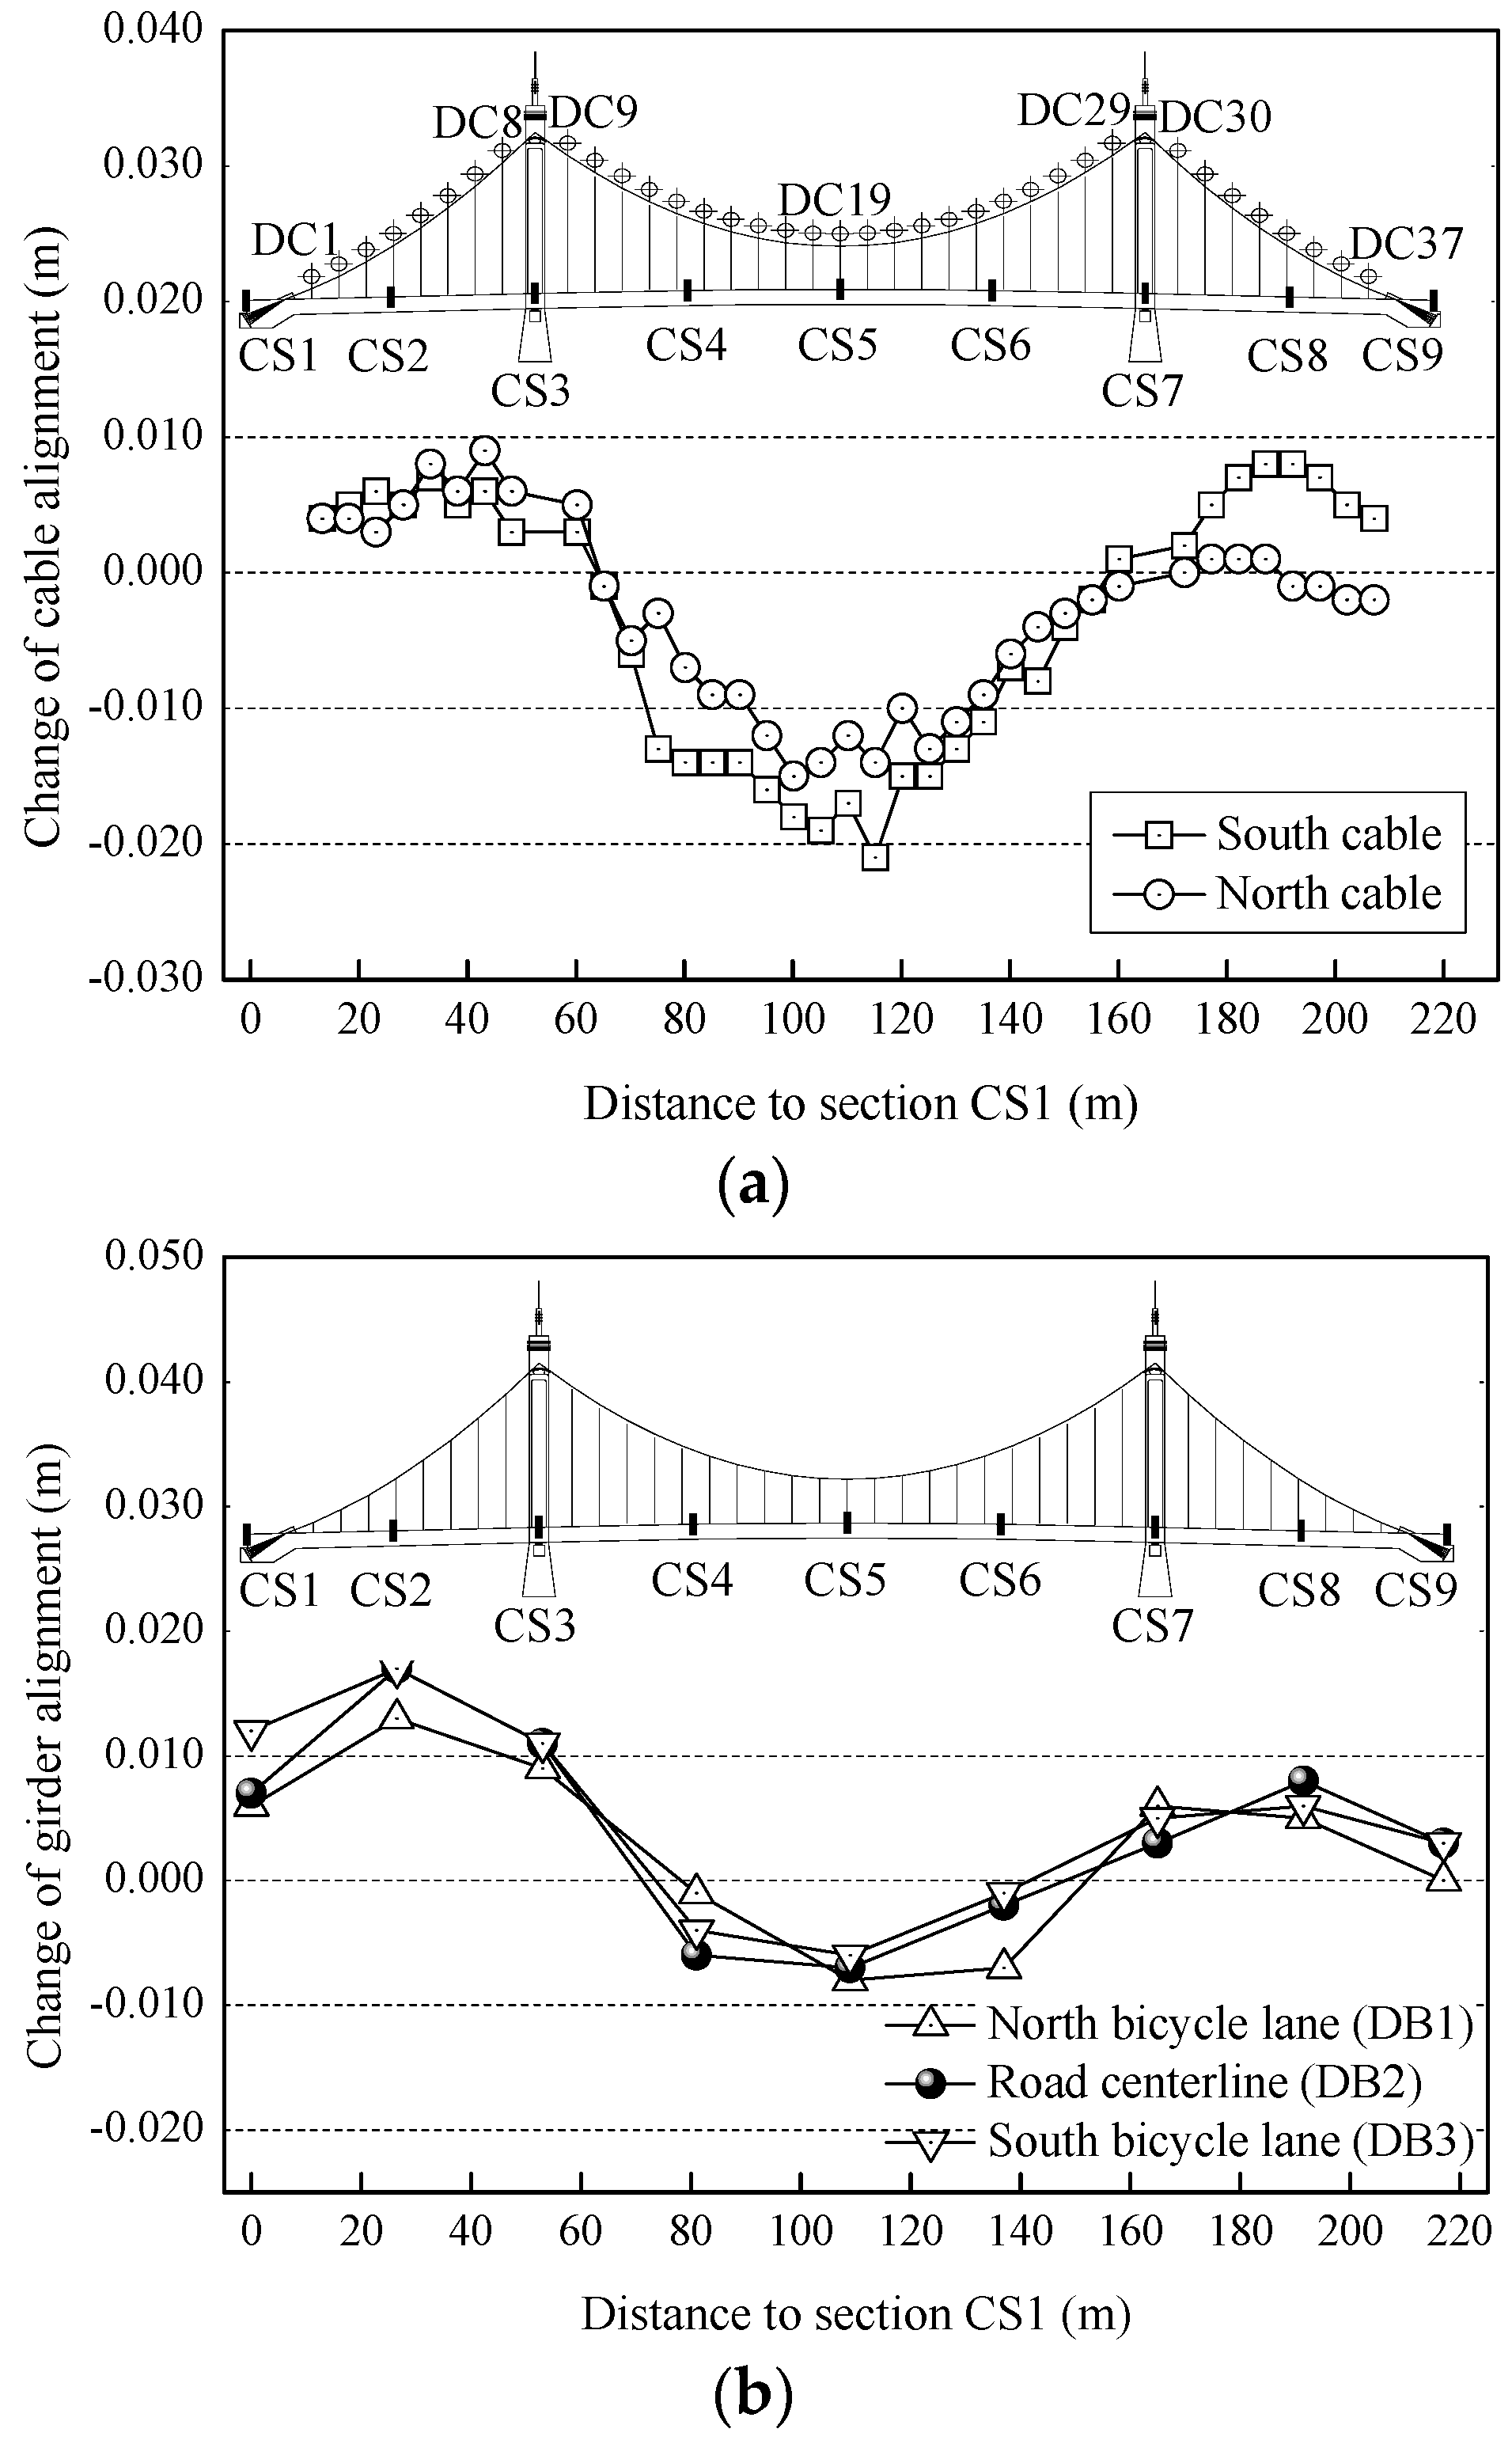
The comparison between the changes of cable alignments measured after the first half year and one year are shown as Figure 7. The ascent amounts of the cables at the middle ranges of side-spans were more significant when compared with the ones of the cables close to girder ends. The cable anchoring positions at girder ends moved towards the mid-span affected by concrete S&C. The cable anchoring positions at tower tops also moved towards the mid-span affected by the unbalanced horizontal cable forces. The cables at the middle range of mid-span dropped significantly. The cables between the towers and the quarter points of CS4 and CS6 rose conversely because of the appearances of inflection points at CS4 and CS6, according to the cable catenary characteristics, which can also explain the relatively significant deformations at DC5, DC19 and DC33. The variation amounts measured after one year appeared a multiple level growth when compared with the ones measured after the first half year.
5.1.2. Girder Alignments
The measured variation comparisons of girder alignments are shown in Figure 8. The side-span girder rose and the mid-span girder located at the middle range dropped significantly. The deformations of the girder between the towers and the quarter points of CS4 and CS6 changed differently along the transverse direction. The girder along the road centerline dropped affected by concrete S&C, and the girder along the non-motorized lanes rose affected by the relatively closer distances to hangers and the upward displacements of cables, which meant the occurrences of girder warping deformations and reflected the spatial effect of the extra-wide concrete girder. The variation amounts of girder alignments measured after one year also increased significantly when compared with the ones measured after the first half year.
5.1.3. Tower Top Deformations
The measured tower top deformations are shown as Table 2. The tower settlement amounts were small after one year, and the transverse displacements of towers were more significant than the longitudinal ones. The southwest tower had offset 2.7 cm towards the road centerline during the system transformation due to the shearing center of girder cross-section is closer to road centerline as compared with the designed hanging point. The towers continued to offset towards the road centerline based on the measured data. The stress states of tower roots are worthy of attention during the long-time health monitoring. In addition, the towers offset longitudinally towards the mid-span slightly affected by concrete S&C. The towers should be biased towards the side-span in advance through adjusting the internal forces of the hangers close to towers during hanger tension process, which can reduce the adverse influences brought by concrete S&C.
5.2. Vibration Monitoring Results
The girder vibration data measured in 15 April 2015 and 15 April 2016 were chosen to analyze the changes of girder vibration frequencies during the first operation year. The calculated and measured results are shown in Table 3, the small frequency changes reflect the stable structural stiffness and mass of the main girder.
5.3. Internal Force Monitoring Results
The internal force data measured in 15 April 2015, 15 October 2015 and 15 April 2016 were chosen to analyze the variation amounts of structural internal forces during the first operation year. The changes were also mainly caused by concrete S&C because of the same ambient factors.
5.3.1. Cable Forces
The measured change percentages of cable forces are shown in Table 4. The cable forces decreased when compared with the initial state, the reduction percentages are less than 1%, which reflects the stable performance of the cable system.
5.3.2. Transverse Distributions of Girder Stress Increments
The measured variations of girder longitudinal stresses are shown in Figure 9. As shown in Figure 9a,b, the compressive stresses of side-span girder generally increased during the first half year affected by the concrete shrinkage and elastic compression of girder under the huge horizontal cable forces. Then, the compressive stresses of side-span girder top plate decreased slightly after the first year, which was caused by the rise of side-span girder along with the cables that were affected by the movements of cable anchoring positions towards the mid-span. As for the side-span girder bottom plate, the compressive stresses of the measuring points including SD2, SD3, SD6 and SD7, which are close to the hanger points, also decreased slightly after the first year along with the decreased horizontal cable forces. However, the stresses of SD1, SD4, SD5 and SD8, which are far away from the hanger points, increased continually because the influences brought by the cable force changes were weak. The uneven transverse distributions of stress changes reflect the significant spatial effect of the extra-wide girder.
The stress changes of mid-span girder are shown in Figure 9c,d. The compressive stresses of top plate increased continually along with the girder deflection, and the bottom plate stresses changed insignificantly during the first half year and began to decrease after the first year affected by concrete S&C.
5.3.3. Tower Root Stresses
The measured compressive stresses and change percentages of west tower roots are shown in Table 5. The variation amounts within the range from −1 MPa to 1.5 MPa reflect the whole sectional compression status of the tower roots.
5.4. Influences Brought by Diurnal Temperature Difference
The monitoring data measured at 5 a.m. and 3 p.m. in 17 October 2015 were chosen to analyze the structural changes that were caused by diurnal temperature difference. The ambient temperatures were 20 °C and 35 °C, respectively. The concrete S&C effects were neglected because the two moments were close to each other.
The measured changes of structural alignments and girder compressive stresses are shown in Figure 10. The mid-span cables and girder dropped slightly, as shown in Figure 10a,b. The cable catenary sag increased along with the thermal expansions of steel wires and increases in cable length. In terms of the east side-span, the thermal expansion of concrete was caused by the ambient warming simultaneously besides the increases in cable catenary sag. The cable anchoring positions at girder ends moved towards the expansion joints. The cables and girder rose affected by the thermal expansion of mid-span girder and bidirectional sliding bearings between the east towers and girder. As for the west side-span, the bearings between the west towers and girder were transverse one-way sliding bearings. The additional movements of west cable anchoring positions that are caused by the thermal expansion of mid-span girder were relatively smaller when compared with the east ones. Thus, the structural alignments changed insignificantly.
The measured changes of girder compressive stresses are shown in Figure 10c. In terms of the side-span girder, the compressive stresses increased affected by concrete thermal expansion and constrains brought by expansion joints. As for the mid-span girder, the top plate compressive stresses increased, and the bottom plate stresses decreased affected by the girder deflection. The uneven changes of the girder stresses between the side and middle webs of the same cross section caused by the temperature gradients reflect the significant spatial effect of the extra-wide girder.
5.5. Influences Brought by Seasonal Ambient Warming
The monitoring data measured in 24 December 2015 and 15 April 2016 were chosen to analyze the changes caused by seasonal ambient warming. The ambient temperatures were 2 °C and 28 °C, respectively. The concrete S&C effects between these two moments were deducted approximately according to the data differences between 15 October 2015 and 15 April 2016 with the same ambient temperatures. Conservative variation amounts were obtained by this data process method, and the change trend analysis would not be affected.
The measured changes of structural alignments and girder compressive stresses are shown as Figure 11. The alignment changes of the cable and girder shown in Figure 11a,b were synchronous and more significant when compared with the ones shown in Figure 10a,b. The mid-span cables and girder dropped simultaneously along with the increase in catenary sag. The side-span cables and girder rose along with the movements of cable anchoring positions at girder ends towards the expansion joints caused by the thermal expansion of girder concrete.
The measured changes of girder compressive stresses are shown in Figure 11c. The girder compressive stresses increased generally, and the stress increments of middle side-span bottom plate were bigger than the other locations. The health monitoring for the stress increments in this region are worthy of attention when encountering with extreme warming.
5.6. Influences Brought by Dual Effects of Concrete S&C and Ambient Warming
The influence laws of the dual effects brought by concrete S&C and seasonal ambient warming were investigated. The monitoring data measured in 24 December 2015 and 15 April 2016 were chosen to compare. The temperatures were 2 °C and 28 °C, respectively.
The measured changes of structural alignments and girder compressive stresses are shown in Figure 12. The alignments changes of the cable and girder shown in Figure 12a,b were synchronous. The mid-span alignments dropped, and the side-span alignments rose. The variation magnitudes that are caused by dual effects were significantly bigger than the ones caused by single concrete S&C and single ambient warming because the change trends of structural alignments caused by these two single effects are the same.
The measured changes of girder compressive stresses are shown in Figure 12c. The girder compressive stresses increased generally, and the stress increments of side-span girder bottom plate and mid-span girder top plate were significantly bigger than the ones caused by single concrete S&C and single ambient warming. The health monitoring for the compressive failures of the concrete in this region are worthy of attention affected by heavy vehicle loads, long-time concrete S&C, and extreme seasonal warming. The initial compressive stresses in this region should be decreased by the pre-deviations of towers towards side-span and pre-lift of mid-span girder.
6. Prediction of Concreter Shrinkage & Creep Effects
6.1. Global Deformation
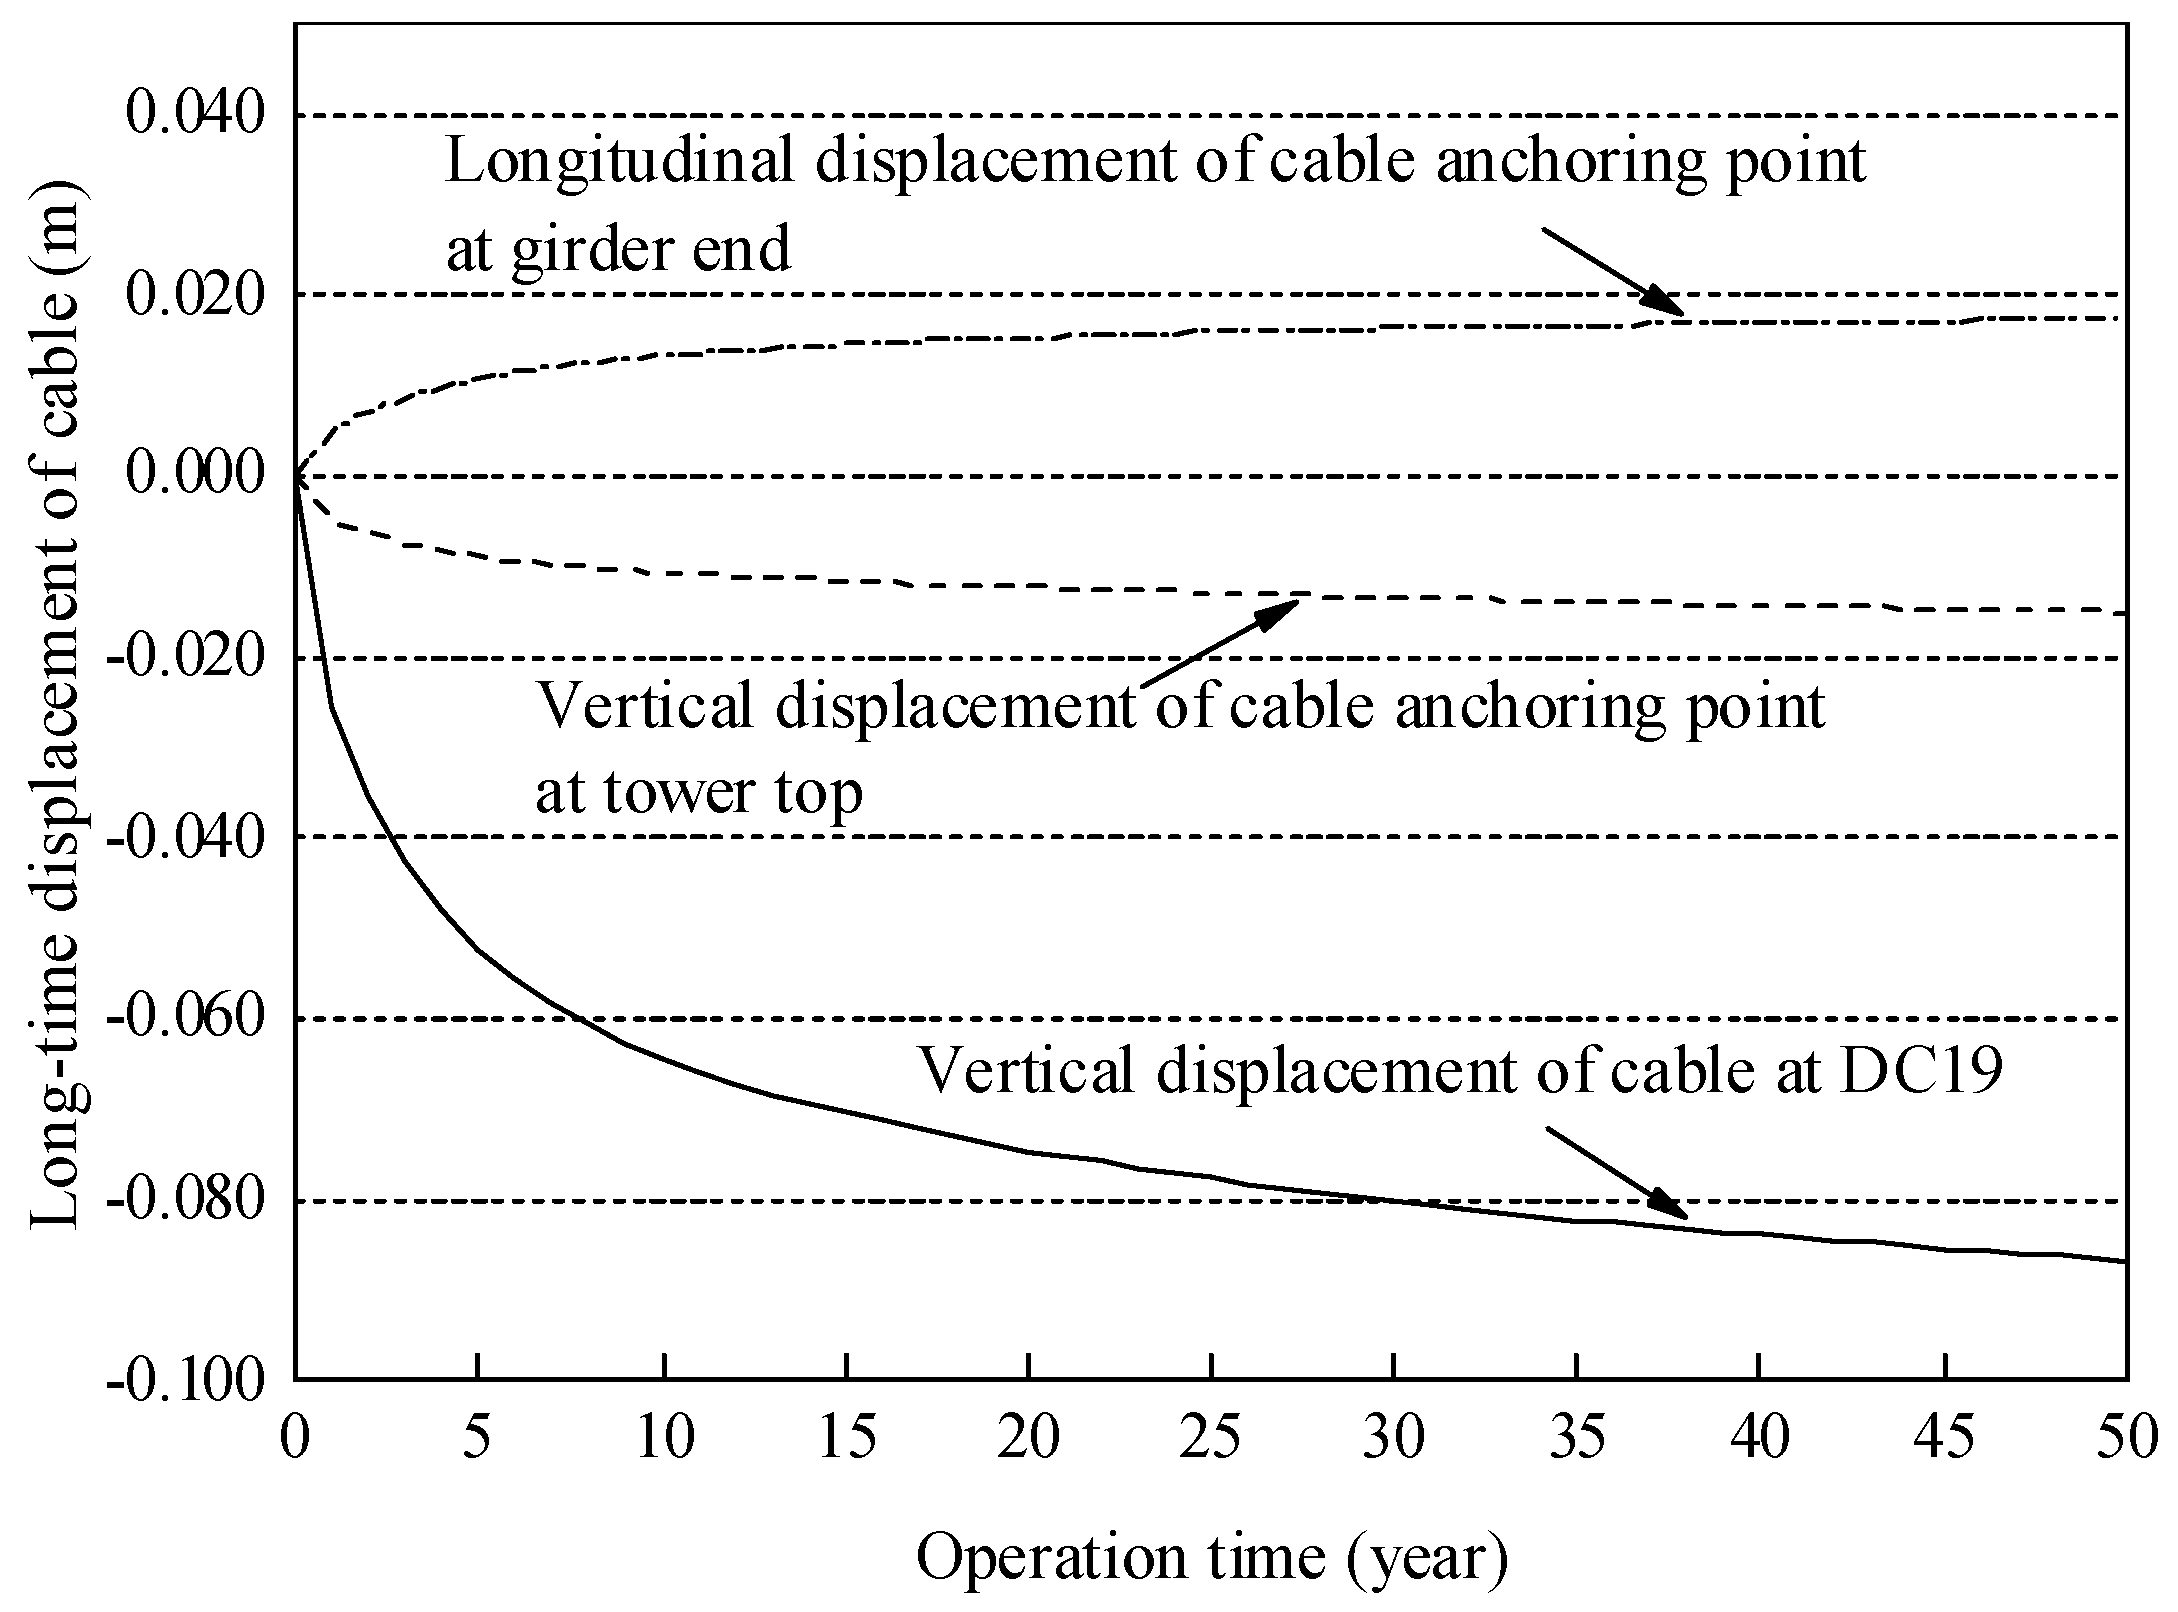
The predicted long-time displacements of the cable and cable anchoring points affected by concrete S&C are shown in Figure 13. The reliability of the calculation was validated by comparing the calculated displacement of cable at DC19 of −0.026 m after the first year with the measured data of −0.018 m shown in Figure 7b. The displacements of the cable anchoring positions at girder ends towards the mid-span and the drops of anchoring positions at tower tops will be caused by the concrete elastic compression and S&C deformation. Significant vertical displacements of the middle mid-span cables will be caused by the movements of cable anchoring positions at tower tops towards the mid-span and the unbalance horizontal cable forces.
The predicted long-time changes of girder alignments are shown in Figure 14. The mid-span girder deflections will increase continually, and the girder deflection at CS5 is the most significant. The side-span girder will rise slightly along with the rise of cable. The girder deflections present a change trend of increasing quickly firstly and then slowing down.
6.2. Internal Force
The predicted long-time change percentages of hanger forces are shown in Figure 15. The hanger forces will decrease continually. The reduction percentages of side-span hangers are bigger than the ones of mid-span hangers, and the ones of side-span hangers close to the towers are the most significant, with the value of −9% after 50 years.
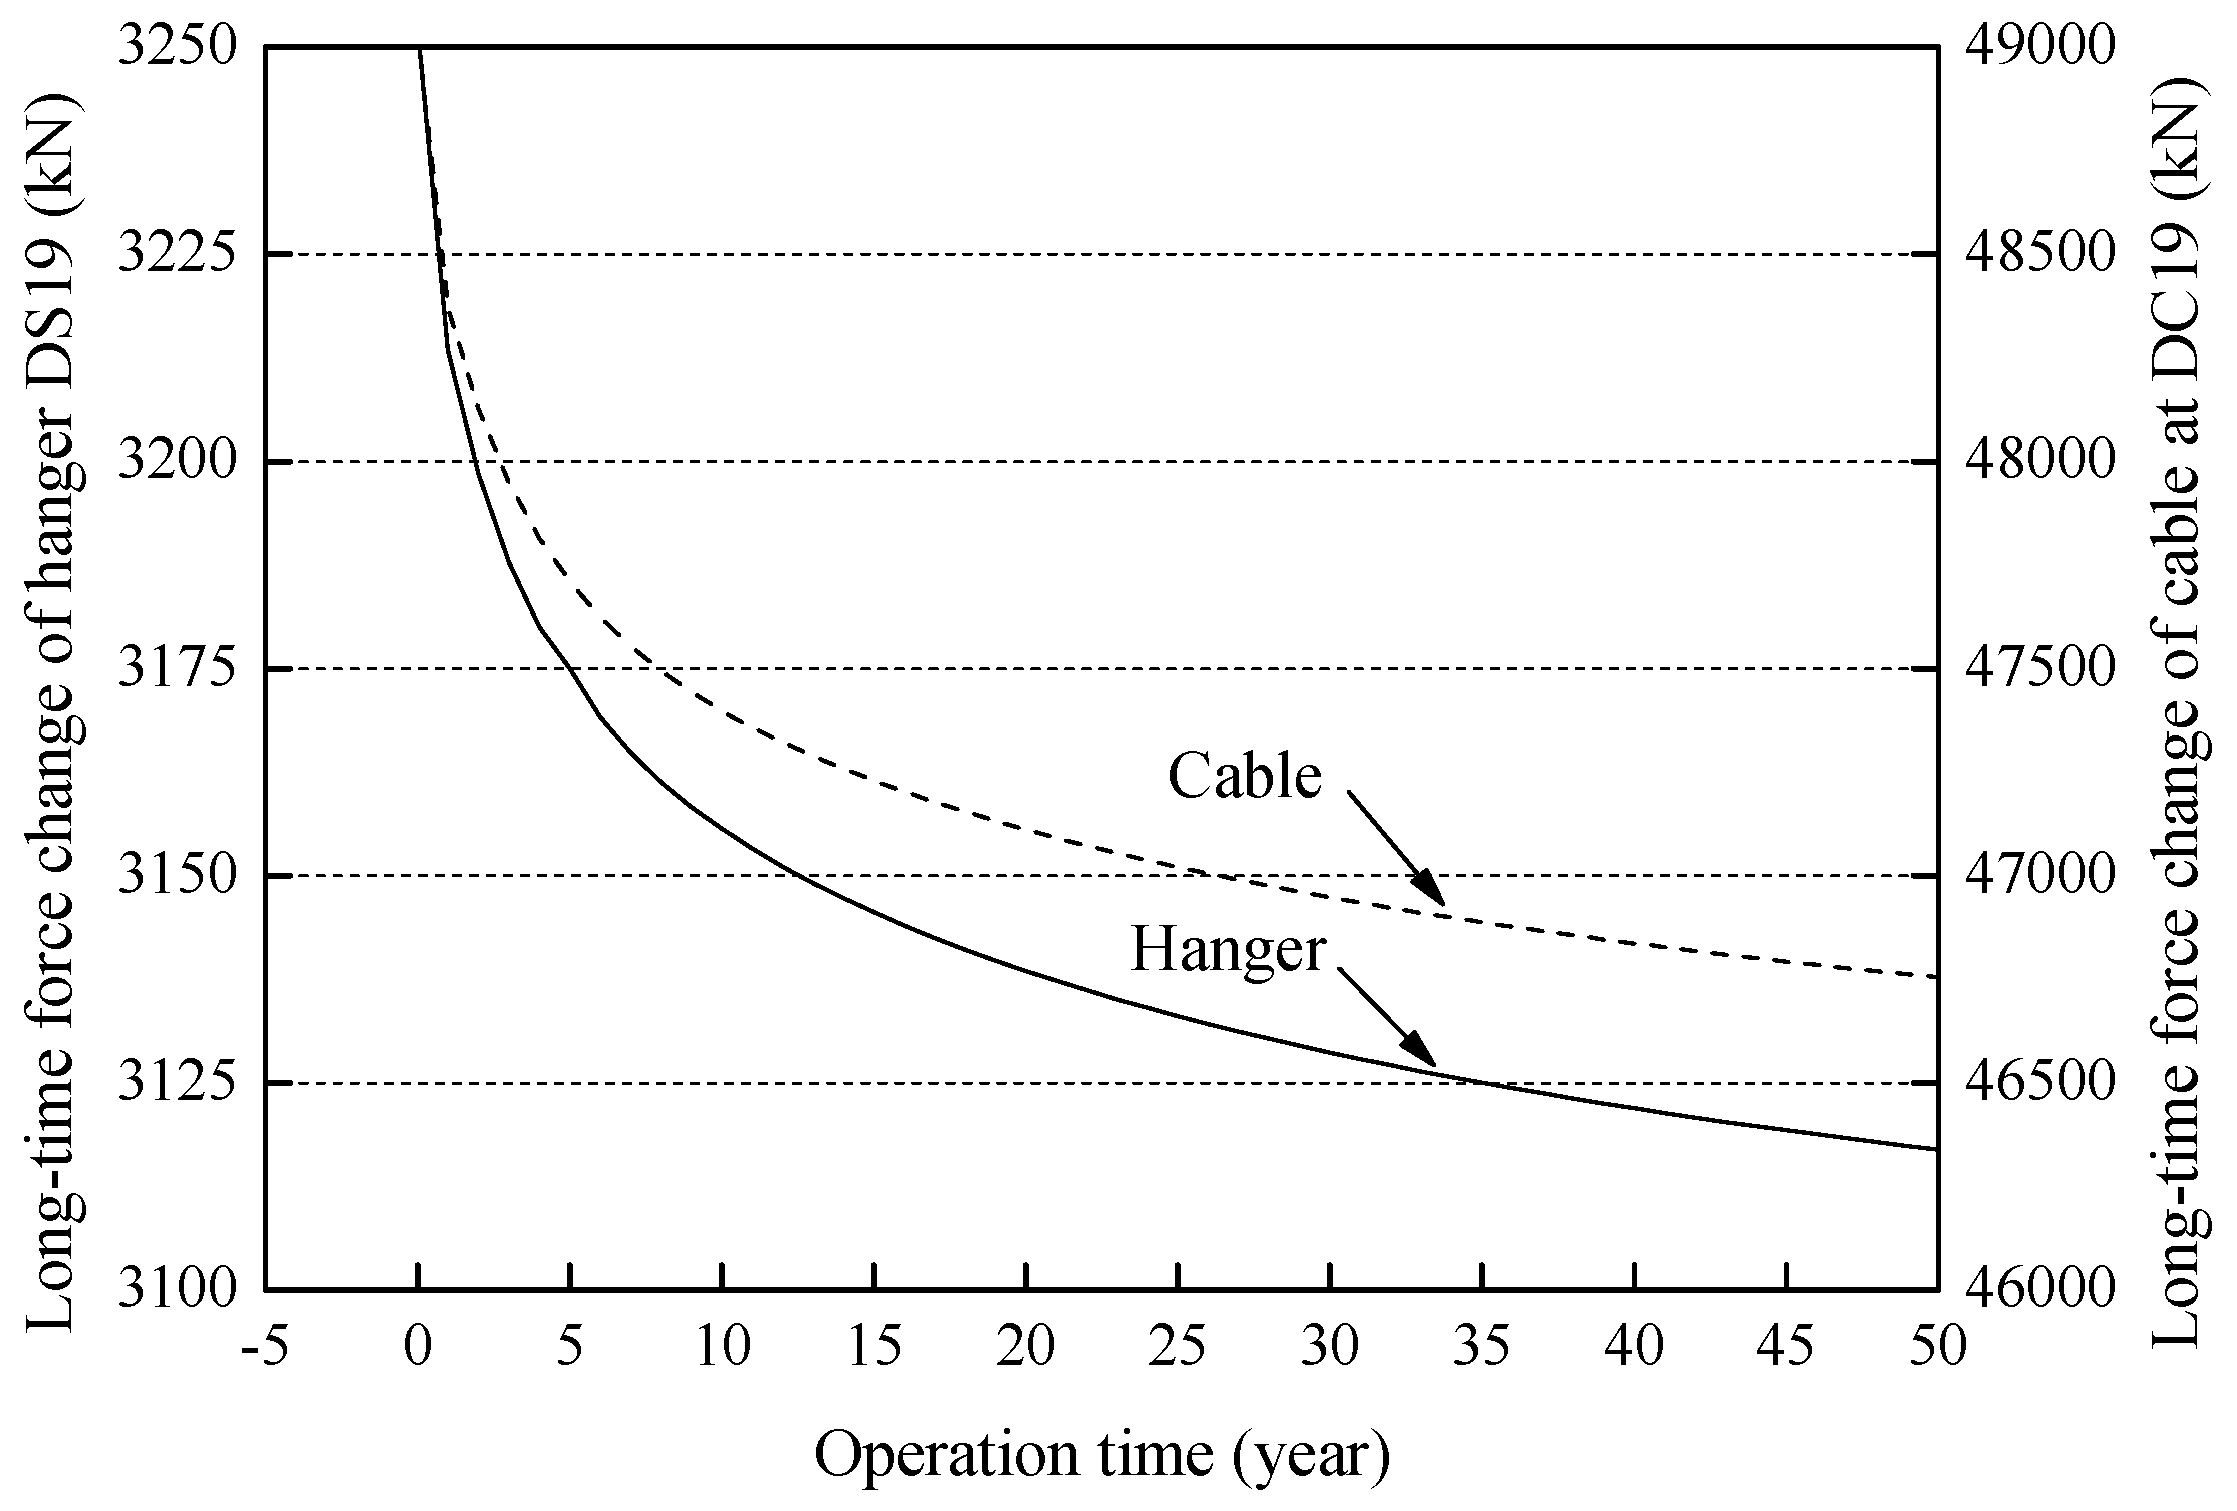
The predicted changes of the hanger and cable forces at middle mid-span DS19 are shown in Figure 16. The internal forces of hanger and cable at DS19 will decrease by 4.2% and 4.6% after 50 years, respectively. The change rates will tend to be 0 approximatively, namely the cable system becomes more and more stable.
The prediction results that were obtained by the proposed method can be used to provide appropriate feedback to the construction control process for the self-anchored suspension bridge. Reasonable amounts of the pre-lift of mid-span girder and deviations of towers towards side-span can be determined to offset the adverse concrete S&C effects during long-term service life. A parametric study on the influence of the final girder alignment in the stress and geometry evolution of the girder was conducted. This study was accomplished by changing the hanger forces to provide different final geometries to the main girder. The change percentages of the global hanger forces were set as 1%~5%. The completion state of bridge after equilibrium analysis and the girder state evolution at mid-span section CS5 after 50 years are shown in Table 6, where the longitudinal stress values of the plate regions close to the first outer web were extracted to compare. The results show that appropriate pre-lift of girder at mid-span can effectively allocate the girder compressive stress reserves, the compressive stress reserves after hanger force adjustments of the top plate decreased, and the ones of bottom plate increased. Then, the compressive stresses after 50 years of the top plate will decrease in a safe range, and the ones of bottom plate will increase. The adverse influences brought by the concrete S&C in structural safety were reduced by the appropriate hanger force adjustment. In addition, the adjustment of the curvature of main girder should be conducted in a reasonable range to avoid the excessive bending moment in main girder.
7. Conclusions
In this study, we focused on the measured performances affected by the concrete shrinkage & creep and thermal effects of a complicated self-anchored suspension bridge with extra-wide concrete girder, Hunan Road Bridge, which is currently the widest among similar bridges in China. In addition, the structural changes of interest during the long-term service period were predicted. The significant contributions of this study are summarized as follows:
- The measured data reflect the stability and safety of Hunan Road Bridge. The transverse displacements of towers were more significant than the longitudinal ones. The spatial effect of the girder is significant due to the extra width, which performed as the girder longitudinal stresses changed unevenly along the transverse direction. The slight changes of girder vibration frequencies reflect the stable girder structural stiffness and mass.
- The deviations of cable anchoring positions and deflection of mid-span girder that are caused by the concrete S&C and ambient temperature changes are main factors influencing the structural alignments and internal forces of concrete self-anchored suspension bridges. Especially for the one having an extra-wide concrete girder such as Hunan Road Bridge.
- The cable anchoring positions at girder ends and tower tops moved towards the mid-span affected by the concrete S&C. The measured deflections of the girder at the middle region of mid-span were significant. Increases in the longitudinal compressive stresses of top plate and decreases in the ones of bottom plate were caused in this region. In addition, the girder compressive stresses increased generally along with the seasonal ambient warming and decreased along with cooling. The uneven distributions of girder stress variations between the side and middle webs of the same section caused by the temperature gradient effects reflect the significant spatial effect of the extra-wide girder.
- The stress increases of side-span girder bottom plate and mid-span girder top plate under extreme seasonal warming, as well as the stress decreases of side-span girder top plate and mid-span girder bottom plate under extreme cooling, are worthy of attentions when considering the long-time concrete S&C effects. Moreover, the concrete S&C effects should be taken into account during the determination of reasonable final state. The methods to offset the adverse influences of concrete S&C include the set of appropriate girder camber, pre-deviations of towers towards side-span, and pre-lift of mid-span girder through adjusting the final hanger forces in a reasonable range. A parametric study on the influence of the final girder alignment after hanger force adjustment in the stress and geometry evolution of the main girder was conducted. The hanger force adjustment can allocate the girder compressive stress reserves reasonably. The adverse influences in the safety of concrete self-anchored suspension bridge, brought by the heavy vehicle loads, concrete S&C, and extreme temperature changes, may then be reduced effectively, which are the lessons learned from this paper.
Acknowledgments
The authors gratefully acknowledge the supports of the China Scholarship Council (No. 201606090050), National Natural Science Foundation of China (No. 51278104), Transportation Scientific Research Program of Jiangsu Province, China (No. 2011Y03), Research Fund for the Doctoral Program of Higher Education of China (No. 20133204120015), and Universities Natural Science Foundation of Jiangsu Province, China (No. 12KJB560003).
Author Contributions
Guangpan Zhou did the measurement and mathematical modeling, performed the simulations, and contributed to the writing. Aiqun Li, Jianhui Li and Maojun Duan contributed to the revisions and discussions of the contents.
Conflicts of Interest
The authors declare no conflict of interest.
References
- Li, J.H.; Li, A.Q. Calculation, Monitoring and Assessment of Spatial Cable Self-Anchored Suspension Bridges; China Communication Press: Beijing, China, 2011. (In Chinese) [Google Scholar]
- Sun, J.; Manzanarez, R.; Nander, M. Suspension cable design of the new San Francisco-Oakland Bay Bridge. J. Bridge Eng. 2004, 9, 101–106. [Google Scholar] [CrossRef]
- Kim, H.K.; Lee, M.J.; Chang, S.P. Determination of hanger installation procedure for a self-anchored suspension bridge. Eng. Struct. 2006, 28, 959–976. [Google Scholar] [CrossRef]
- Li, A.Q.; Miao, C.Q.; Li, Z.X. Health monitoring system for the Runyang Yangtse River Bridge. J. Southeast Univ. (Nat. Sci.) 2003, 33, 544–548. (In Chinese) [Google Scholar]
- Li, A.Q.; Wang, H. Stress analysis on steel box girders of super-long-span suspension bridges with sub model method. Eng. Mech. 2007, 24, 80–84. (In Chinese) [Google Scholar] [CrossRef]
- Wan, L.J.; Shan, W.; Yuan, J.X. Experimental study on static characteristics model of self-anchored suspension bridge. J. Highway Transp. Res. Dev. 2014, 31, 108–114. (In Chinese) [Google Scholar]
- Chou, C.C.; Uang, C.M.; Seible, F. Experimental evaluation of compressive behavior of orthotropic steel plates for the new San Francisco-Oakland Bay Bridge. J. Bridge Eng. 2006, 11, 140–150. [Google Scholar] [CrossRef]
- Kim, Y.C.; Kaloop, M.R.; Hu, J.W. Predicting the performance of high-speed railway bridge using regression neural network approach. Appl. Mech. Mater. 2017, 873, 220–224. [Google Scholar] [CrossRef]
- Kaloop, M.; Hu, J.; Bigdeli, Y. Identification of the response of a controlled building structure subjected to seismic load by using nonlinear system models. Appl. Sci. 2016, 6, 301. [Google Scholar] [CrossRef]
- Spencer, B.F.; Ruiz-Sandoval, M.; Kurata, N. Smart sensing technology: Opportunities and challenges. Struct. Control Health Monit. 2004, 11, 349–368. [Google Scholar] [CrossRef]
- Li, J.; Mechitov, K.A.; Kim, R.E.; Spencer, B.F. Efficient time synchronization for structural health monitoring using wireless smart sensor networks. Struct. Control Health Monit. 2016, 23, 470–486. [Google Scholar] [CrossRef]
- Han, L.; Newhook, J.P.; Mufti, A.A. Centralized remote structural monitoring and management of real-time data. Proc. SPIE 2004, 5393, 55–65. [Google Scholar]
- Alavi, A.H.; Hasni, H.; Jiao, P.C.; Borchani, W.; Lajnef, N. Fatigue cracking detection in steel bridge girders through a self-powered sensing concept. J. Constr. Steel Res. 2017, 128, 19–38. [Google Scholar] [CrossRef]
- Alavi, A.H.; Hasni, H.; Lajnef, N.; Chatti, K.; Faridazar, F. Damage detection using self-powered wireless sensor data: An evolutionary approach. Measurement 2016, 82, 254–283. [Google Scholar] [CrossRef]
- Alavi, A.H.; Hasni, H.; Lajnef, N.; Chatti, K.; Faridazar, F. An intelligent structural damage detection approach based on self-powered wireless sensor data. Autom. Constr. 2016, 62, 24–44. [Google Scholar] [CrossRef]
- Kaloop, M.; Hu, J.; Elbeltagi, E. Adjustment and assessment of the measurements of low and high sampling frequencies of GPS real-time monitoring of structural movement. ISPRS Int. J. Geo-Inf. 2016, 5, 222. [Google Scholar] [CrossRef]
- Kumberg, T.; Schneid, S.; Reindl, L. A wireless sensor network using GNSS receivers for a short-term assessment of the modal properties of the Neckartal Bridge. Appl. Sci. 2017, 7, 626. [Google Scholar] [CrossRef]
- Kong, Q.Z.; Robert, R.; Silva, P.; Mo, Y. Cyclic crack monitoring of a reinforced concrete column under simulated pseudo-dynamic loading using piezoceramic-based smart aggregates. Appl. Sci. 2016, 6, 341. [Google Scholar] [CrossRef]
- Jiao, P.C.; Borchani, W.; Hasni, H.; Lajnef, N. A new solution of measuring thermal response of prestressed concrete bridge girders for structural health monitoring. Meas. Sci. Technol. 2017, 28, 085005. [Google Scholar] [CrossRef]
- Hu, D.T.; Guo, Y.X.; Chen, X.F.; Zhang, C.R. Cable force health monitoring of Tongwamen Bridge based on fiber bragg grating. Appl. Sci. 2017, 7, 384. [Google Scholar] [CrossRef]
- Raeisi, F.; Mufti, A.A.; Mustapha, G.; Thomson, D.J. Crack detection in steel girders of bridges using a broken wire electronic binary sensor. J. Civ. Struct. Health Monit. 2017, 7, 233–243. [Google Scholar] [CrossRef]
- Liu, Y.; Deng, Y.; Cai, C.S. Deflection monitoring and assessment for a suspension bridge using a connected pipe system: A case study in China. Struct. Control Health Monit. 2015, 22, 1408–1425. [Google Scholar] [CrossRef]
- Tennyson, R.C.; Mufti, A.A.; Rizkalla, S.; Tadros, G.; Benmokrane, B. Structural health monitoring of innovative bridges in Canada with fiber optic sensors. Smart Mater. Struct. 2001, 10, 560. [Google Scholar] [CrossRef]
- Shehata, E.; Rizkalla, S. Intelligent sensing for innovative bridges. J. Intell. Mater. Syst. Struct. 1999, 10, 304–313. [Google Scholar] [CrossRef]
- Deng, Y.; Liu, Y.; Feng, D.M. Monitoring damage evolution of steel strand using acoustic emission technique and rate process theory. J. Cent. South Univ. 2014, 21, 3692–3697. [Google Scholar] [CrossRef]
- Mutlib, N.K.; Baharom, S.B.; El-Shafie, A.; Nuawi, M.Z. Ultrasonic health monitoring in structural engineering: Buildings and bridges. Struct. Control Health Monit. 2016, 23, 409–422. [Google Scholar] [CrossRef]
- Mufti, A.A. Structural health monitoring of innovative bridge decks. Struct. Infrastruct. E 2005, 1, 119–133. [Google Scholar] [CrossRef]
- Klowak, C.; Rivera, E.; Mufti, A.A. Implementation of civionics in a second generation steel-free bridge deck. Nondestructive Evaluation and Health Monitoring of Aerospace Materials, Composites, and Civil Infrastructure IV. Proc. SPIE 2005, 5767, 195–204. [Google Scholar]
- Rivera, E.; Mufti, A.A.; Thomson, D.J. Civionics specifications for fiber optic sensors for structural health monitoring. Proc. SPIE 2004, 5393, 161–167. [Google Scholar]
- Kaloop, M.R.; Hu, J.W.; Elbeltagi, E. Evaluation of high-speed railway bridges based on a nondestructive monitoring system. Appl. Sci. 2016, 6, 24. [Google Scholar] [CrossRef]
- Zhou, G.P.; Li, A.Q.; Li, J.H.; Duan, M.J. Test and numerical investigations on static and dynamic characteristics of extra-wide concrete self-anchored suspension bridge under vehicle loads. J. Cent. South Univ. 2017, 24, 2382–2395. [Google Scholar] [CrossRef]
- Huffman, S.; Bagchi, A.; Mufti, A.A.; Neale, K.; Sargent, D.; Rivera, E. GFRP seismic strengthening and structural heath monitoring of Portage Creek Bridge concrete columns. Arab. J. Sci. Eng. B 2006, 31, 25–42. [Google Scholar]
- McNeill, D.; Card, L. Adaptive event detection for SHM system monitoring. In Sensing Issues in Civil Structural Health Monitoring; Springer: Dordrecht, The Netherlands, 2005; pp. 311–319. [Google Scholar]
- Kim, S.H.; Choi, J.G.; Ham, S.M.; Heo, W.H. Reliability evaluation of a PSC highway bridge based on resistance capacity degradation due to a corrosive environment. Appl. Sci. 2016, 6, 423. [Google Scholar] [CrossRef]
- Deng, Y.; Ding, Y.L.; Li, A.Q.; Zhou, G.D. Fatigue reliability assessment for bridge welded details using long-term monitoring data. Sci. China Technol. Sci. 2011, 54, 3371–3381. [Google Scholar] [CrossRef]
- Kim, S.H.; Won, J.H. Structural behavior of a long-span partially earth-anchored cable-stayed bridge during installation of a key segment by thermal prestressing. Appl. Sci. 2016, 6, 231. [Google Scholar] [CrossRef]
- Iskakbayev, A.; Teltayev, B.; Oliviero Rossi, C. Steady-state creep of asphalt concrete. Appl. Sci. 2017, 7, 142. [Google Scholar] [CrossRef]
- Hedegaard, B.D.; French, C.E.W.; Shield, C.K. Time-dependent monitoring and modeling of I-35W St. Anthony Falls Bridge. I: Analysis of monitoring data. J. Bridge Eng. 2017, 22, 04017025. [Google Scholar] [CrossRef]
- Hedegaard, B.D.; French, C.E.W.; Shield, C.K. Time-dependent monitoring and modeling of I-35W St. Anthony Falls Bridge. II: Finite-element modeling. J. Bridge Eng. 2017, 22, 04017026. [Google Scholar] [CrossRef]
- Salawu, O.S. Detection of structural damage through changes in frequency: A review. Eng. Struct. 1997, 19, 718–723. [Google Scholar] [CrossRef]
- Hjelmstad, K.D.; Shin, S. Damage detection and assessment of structures from static response. J. Eng. Mech. 1997, 123, 568–576. [Google Scholar] [CrossRef]
- Code for Design of Highway Reinforced Concrete and Prestressed Concrete Bridges and Culverts; JTG D62-2004; China Communication Press: Beijing, China, 2004. (In Chinese)
- Model Code for Concrete Structures 1990; CEB-FIP 90; Comité Euro-International du Béton-Fédération International de la Précontrainte: Thomas Telford, UK, 1990.
- Bažant, Z.P. Prediction of concrete creep effects using age-adjusted effective modulus method. J. Am. Concr. Inst. 1972, 69, 212–217. [Google Scholar]
- Tang, M.L. 3D geometric Nonlinear Analysis of Long-Span Suspension Bridge and Its Software Development. Ph.D. Dissertation, Southwest Jiaotong University, Chengdu, China, 2003. (In Chinese). [Google Scholar]
- Duan, M.J.; Li, J.H.; Suo, X.C.; Zhou, G.P. Refined analysis method of saddle for self-anchored concrete suspension bridge. J. Nanjing Technol. Univ. (Nat. Sci.) 2016, 38, 112–115. (In Chinese) [Google Scholar]
Figure 1.
Global layout of the Hunan Road Bridge (Unit: m).

Figure 2.
Cable system and extra-wide girder (Unit: m).

Figure 3.
Cross section of key component: (a) Main girder; (b) Tower; (c) Hanger; and, (d) Cable (Unit: cm).
Figure 3.
Cross section of key component: (a) Main girder; (b) Tower; (c) Hanger; and, (d) Cable (Unit: cm).
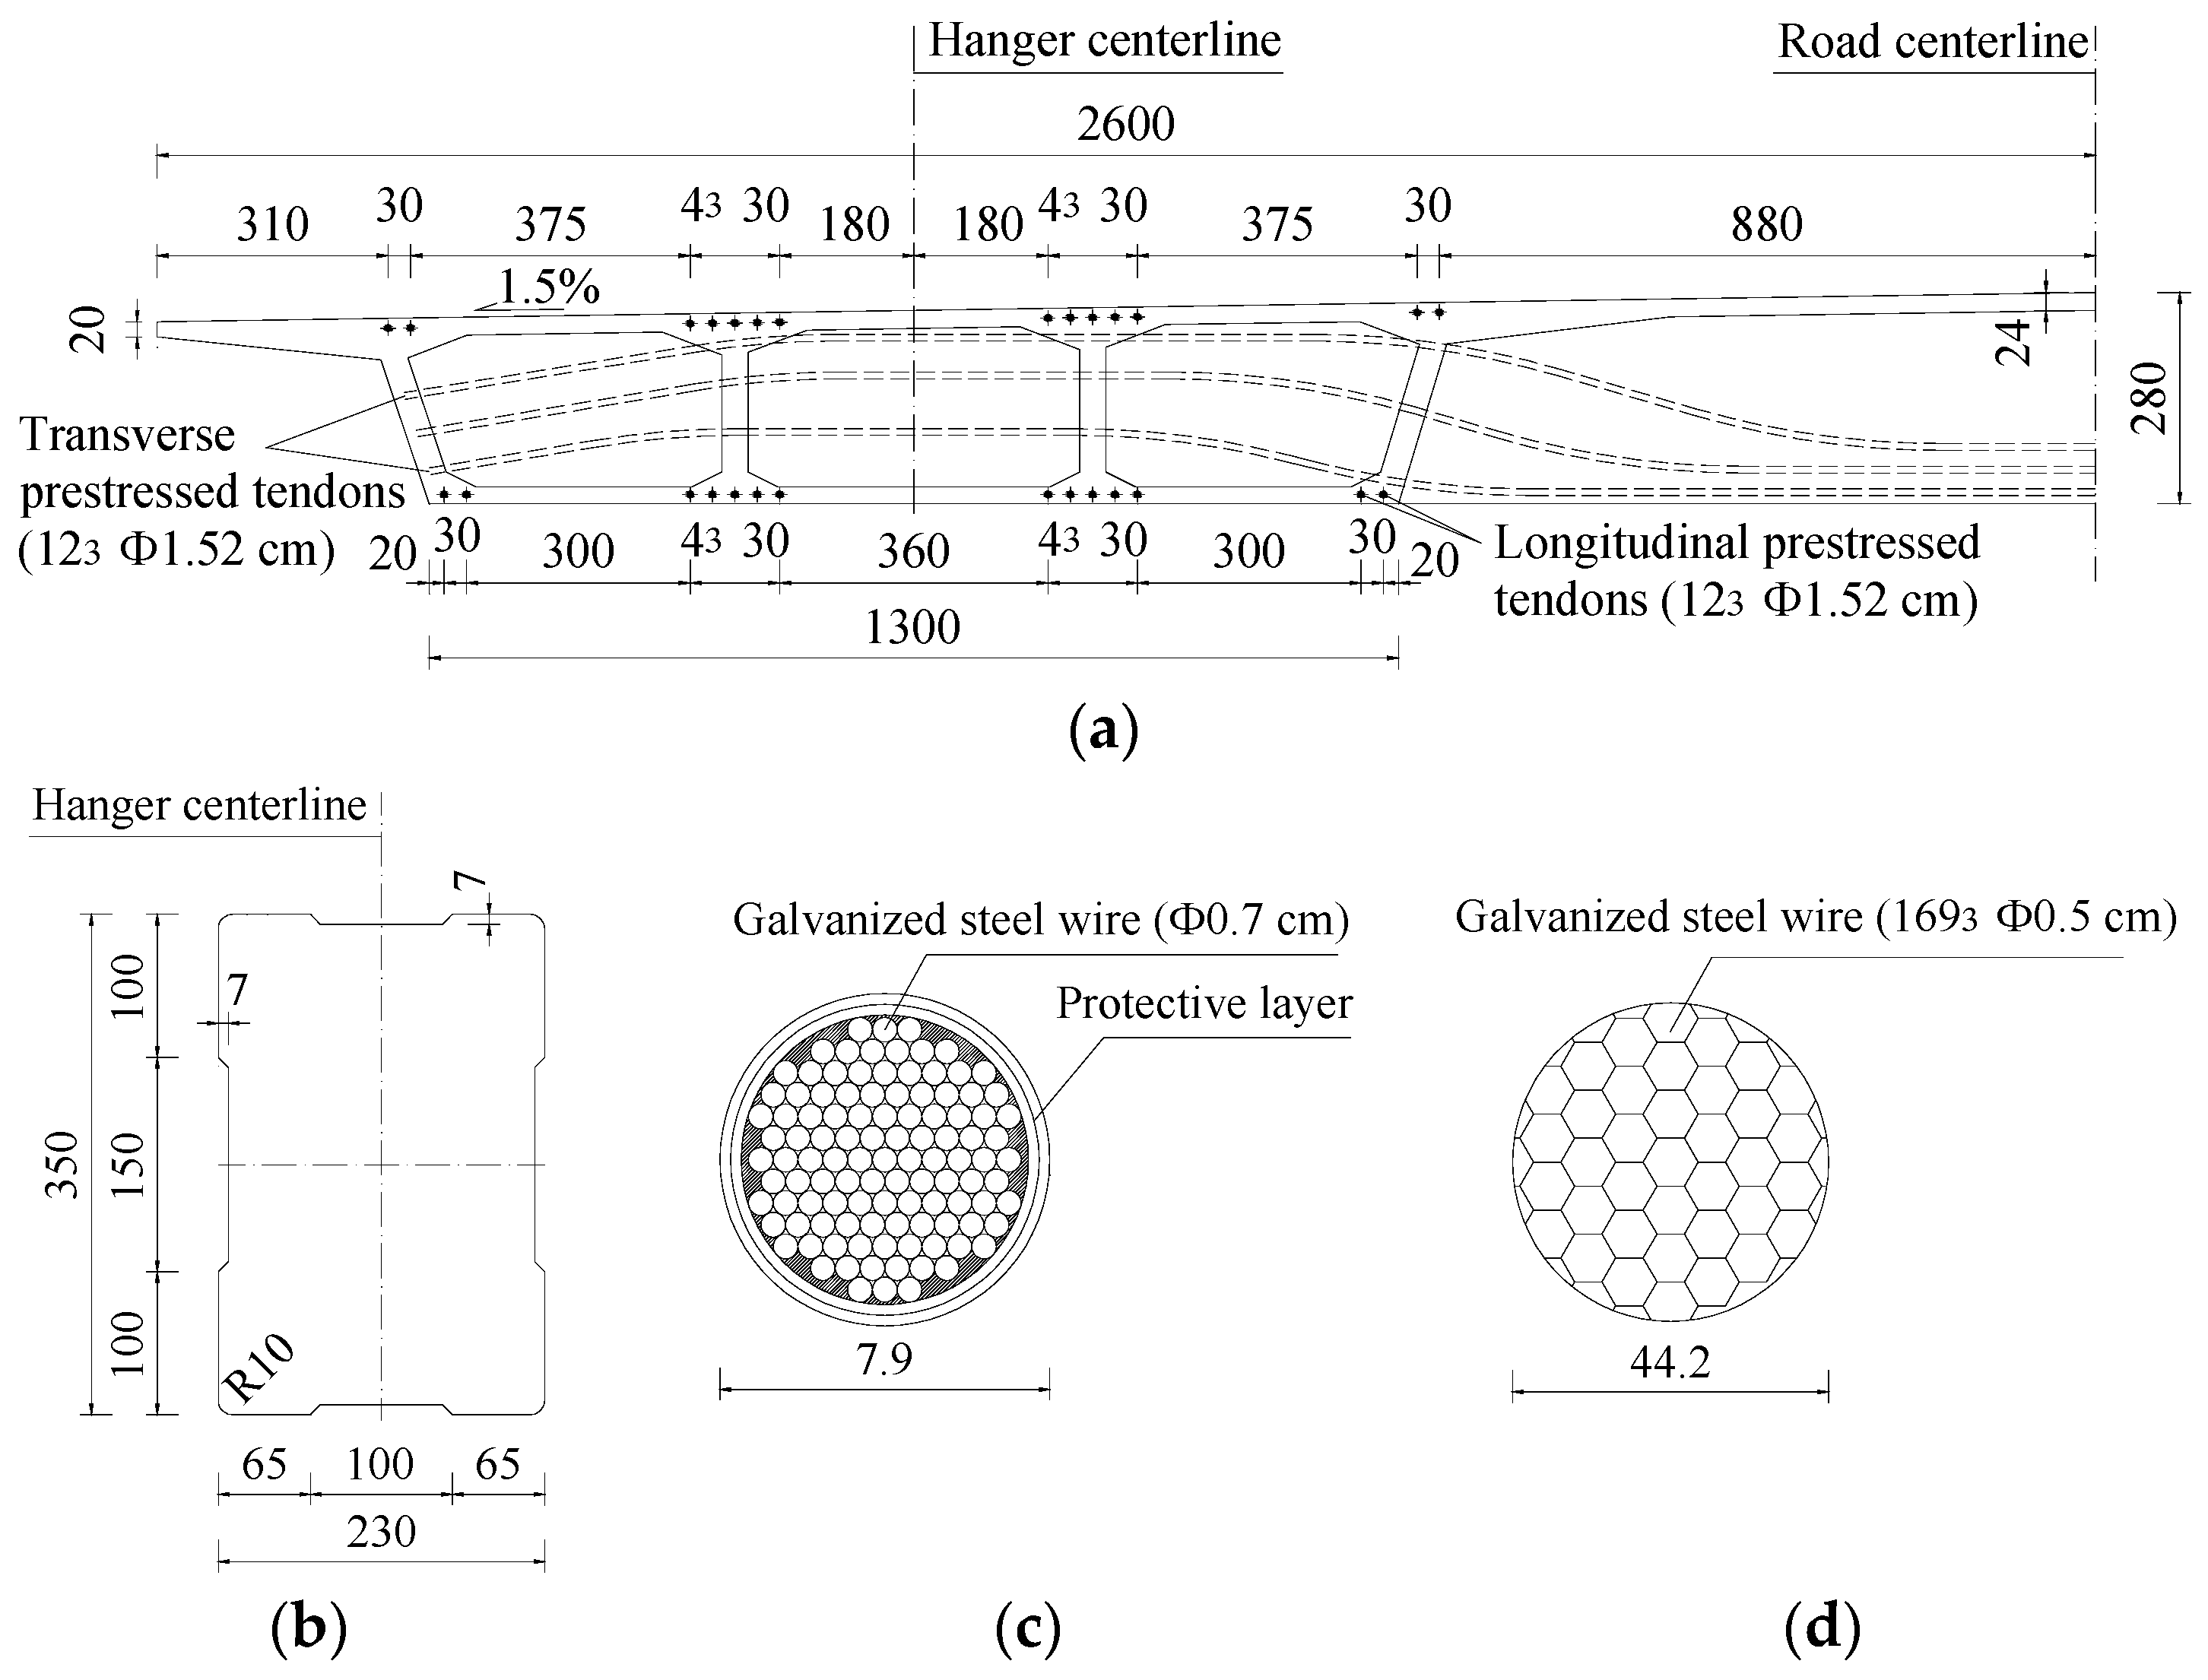
Figure 4.
Layout of the structural health monitoring (SHM) system: (a) Deformation; (b) Internal force; and (c) Vibration characteristic (Unit: m).
Figure 4.
Layout of the structural health monitoring (SHM) system: (a) Deformation; (b) Internal force; and (c) Vibration characteristic (Unit: m).

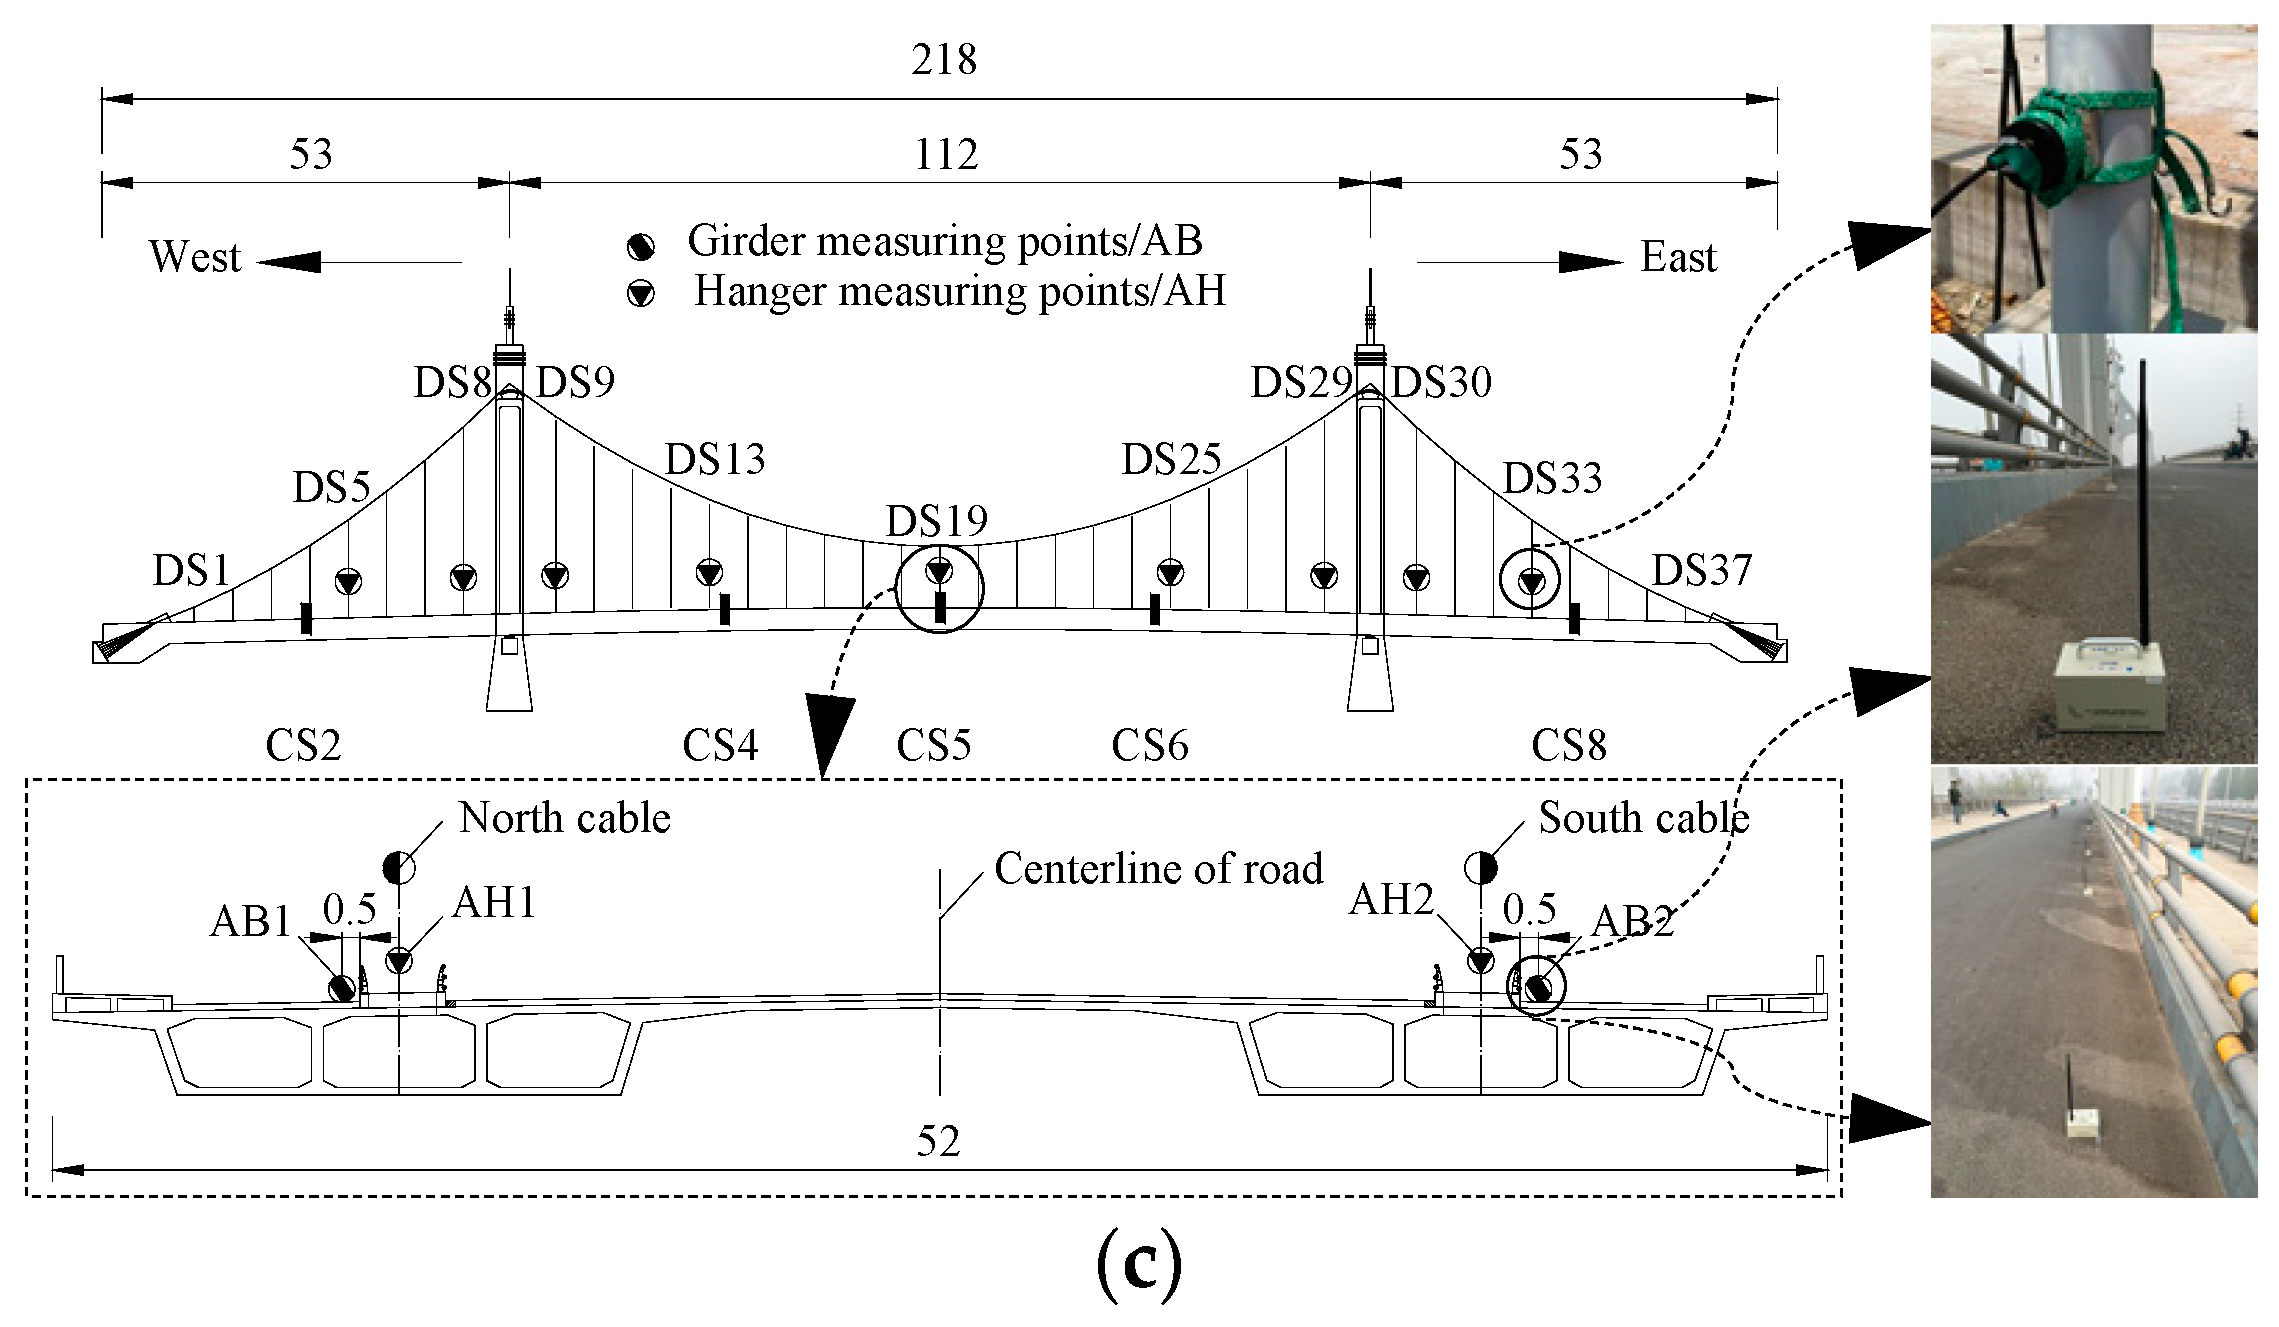
Figure 5.
Finite element model: (a) Global model; and (b) Girder finite element of Beam 188.
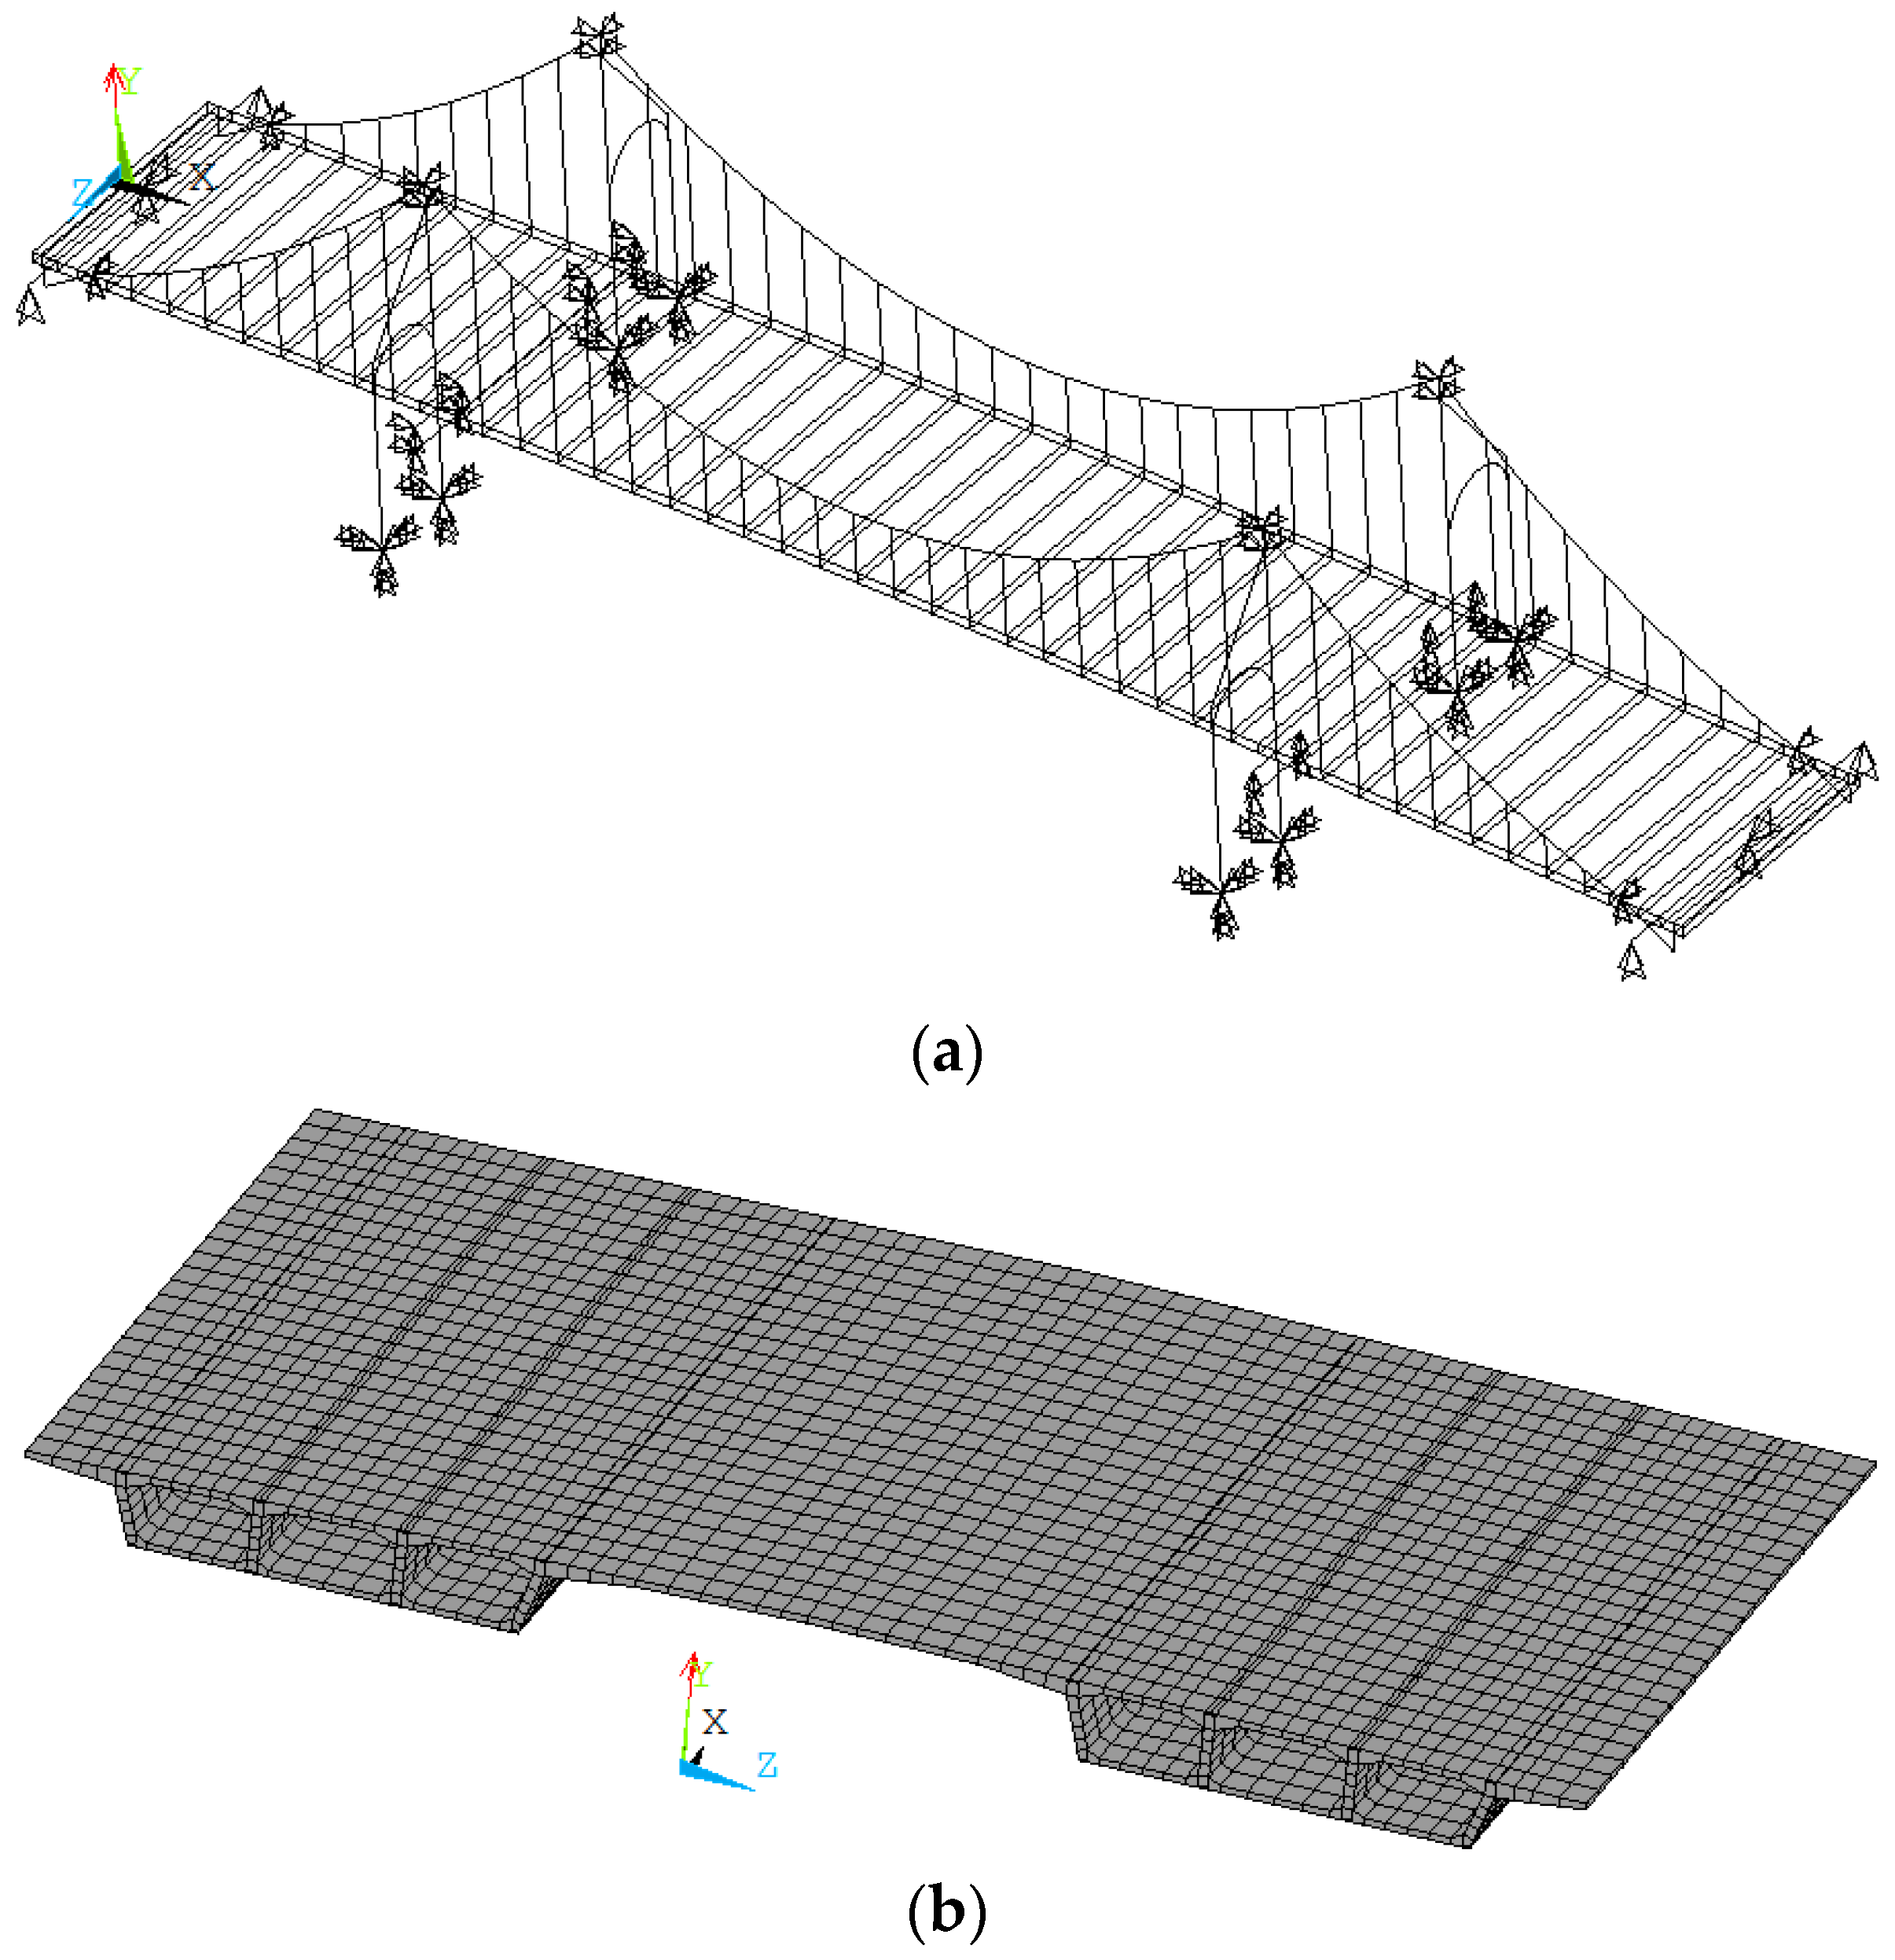
Figure 6.
Simulated girder longitudinal stress at mid-span section CS5: (a) Top plate; and, (b) Bottom plate.
Figure 6.
Simulated girder longitudinal stress at mid-span section CS5: (a) Top plate; and, (b) Bottom plate.

Figure 7.
Measured changes of cable alignments during the one-year period from April 2015 to April 2016: (a) First half year period; and (b) One-year period.
Figure 7.
Measured changes of cable alignments during the one-year period from April 2015 to April 2016: (a) First half year period; and (b) One-year period.

Figure 8.
Measured changes of girder alignments during the one-year period from April 2015 to April 2016: (a) First half year period; and (b) One-year period.
Figure 8.
Measured changes of girder alignments during the one-year period from April 2015 to April 2016: (a) First half year period; and (b) One-year period.
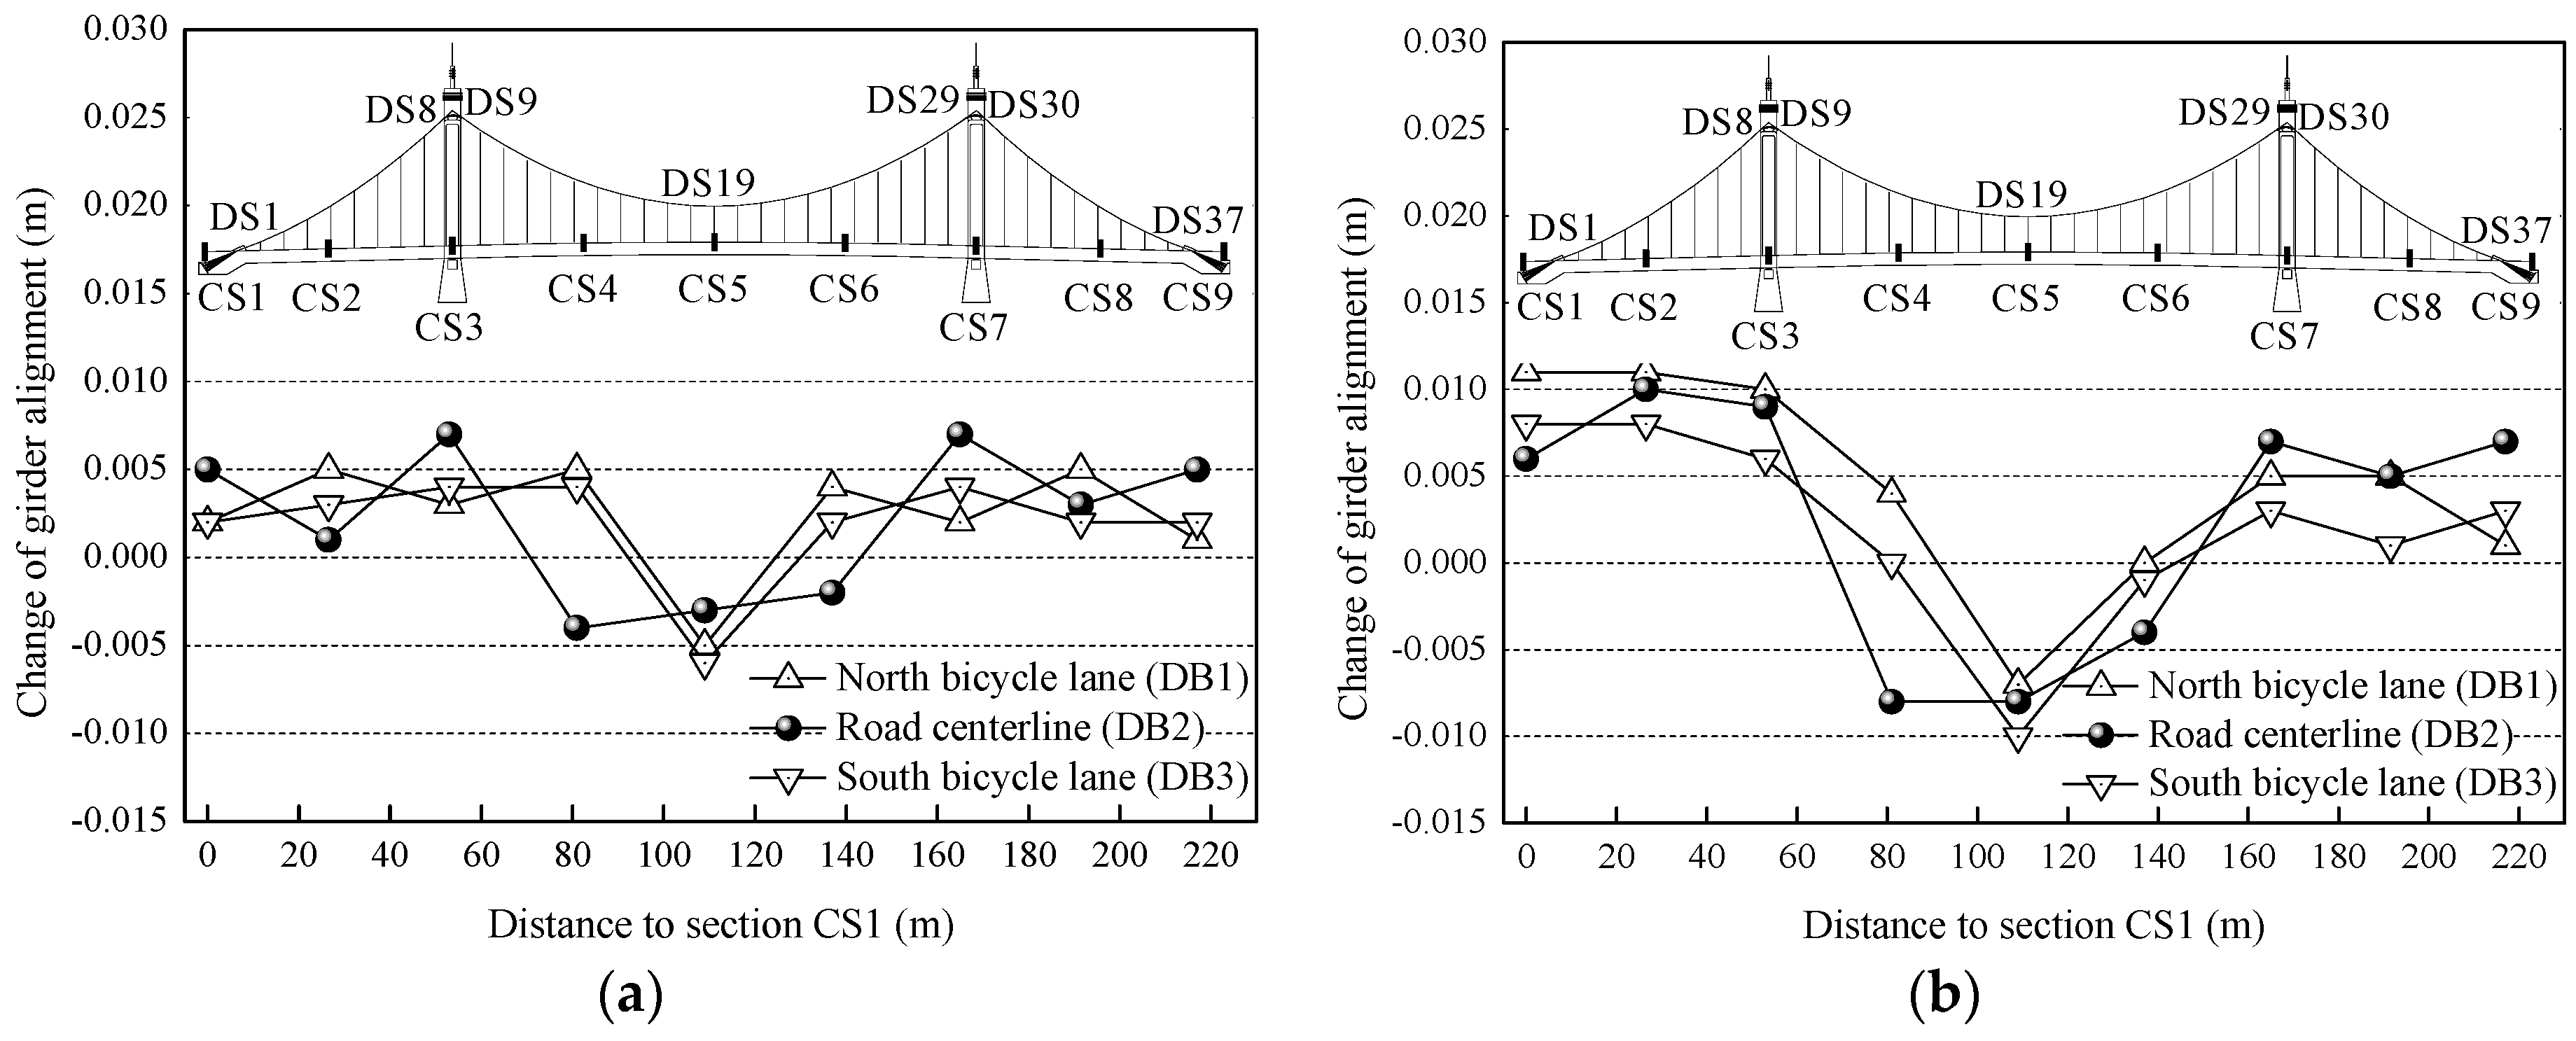
Figure 9.
Measured changes of longitudinal girder stresses: (a) Section C2 of west side-span; (b) Section C12 of east side-span; (c) Section C5 of mid-span; and (d) Section C7 of mid-span.
Figure 9.
Measured changes of longitudinal girder stresses: (a) Section C2 of west side-span; (b) Section C12 of east side-span; (c) Section C5 of mid-span; and (d) Section C7 of mid-span.
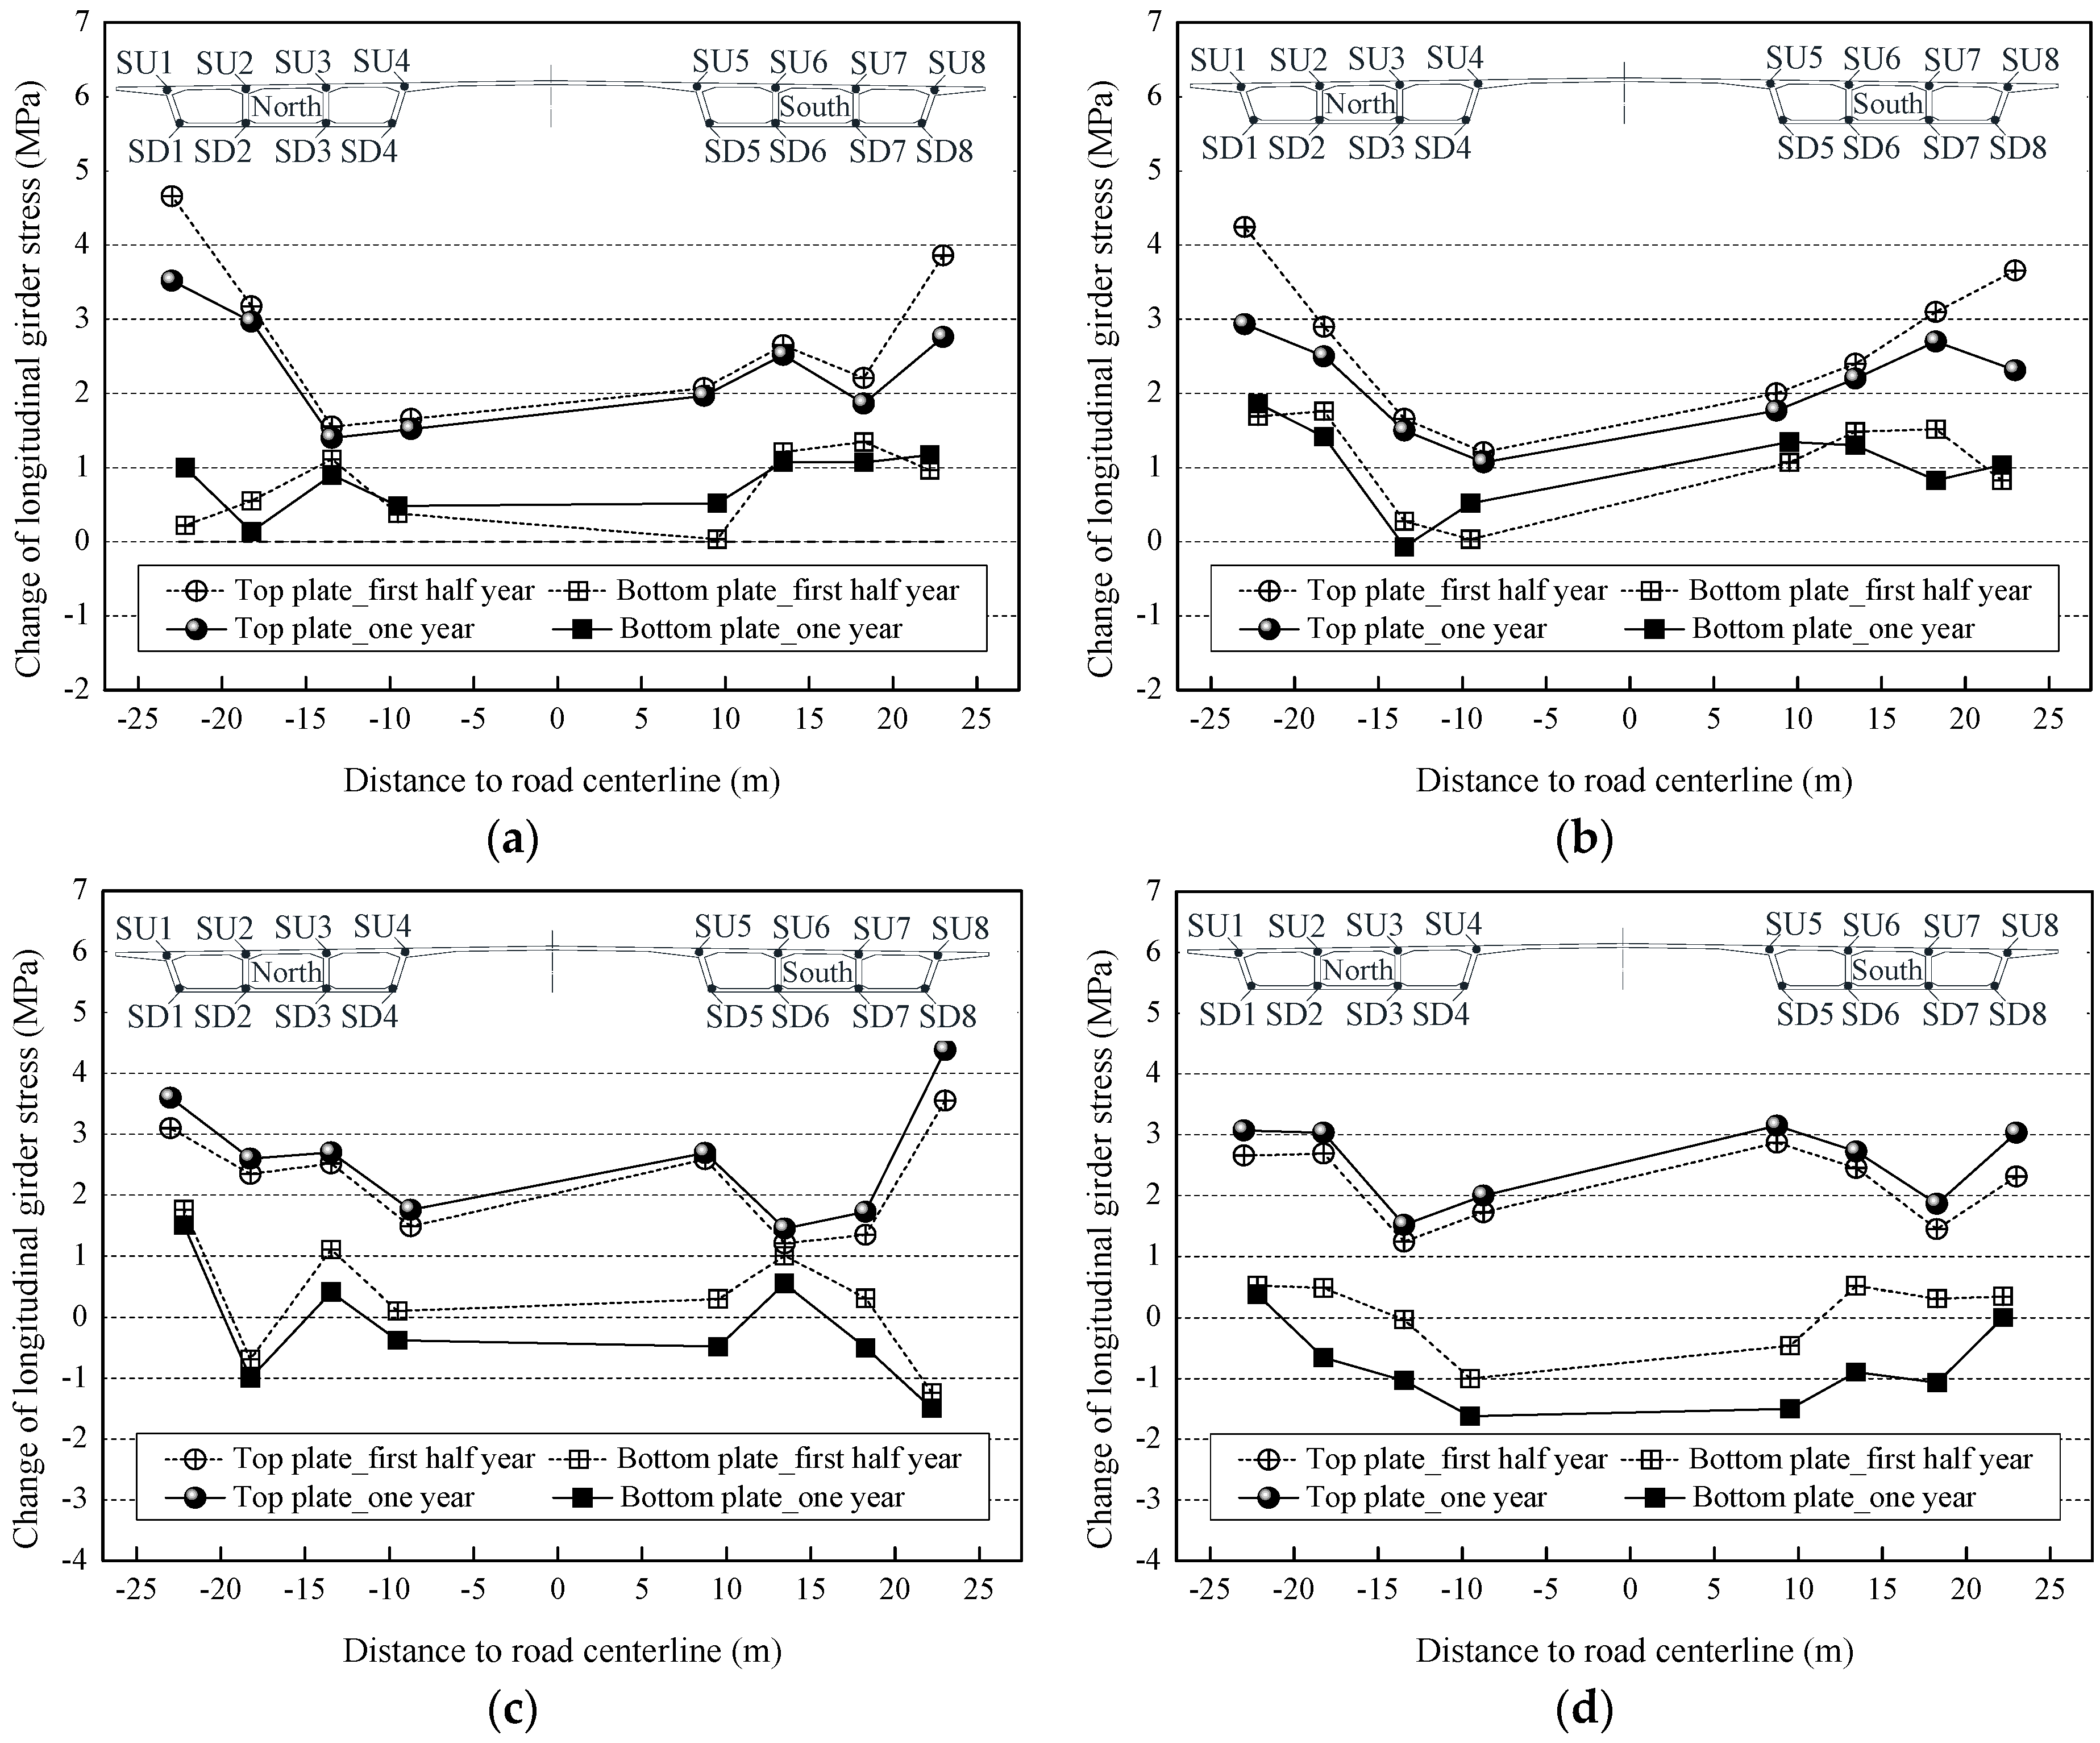
Figure 10.
Measured changes of structural alignments and girder stresses caused by diurnal temperature difference from 20 °C to 35 °C: (a) Cable alignment; (b) Girder alignment; and (c) Girder stress.
Figure 10.
Measured changes of structural alignments and girder stresses caused by diurnal temperature difference from 20 °C to 35 °C: (a) Cable alignment; (b) Girder alignment; and (c) Girder stress.
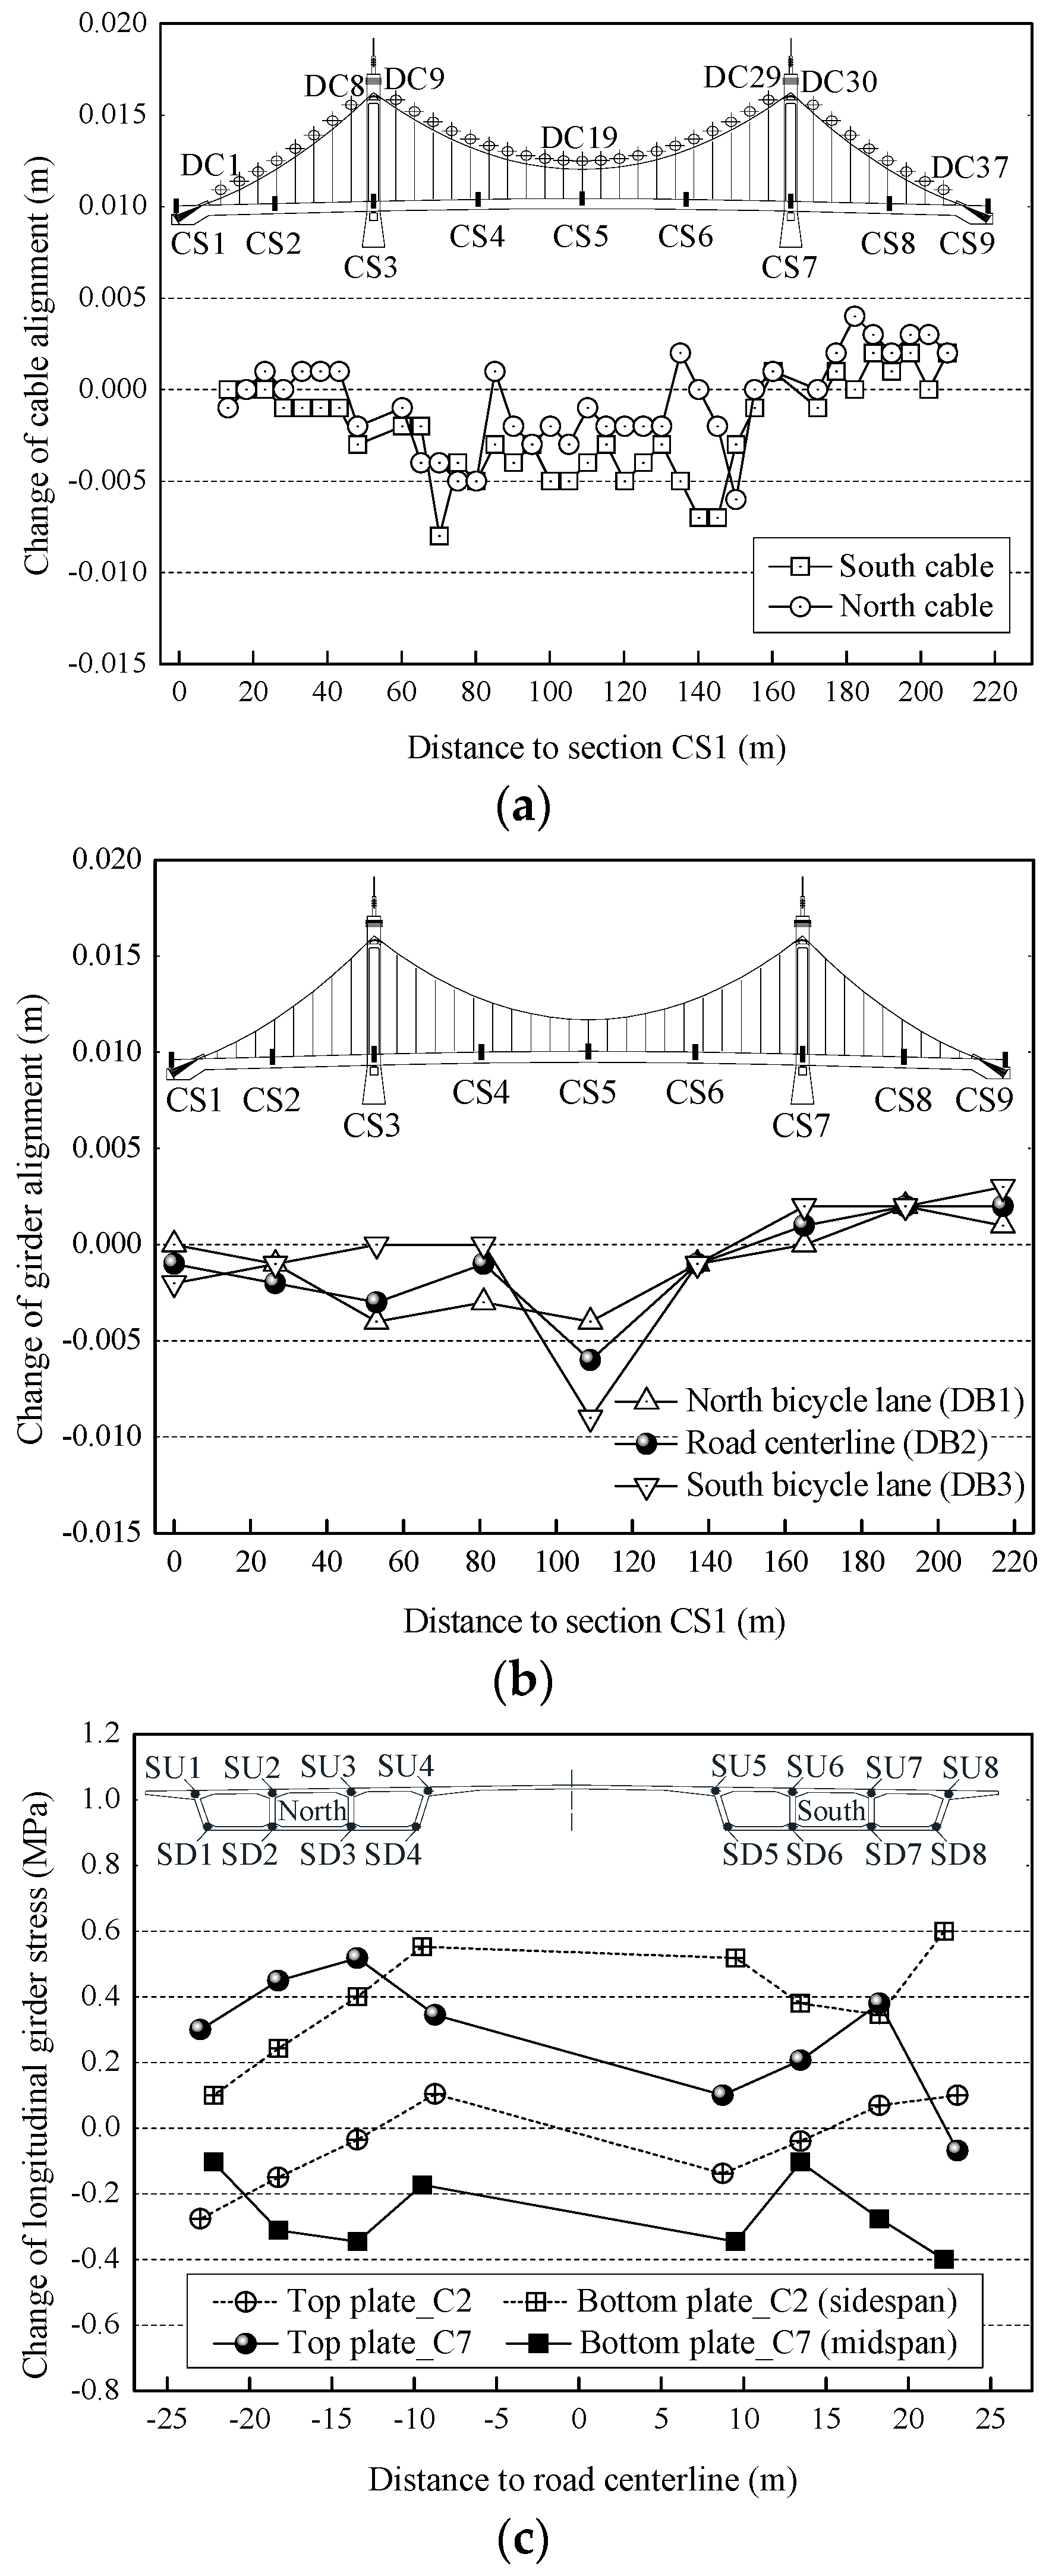
Figure 11.
Measured changes of structural alignments and girder stresses caused by seasonal ambient warming from 2 °C to 28 °C: (a) Cable alignment; (b) Girder alignment; and (c) Girder stress.
Figure 11.
Measured changes of structural alignments and girder stresses caused by seasonal ambient warming from 2 °C to 28 °C: (a) Cable alignment; (b) Girder alignment; and (c) Girder stress.
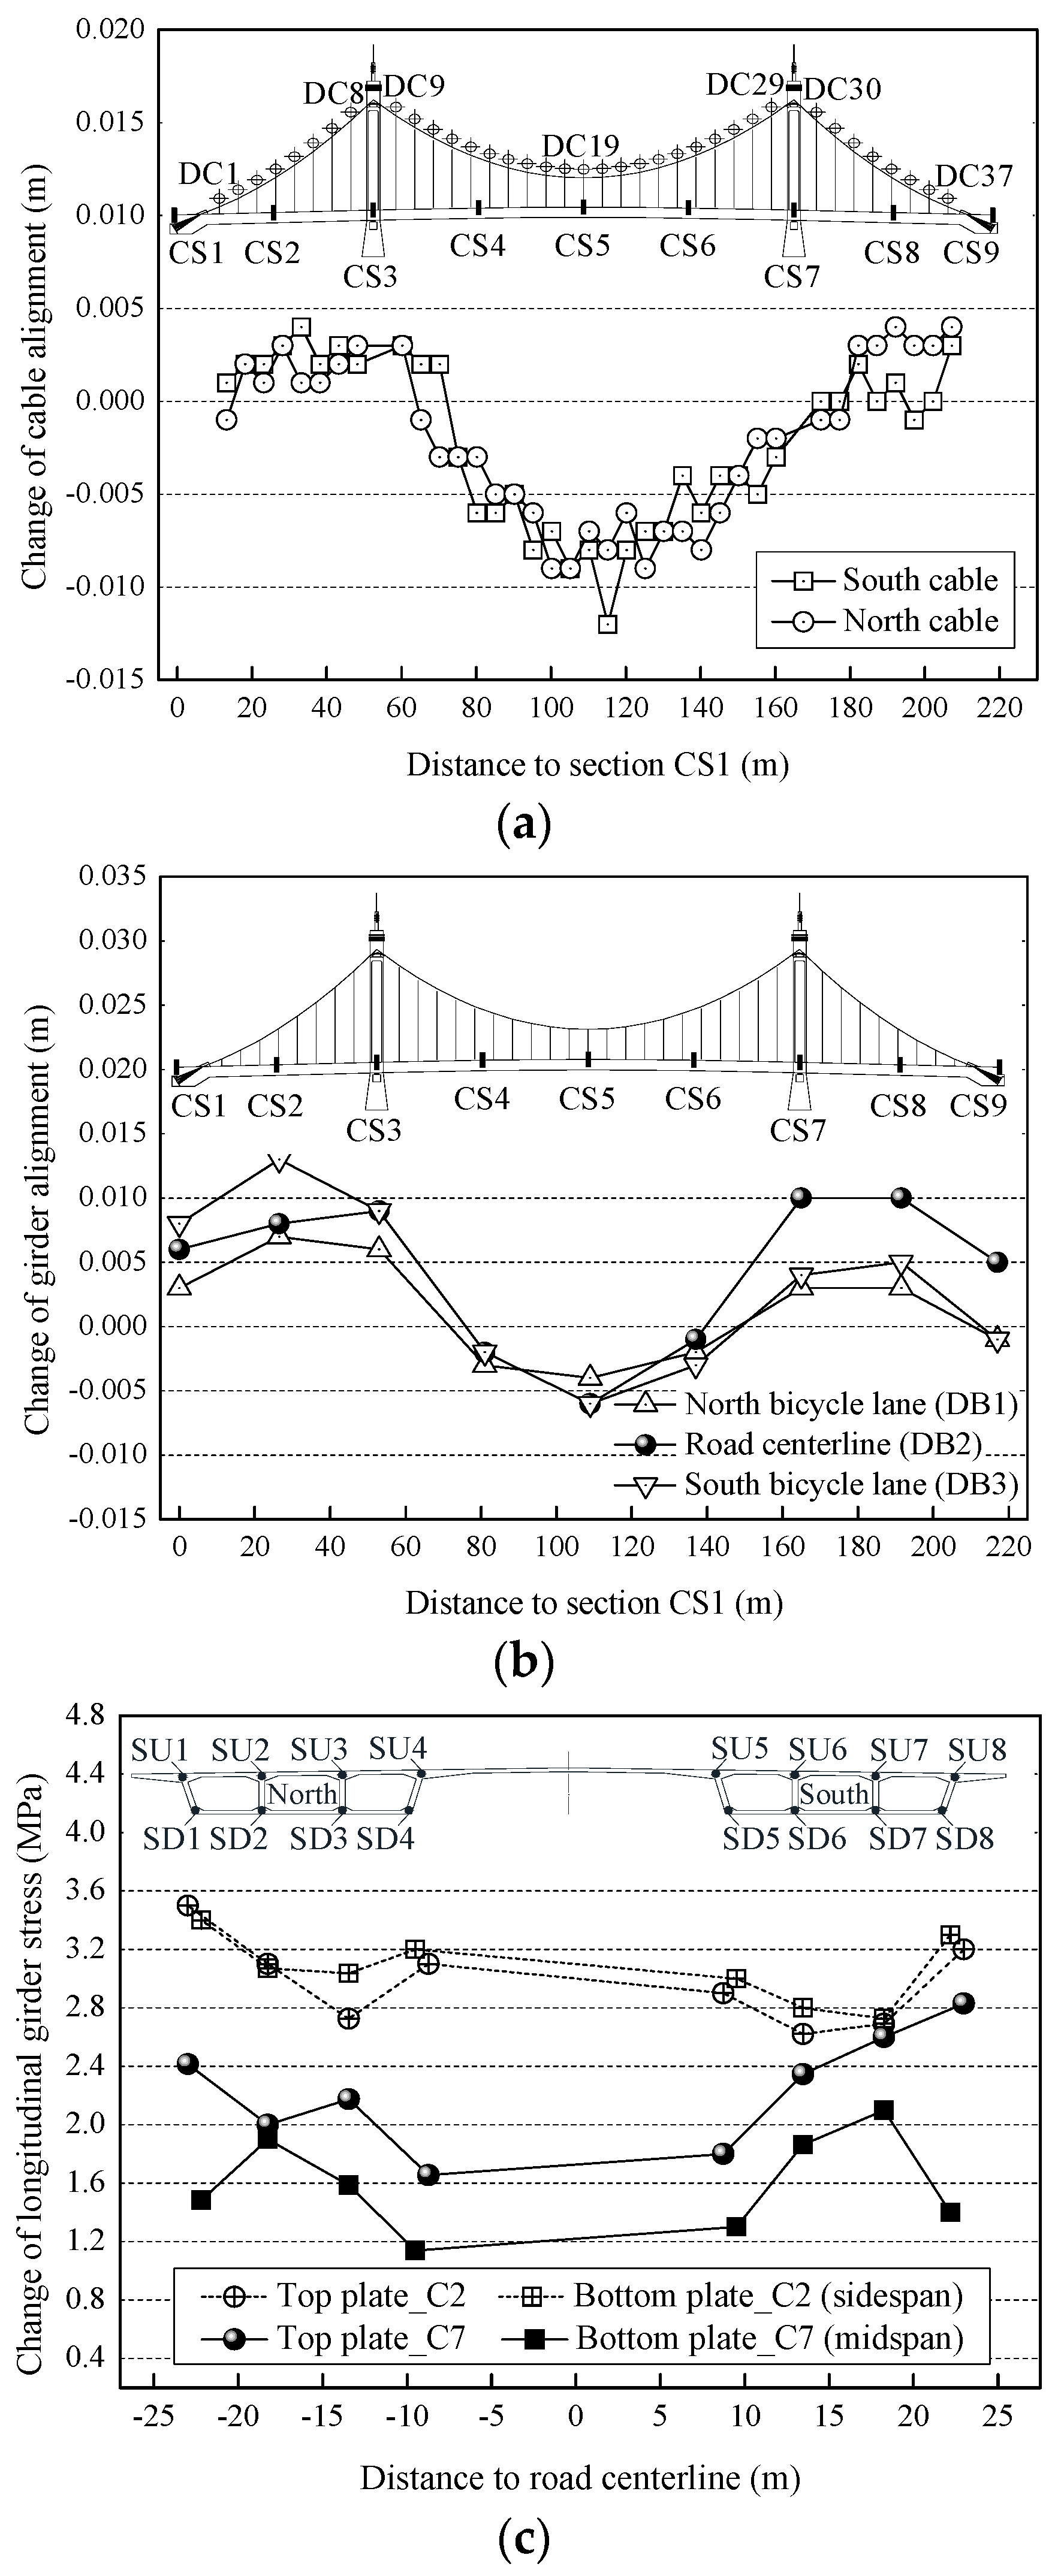
Figure 12.
Measured changes of structural alignments and girder stresses caused by dual time-dependent effects (warming): (a) Cable alignment; (b) Girder alignment; and (c) Girder stress.
Figure 12.
Measured changes of structural alignments and girder stresses caused by dual time-dependent effects (warming): (a) Cable alignment; (b) Girder alignment; and (c) Girder stress.

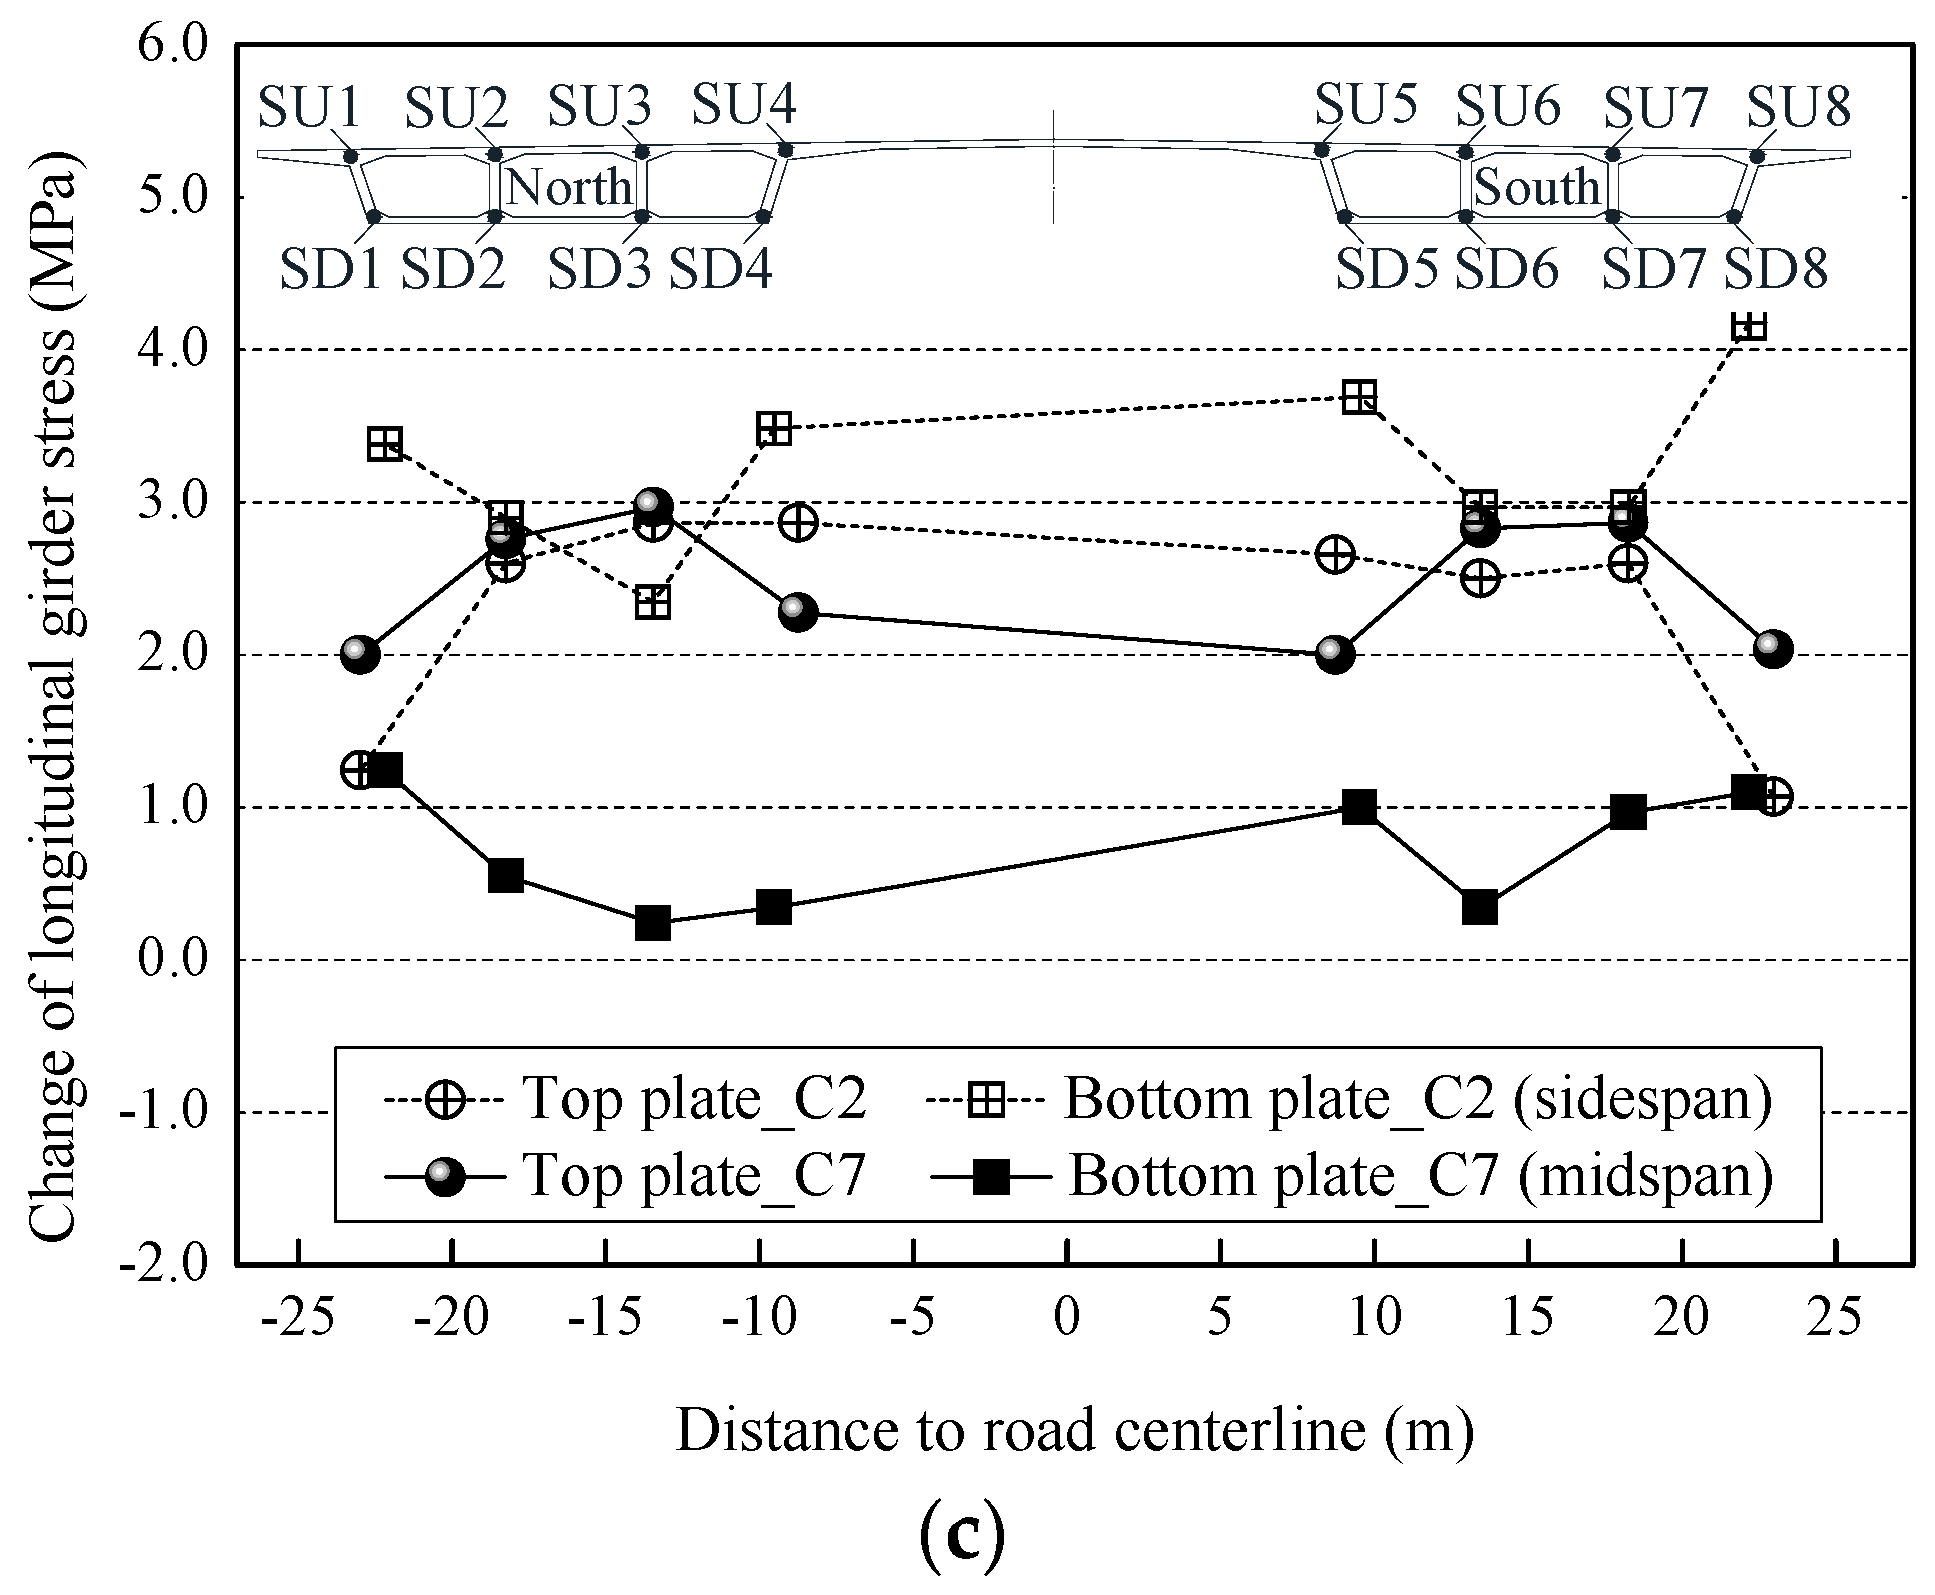
Figure 13.
Predicted long-time displacements of cable.

Figure 14.
Predicted long-time changes of girder alignments.
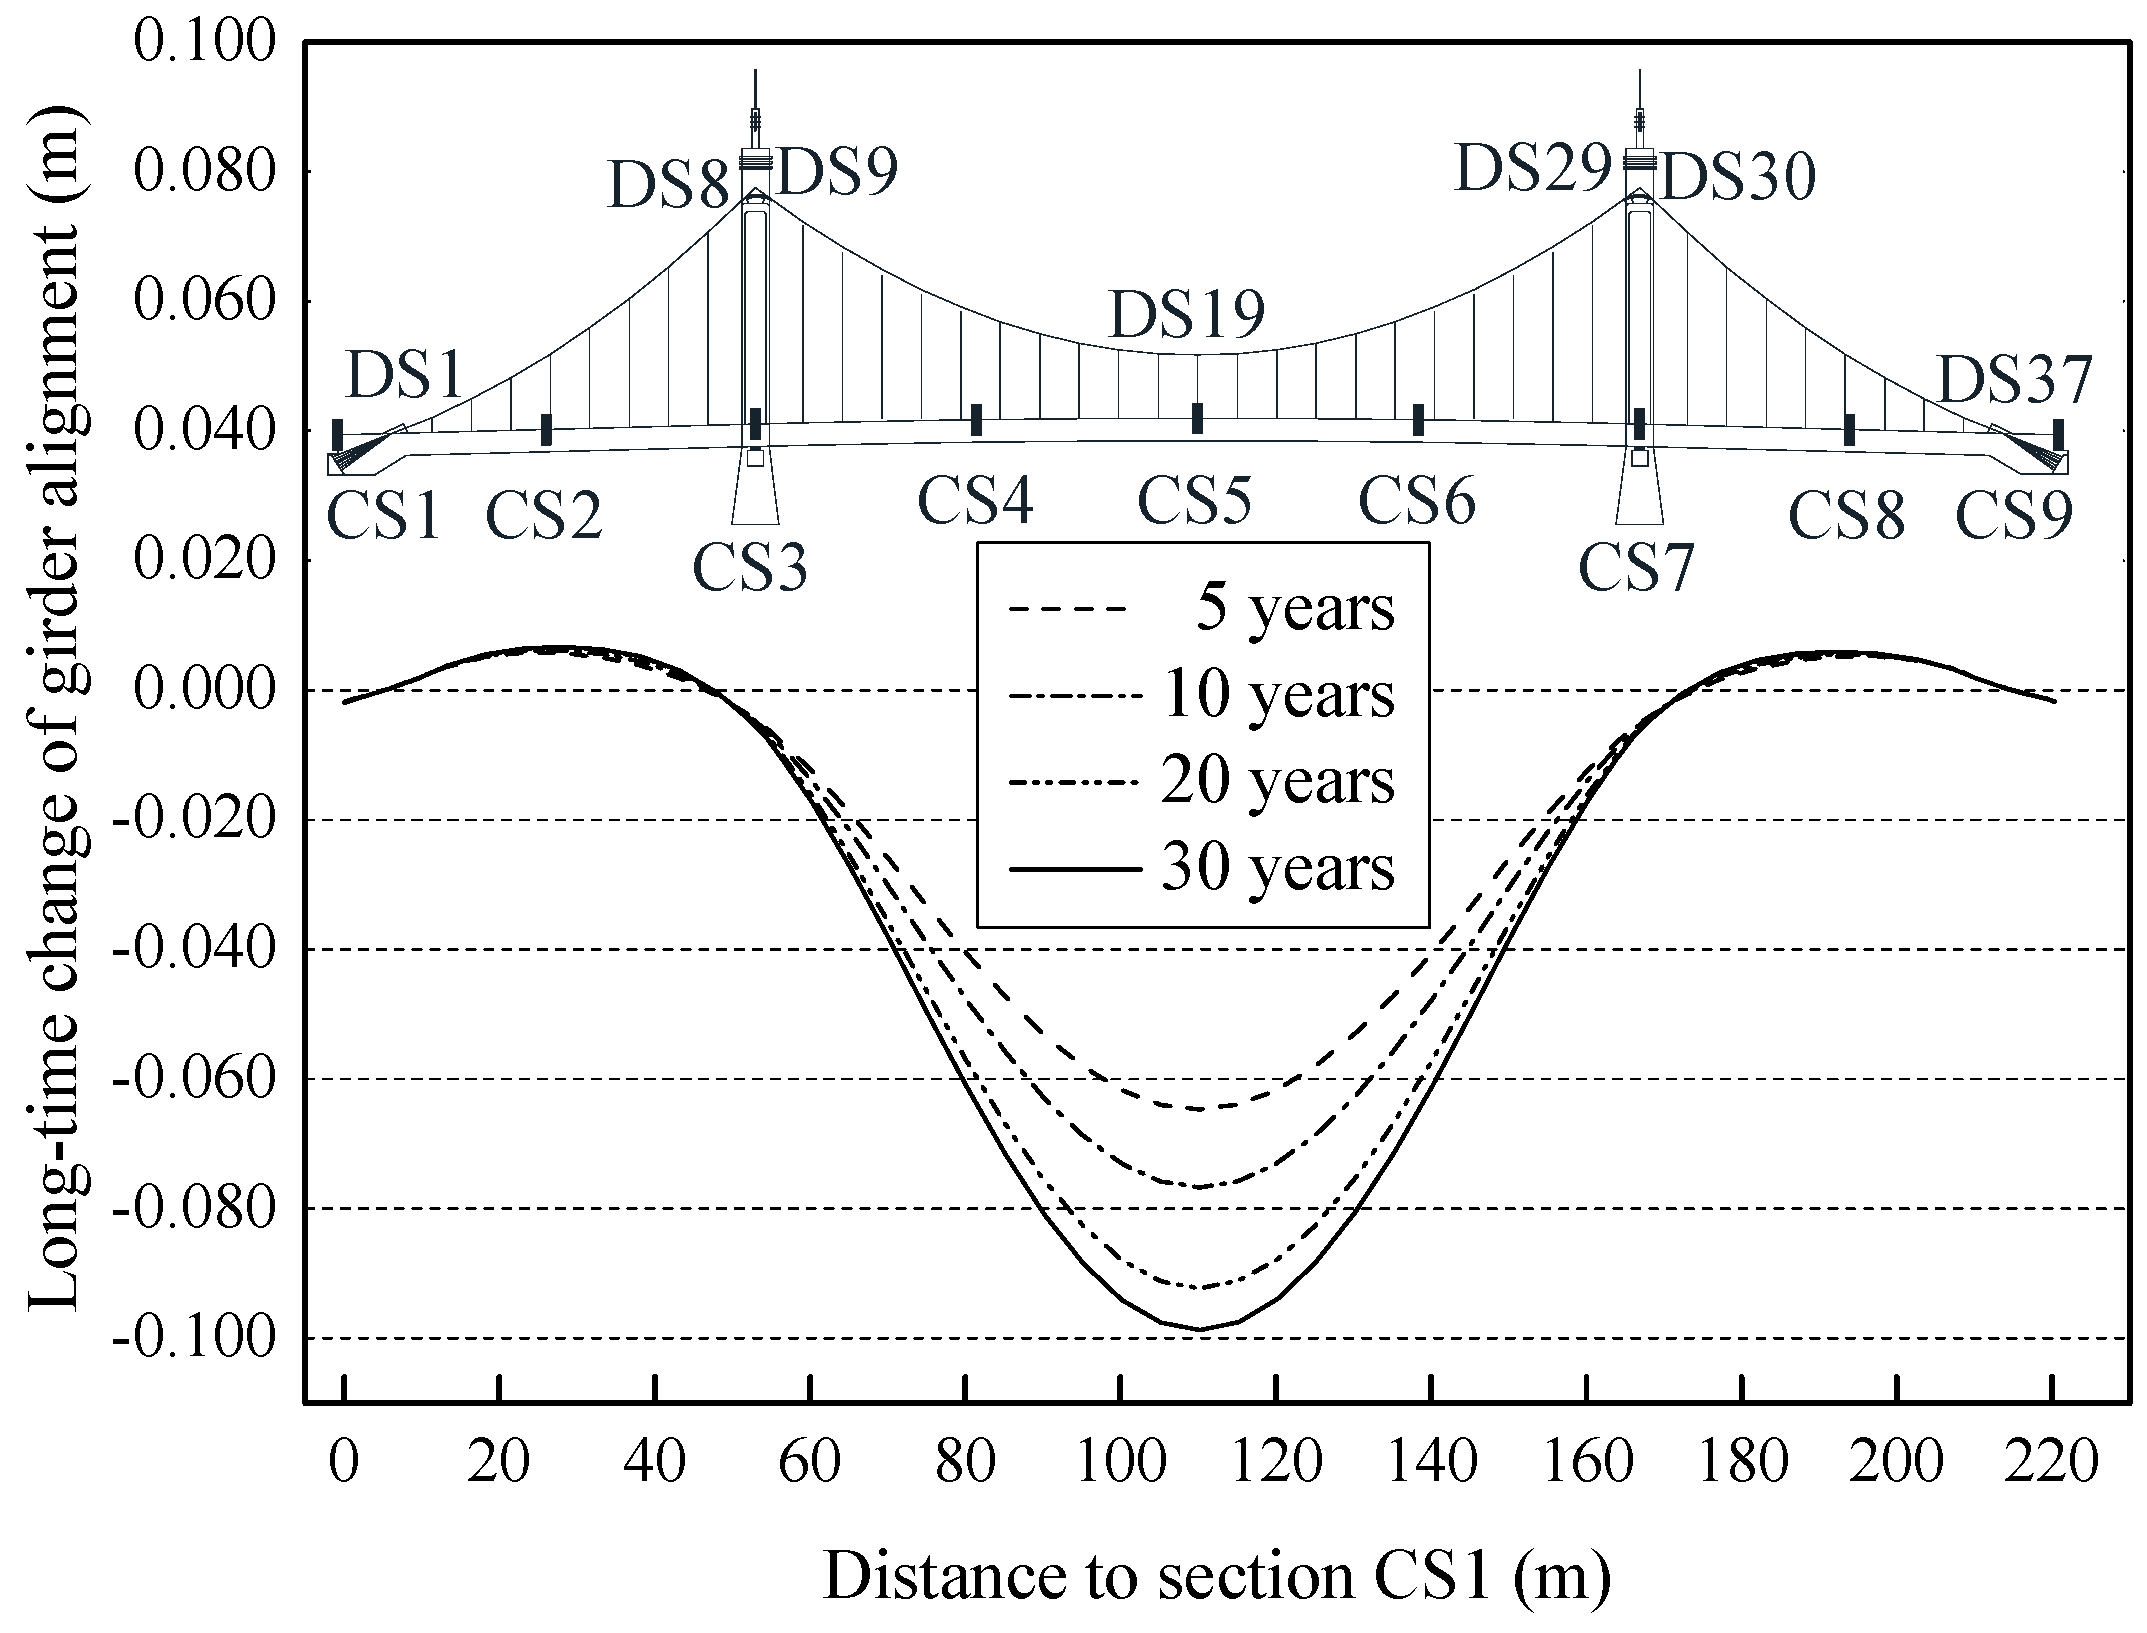
Figure 15.
Predicted change percentages of hanger forces.
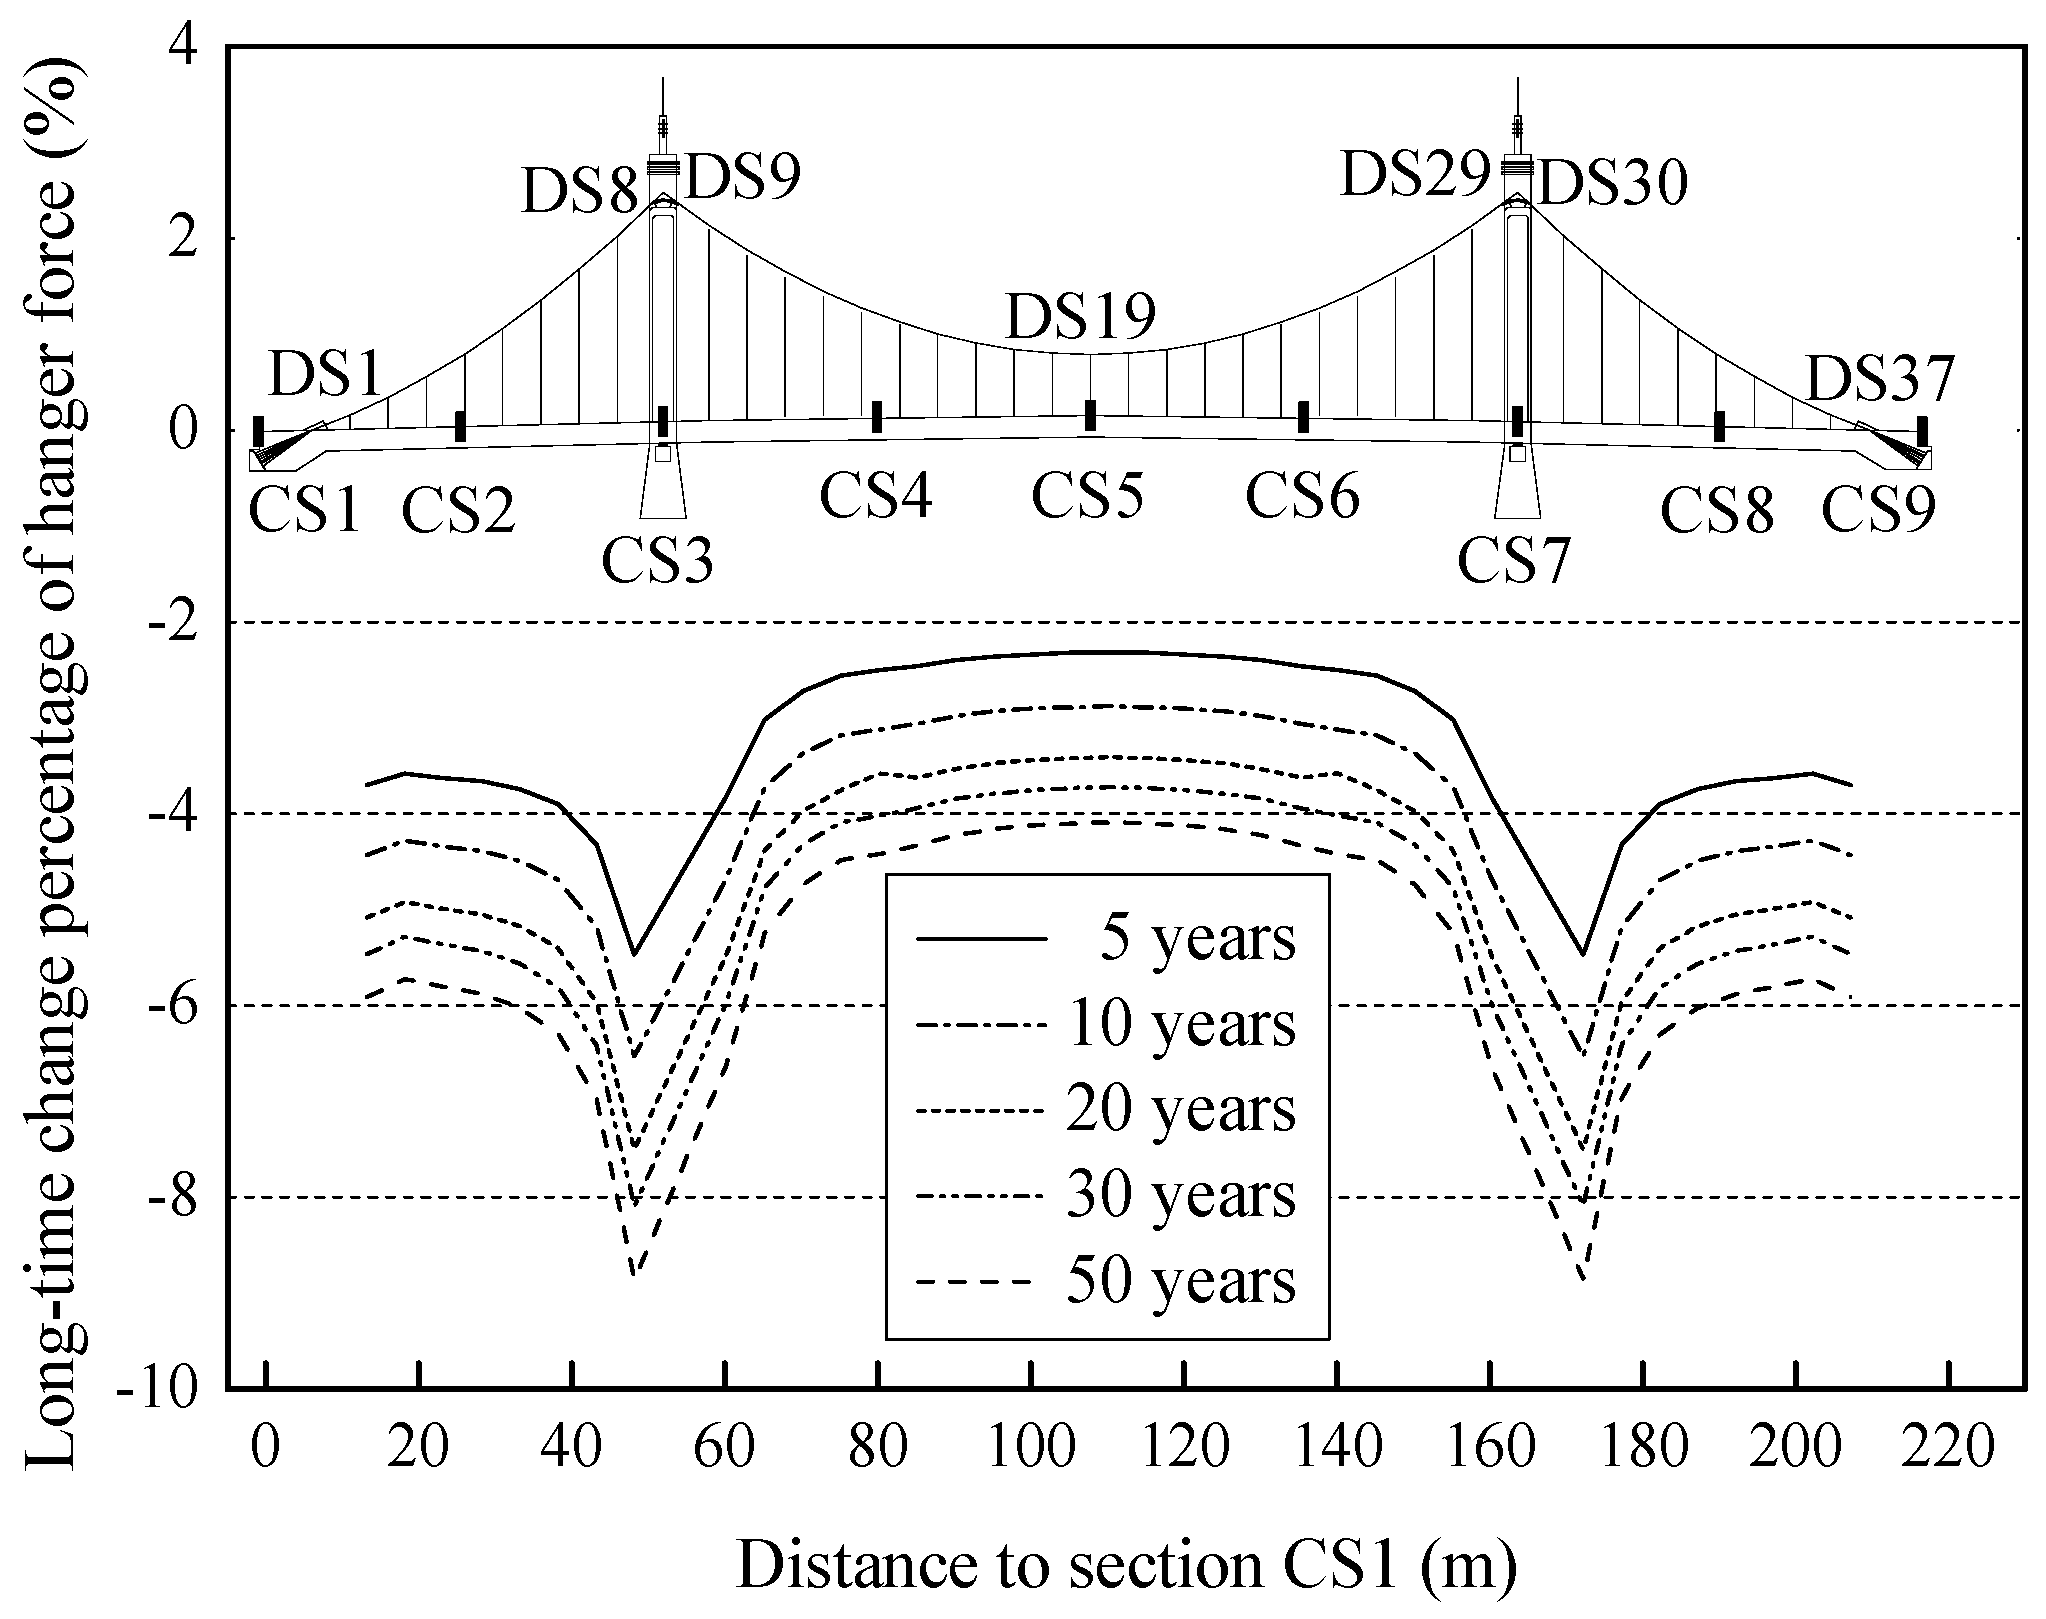
Figure 16.
Predicted changes of hanger and cable forces at DS19.


Table 1.
Verification of the finite element model.
| Natural Frequencies/Hz | Deflections of Girder/cm | Longitudinal Stress of CS5/MPa | |||||||||
|---|---|---|---|---|---|---|---|---|---|---|---|
| Upper Plate | Bottom Plate | ||||||||||
| Mode Shapes | Simulation | Measurement | Sections | Simulation | Measurement | Test Points | Simulation | Measurement | Test Points | Simulation | Measurement |
| V1 | 0.757 | 0.756 | CS2 | −1.02 | −0.9 | SU1 | −5.41 | −4.11 | SD1 | −5.78 | −6.14 |
| V2 | 1.274 | 1.318 | CS4 | 0.93 | 0.9 | SU2 | −5.37 | −4.01 | SD2 | −5.81 | −4.28 |
| V3 | 1.464 | 1.465 | CS5 | 1.32 | 1.2 | SU3 | −5.32 | −5.38 | SD3 | −5.87 | −4.90 |
| T1 | 1.256 | 1.245 | CS6 | 0.95 | 1.0 | SU4 | −5.27 | −4.72 | SD4 | −5.92 | −5.87 |
| T2 | 1.421 | 1.392 | CS8 | −1.05 | −0.8 | ||||||
| T3 | 1.474 | 1.489 | |||||||||
Notes: ‘V’—Vertical bending mode shape; ‘T’—Torsional mode shape. ‘+’—Tensile stress/Upward displacement; ‘−’—Compressive stress/Downward displacement.
Table 2.
Measured tower deformation (cm).
| Tower Position | First Half Year Period | One-Year Period | Construction Period | ||||||
|---|---|---|---|---|---|---|---|---|---|
| Transverse Direction | Longitudinal Direction | Vertical Direction | Transverse Direction | Longitudinal Direction | Vertical Direction | Transverse Direction | Longitudinal Direction | Vertical Direction | |
| Southwest | −0.5 | 0.4 | 0 | 0.3 | 0.4 | −0.6 | 2.7 | −0.1 | −1.0 |
| Northwest | −1.0 | 0.2 | 0 | −0.6 | 0.4 | −0.6 | −0.7 | 0 | −0.7 |
| Southeast | 0.4 | −0.1 | 0 | 0.7 | −0.3 | −0.1 | 2.1 | −0.2 | −1.6 |
| Northeast | 0.1 | −0.1 | 0 | −0.1 | −0.9 | −0.2 | −1.3 | 0.4 | −1.2 |
Note: ‘+’—Northward, eastward and upward displacement; ‘−’—Southward, westward and downward displacement.
Table 3.
Calculated and measured girder vibration frequency (Hz).
| Order | Calculated Initial Values | Measured Values | |
|---|---|---|---|
| 15 April 2015 | 15 April 2016 | ||
| 1 | 0.757 | 0.756 | 0.756 |
| 2 | 1.256 | 1.245 | 1.241 |
| 3 | 1.274 | 1.318 | 1.312 |
| 4 | 1.421 | 1.392 | 1.397 |
| 5 | 1.457 | 1.447 | 1.447 |
| 6 | 1.464 | 1.465 | 1.463 |
| 7 | 1.474 | 1.489 | 1.481 |
| 8 | 1.611 | 1.611 | 1.600 |
| 9 | 1.649 | 1.660 | 1.658 |
| 10 | 1.698 | 1.685 | 1.685 |
Table 4.
Measured cable force and change percentage.
| Location of Anchoring Span | Measured Cable Force (kN) | Change Percentage (%) | |||
|---|---|---|---|---|---|
| 15 April 2015 | 15 October 2015 | 15 April 2016 | First Half Year Period | One-Year Period | |
| SC1-S (Southwest) | 53,758 | 53,545 | 53,612 | −0.40 | −0.27 |
| SC1-N(Northwest) | 51,763 | 51,328 | 51,312 | −0.84 | −0.87 |
| SC2-S (Southeast) | 50,868 | 50,848 | 50,782 | −0.04 | −0.17 |
| SC2-N (Northeast) | 49,870 | 49,812 | 49,469 | −0.12 | −0.80 |
Table 5.
Measured tower root stress and variation amount.
| Tower Location | Sensor Location | Measured Tower Stress (MPa) | Variation Amount (MPa) | |||
|---|---|---|---|---|---|---|
| 15 April 2015 | 15 October 2015 | 15 April 2016 | First Half Year Period | One-Year Period | ||
| ST1-S Southwest | Northeast | −13.520 | −13.100 | −14.200 | −0.420 | 0.680 |
| Southeast | −11.635 | −12.760 | −11.760 | 1.125 | 0.125 | |
| Central south | −5.398 | −5.810 | −4.810 | 0.412 | −0.588 | |
| Southwest | −11.213 | −11.680 | −10.680 | 0.467 | −0.533 | |
| Northwest | −11.982 | −11.380 | −12.380 | −0.602 | 0.398 | |
| Central north | −9.295 | −9.670 | −10.270 | 0.375 | 0.975 | |
| ST1-N Northwest | Northeast | −9.632 | −9.740 | −10.140 | 0.108 | 0.508 |
| Southeast | −10.433 | −11.785 | −10.385 | 1.352 | −0.048 | |
| Central south | −10.010 | −10.936 | −9.336 | 0.926 | −0.674 | |
| Southwest | −9.815 | −10.730 | −9.030 | 0.915 | −0.785 | |
| Northwest | −8.353 | −8.006 | −8.606 | −0.347 | 0.253 | |
| Central north | −7.863 | −7.333 | −8.030 | −0.530 | 0.167 | |
Table 6.
Parametric study on the influence of final girder geometry in the girder state evolution.
| Increasing Percentage of Hanger Force | Bridge Completion State After Equilibrium Analysis | Girder State After 50 Years | ||||
|---|---|---|---|---|---|---|
| Girder Lifting Amount (m) | Girder Longitudinal Stress (MPa) | Girder Deflection (m) | Girder Longitudinal Stress (MPa) | |||
| Top Plate | Bottom Plate | Top Plate | Bottom Plate | |||
| 0% | 0.013 | −5.410 | −5.780 | −0.087 | −6.618 | −2.171 |
| 1% | 0.015 | −5.322 | −6.183 | −0.087 | −6.532 | −2.569 |
| 2% | 0.017 | −5.233 | −6.586 | −0.088 | −6.446 | −2.966 |
| 3% | 0.019 | −5.145 | −6.989 | −0.088 | −6.359 | −3.364 |
| 4% | 0.021 | −5.056 | −7.391 | −0.089 | −6.273 | −3.762 |
| 5% | 0.023 | −4.968 | −7.794 | −0.089 | −6.187 | −4.160 |
© 2018 by the authors. Licensee MDPI, Basel, Switzerland. This article is an open access article distributed under the terms and conditions of the Creative Commons Attribution (CC BY) license (http://creativecommons.org/licenses/by/4.0/).
Share and Cite
MDPI and ACS Style
Zhou, G.; Li, A.; Li, J.; Duan, M. Structural Health Monitoring and Time-Dependent Effects Analysis of Self-Anchored Suspension Bridge with Extra-Wide Concrete Girder. Appl. Sci. 2018, 8, 115. https://doi.org/10.3390/app8010115
AMA Style
Zhou G, Li A, Li J, Duan M. Structural Health Monitoring and Time-Dependent Effects Analysis of Self-Anchored Suspension Bridge with Extra-Wide Concrete Girder. Applied Sciences. 2018; 8(1):115. https://doi.org/10.3390/app8010115
Chicago/Turabian StyleZhou, Guangpan, Aiqun Li, Jianhui Li, and Maojun Duan. 2018. "Structural Health Monitoring and Time-Dependent Effects Analysis of Self-Anchored Suspension Bridge with Extra-Wide Concrete Girder" Applied Sciences 8, no. 1: 115. https://doi.org/10.3390/app8010115
Note that from the first issue of 2016, this journal uses article numbers instead of page numbers. See further details here.