Analysis of the Energy Efficiency of a Pneumatic Booster Regulator with Energy Recovery


1
School of Mechanical and Electronic Engineering, Wuhan University of Technology, Wuhan 430070, China
2
Future Interdisciplinary Research of Science and Technology, Tokyo Institute of Technology, Yokohama 226-8503, Japan
*
Authors to whom correspondence should be addressed.
Appl. Sci. 2017, 7(8), 816; https://doi.org/10.3390/app7080816
Submission received: 27 June 2017
/
Revised: 27 July 2017
/
Accepted: 7 August 2017
/
Published: 9 August 2017
(This article belongs to the Special Issue Power Transmission and Control in Power and Vehicle Machineries)
Abstract
:Pneumatic booster regulators (PBR) are in great demand in modern pneumatic systems for their energy-saving abilities. A new booster regulator with energy recovery (VBA-R) was proposed, and its energy efficiency was investigated by introducing the concept of air power. On the basis of quality-alterable gas thermodynamics, an energy efficiency assessment and pressure response model for VBA-R was proposed. First, a model was solved using MATLAB/Simulink software, and an alternative experiment was designed to verify the mathematical model and performance improvement. The results showed that the simulation was consistent with the experiment. We also can conclude that, first of all, the energy efficiency decreases with the increasing of supply pressure and flow-rate consumption; a VBA-R has the highest efficiency when its diameter ratio is closest to 1.3. Finally, a recovery chamber helped to improve the performance of the VBA-R, which included a boost ratio improvement of 15–25% and an efficiency improvement of 5–10% compared with a conventional VBA booster regulator. This research lays the foundation for optimism regarding the proposed booster regulator.
1. Introduction
With the increasing awareness of the need for environmental protection, low-carbon and energy-saving technologies have become the current theme of development. Pneumatic systems, which account for industrial energy consumption of 10 to 20 percent [1,2], are inevitably discussed as an energy-saving topic. Low energy efficiency is the main factor restricting the further development of pneumatic systems. A study shows that energy consumption can be reduced by about eight percent for each 0.1 MPa reduction in the supply pressure of the compressor [3]. Therefore, more and more Japanese factories are beginning to reduce their air supply pressure to save energy. For example, the supply pressure of the Toyota factory was gradually decreased from 0.6 to 0.3 MPa. However, in practical applications, local high-pressure air is in demand due to the existence of heavy load or high-pressure equipment. Pneumatic booster regulator systems are widely used in factories as a main solution for satisfying local high-pressure requirements. At present, almost all commercial pneumatic booster regulators (PBR) have a structure in which compressed air exhausts directly to the atmosphere. It is obvious that energy is wasted, but it is hard to evaluate the real energy efficiency for lack of an appropriate method. Therefore, a way to evaluate the efficiency of PBR systems and improve their performance has become one of the problems of enterprise that should be solved urgently.
A PBR is also known as a pressure amplifier; it is driven by low-pressure air, and its output pressure is high. Pneumatic booster regulators can be categorised as either symmetric or asymmetric, with respect to their structure [4,5,6]. The maximum boost ratio of the symmetric type is two-fold, according to Pascal’s law, whereas the boost ratio of the asymmetric type can be up to three or four times, because the diameter ratio of the drive and boost chambers can be changed for different demands. However, it sacrifices the air flow rate, and more compressed air is exhausted to the atmosphere with each stroke. To improve the energy efficiency, Shi [7,8,9] proposes an expansion energy booster in which the air supply is cut off before the piston moves to the end of its stroke, and then the residual stroke is driven by air expansion. Similarly, many other means are also used to improve the energy efficiency in the driven cylinder, such as a differential drive [10], dual pressure supply, utilising expansion energy [11], recovering energy with a rubber bladder and storing the strain energy [12], or reusing exhaust air for power generation [13]. However, all of these make the circuit more complex, and when the recovery energy was directly input to the drive chamber of the cylinder, it led to velocity fluctuations, which are harmful to the life of the cylinder [14]. On the other hand, there is an urgent need to assess the energy efficiency of a PBR in order to evaluate the performance of a booster regulator. In recent decades, the consumption of air [dm3/min(ANR)] or specific energy [kW·h/m3(ANR)] have been commonly used to assess the energy of compressible air [15]. However, the consumption of air is a volume unit, so it does not reflect energy consumption. The specific energy is the ratio of the energy output of the air compressor to the flow-rate consumed by the component. This assessment method cannot reflect the energy consumption of the components independently because it considers the power consumed by the air compressor, and it is hard to analyse the losses of the intermediate links. In addition, both of these two methods do not reflect the effect of pressure. Other methods used for the energy assessment of compressed air include enthalpy and exergy [16]. However, enthalpy is dependent on mass and temperature and cannot reflect the effects of pressure, whereas exergy reflects the system’s ability to conduct work from a different energy form. To describe the ability of compressed air to do work, a new concept of air power, similar to exergy but simpler, was proposed by Cai and Kagawa [17]. In their concept, the energy of air is related to the flow-rate, pressure and temperature. We will introduce this as a method for evaluating the energy efficiency of a booster regulator later in this paper.
The above analysis shows that there are some problems with pneumatic booster regulators, such as the exhaustion of pressurised air directly to the atmosphere, which leads to energy waste; thus, the factories are eager to propose a new method to enhance the efficiency. However, an effective way to evaluate the energy efficiency of a PBR is lacking. To overcome these problems, a new booster regulator with energy recovery was proposed in which the air tank was considered, the energy efficiency and dynamic models were established, and the regularity of change in energy efficiency was found, which provides a good reference for the design and operation of a booster regulator.
2. Working Principle of the Booster Regulator
Based on Pascal’s law, low pressure can be transferred to high pressure for the area of difference. A typical commercial booster regulator (VBA series, SMC, Tokyo, Japan) is shown in Figure 1. It is composed of two drive chambers, two boost chambers and a movable piston. As shown in Figure 1, the piston moves from left to right. The pressurised air flows into drive chamber A and boost chamber B, and the air in drive chamber B discharges directly to the atmosphere. The force on the left side of the piston can be twice as great as that on the right side, so the pressure in boost chamber A can become twice as high as the supply pressure. When the piston moves to the end of its stroke, the switching valve changes its position, which causes the piston to change direction. Thus, the booster regulator can continuously exhaust high-pressure air.
However, the compressed air in the drive chamber is exhausted directly to the atmosphere with each stroke, so considerable energy is wasted over a long run-time. In order to reuse this energy to enhance the energy efficiency, and with reference to the expansion energy used (EEU) booster proposed in the reference [7,8,9], a new booster regulator was proposed, as shown in Figure 2 (it is called the VBA-R, corresponding to the old type of VBA). The drive and boost chambers are the same as a traditional booster regulator. However, two more chambers (called recovery chambers) were added to the middle to recover the exhausted energy, and a seven-way two-position (7/2) solenoid valve was introduced to control the air flow. There are also other elements, such as check valves, regulators and magnetic rings, and so on.
When the piston is located at the left end, the magnetic signal was detected and the position of the 7/2 solenoid valve was set as shown in Figure 2. The compressed air flows into drive chamber A and boost chamber B. The piston then moves from left to right, and the air in boost chamber A is further compressed so that the pressure becomes higher than the supply pressure. The compressed air in drive chamber B, instead of exhausting to the atmosphere, flows into recovery chamber A through the 7/2 solenoid valve, and the recovered air is reused to move the piston. It also helps to increase the area of difference so that the boost ratio can be further enhanced. After the piston moves to the right end, an impulse signal is detected once again, and the 7/2 solenoid valve changes its position so that the piston can move in a reciprocating manner and continuously discharge high-pressure air. When the booster regulator works with a different load, the boost ratio can be set by adjusting regulator 14 to output a different air pressure.
3. Energy Efficiency Evaluation Method for Booster Regulator with Energy Recovery (VBA-R)
The compressed air is recovered by recovery chambers, rather than being exhausted to the atmosphere, through the 7/2 solenoid valve; thus, it helps to raise the boost ratio. On the other hand, the energy is reused in order to improve the energy efficiency of the booster regulator. However, the evaluation methods of energy efficiency for PBRs should be proposed first, in order to assess the performance improvements. Here, we introduced the concept of air power to calculate the energy input or output of a booster regulator system.
3.1. Concept of Air Power
According to Cai and Kagawa [17], air power is defined as the work-producing potential of compressed air. In this definition, the atmosphere is set as the reference state. In the other words, the pneumatic system is supposed to work in the atmosphere. The advantage of air power is that it is independent of the air source and only depends on the current state of air. It is expressed as follows:
Equation (1) indicates that the air power depends on the pressure, flow rate and temperature. However, Cai [17] verified that, when the range of change of air temperature is less than 50 K, the change rate of air power is less than 3%. In modern pneumatic systems, an air dryer and air cooler are essential equipment, so the temperature is almost the same as the atmosphere, meaning the effects of temperature can be neglected. Thus, Equation (1) can be simplified as follows:
Then, the air power depends only on the pressure and flow rate and is zero when the pressure is the same as the atmosphere. Air power is different from hydraulic power due to the fact that air can be compressed. Therefore, in addition to transmission energy, it also includes expansion energy. However, we will not distinguish between these two kinds of air power because both of them are input to the booster regulator system.
3.2. Energy Efficiency of Booster Regulator
In practical applications, a tank is always used with a booster regulator to decrease pressure fluctuations. Therefore, the real output is the pressure in the tank, which is lower than the pressure in the chamber of the booster regulator (this will be proved later). To assess the energy efficiency of a booster regulator, considering the application and the definition of efficiency, the energy efficiency of a booster regulator is defined as the ratio of the energy output (air flow out of the tank) to the energy input (air flow in the boost and drive chambers). It is defined as:
Combining the air power proposed in Equation (2), the energy flow in the booster regulator in each cycle is:
It is obvious that the energy input depends only on the supply pressure, because the volume of each chamber is constant. When the supply pressure increases, more energy is consumed by the pneumatic booster regulator system.
Energy output, like the energy input, is the integral of air power flowing out the tank in each cycle, and it can be written as:
Pressure fluctuations in the tank lead to simultaneous fluctuations of the flow rate, so it is hard to calculate the energy output directly. However, if the tank is large enough, we could suppose that the fluctuation is small and can be neglected. When the system is running steadily, the flows in and out of the chambers are equal to the volume of the boost chamber. Therefore, we substitute Equations (4) and (5) into Equation (3), and the energy efficiency of the booster regulator system can be obtained as:
where pt is the pressure in the tank and the ratio of pt to ps is defined as the boost ratio, which reflects the boost capability of the booster regulator. Therefore, Equation (6) intuitively indicates that the energy efficiency depends only on the supply pressure and boost ratio because the volume of each chamber is constant. The greater the boost ratio or the lower the supply pressure is, the higher the energy efficiency is. To understand the energy efficiency, it is necessary to identify the boost ratio of the system. Therefore, we will discuss the pressure response characteristics of the VBA-R.
3.3. Pressure Response of VBA-R
To facilitate the model, the assumptions are given first as follows:
- (1)
- Air is an ideal gas and it satisfies the ideal gas state equation;
- (2)
- The initial temperature of air in each chamber is the same as the atmosphere, and so is the air source;
- (3)
- The dead volume of each chamber is very small and can be set as the same;
- (4)
- The air tank can exchange heat sufficiently with the surroundings, and it can be considered as an isothermal tank.
3.3.1. Flow Rate Characteristics Equation
The air flows in and out of the chambers through the check valve or throttle valve, and all of the mass flow rate of air can be calculated based on the equations given in ISO6358 [18]. However, when we used these equations in the numerical simulation, it was unstable for an accurate simulation and we had to set the steps to be very small in order to avoid divergence. Because of this numerical inaccuracy, the pressure ratio may surpass 1 when it is close to 1, which then leads to a negative value under the radical sign. This might lead to unknown errors or uncertain results, which would stop the simulation. To avoid these problems, we introduced the laminar flow model proposed by Kaasa [19] for use when the pressure ratio is approximately 1. In that model, subsonic flow is taken as laminar flow when the pressure ratio is greater than β (β ranges 0.995 to 0.999). Then, a redefined flow rate characteristic equation can be given as:
where k1 is the linear gain:
3.3.2. Gas State Equation
The pressure, temperature and volume all change with the movement of the piston. However, these state quantities of air always satisfy the gas state equation according to assumption (1). By differentiating the state equation with time, the pressure response in the charge and discharge chambers can be obtained as:
3.3.3. Energy Conservation Equation
Air flows in or out of the chambers whenever the booster regulator is working, and we have assumed that there is no leakage in the system. Therefore, the system can be considered as a variable-mass system that satisfies the energy conservation equation. Then the temperature response [20] in the chambers can be obtained as shown in Equations (11) and (12).
3.3.4. Kinematic Equation of Piston
In the Figure 2, the pressure acts on the six surfaces of the piston. Therefore, the kinematic equation of the piston can be derived from Newton’s second law:
The friction force of the piston in the pneumatic cylinder is so complex that many models have been used to describe it, such as the Coulomb sliding model, Viscous model and Striberk model [21]. Of these, the Striberk model has the best accuracy, but there are so many parameters that it is hard to confirm them because the booster regulator is a closed system. Therefore, we adopted a mixed friction model based on the Coulomb and Viscous models. This model has a high accuracy and has been verified in the motion control of a cylinder [22]. The friction force is:
3.3.5. Pressure Response in Tank
A booster regulator is always used with a tank to restrain the pressure fluctuations. The flow rate output of a booster system depends on the pressure in the tank, which is also affected by the boost ratio of the booster regulator. Whenever the system is working, air flows out the tank to drive the load, but the tank is charged by the booster regulator at the same time. According to Equation (7), the output flow rate rises with increasing pressure in the tank, then the pressure in the tank decreases. Meanwhile, the output flow rate from the booster regulator dynamically decreases or increases with the changing pressure in the tank. Thus, the equilibrium pressure develops in the tank. This is a simple self-balance system, and if the air consumption grows with the downstream load, the pressure in the tank will dynamically adjust and will tend to balance after fluctuating for a period of time. The charge and discharge model of the tank is simplified, as shown in Figure 3. The inlet is a check valve; its opening depends on the pressure difference between the booster regulator and tank, and the flow rate changes dynamically as it opens. The outlet is a throttle valve, and we simulated different loads by adjusting its opening.
The tank was regarded as an isothermal chamber (ITC) because the wall area was large enough to exchange heat sufficiently with the atmosphere. Then, the gas state equation could be simplified, as the change of temperature could be neglected. Thus, the pressure response in the tank could be obtained as Equation (15) by differentiating the gas state equation:
where G’ is the net flow rate of the tank, which is affected by the booster regulator, tank and downstream load. Equation (15) also indicates that the pressure differential is proportional to the net flow rate for an ITC.
The check valve (AKH10-00, SMC, Tokyo, Japan) was used in the experiment, and the air flowing into the tank depended on its flow-rate characteristics. According to the supplier catalogue, the cracking pressure of the valve is 5 kPa, its sonic conductance is 4.8 × 10⁻⁸ (m3/(s Pa)), and its critical pressure ratio is 0.5. We assume that the check valve will fully open once the pressure reaches the cracking pressure. The flow rate characteristics changes with the pressure difference and can then be expressed as:
Although the critical pressure ratio is also affected by the pressure difference [23], it is very small, so we set it as constant in the simulation. By substituting these parameters into Equation (7), we can obtain the flow rate into or out of the tank. Therefore, the net flow rate can be calculated by:
When we calculated Gth, the downstream pressure was set as constant (atmosphere) because we used a throttle valve to simulate the load. However, in practical application, it should be set by considering the pressure of the load. By analysing Equations (15) and (16), we recognised that the pressure in the tank would fluctuate with variations of the net flow rate.
4. Simulation and Experiment on VBA-R
4.1. Simulation Model
The mathematical model was established in the previous section; this was solved with MATLAB/Simulink software (MathWorks, Natick, MA, USA). There are six chambers in the VBA-R, and each chamber has three control equations. Considering the air power, piston motion and pressure response in the tank, more than twenty equations need to be solved. It is difficult work to model all of the chambers one by one. However, when the piston moves in a left or right stroke, three chambers are charged while the others are discharged, and all of them interchange during each stroke. We also found that, whether the chambers’ volumes changed or not, they could be described by a lumped parameter model with three control equations; the only differences were the structure parameters of the chambers. Thus, we could utilise this peculiarity and only two kinds of chambers needed to be modelled. The tank could be thought of as a particular chamber whose piston was fixed.
Therefore, the discharge chambers can be described by Equations (7), (10) and (12), and the charge chambers can be described by Equations (7), (9) and (11). For the fixed chambers, u can be set to zero; for isothermal chambers, dθ/dt can be set to zero. We needed to model only five standard subsystems and redefine the structure parameters during the simulation, which helped to improve the efficiency of the modelling.
A flow chart of the simulation programme was created, as shown in Figure 4, and the simulation model was established using the standard subsystems. For the simulation, it was necessary to automatically judge the stroke end. Then, the variable step size was selected to improve the calculation efficiency, and the solver was set as ode45 (Dormand–Prince).
4.2. Energy Efficiency Test
To assess the energy efficiency of the booster regulator, an air power metre (APM) [24] was used to measure the energy input and output. The core element of an APM is its quick laminar flow rate sensor, which can convert the pressure and flow rate into air power based on Equation (2). The real-time energy consumption can also be monitored by integrating the air power.
The experiment circuit was configured as shown in Figure 5. It consisted of a precision regulator (IR3020-02A, SMC, Tokyo, Japan), a booster regulator (VBA20A-03, SMC, Tokyo, Japan; VBA-R), two APMs (APM-L-800s, TOKYO METER, Tokyo, Japan), an air tank (VBAT10A1-15, SMC, Tokyo, Japan), a pressure sensor (AP-13S, KEYENCE, Osaka, Japan), a throttle valve (AS300, SMC, Tokyo, Japan), and a data acquisition card (TNS6810, INTERFACE, Hiroshima, Japan). The accuracy of the APM and pressure sensor were ±2% F.S. and ±0.5% F.S., respectively.
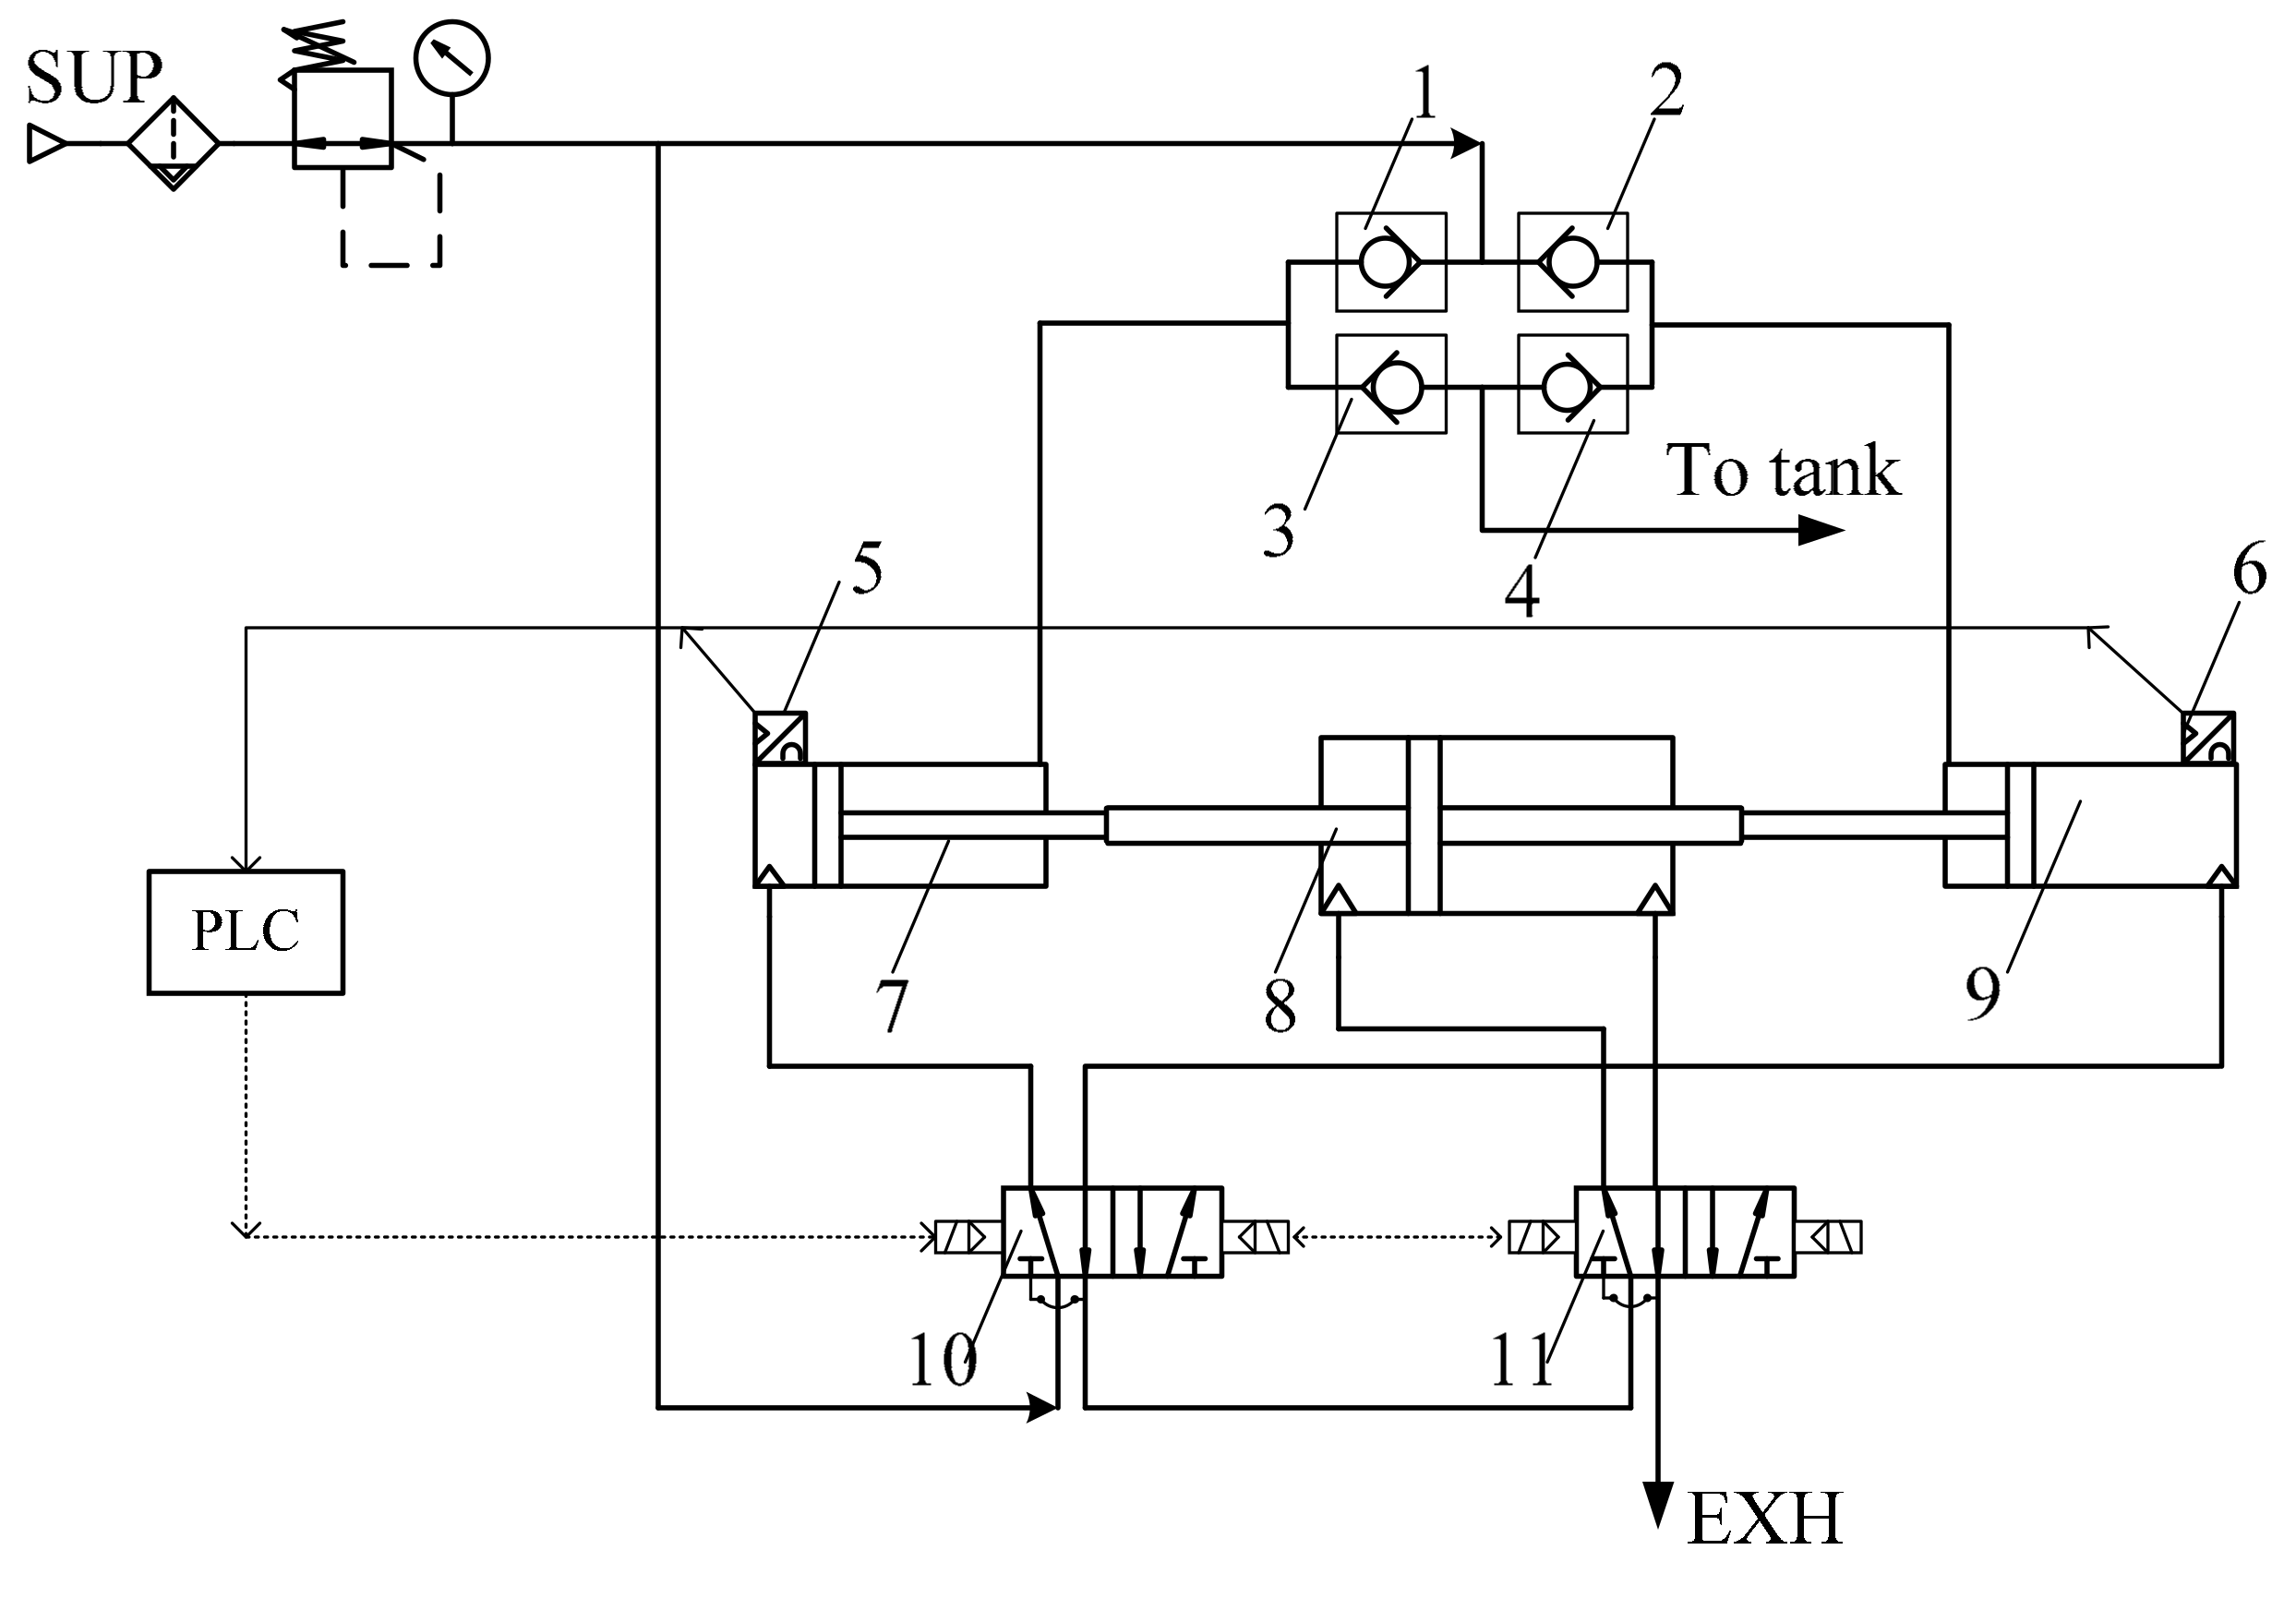
To verify the energy recovery performance considering the cost and period, we used an alternative method rather than manufacture a new VBA-R. The experimental apparatuses used to verify the energy recovery of the VBA-R are shown in Figure 6. According to the structure shown in Figure 2, a double-acting, double-rod cylinder (CG1WLN, SMC, Tokyo, Japan) and two double-acting, single-rod cylinders (CDG1YL, SMC, Tokyo, Japan) were assembled together. The 7/2 solenoid valve was replaced by two 5/2 solenoid valves (SV3200R, SMC, Tokyo, Japan), which were connected in parallel and controlled by a programmable logic controller (PLC).
The details of experiment apparatuses are listed in Table 1.
With this equipment, the configuration of the experiments corresponding to Figure 5 and Figure 6 are shown in Figure 7.
In the test circuit, the APM was mounted at the outlet of tank instead of the booster regulator. As we know, the cheque valve opens only when the pressure in the boost chamber is larger than that in the tank. In that situation, the cheque valve opened intermittently, and air was exhausted in an unsteady flow. The flow rate during unsteady flow is difficult to measure accurately. However, the flow rate output from the tank was almost steady for the constant load, which was easy to measure.
5. Results and Discussion
5.1. Experiment Results
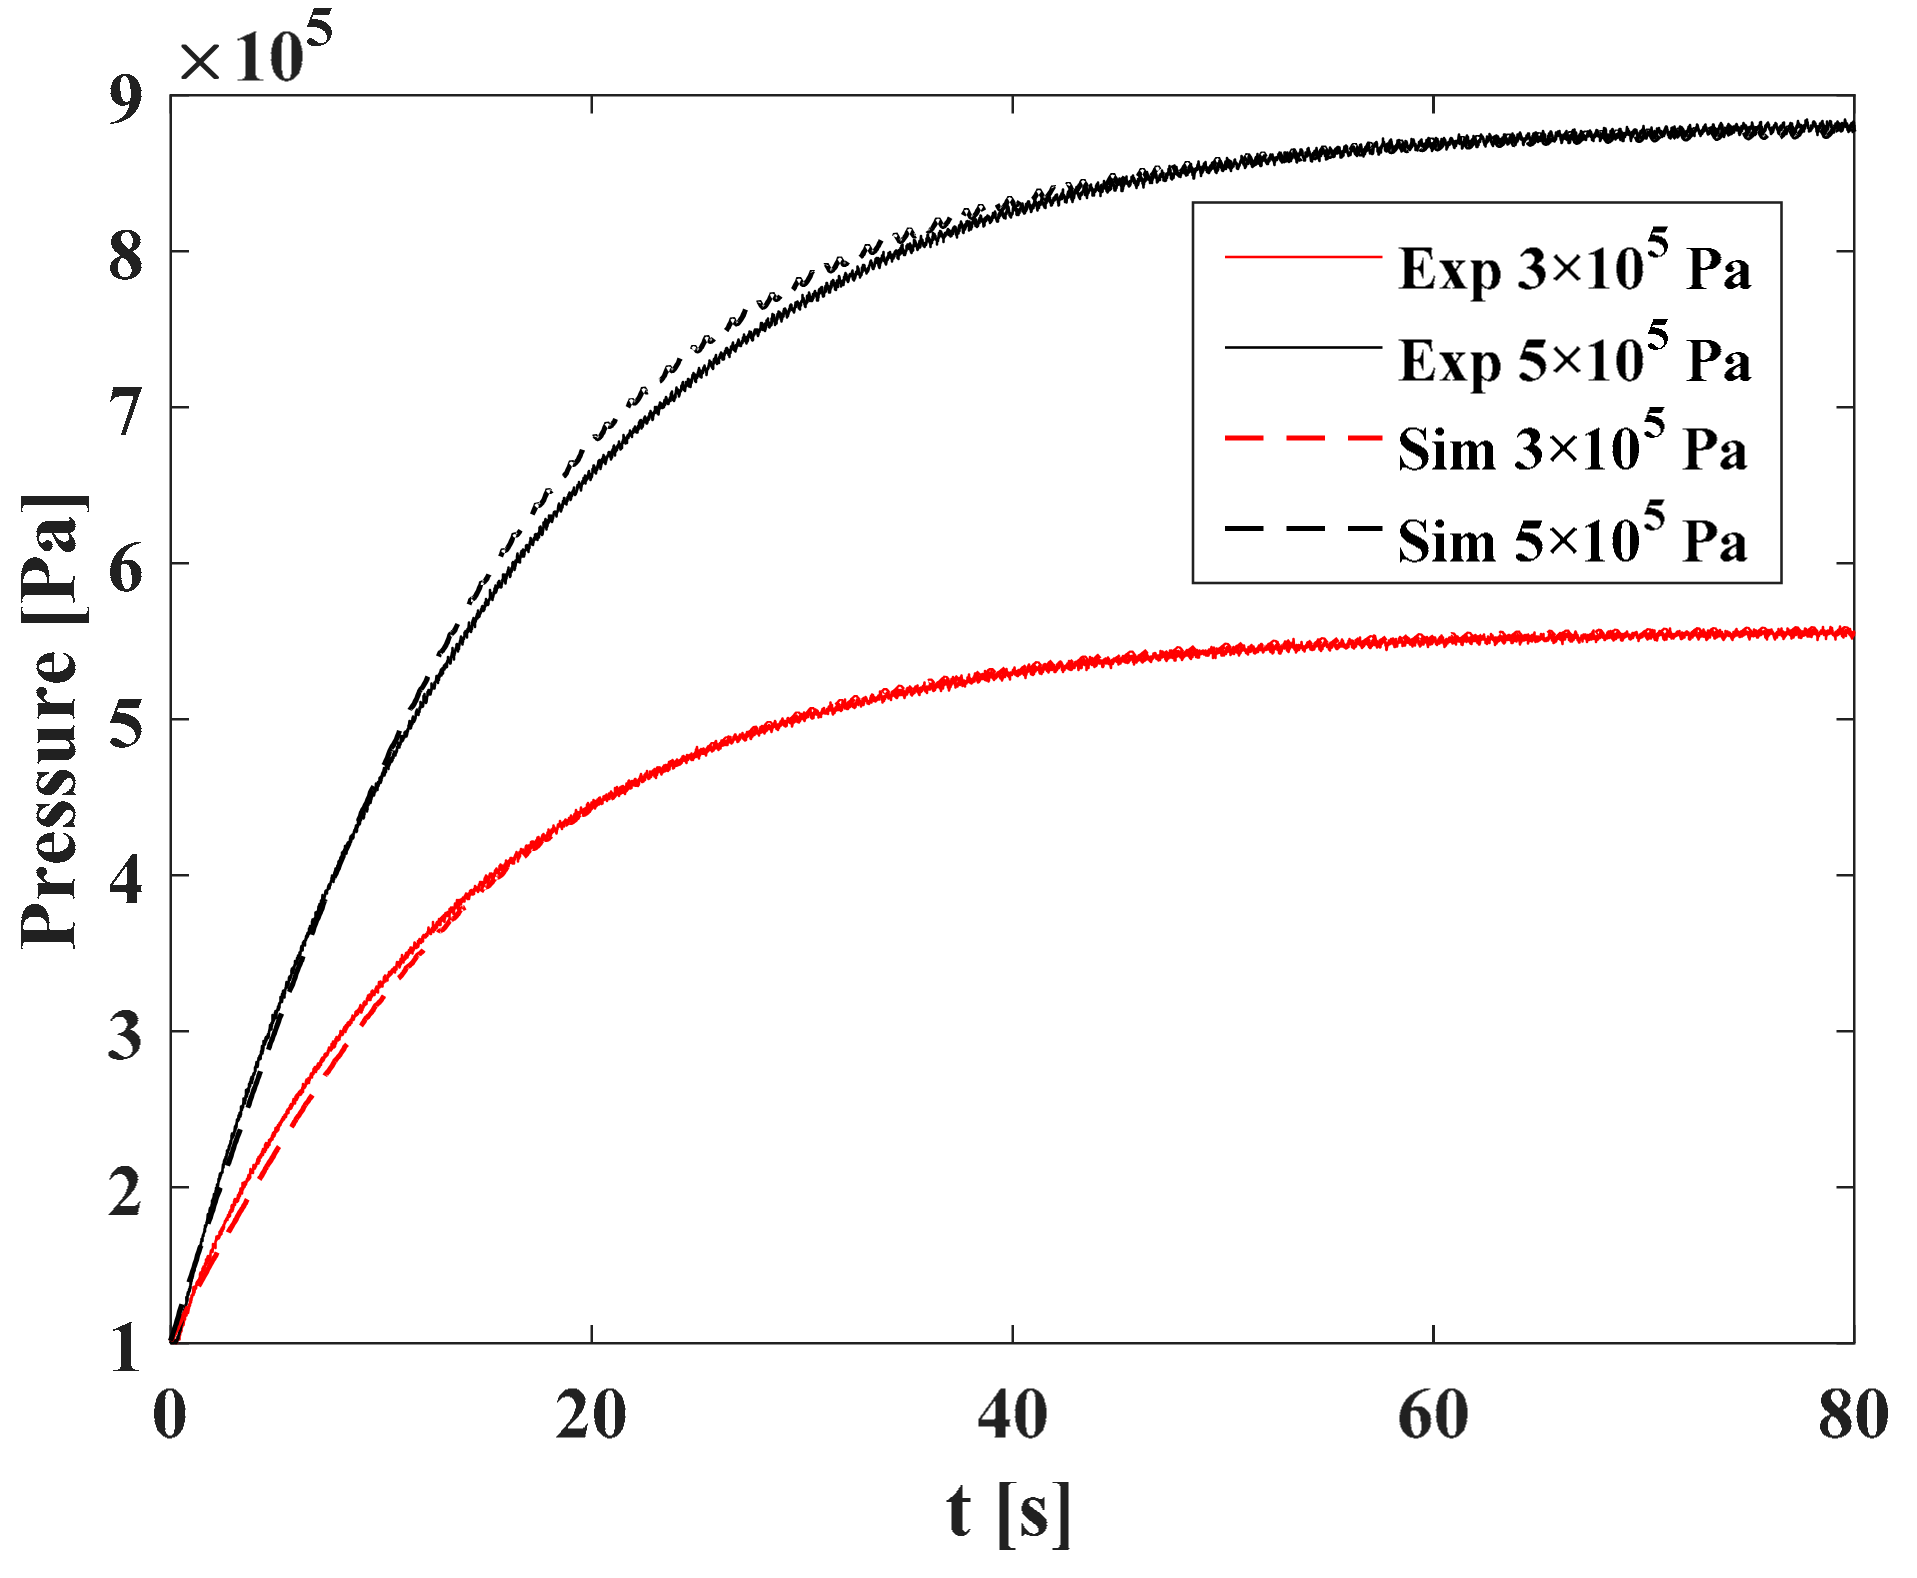
With the experiment system, the main characteristics of the VBA-R were measured as shown in Figure 8 and Figure 9. Figure 8 shows the pressure response in the tank: the pressure gradually increases and then becomes steady. There is a slightly greater time-delay in the response of the experiment than in the simulation at the beginning of air charging, which is due to the isothermal assumption in Equation (15). However, the deviation is within the uncertainty of the system (mainly sensor errors) and can be neglected. Therefore, we believe the experiment results are in good agreement with the simulation. Figure 9 shows the air power output from the tank, and the regularity of change is similar to the pressure.
The mathematical model was verified by experiments, and the simulation model was used to study the other characteristics and the influences of different parameters.
5.2. Characteristics of VBA-R
The simulation model was established in Section 4, and its main parameters are shown in Table 2. Then the characteristics of VBA-R were obtained and shown in Figure 10, Figure 11, Figure 12 and Figure 13, which included the dynamic characteristics of the piston and the pressure response in the boost chamber and tank.
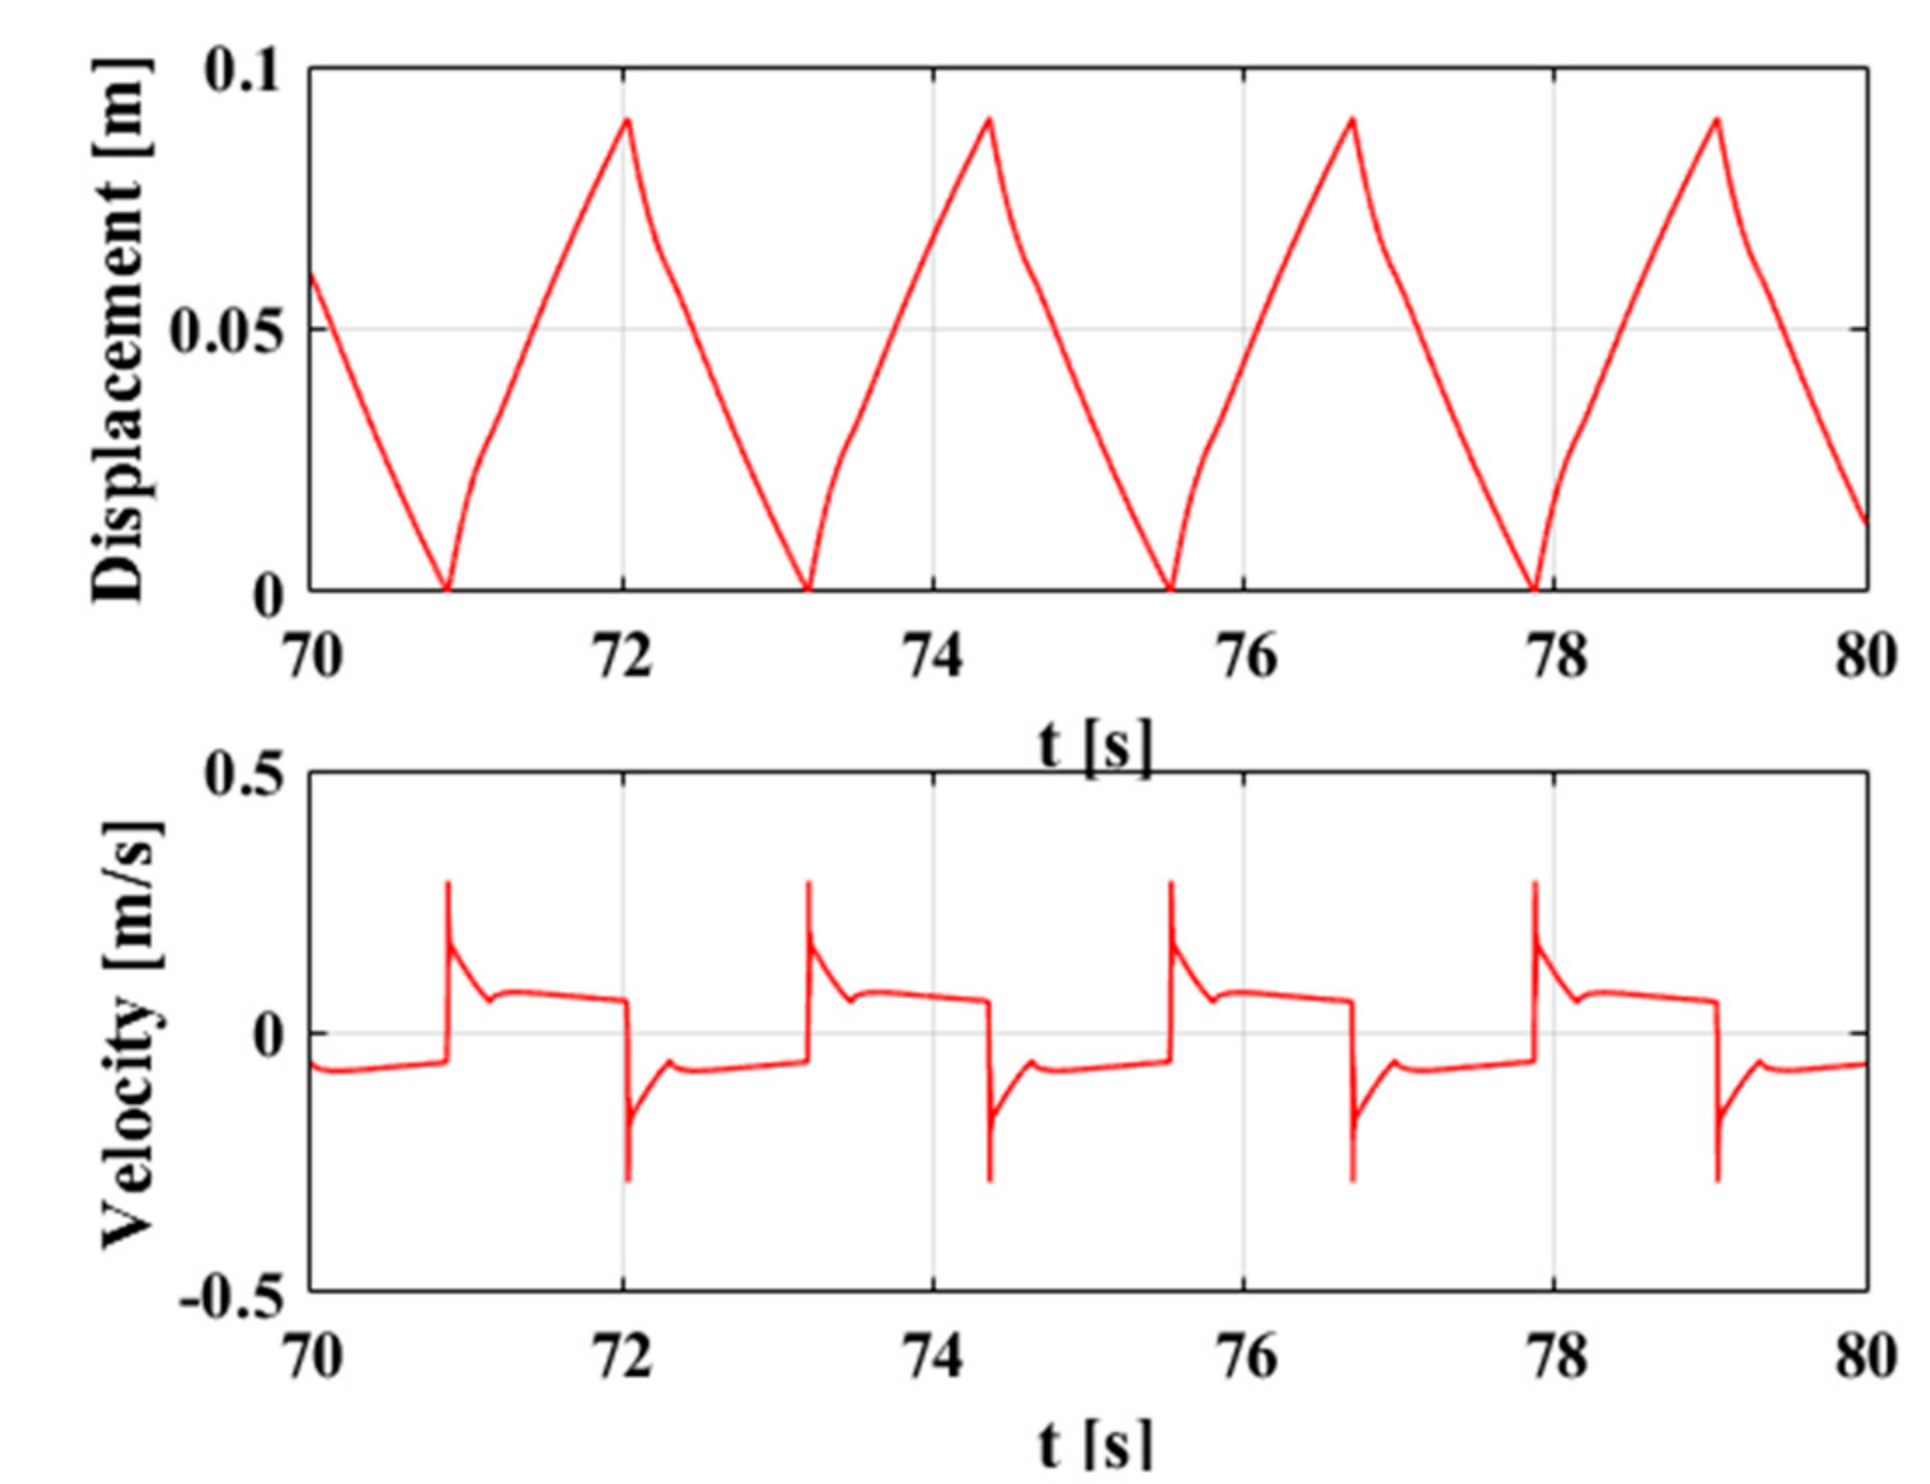
Figure 10 gives the motion characteristics of the piston. When the piston changes its direction, a slight fluctuation occurs because we forced the piston to change its direction at the end of its stroke in the simulation. This would not happen in reality because of the existence of the air buffer.
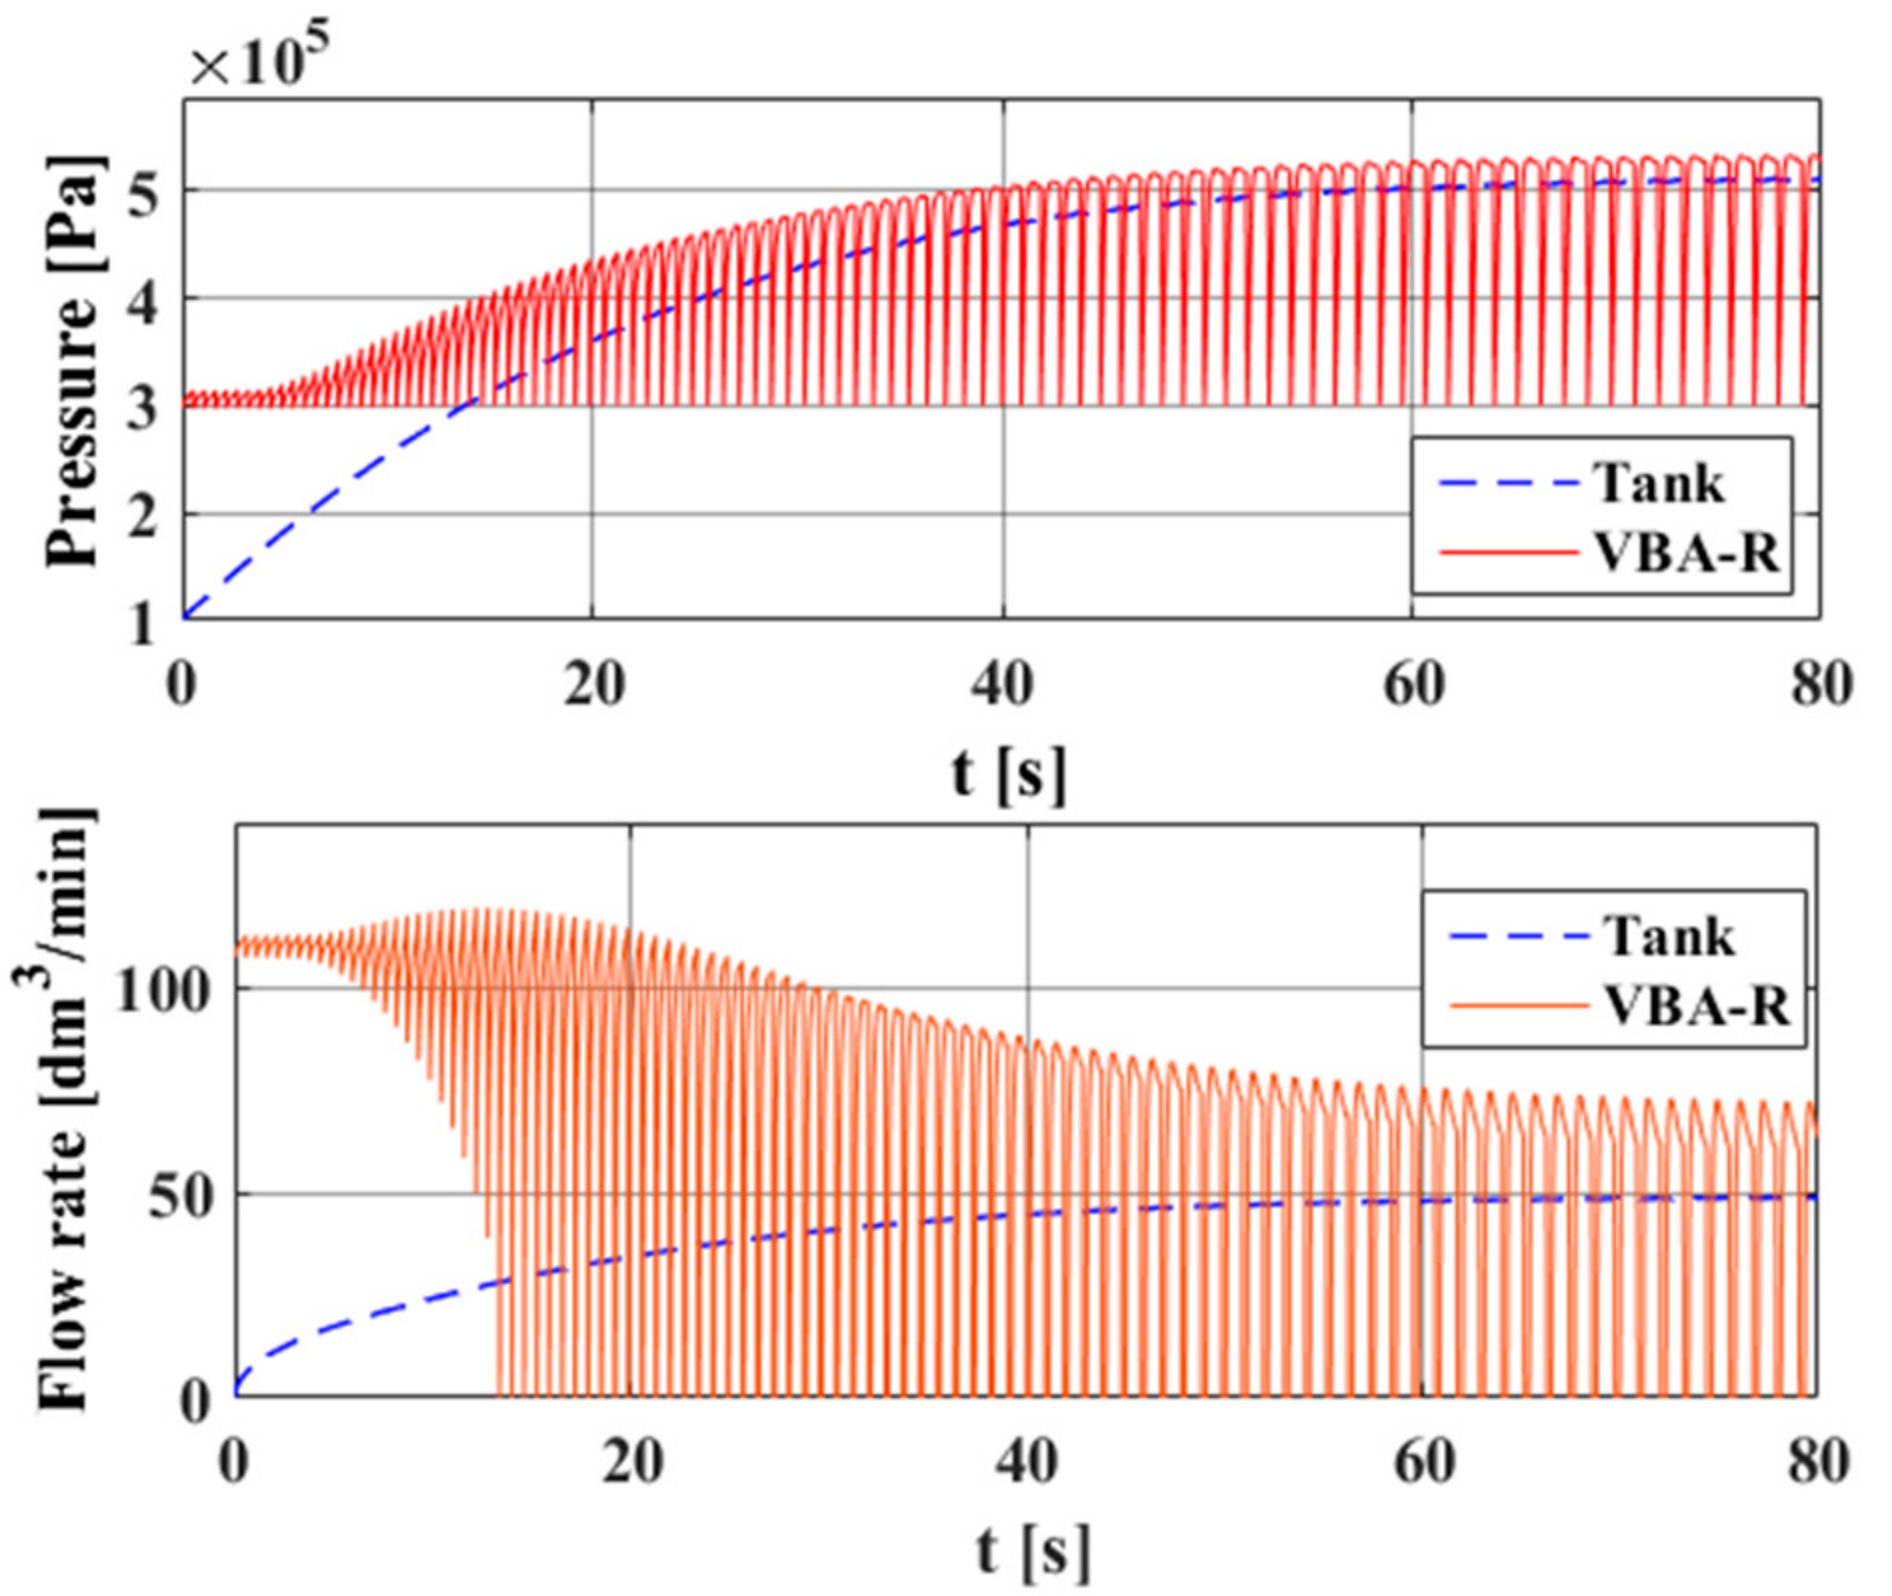
Figure 11 and Figure 12 reflect the outputs of the VBA-R and tank. In the Figure 11, it is clear that the outputs of the tank are smaller than those of the booster regulator for both pressure and flow rate. It also suggests that the outputs of the booster regulator are unsteady and discontinuous. Figure 12 further proves that the output pressure of the tank is less than that of the booster regulator, and with increasing load, the boost ratio decreases sharply. This must be seriously considered when choosing a booster regulator.
Figure 13 indicates that the pressure in the tank fluctuates, but it is much steadier than the booster regulator when compared with the pressure response in Figure 11 and Figure 12. We also found that the fluctuations get smaller as the tank volume increases. This is a good reference for when we match a tank with a booster regulator.
5.3. Energy Efficiency of VBA-R
Equation (6) suggests that the energy efficiency was mainly affected by the supply pressure and boost ratio. However, when the supply pressure was constant, the boost ratio changed with the flow rate consumed by the load. Beyond this, the structure was considered to be proposed as a design reference. The parameters were changed to identify the influence of supply pressure and boost ratio.
5.3.1. Effect of Supply Pressure and Flow Rate
Based on the concept of air power, the pressure is inversely proportional to the flow rate based on energy conservation. Then, considering the flow rate characteristics, the energy efficiency was obtained as shown in Figure 14. As the supply pressure increases, the energy efficiency curves move down when the flow rate is small and they move up as the flow rate increases. To understand this phenomenon, we have to consider the results shown in Section 5.4.1 and Equation (6). According to Equation (6), the energy efficiency gets lower with increasing supply pressure or decreasing boost ratio. From Section 5.4.1, it can be seen that the boost ratio increases with increasing supply pressure, and the losses always increase with increasing supply pressure. Therefore, based on an overall consideration of these factors, the energy efficiency gets smaller with increasing supply pressure, but it is relatively stable for an improving boost ratio. In other words, the boost ratio can compensate for the energy efficiency loss caused by that increasing supply pressure.
Figure 14 also suggests that, when the pressure is constant, the more the flow rate is, the less the energy efficiency is. Therefore, it better to use a booster regulator with a small flow rate. If the flow consumption is large, a high supply pressure has a much better efficiency.
5.3.2. Effect of Diameter Ratio
Figure 2 gives the structure of the VBA-R, which we have claimed helps energy recovery. However, when we considered this again, we found that the pressure in the drive chamber had simultaneously done negative work. With an increase of the recovery chamber diameter, the volume increased, which lead the recovery pressure to decrease. Therefore, it should be confirmed carefully whether the force on the piston in the recovery chamber is increasing or decreasing. This also affected the energy efficiency of the VBA-R, so we changed the diameters to study the influence of the diameter ratio (the ratio of the recovery chamber diameter to the drive chamber diameter, D2/D1) in order to properly select the design parameters.
The change of boost ratio with D2/D1 is shown in Figure 15, when all other parameters are constant. It is clear that the boost ratio increases first and then decreases, and the boost ratio reaches its greatest value when the diameter ratio is nearly 1.3. The variation of energy efficiency is depicted in Figure 16, in which the energy efficiency decreases with increasing supply pressure. The energy efficiency reaches its largest value for different supply pressures when the diameter ratio is closest to 1.3.
5.3.3. Effect of Operate Conditions
There are different demands in practical applications, and, according to the different operating conditions, we hope to achieve higher energy efficiency. We made a comparison between two kinds of operation conditions, as shown in Figure 17. In these two conditions, the energy efficiency difference was up to 20%. We analysed previously that, as the supply pressure or flow rate increased, the energy efficiency decreased. Thus, in a practical application, it is better to use a booster regulator with a high boost ratio.
In Figure 18, the influence of boost ratio was further verified, and the result was consistent with the analysis according to Equation (6), which indicated that the energy efficiency gets higher with decreasing supply pressure or increasing boost ratio. However, the boost ratio gets smaller with decreasing supply pressure, so we should comprehensively consider these factors in order to obtain higher efficiency.
5.4. Comparison of VBA and VBA-R
The VBA-R was designed as an updated version of the VBA, so a performance comparison and assessment are essential. Flow-rate characteristics are the basic performance indicator that should be considered first for pneumatic components. We added energy efficiency as another index for the booster regulator: it also can be referred to in the design of other pneumatic components by introducing the concept of air power.
5.4.1. Comparison of Flow-Rate Characteristics
The flow rate characteristics of the VBA and VBA-R are shown in Figure 19. It is clear that, with the same supply pressure, the output pressure of the VBA-R is much higher. The largest boost ratio of the VBA is two-times as much as the supply pressure, but that of the VBA-R is even greater. This directly indicates that the recovery energy is used to push the piston, and then the boost ratio enhances it. However, as Figure 15 shows, we must select the diameter ratio properly to obtain the best performance.
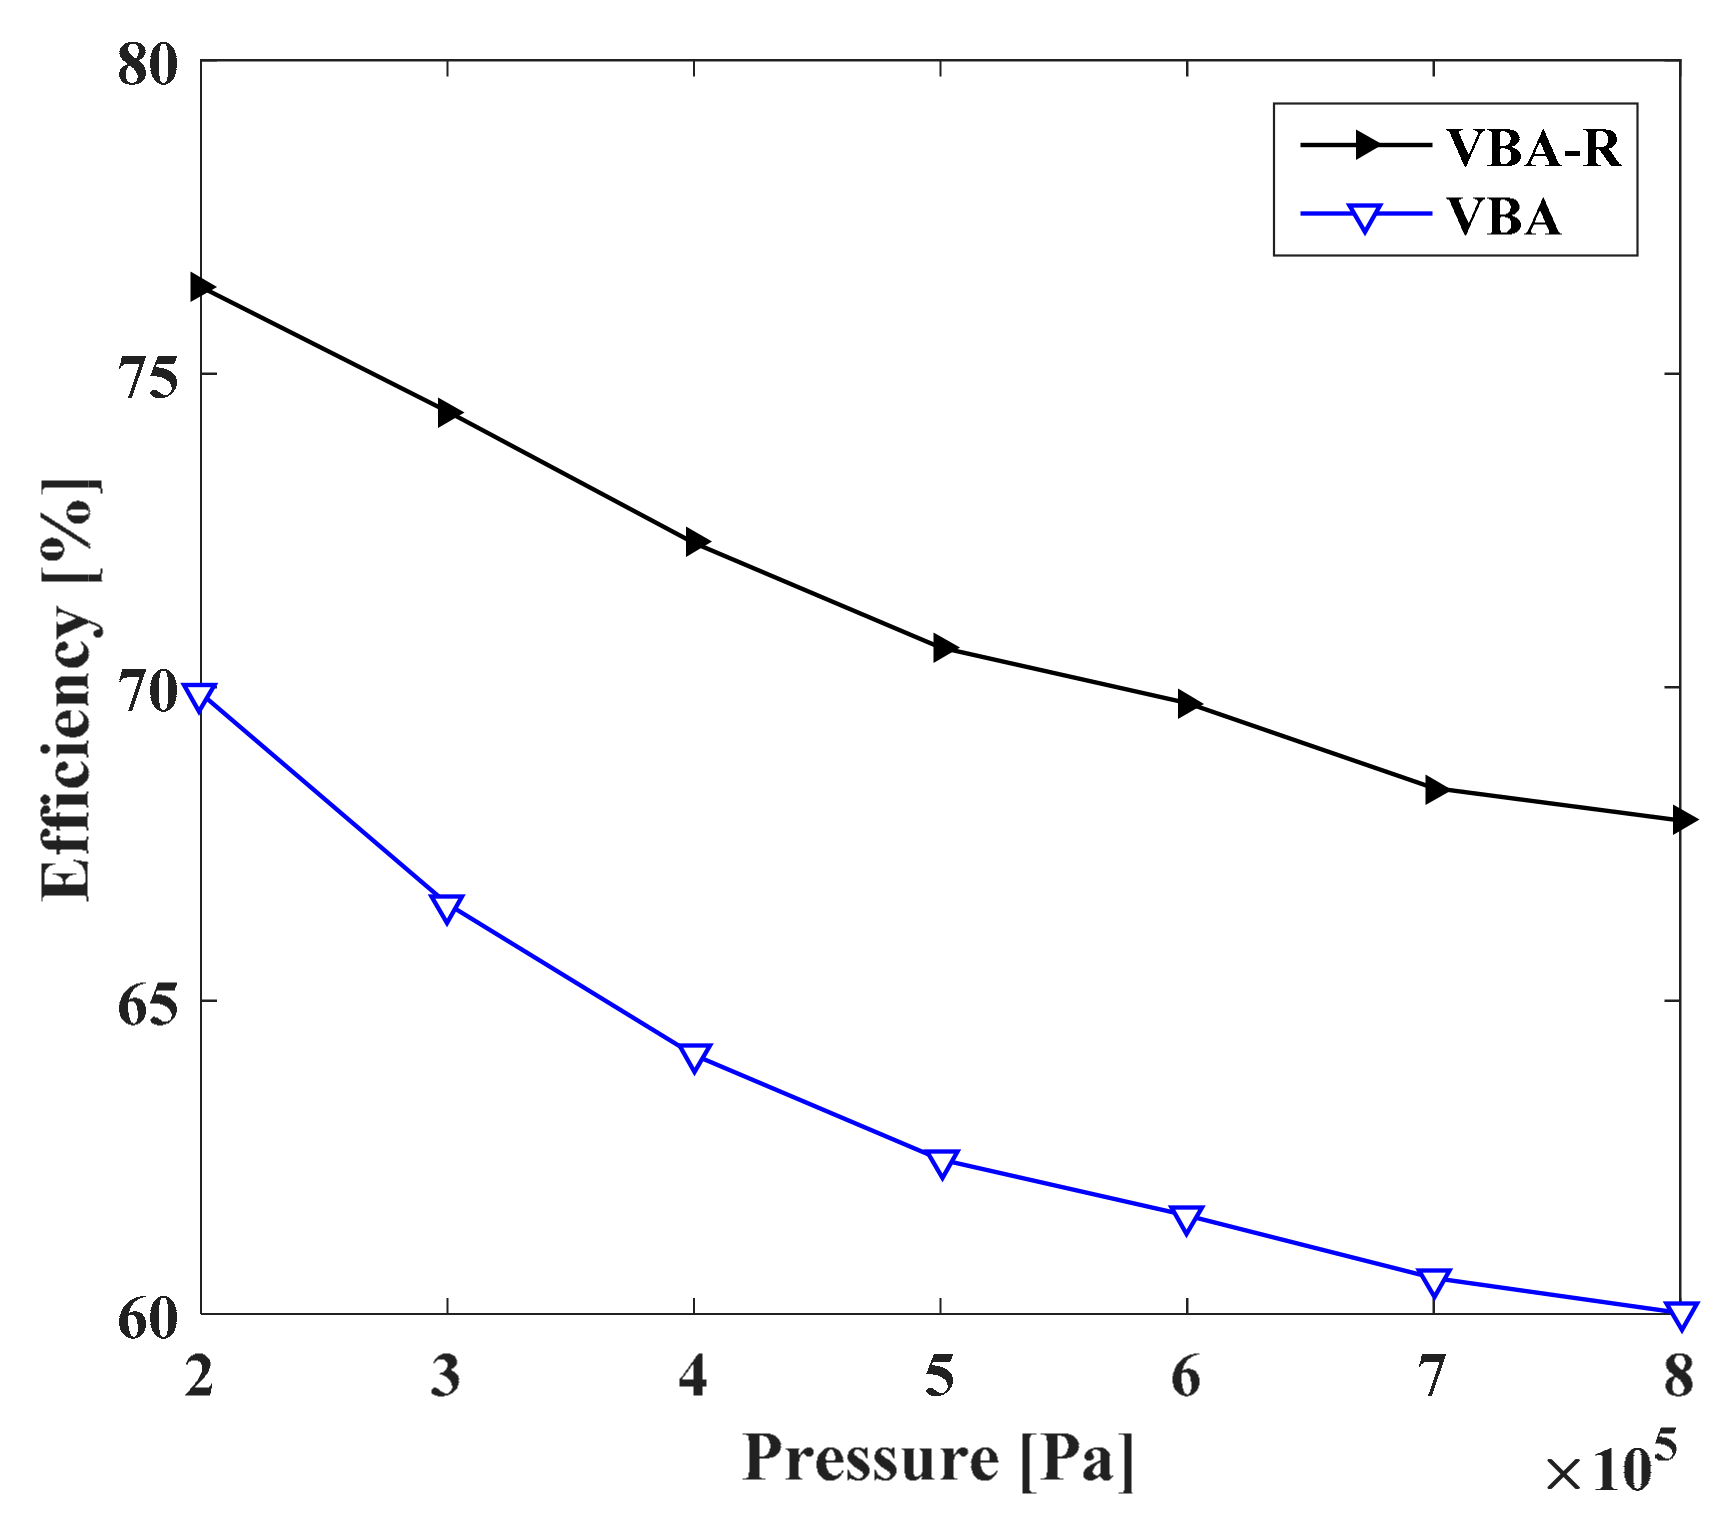
5.4.2. Comparison of Energy Efficiency
To verify that the recovery energy helps improve the energy efficiency, the VBA and VBA-R were compared as shown in Figure 20. It is clear that, as the supply pressure increases, the energy efficiency decreases. However, with the help of the recovery chamber, the efficiency of the VBA-R is always 5–10% higher than that of the VBA. Once again, this proves the performance improvement of the VBA-R.
6. Conclusions
A new pneumatic booster regulator with energy recovery was proposed and its energy efficiency characteristics were modelled by considering the tank. It was consistent with the application of a booster regulator system. With this model, the energy efficiency was confirmed by using the concept of air power. Then, the effects of various factors on energy efficiency were comprehensively analysed, and the performance improvement of the VBA-R was verified by comparing it with the VBA. The conclusions can be summarised as follows:
- (1)
- The system outputs, especially the pressure, were less than those of the booster regulator. When the air consumption increased, the boost ability decreased, and the tank output became much smaller;
- (2)
- The energy efficiency was directly affected by the supply pressure, and it decreased with increasing supply pressure or decreasing boost ratio;
- (3)
- When the supply pressure was constant, the energy efficiency decreased with the flow rate consumed by an increasing load;
- (4)
- Both the boost ratio and energy efficiency increased first and then decreased with the increasing recovery chamber diameter. When the diameter ratio was close to 1.3, the VBA-R has the largest boost ratio and energy efficiency;
- (5)
- The recovery chamber helped improve the boost ratio by 15–25% and energy efficiency by 5–10% under different operating conditions. Thus, it will save energy over long running times.
Acknowledgments
The research work presented in this paper is financially supported by SMC Corporation. And thanks for the support by Wuhan International Scientific and Technological Cooperation Project, No. 2016030409020224.
Author Contributions
Toshiharu Kagawa and Kotaro Tadano conceived and designed the experiments; Fan Yang performed the experiments and analyzed the data; Fan Yang wrote the paper and Gangyan Li modified the manuscript.
Conflicts of Interest
The authors declare no conflict of interest.
Nomenclature
| b | critical pressure ratio |
| c | viscous friction coefficient |
| C | sonic conductance [m3/(s Pa)] |
| cv | volumetric specific heat [J/(kg K)] |
| cp | pressure specific heat [J/(kg K)] |
| D | piston diameter [m] |
| E | energy of air [J] |
| Ff | frictional force [N] |
| G | mass flow rate [kg/s] |
| h | heat transfer coefficient [W/(m2 K)] |
| H | enthalpy [J] |
| κ | specific heat index |
| M | mass of piston [kg] |
| η | energy efficiency |
| R | gas state constant, 287 [J/(kg K)] |
| ρ | density [kg/m3] |
| p | pressure [Pa] |
| P | air power [W] |
| q | heat exchange [J] |
| Q | volume flow rate [m3/s] |
| S | section area of piston [m2] |
| t | time [s] |
| T | cycle of booster regulator [s] |
| θ | temperature [K] |
| u | velocity of piston [m/s] |
| U | internal energy [J] |
| V | volume of chamber [m3] |
| Subscript | |
| 0 | standard state of atmosphere [20 °C,100 kPa] |
| 1 | upstream |
| 2 | downstream |
| ba/bb | boost chamber A/B |
| da/db | drive chamber A/B |
| ra/rb | recovery chamber A/B |
| bc/dc | boost/drive chamber |
| a | state of atmosphere |
| c | charge chamber |
| d | discharge chamber |
| t | air tank |
References
- Cai, M.L.; Kagawa, T. Energy consumption assessment and energy loss analysis in pneumatic system. Chin. J. Mech. Eng. 2007, 43, 69–74. [Google Scholar] [CrossRef]
- Li, T.C.; Wu, H.W.; Kuo, M.J. A study of gas economizing pneumatic cylinder. J. Phys. Conf. Ser. 2006, 48, 1227. [Google Scholar] [CrossRef]
- Cai, M.L.; Kagawa, T. Simulation for energy savings in pneumatic system. In Systems Modeling and Simulation; Springer: Tokyo, Japan, 2007; pp. 258–261. [Google Scholar]
- Wang, H.T.; Xiong, W.; Wang, X. Research on the static characteristics of air driven gas booster. Proc. JFPS Int. Symp. Fluid Power 2008, 2008, 715–718. [Google Scholar] [CrossRef]
- Shi, Y.; Cai, M.L. Working characteristics of two kinds of air-driven boosters. Energy Convers. Manag. 2011, 52, 3399–3407. [Google Scholar] [CrossRef]
- Li, Z.Y.; Zhao, Y.Y.; Li, L.S.; Shu, P.C. Mathematical modeling of compression processes in air-driven boosters. Appl. Therm. Eng. 2007, 27, 1516–1521. [Google Scholar] [CrossRef]
- Shi, Y.; Jia, G.W.; Cai, M.L.; Xu, W.Q. Study on the dynamics of local pressure boosting pneumatic system. Math. Probl. Eng. 2015, 2015, 1–11. [Google Scholar] [CrossRef]
- Shi, Y.; Cai, M.L. Dimensionless study on output flow characteristics of expansion energy used pneumatic pressure booster. J. Dyn. Syst. Meas. Control 2013, 135, 1–8. [Google Scholar] [CrossRef]
- Shi, Y.; Cai, M.L. Dimensionless study on outlet flow characteristics of an air-driven booster. J. Zhejiang Univ. Sci. A 2012, 13, 481–490. [Google Scholar] [CrossRef]
- Merkelbach, S.; Murrenhoff, H. Exergy based analysis of pneumatic air saving measures. In ASME/BATH 2015 Symposium on Fluid Power and Motion Control; American Society of Mechanical Engineers: Chicago, IL, USA, 2015; p. V001T01A007. [Google Scholar]
- Harris, P.; Nolan, S.; O’Donnell, G.E. Energy optimisation of pneumatic actuator systems in manufacturing. J. Clean. Prod. 2014, 72, 35–45. [Google Scholar] [CrossRef]
- Cummins, J.J.; Barth, E.J.; Adams, D.E. Modeling of a pneumatic strain energy accumulator for variable system configurations with quantified projections of energy efficiency increases. In ASME/BATH 2015 Symposium on Fluid Power and Motion Control; American Society of Mechanical Engineers: Chicago, IL, USA, 2015; p. V001T01A055. [Google Scholar]
- Luo, X.; Wang, J.H.; Sun, H.; Derby, J.W.; Mangan, S.J. Study of a new strategy for pneumatic actuator system energy efficiency improvement via the scroll expander technology. IEEE/ASME Trans. Mechatron. 2013, 18, 1508–1518. [Google Scholar] [CrossRef]
- Luo, X.; Sun, H.; Wang, J.H. An energy efficient pneumatic-electrical system and control strategy development. In Proceedings of the 2011 American Control Conference, San Francisco, CA, USA, 29 June–1 July 2011. [Google Scholar]
- Shi, Y.; Wu, T.C.; Cai, M.L.; Wang, Y.X.; Xu, W.Q. Energy conversion characteristics of a hydropneumatic transformer in a sustainable-energy vehicle. Appl. Energy 2016, 171, 77–85. [Google Scholar] [CrossRef]
- Trujillo, J.A. Energy Efficiency of High Pressure Pneumatic Systems. Ph.D. Thesis, Polytechnic University of Catalonia, Barcelona, Spain, 2015. [Google Scholar]
- Cai, M.; Kawashima, K.; Kagawa, T. Power assessment of flowing compressed air. J. Fluids Eng. 2006, 128, 402–405. [Google Scholar] [CrossRef]
- ISO6358-1. Pneumatic Fluid Power—Determination of Flow-Rate Characteristics of Components Using Compressible Fluids—Part 1: General Rules and Test Methods for Steady-State Flow; International Organization for Standardization (ISO): Geneva, Switzerland, 2013. [Google Scholar]
- Kaasa, G.O.; Chapple, P.J.; Lie, B. Modeling of an electro-pneumatic cylinder actuator for nonlinear and adaptive control, with application to clutch actuation in heavy-duty trucks. In Proceedings of the 3rd International Ph.D. Symposium on Fluid Power, Terrassa, Spain, 30 June–2 July 2004. [Google Scholar]
- Okawa, Y.; Youn, C.; Kawashima, K.; Kagawa, T. Flow rate measurement via isothermal discharge method for hydrogen. Int. J. Hydrogen Energy 2012, 37, 18882–18887. [Google Scholar] [CrossRef]
- Harris, P.G.; O’Donnell, G.E.; Whelan, T. Modelling and identification of industrial pneumatic drive system. Int. J. Adv. Manuf. Technol. 2012, 58, 1075–1086. [Google Scholar] [CrossRef]
- Li, J.; Kawashima, K.; Fujita, T.; Kagawa, T. Control design of a pneumatic cylinder with distributed model of pipelines. Precis. Eng. 2013, 37, 880–887. [Google Scholar] [CrossRef]
- Baojun, H.; Fujita, T.; Kawashima, K.; Kagawa, T. Influence of pressure condition change on the flow rate characteristics of pneumatic valve. J. Jpn. Fluid Power Syst. Soc. 2001, 32, 143–149. [Google Scholar]
- Cai, M.L.; Kagawa, T. Design and application of air power meter in compressed air systems. In Proceedings of the Eco Design 2001: Second International Symposium; Environmentally Conscious Design and Inverse Manufacturing, Tokyo, Japan, 11–15 December 2001. [Google Scholar]
Figure 1.
Schematic of booster regulator (VBA). 1-Drive chamber A, 2-piston, 3-booster chamber A, 4-switching valve, 5-check valve, 6-booster chamber B, 7-piston rod, 8-drive chamber B, 9-regulator, 10-air source. The pressure is higher in red lines than in green lines.
Figure 1.
Schematic of booster regulator (VBA). 1-Drive chamber A, 2-piston, 3-booster chamber A, 4-switching valve, 5-check valve, 6-booster chamber B, 7-piston rod, 8-drive chamber B, 9-regulator, 10-air source. The pressure is higher in red lines than in green lines.
Figure 2.
Structure schematic diagram of booster regulator with energy recovery (VBA-R). 1: drive chamber A, 2: piston, 3: booster chamber A, 4: air source, 5: recovery chamber A, 6: recovery chamber B, 7: check valve, 8: boost chamber B, 9: piston rod, 10: drive chamber B, 11: magnetic switch, 12: magnetic ring, 13: 7/2 solenoid valve, 14: regulator, 15: power source.
Figure 3.
Pressure response model of tank.
Figure 4.
Flow chart of simulation programme.
Figure 5.
Schematic diagram of booster regulator test. 1: air source, 2: regulator, 3: air power metre (APM), 4: booster regulator, 5: air tank, 6: APM, 7: throttle valve, 8: silencer, 9: pressure sensor.
Figure 5.
Schematic diagram of booster regulator test. 1: air source, 2: regulator, 3: air power metre (APM), 4: booster regulator, 5: air tank, 6: APM, 7: throttle valve, 8: silencer, 9: pressure sensor.
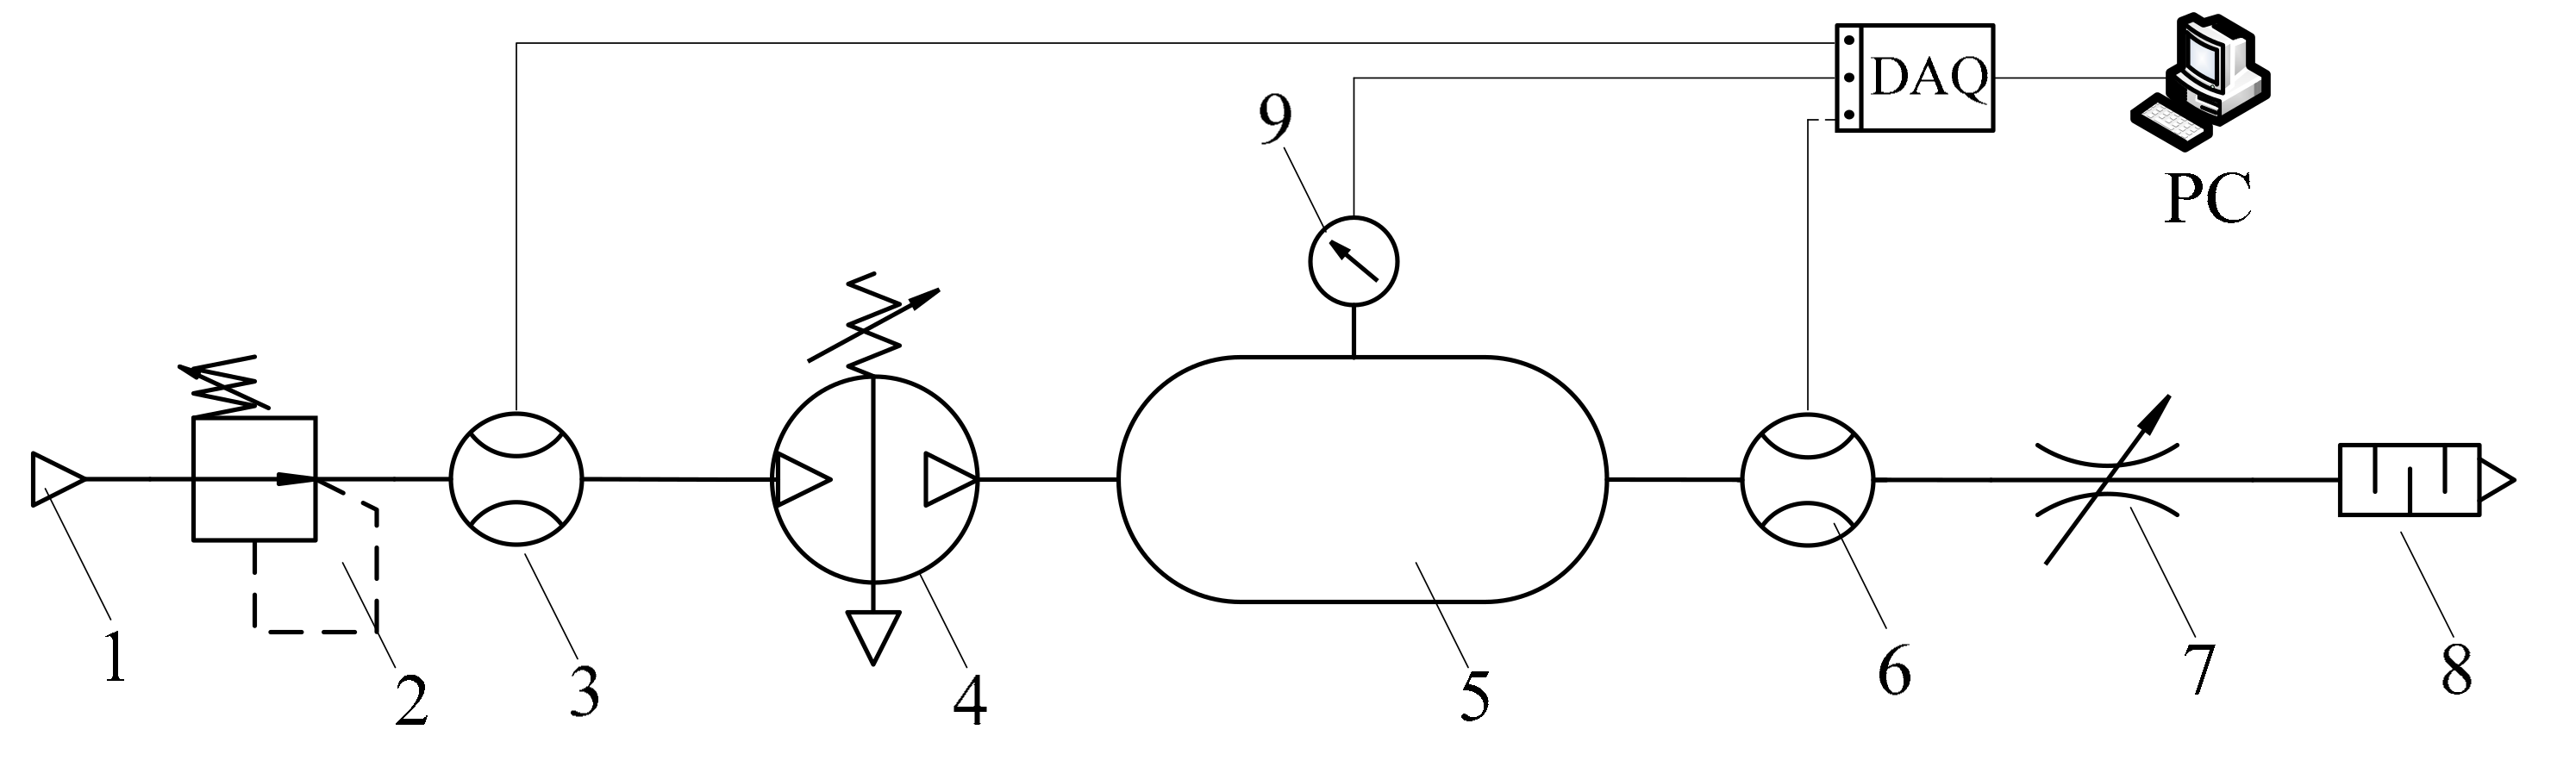
Figure 6.
Schematic diagram of VBA-R. 1,2,3,4: check valve, 5,6: auto switch, 7,9: single-rod cylinder, 8: double-rod cylinder, 10,11: 5/2 solenoid valve.
Figure 6.
Schematic diagram of VBA-R. 1,2,3,4: check valve, 5,6: auto switch, 7,9: single-rod cylinder, 8: double-rod cylinder, 10,11: 5/2 solenoid valve.

Figure 7.
Test rig of energy efficiency test, (a) test of VBA and (b) test of VBA-R.

Figure 8.
Pressure response in the tank.

Figure 9.
Air power output from the system.
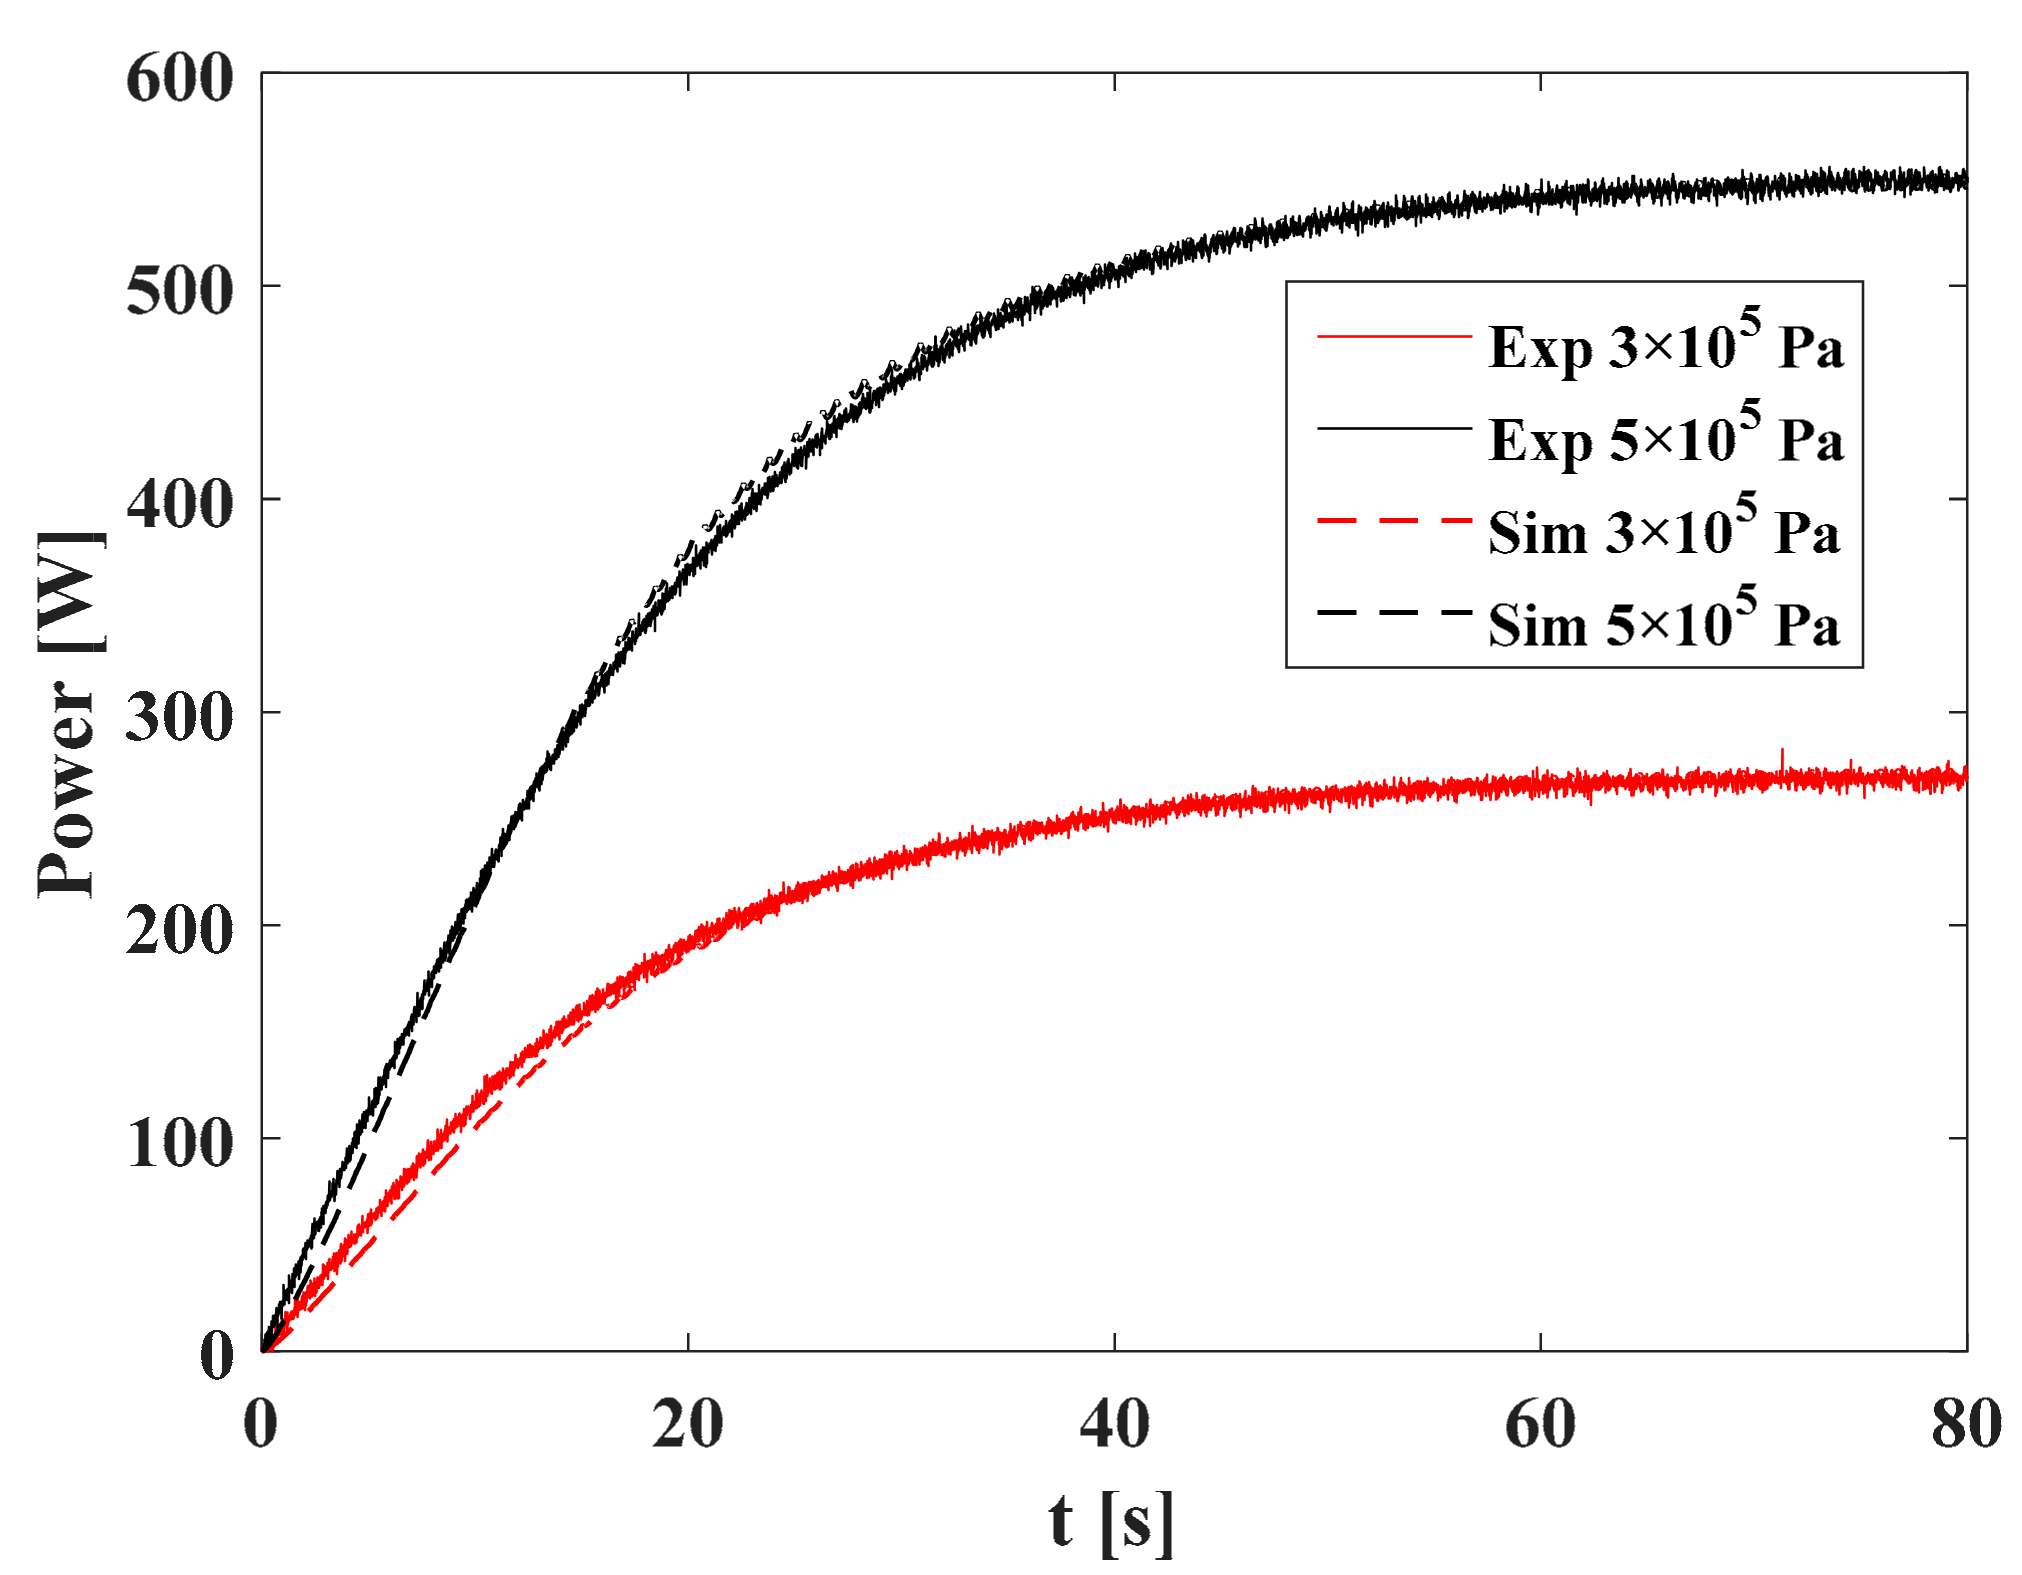
Figure 10.
Curves of piston velocity and displacement.

Figure 11.
Pressure/flow rate response of VBA-R and tank.

Figure 12.
Pressure response with different loads.

Figure 13.
Pressure fluctuations in the tank.

Figure 14.
Energy efficiency of VBA-R.
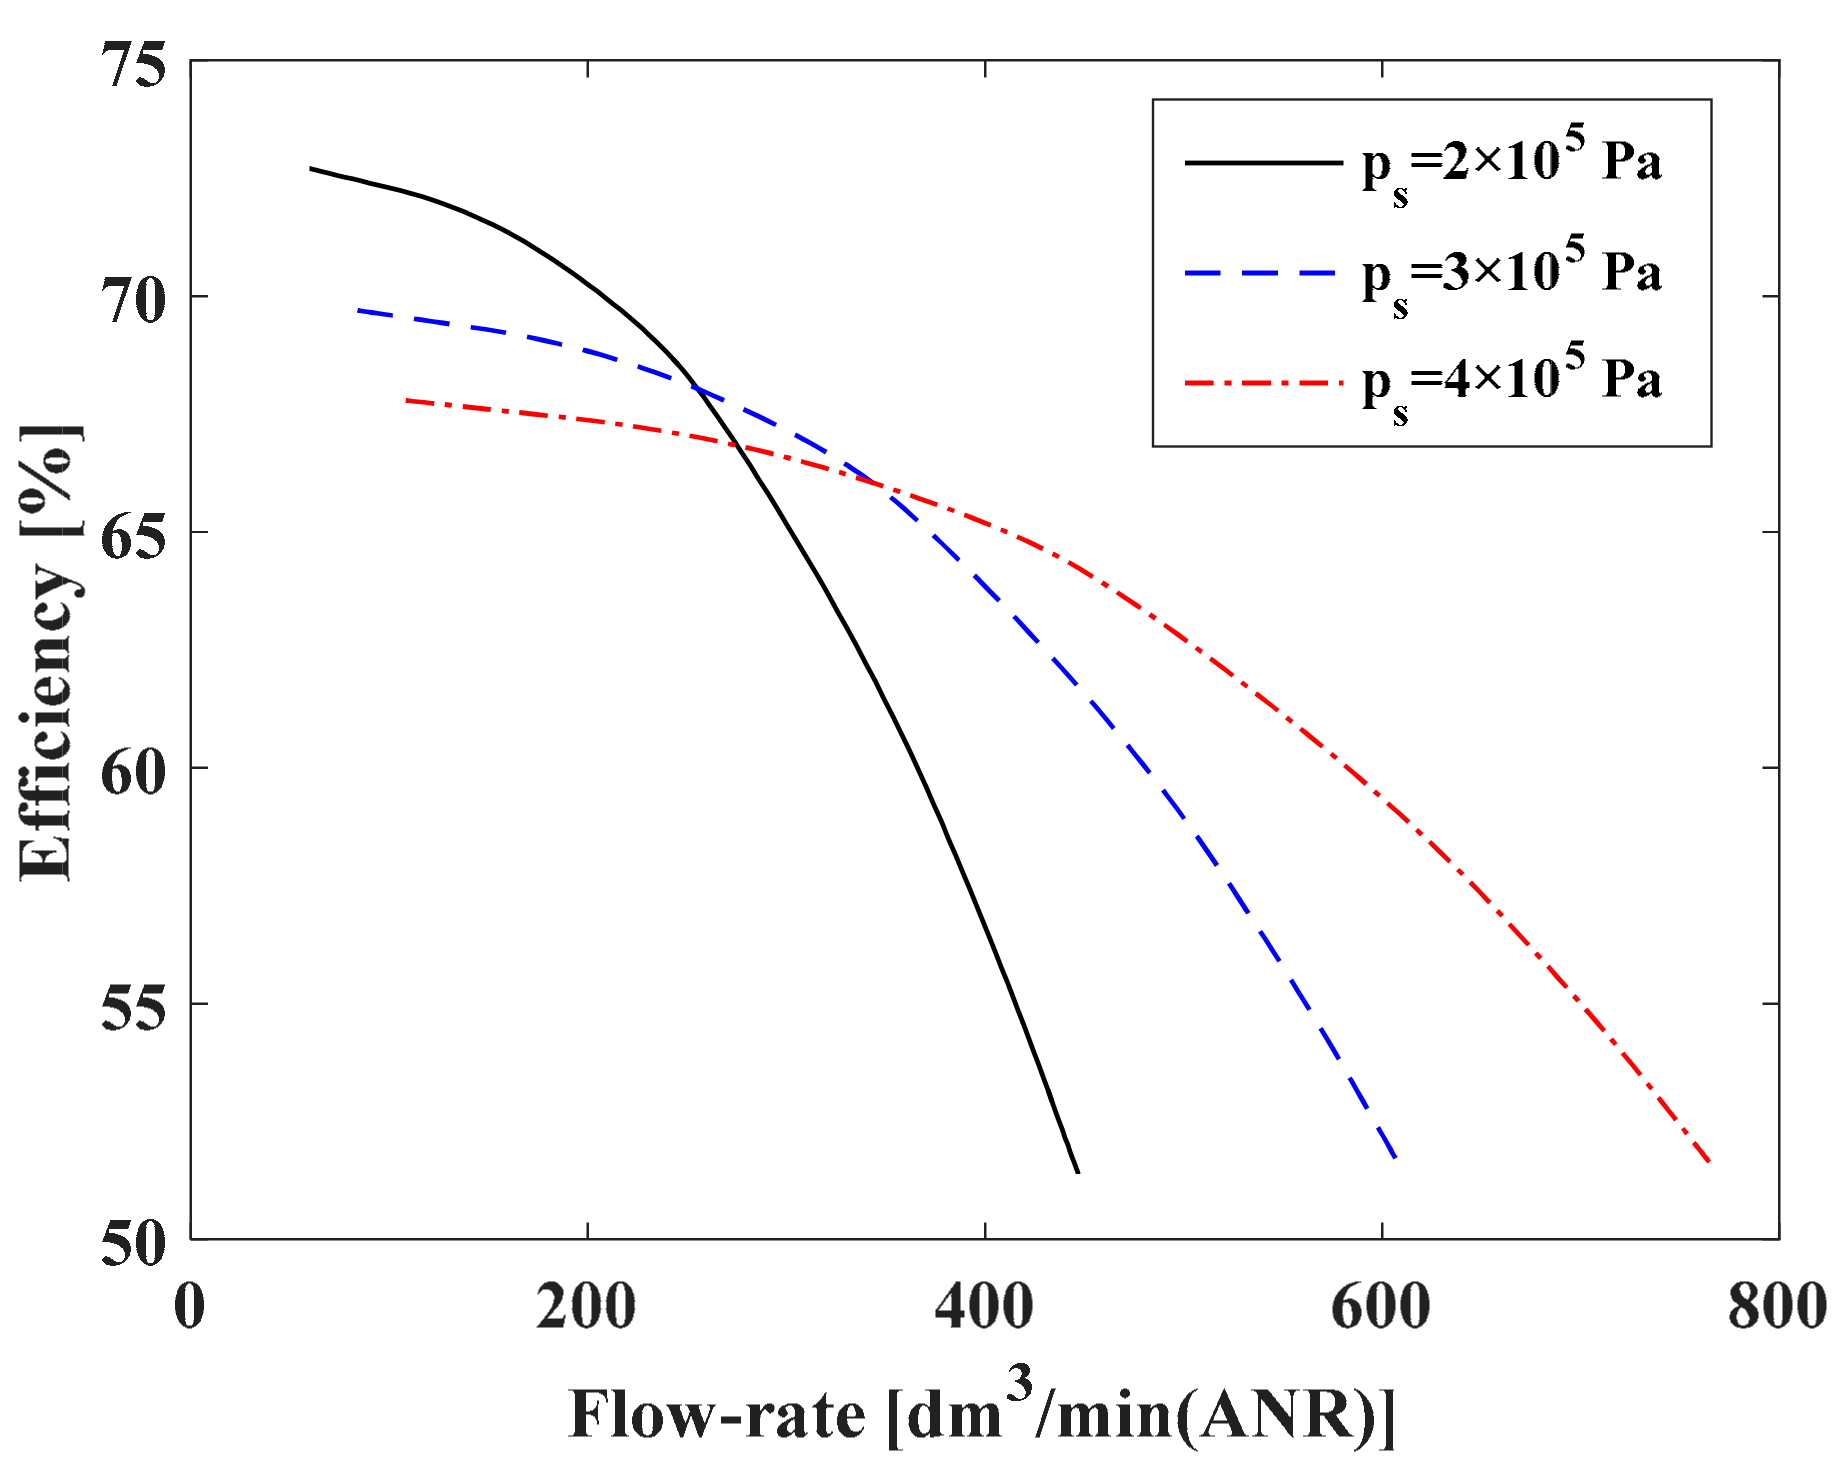
Figure 15.
Relationship between boost ratio and diameter ratio.
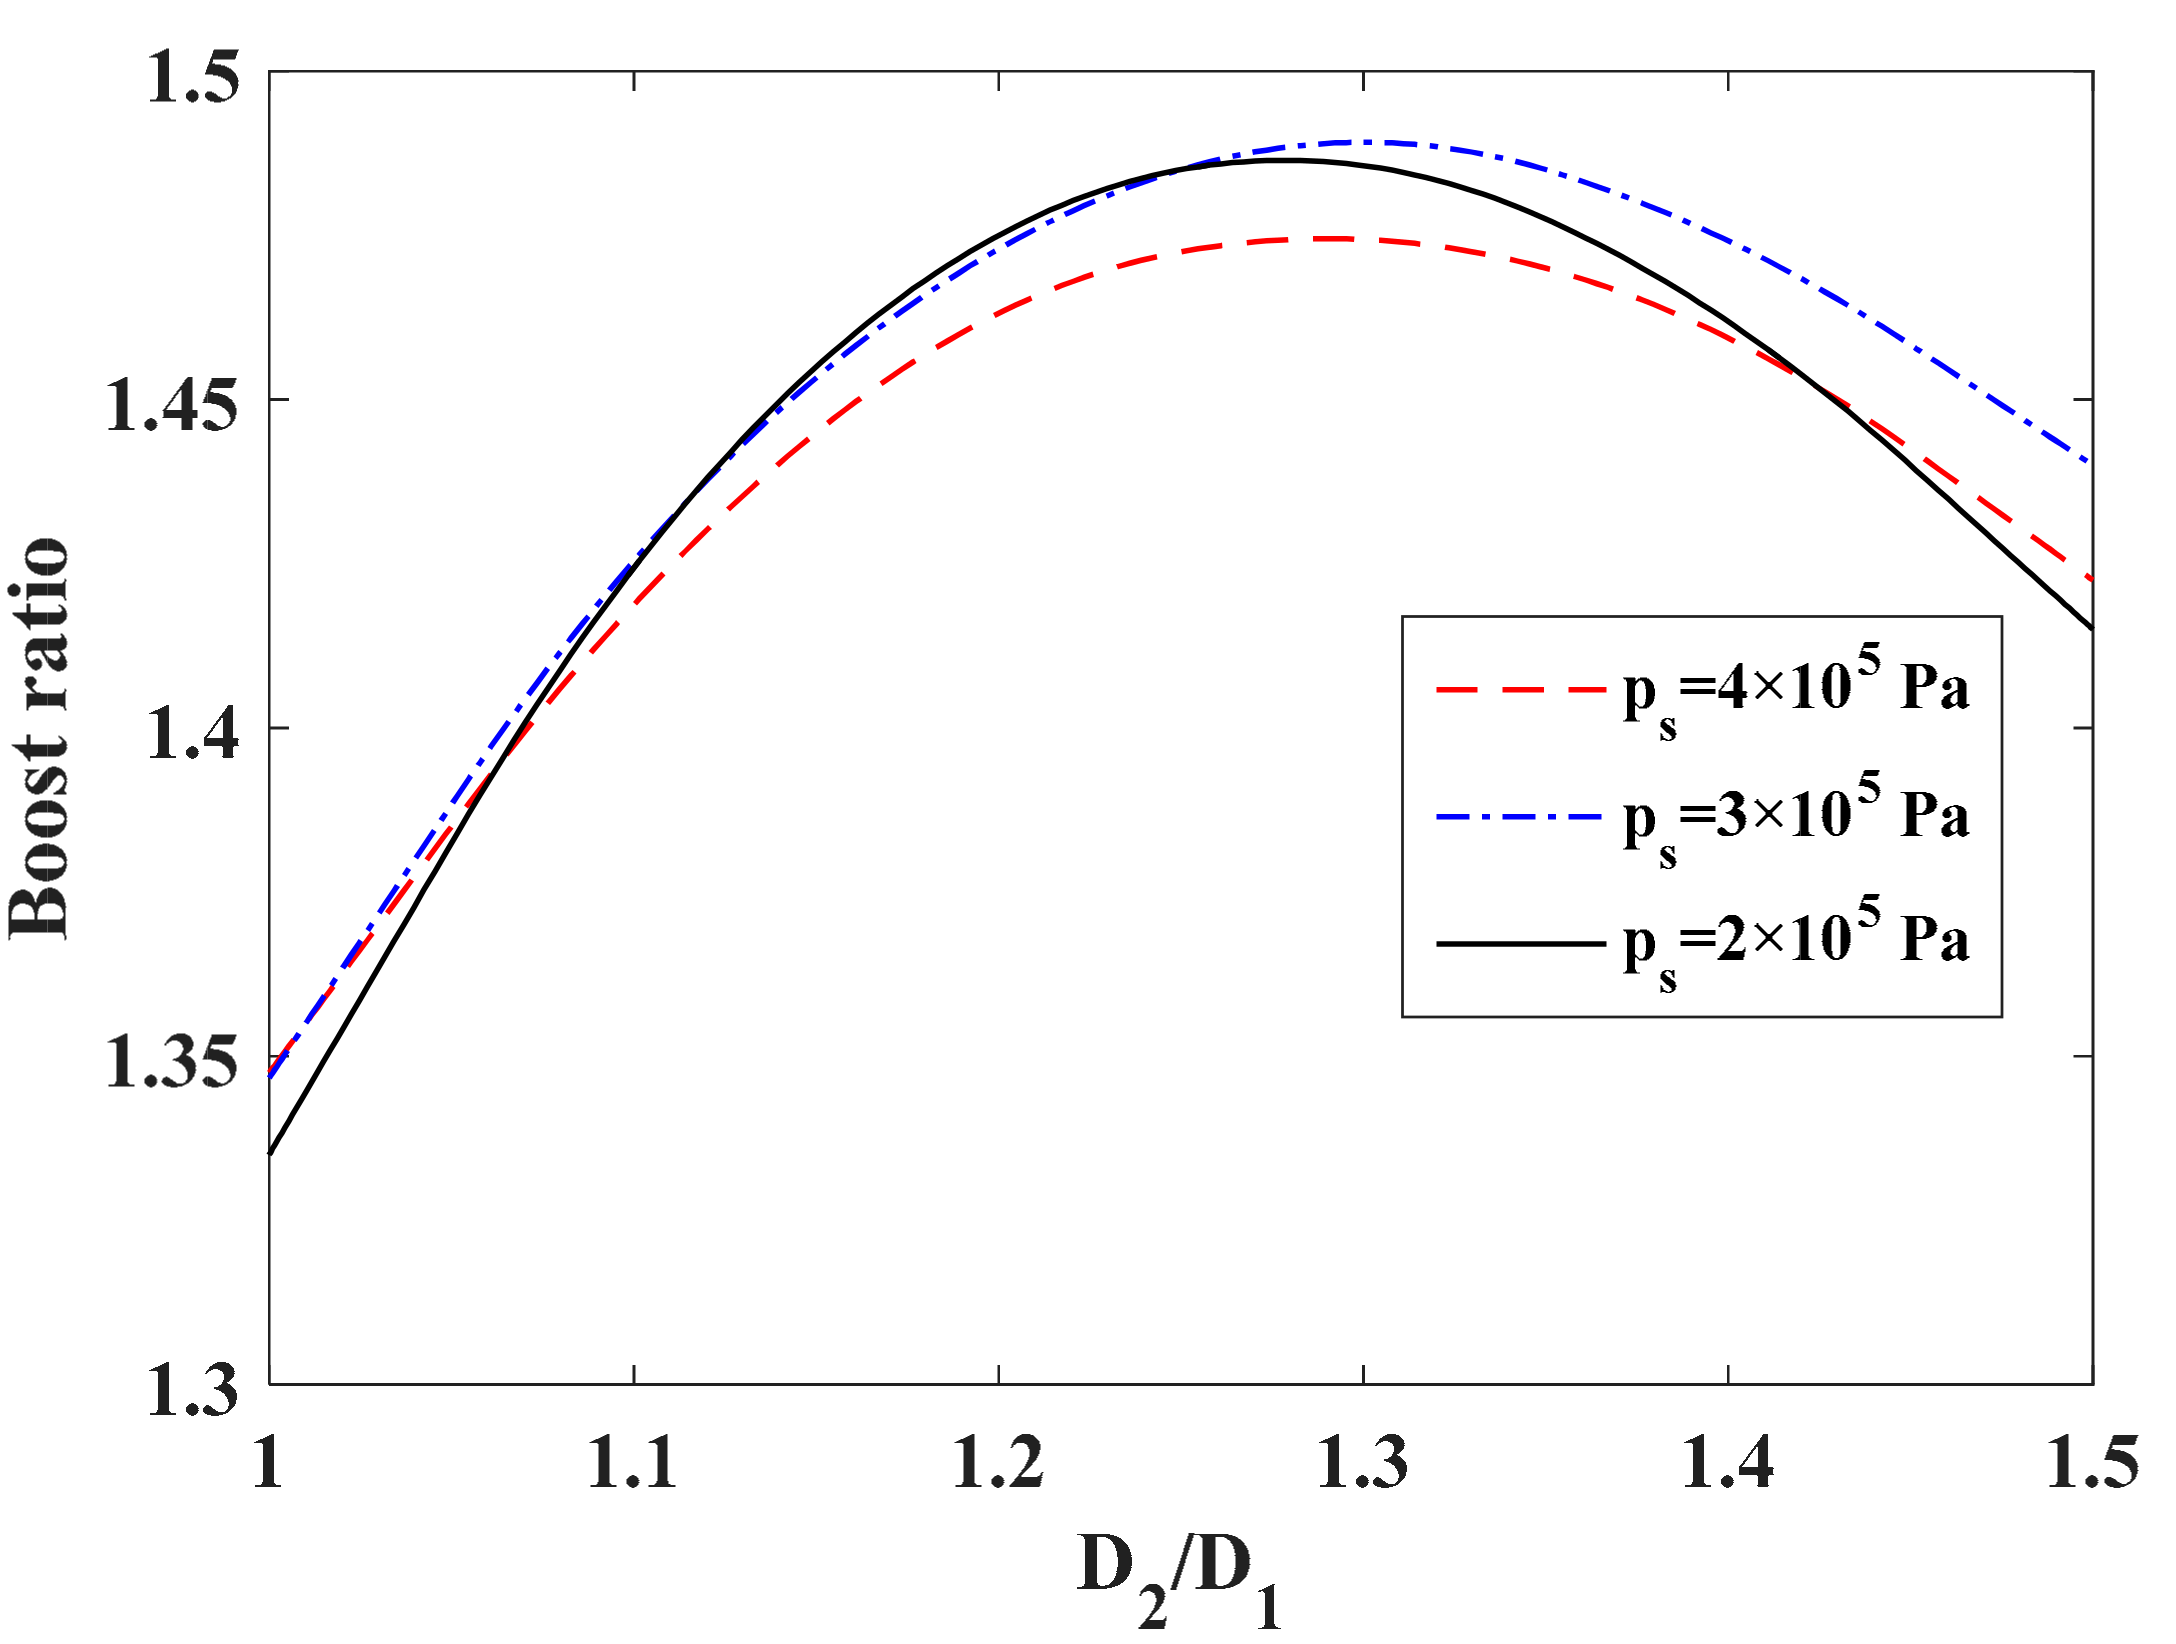
Figure 16.
Relationship between energy efficiency and diameter ratio.
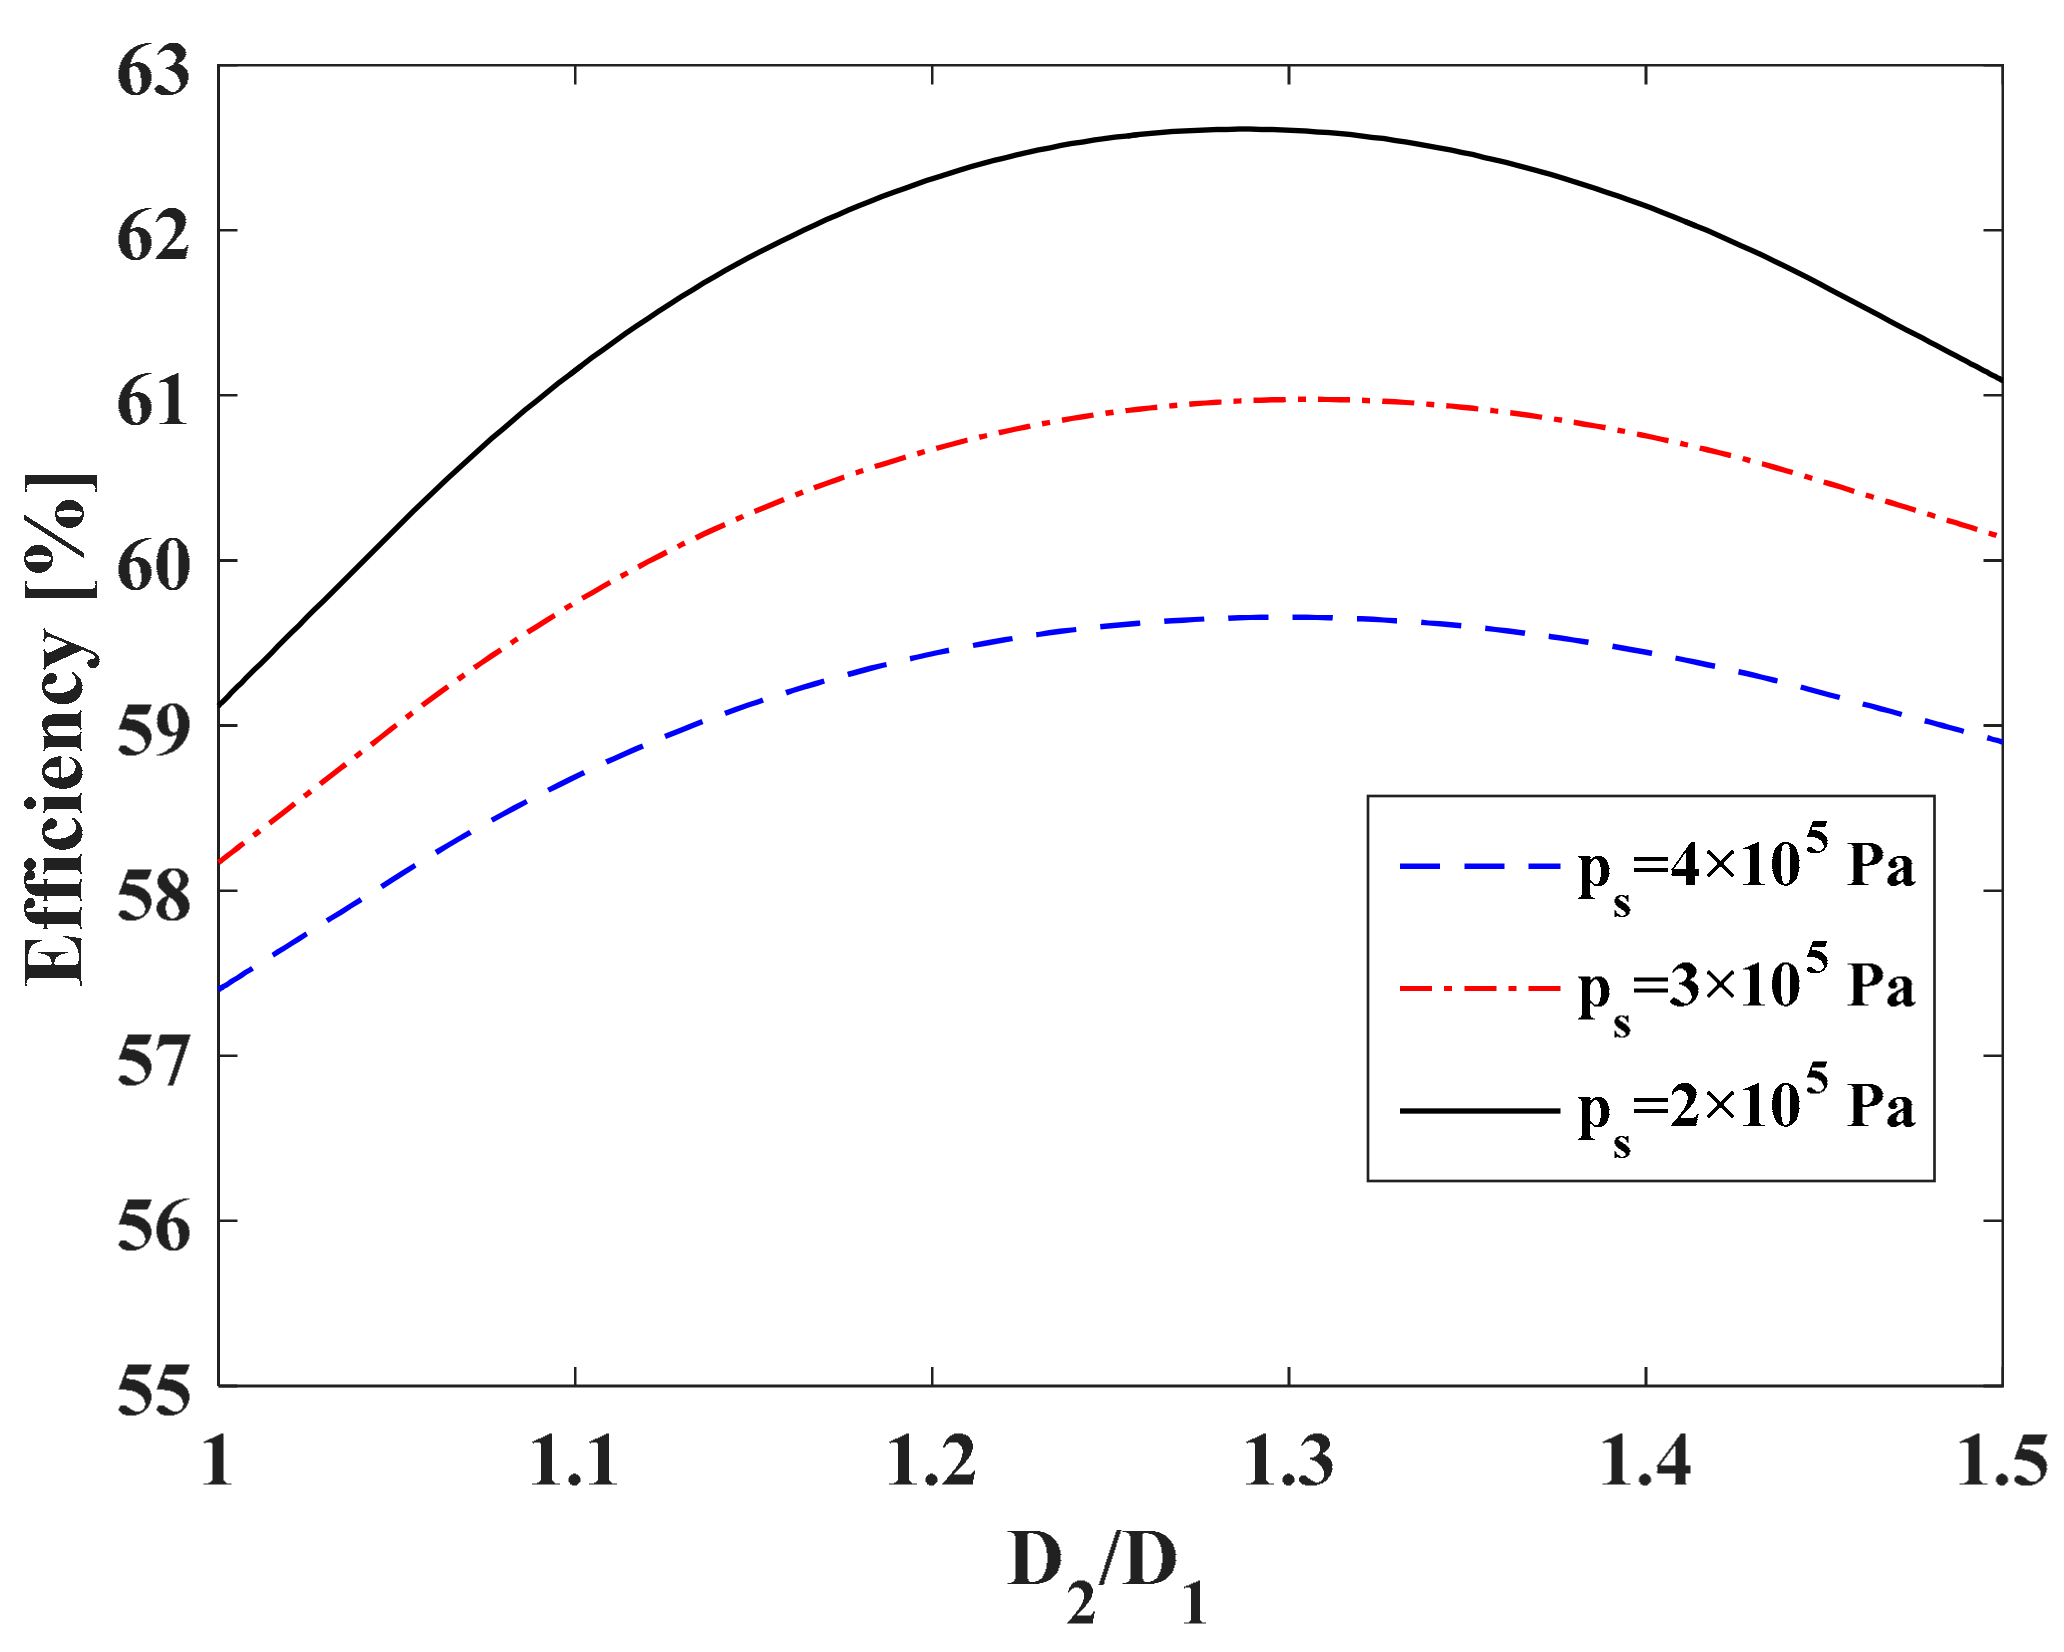
Figure 17.
Efficiency under different operating conditions.
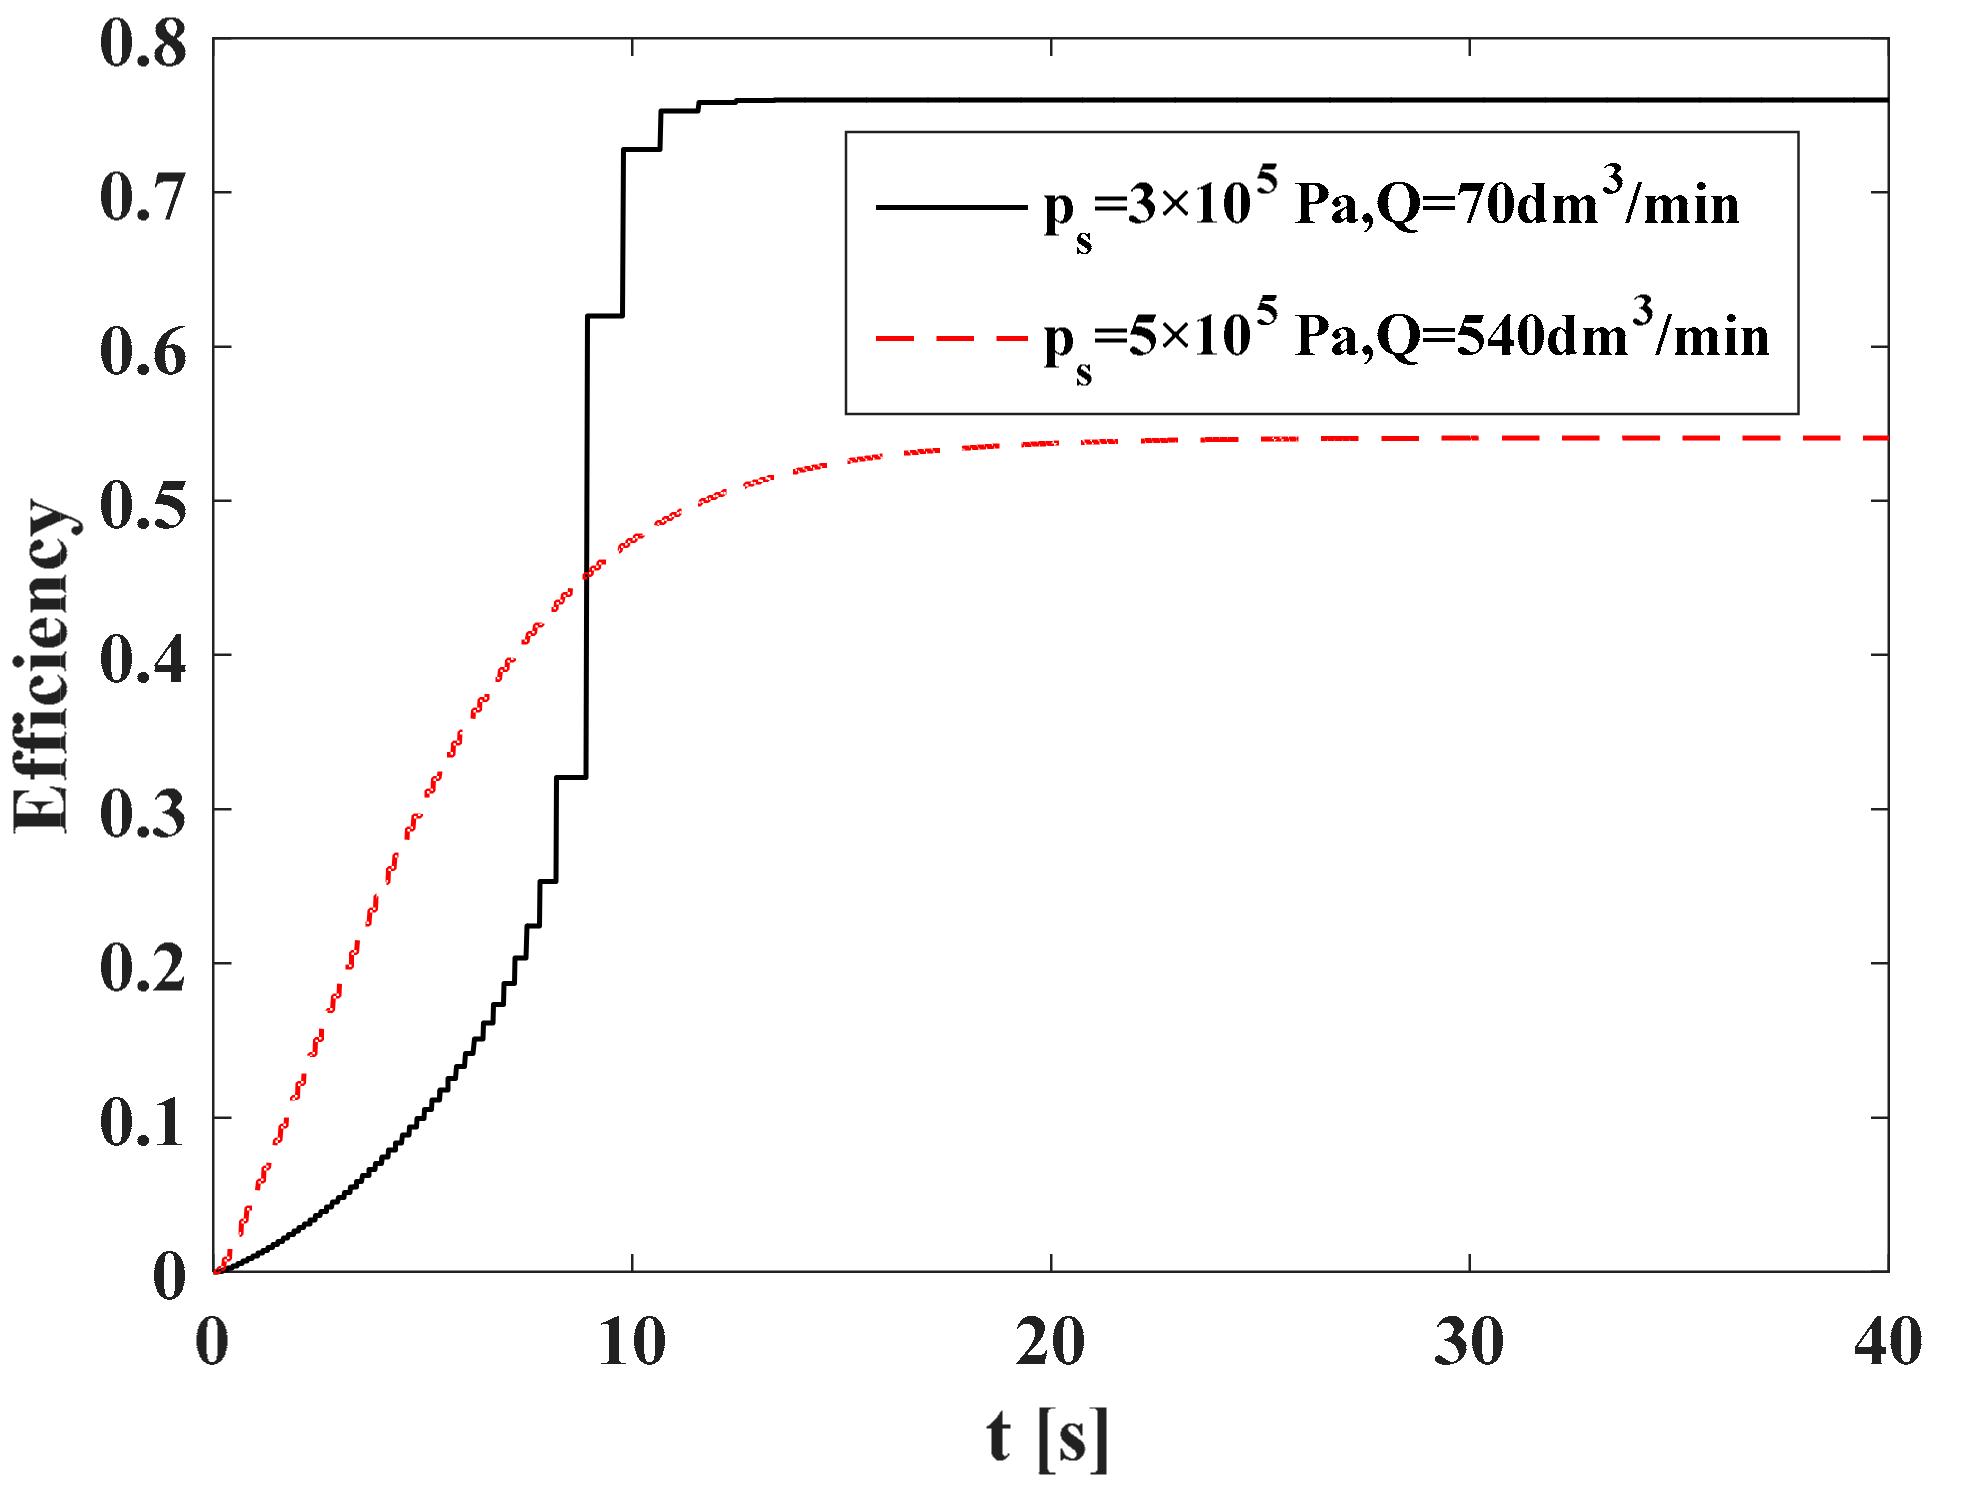
Figure 18.
Efficiency under different boost ratios.
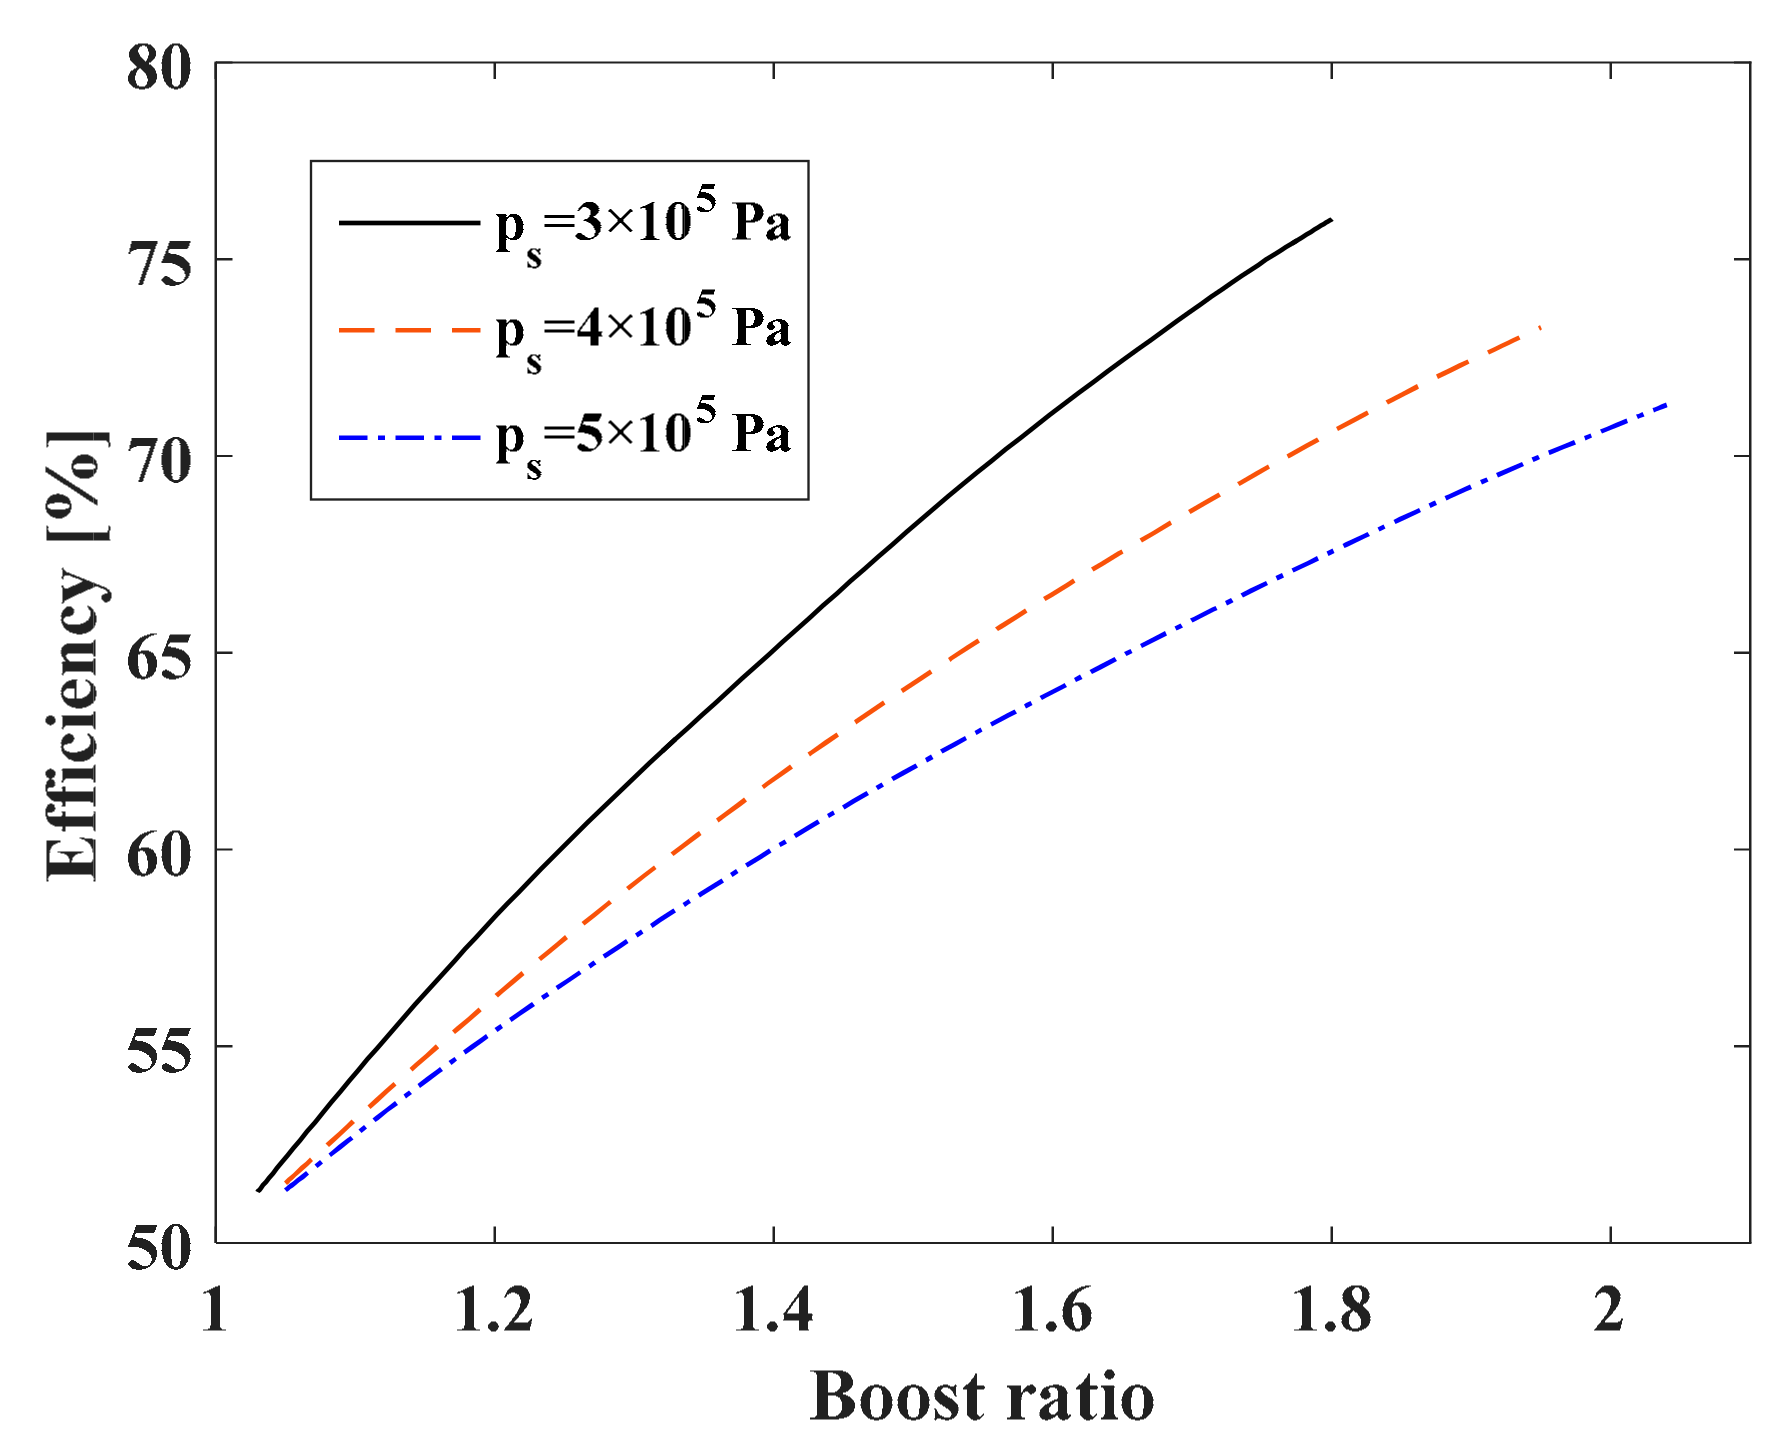
Figure 19.
Flow rate characteristics of booster regulator system.

Figure 20.
Comparison of VBA and VBA-R.

Table 1.
Main equipment and their parameters.
| Components | Model | Parameters |
|---|---|---|
| Cylinder | CDG1YL63 CG1WLN80 | L:100 mm; D:63 mm L:100 mm; D:80 mm |
| Solenoid valve | SV3200R | C:4.5 × 10⁻⁸ m3/(s·Pa); b:0.3 |
| Check valve | AKH10-00 | C:4.8 × 10⁻⁸ m3/(s·Pa); b:0.3 |
| Throttle valve | AS300 | C:2.7 × 10⁻⁸ m3/(s·Pa); b:0.2 |
| PLC | FX1s-20MR | - |
| F.R.L Units | AC40D | 800 dm3/min 0.05–0.7 MPa |
| Air power meter | APM-L-800s | 8–800 dm3/min 0–1.2 kW |
| Pressure sensor | ISE80H | 0–1.0 MPa |
| Booster regulator | VBA20A-03 | 1 m3/min 0.2–1.0 MPa |
| Tank | VBAT10A1-15 | 10 dm3 |
| DAQ card | TNS6810 | - |
Table 2.
Parameters and values used in the simulation.
| Parameters | Piston Diameter (mm) | Piston Rod Diameter (mm) | Stroke (mm) | Supply Pressure (kPa(abs)) | Atmosphere Temperature (K) | Sonic Conductance of Throttle Valve (m3/(s·Pa)) | Tank Volume (L) |
|---|---|---|---|---|---|---|---|
| VBA-R | Dba = 63, Dra = 80 | 10 | 100 | 300 | 293 | 2.79 × 10⁻⁹ | 5.0 |
© 2017 by the authors. Licensee MDPI, Basel, Switzerland. This article is an open access article distributed under the terms and conditions of the Creative Commons Attribution (CC BY) license (http://creativecommons.org/licenses/by/4.0/).
Share and Cite
MDPI and ACS Style
Yang, F.; Tadano, K.; Li, G.; Kagawa, T. Analysis of the Energy Efficiency of a Pneumatic Booster Regulator with Energy Recovery. Appl. Sci. 2017, 7, 816. https://doi.org/10.3390/app7080816
AMA Style
Yang F, Tadano K, Li G, Kagawa T. Analysis of the Energy Efficiency of a Pneumatic Booster Regulator with Energy Recovery. Applied Sciences. 2017; 7(8):816. https://doi.org/10.3390/app7080816
Chicago/Turabian StyleYang, Fan, Kotaro Tadano, Gangyan Li, and Toshiharu Kagawa. 2017. "Analysis of the Energy Efficiency of a Pneumatic Booster Regulator with Energy Recovery" Applied Sciences 7, no. 8: 816. https://doi.org/10.3390/app7080816
Note that from the first issue of 2016, this journal uses article numbers instead of page numbers. See further details here.