An Experimental Study on Hysteresis Characteristics of a Pneumatic Braking System for a Multi-Axle Heavy Vehicle in Emergency Braking Situations


Abstract
:Featured Application
Abstract
1. Introduction
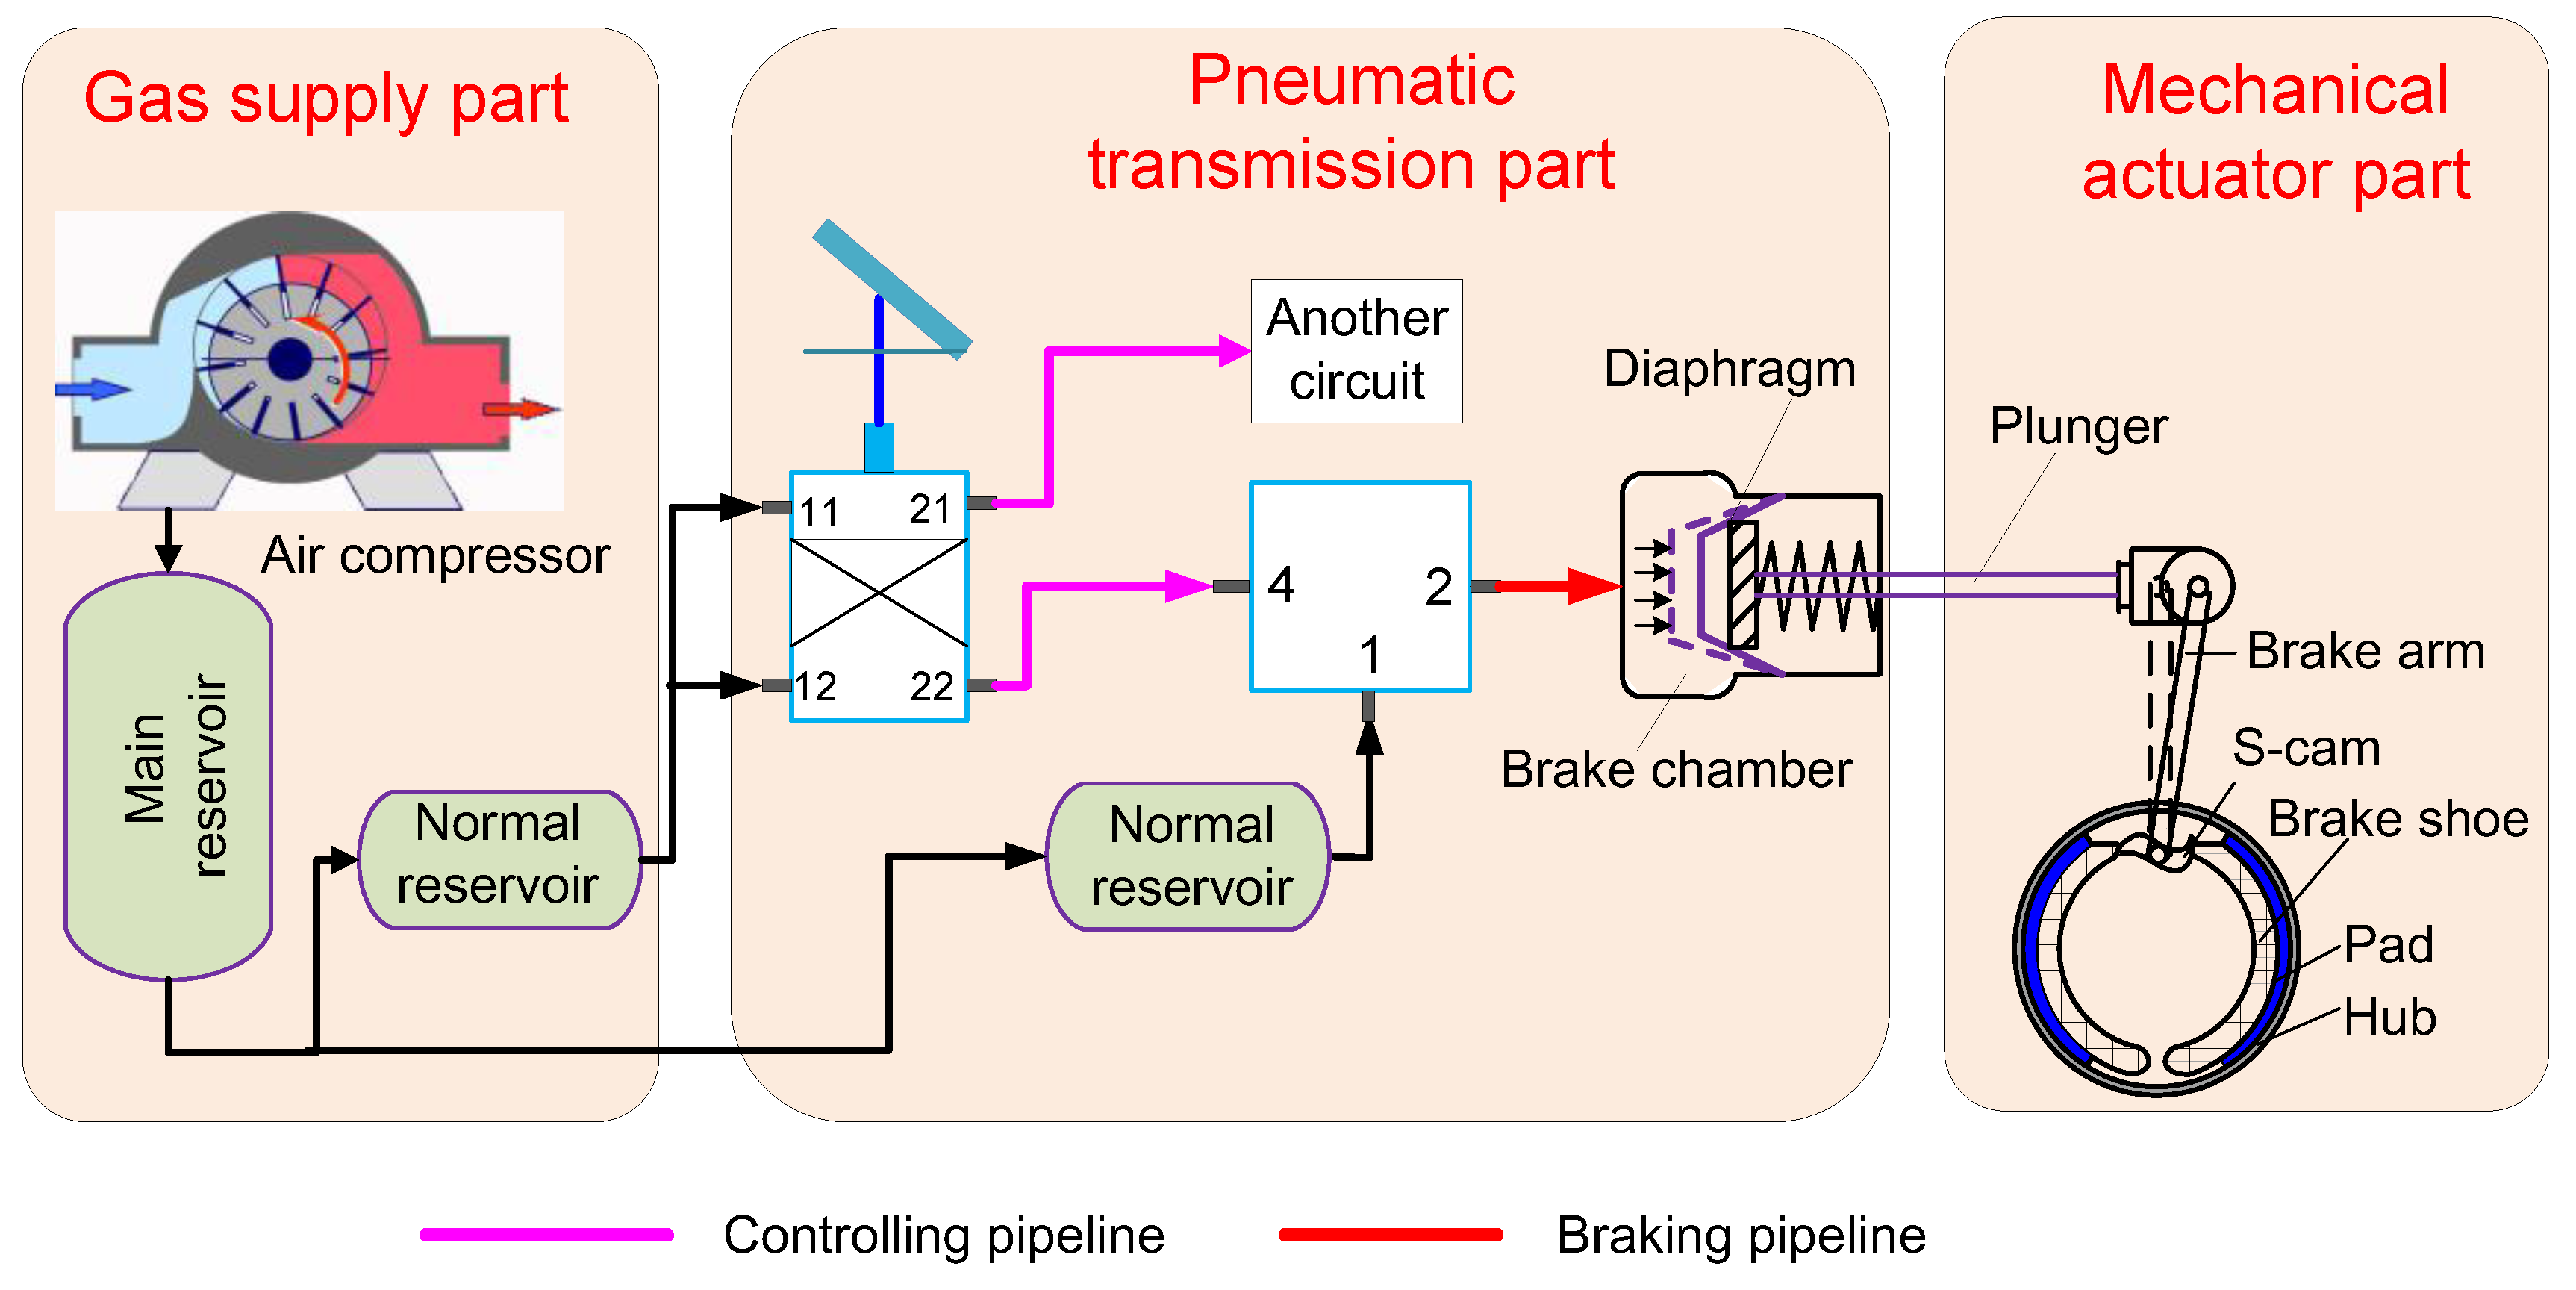
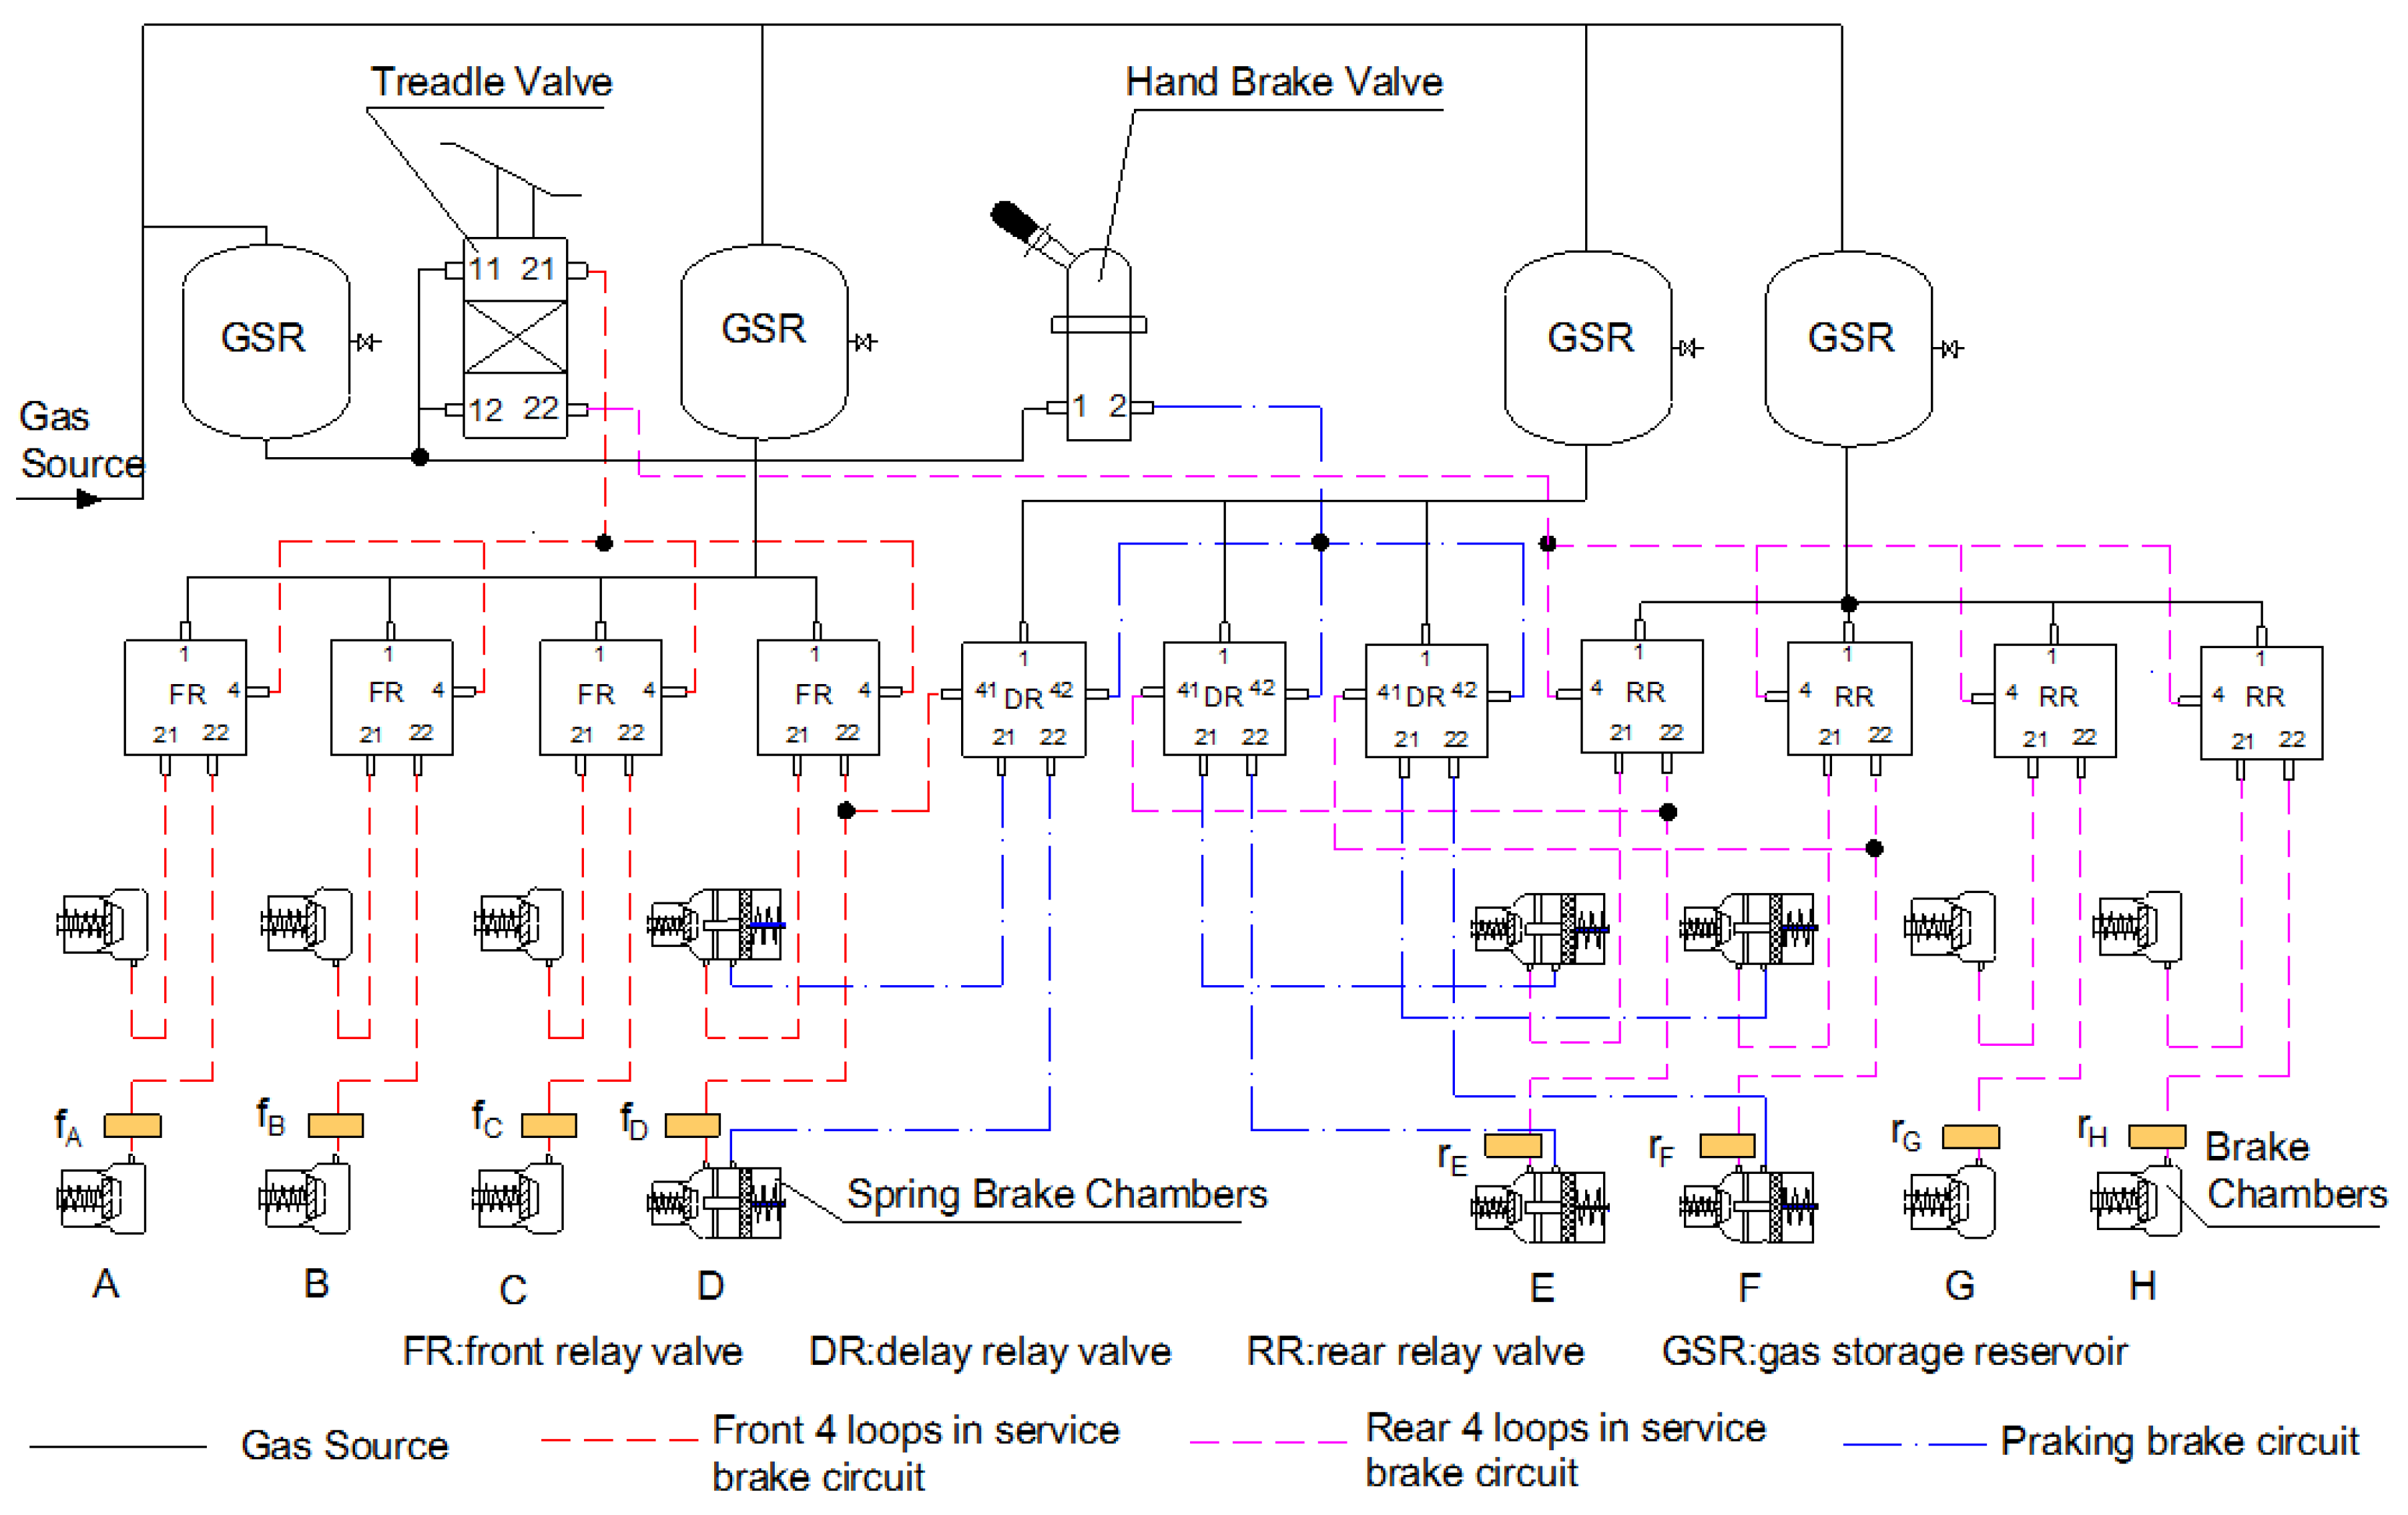
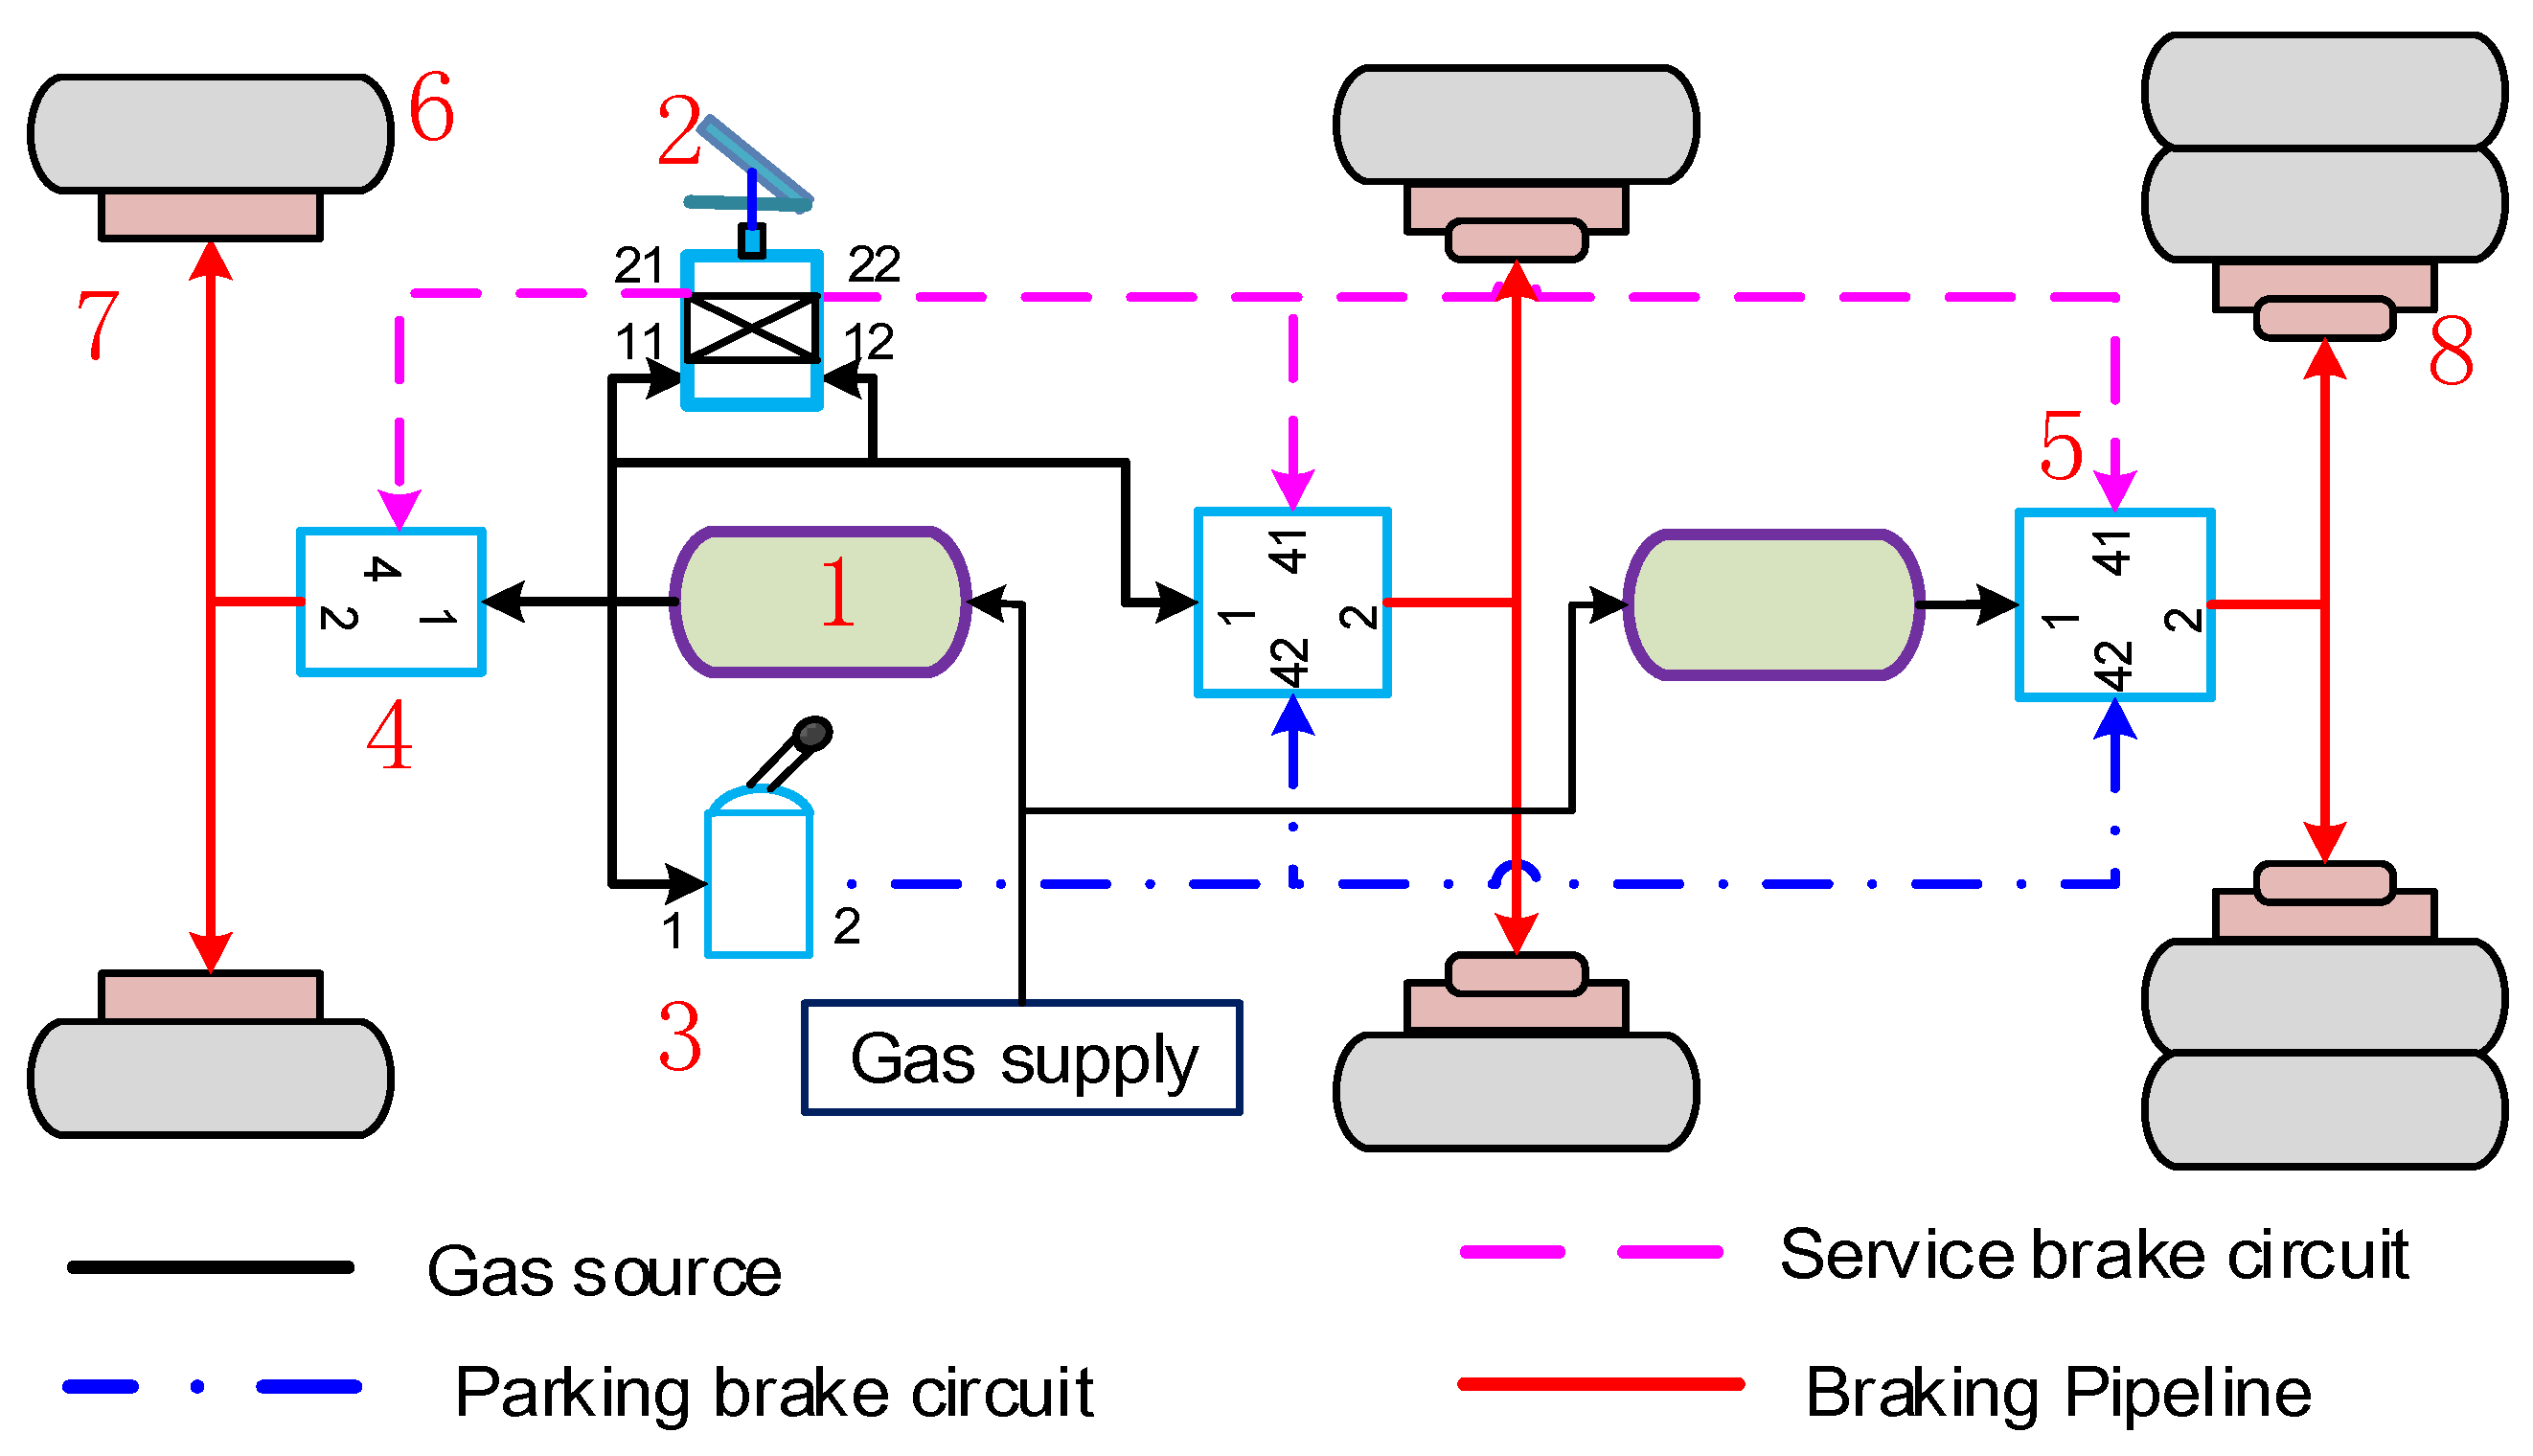
2. System Principle
3. Test System Design
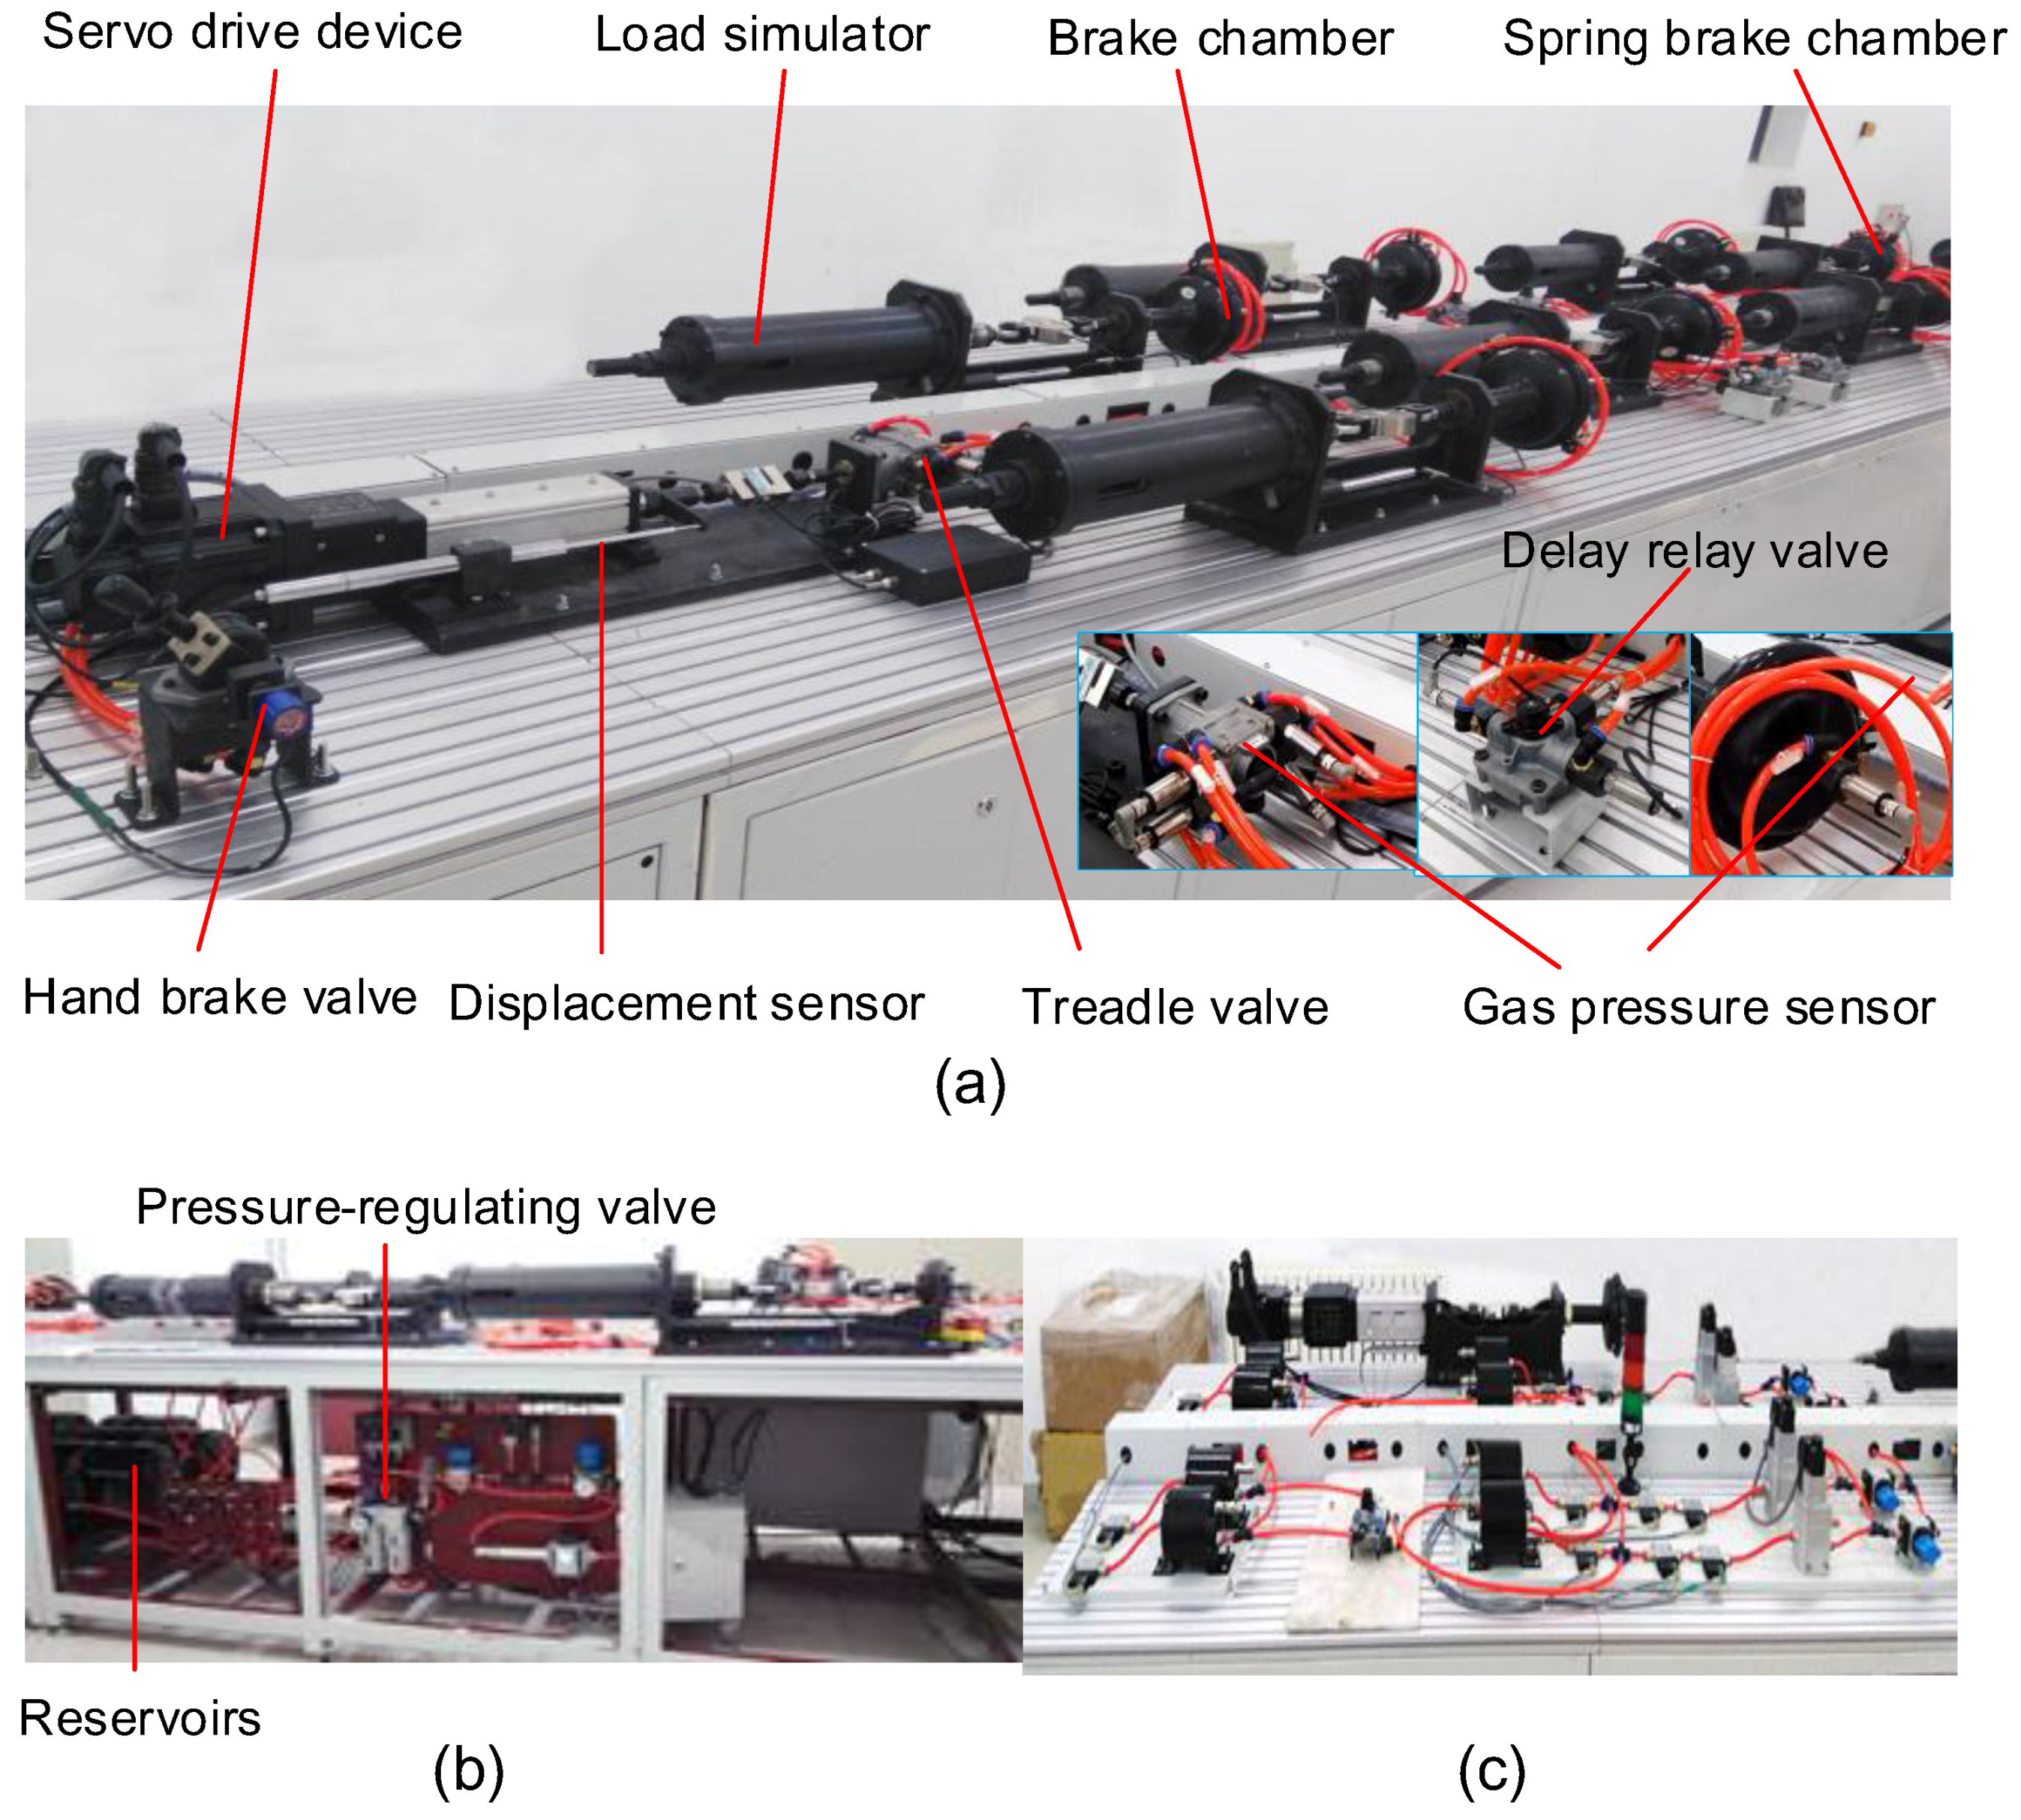
3.1. General Setup
- (1)
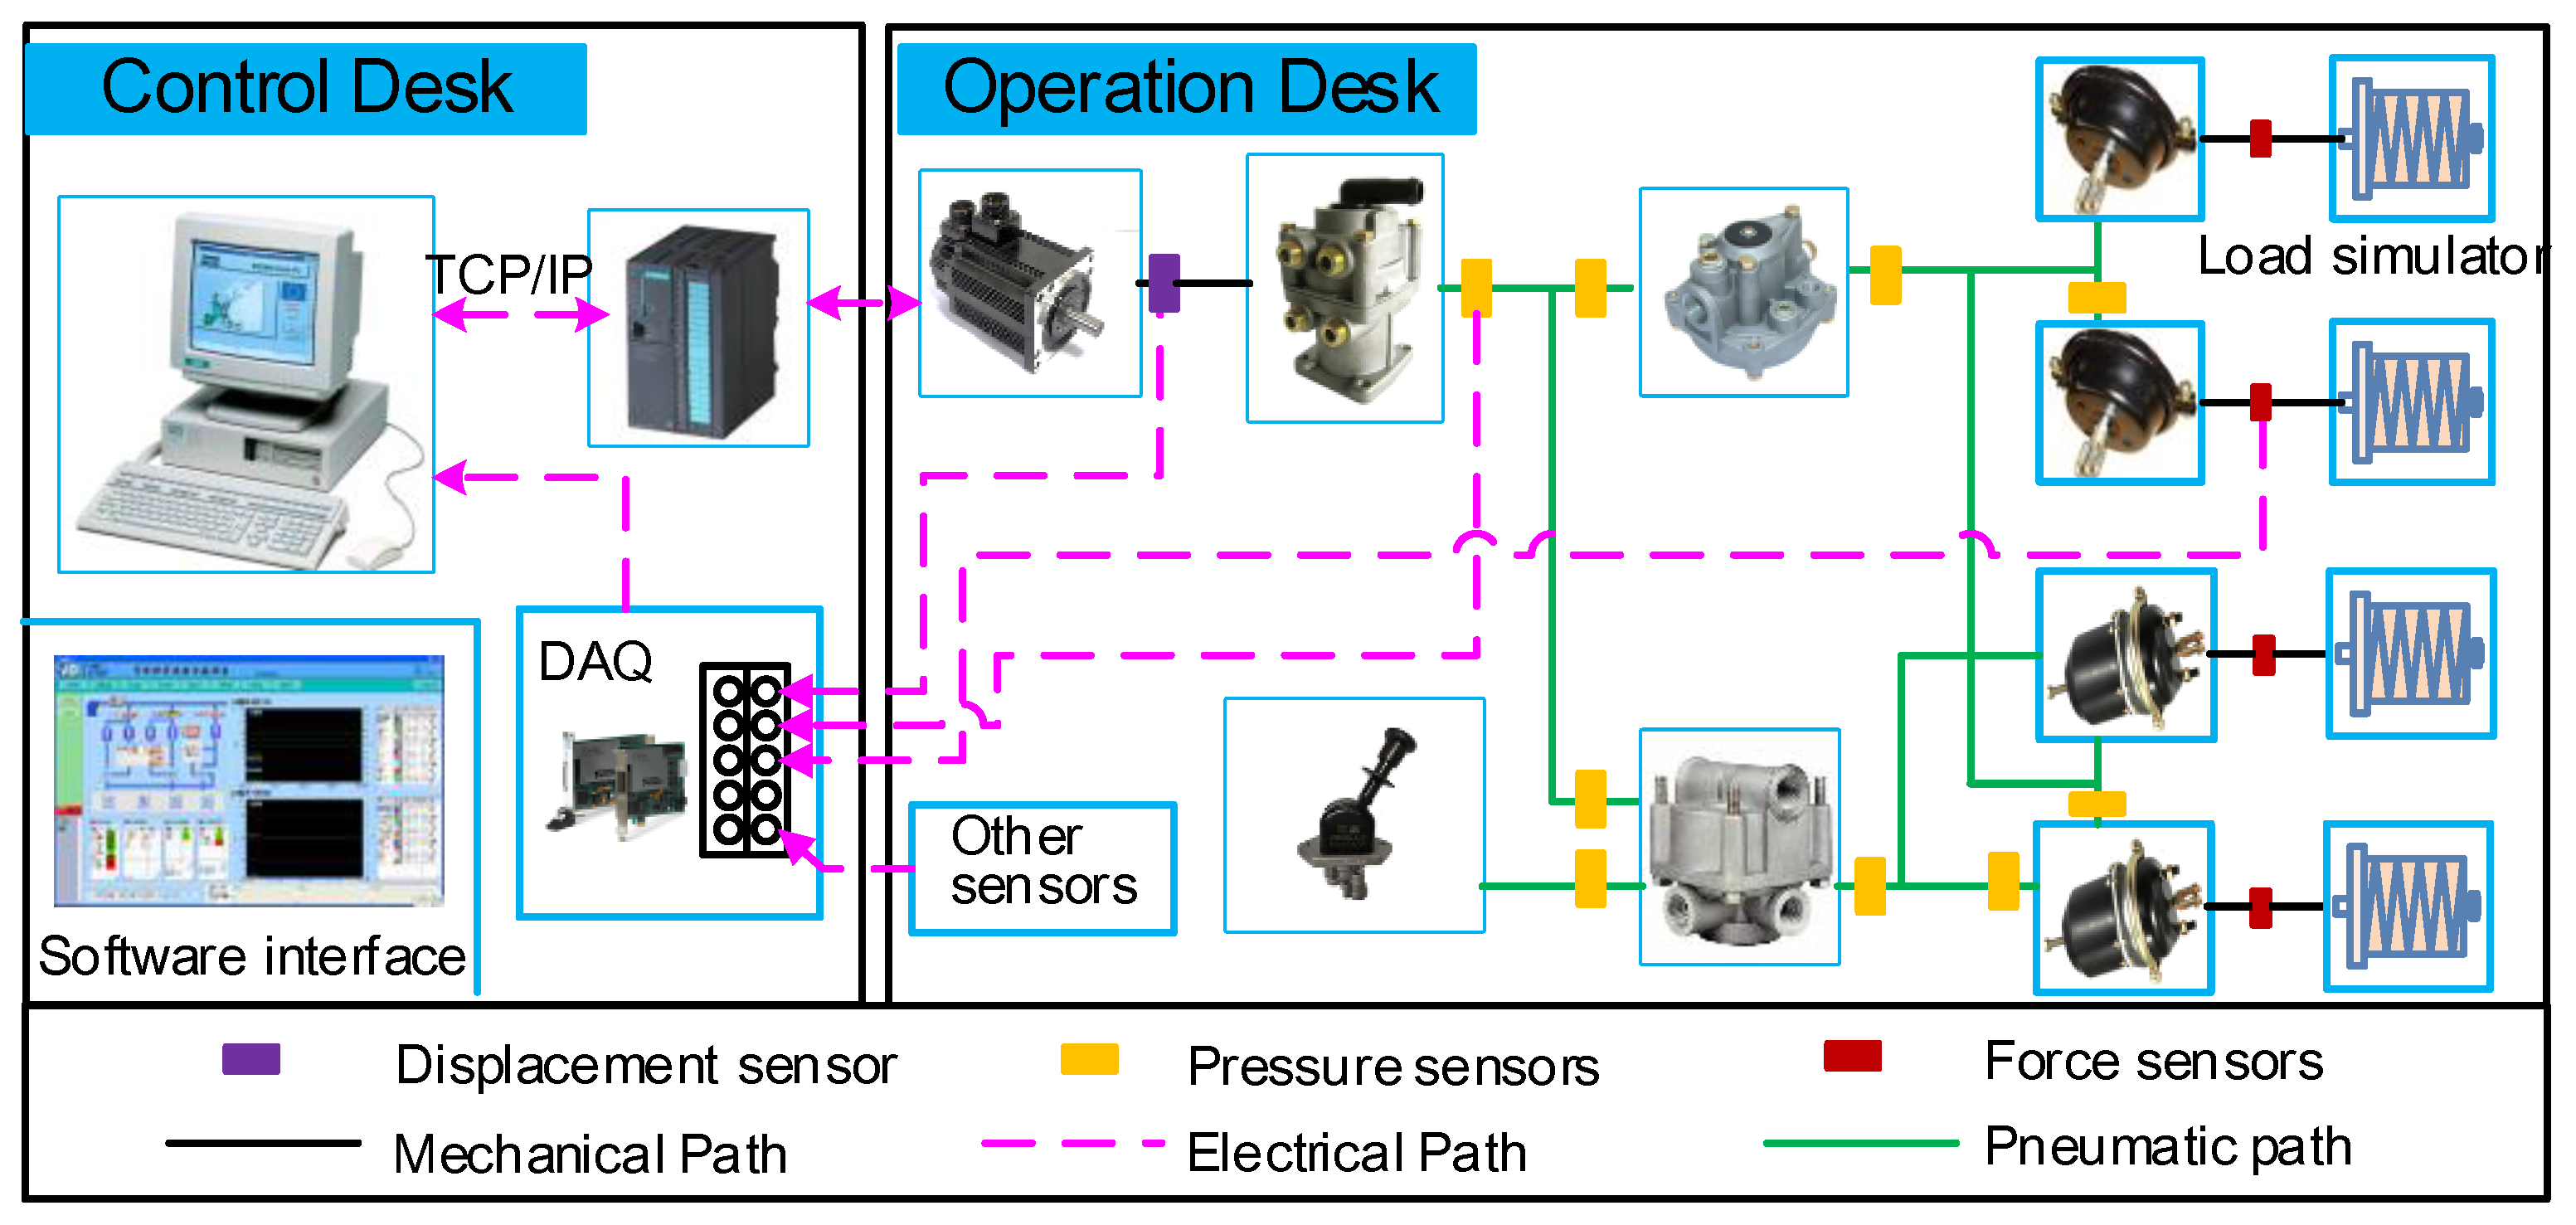
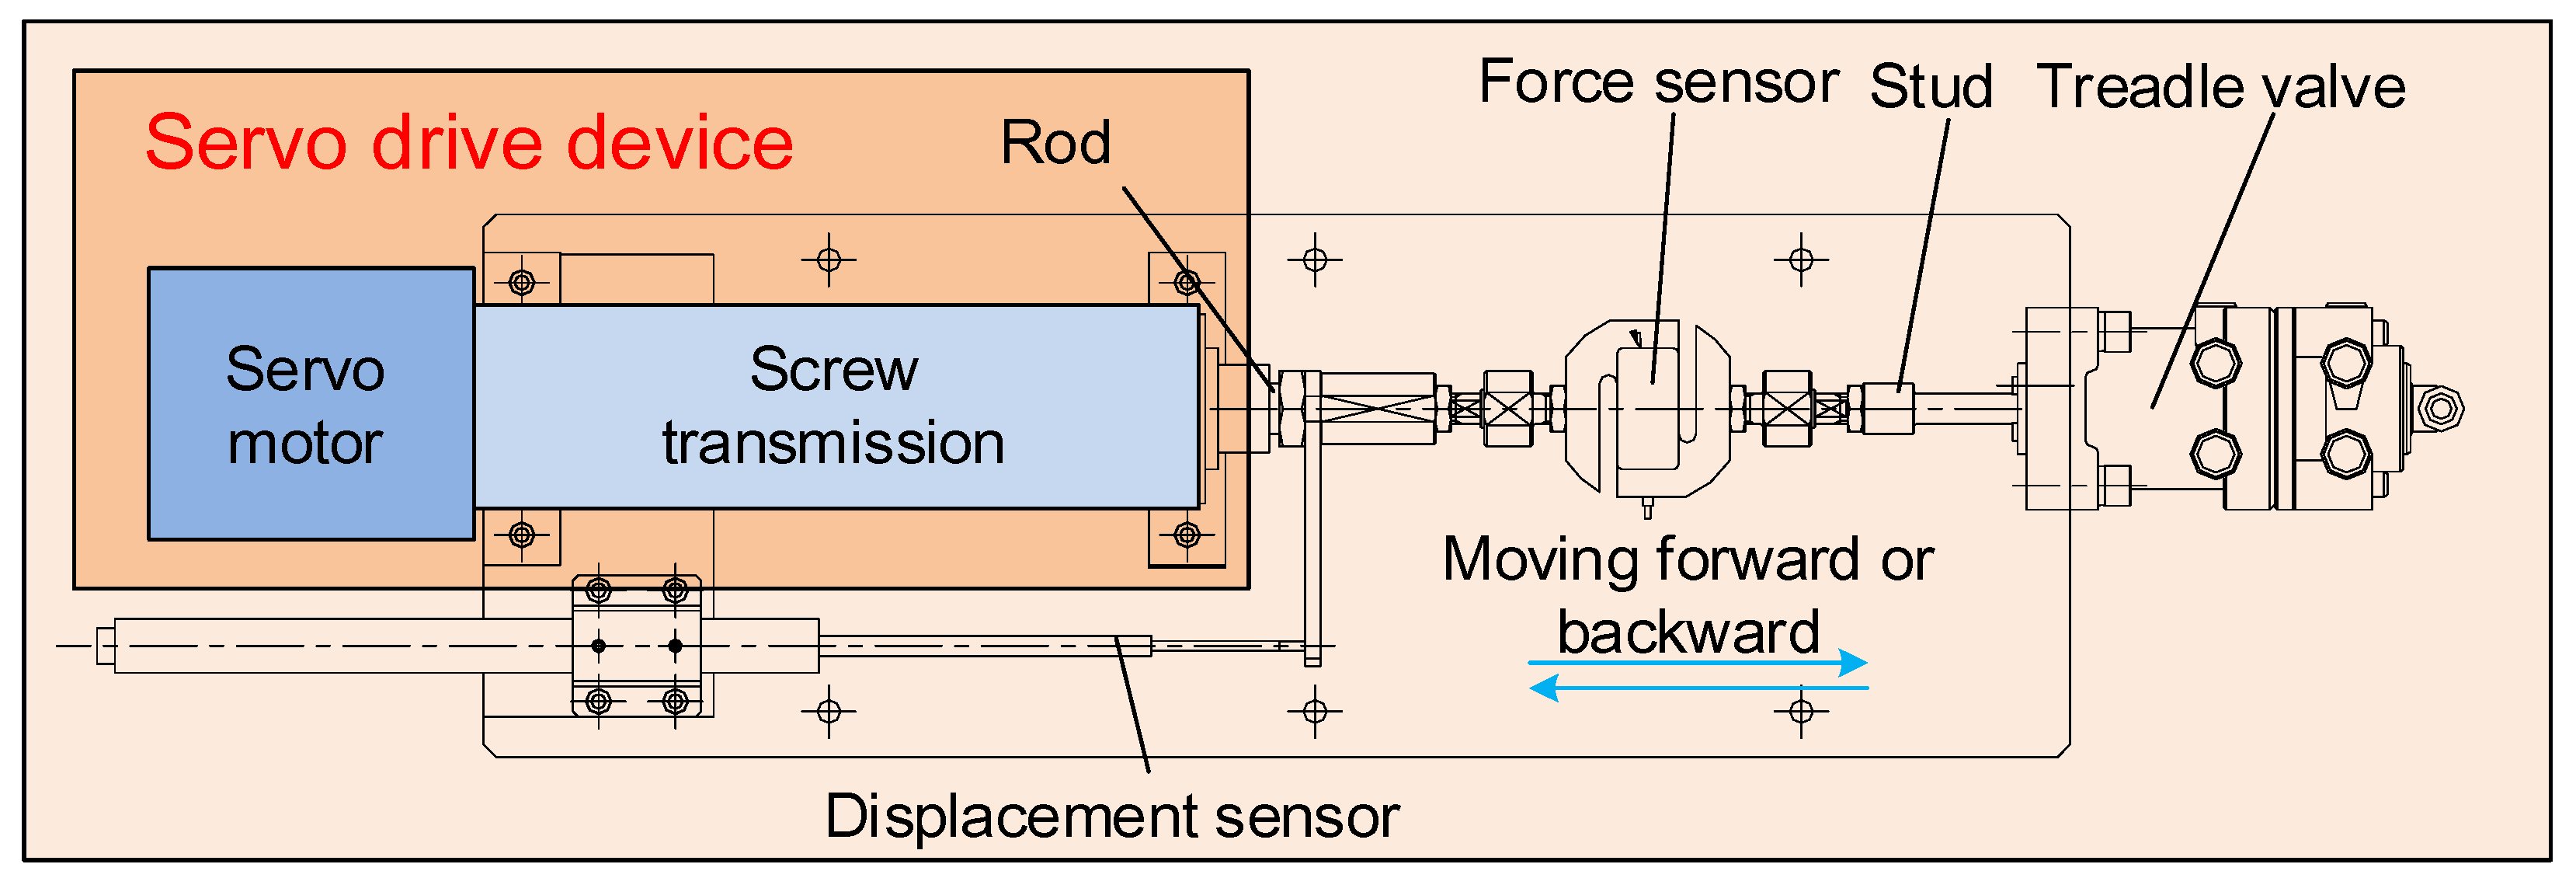
- The operation desk consists of gas supply devices, servo drive device, valves, pipelines, and load simulators; the test bench is shown in Figure 4. The gas supply device consists of several reservoirs and a pressure-regulating valve used for setting the working pressure of the system, as displayed in Figure 4b. A low-friction and high-precision linear servo drive device is used to drive the treadle valve, so as to accurately simulate the driver’s intensions expressed by pedal opening and moving speed. It is composed of a servo motor and screw transmission, as shown in Figure 5. Sixteen load simulators (manual control) made up of disc springs are applied to simulate different load torques of 16 wheels. The force sensor arranged between the brake chamber and load simulator is used for detecting the brake force. In order to avoid function failure or error accumulation of subassemblies, these used key pneumatic components are calibrated beforehand on a specific test bench, as shown in Figure 4c.
- (2)
- The control desk is composed of hardware and software. The hardware includes an Advantech 610H industrial personal computer (IPC) (Advantech, Taipei, China), a Panasonic programmable logic controller (PLC) ( Panasonic, Osaka, Japan), NI PCI-6229 data acquisition (DAQ) cards (National Instruments, Austin, TX, USA) and fast-response sensors. Communication between the PLC and the host computer is implemented through the object linking and embedding for process control (OPC) protocol using the transmission control protocol (TCP)/internet protocol (IP) interface. The test software is developed on the NI LabVIEW platform (version 14.0, National Instruments, Austin, TX, USA, 2014). The software has rich functions such as convenient data acquisition, processing, preservation and real-time display.
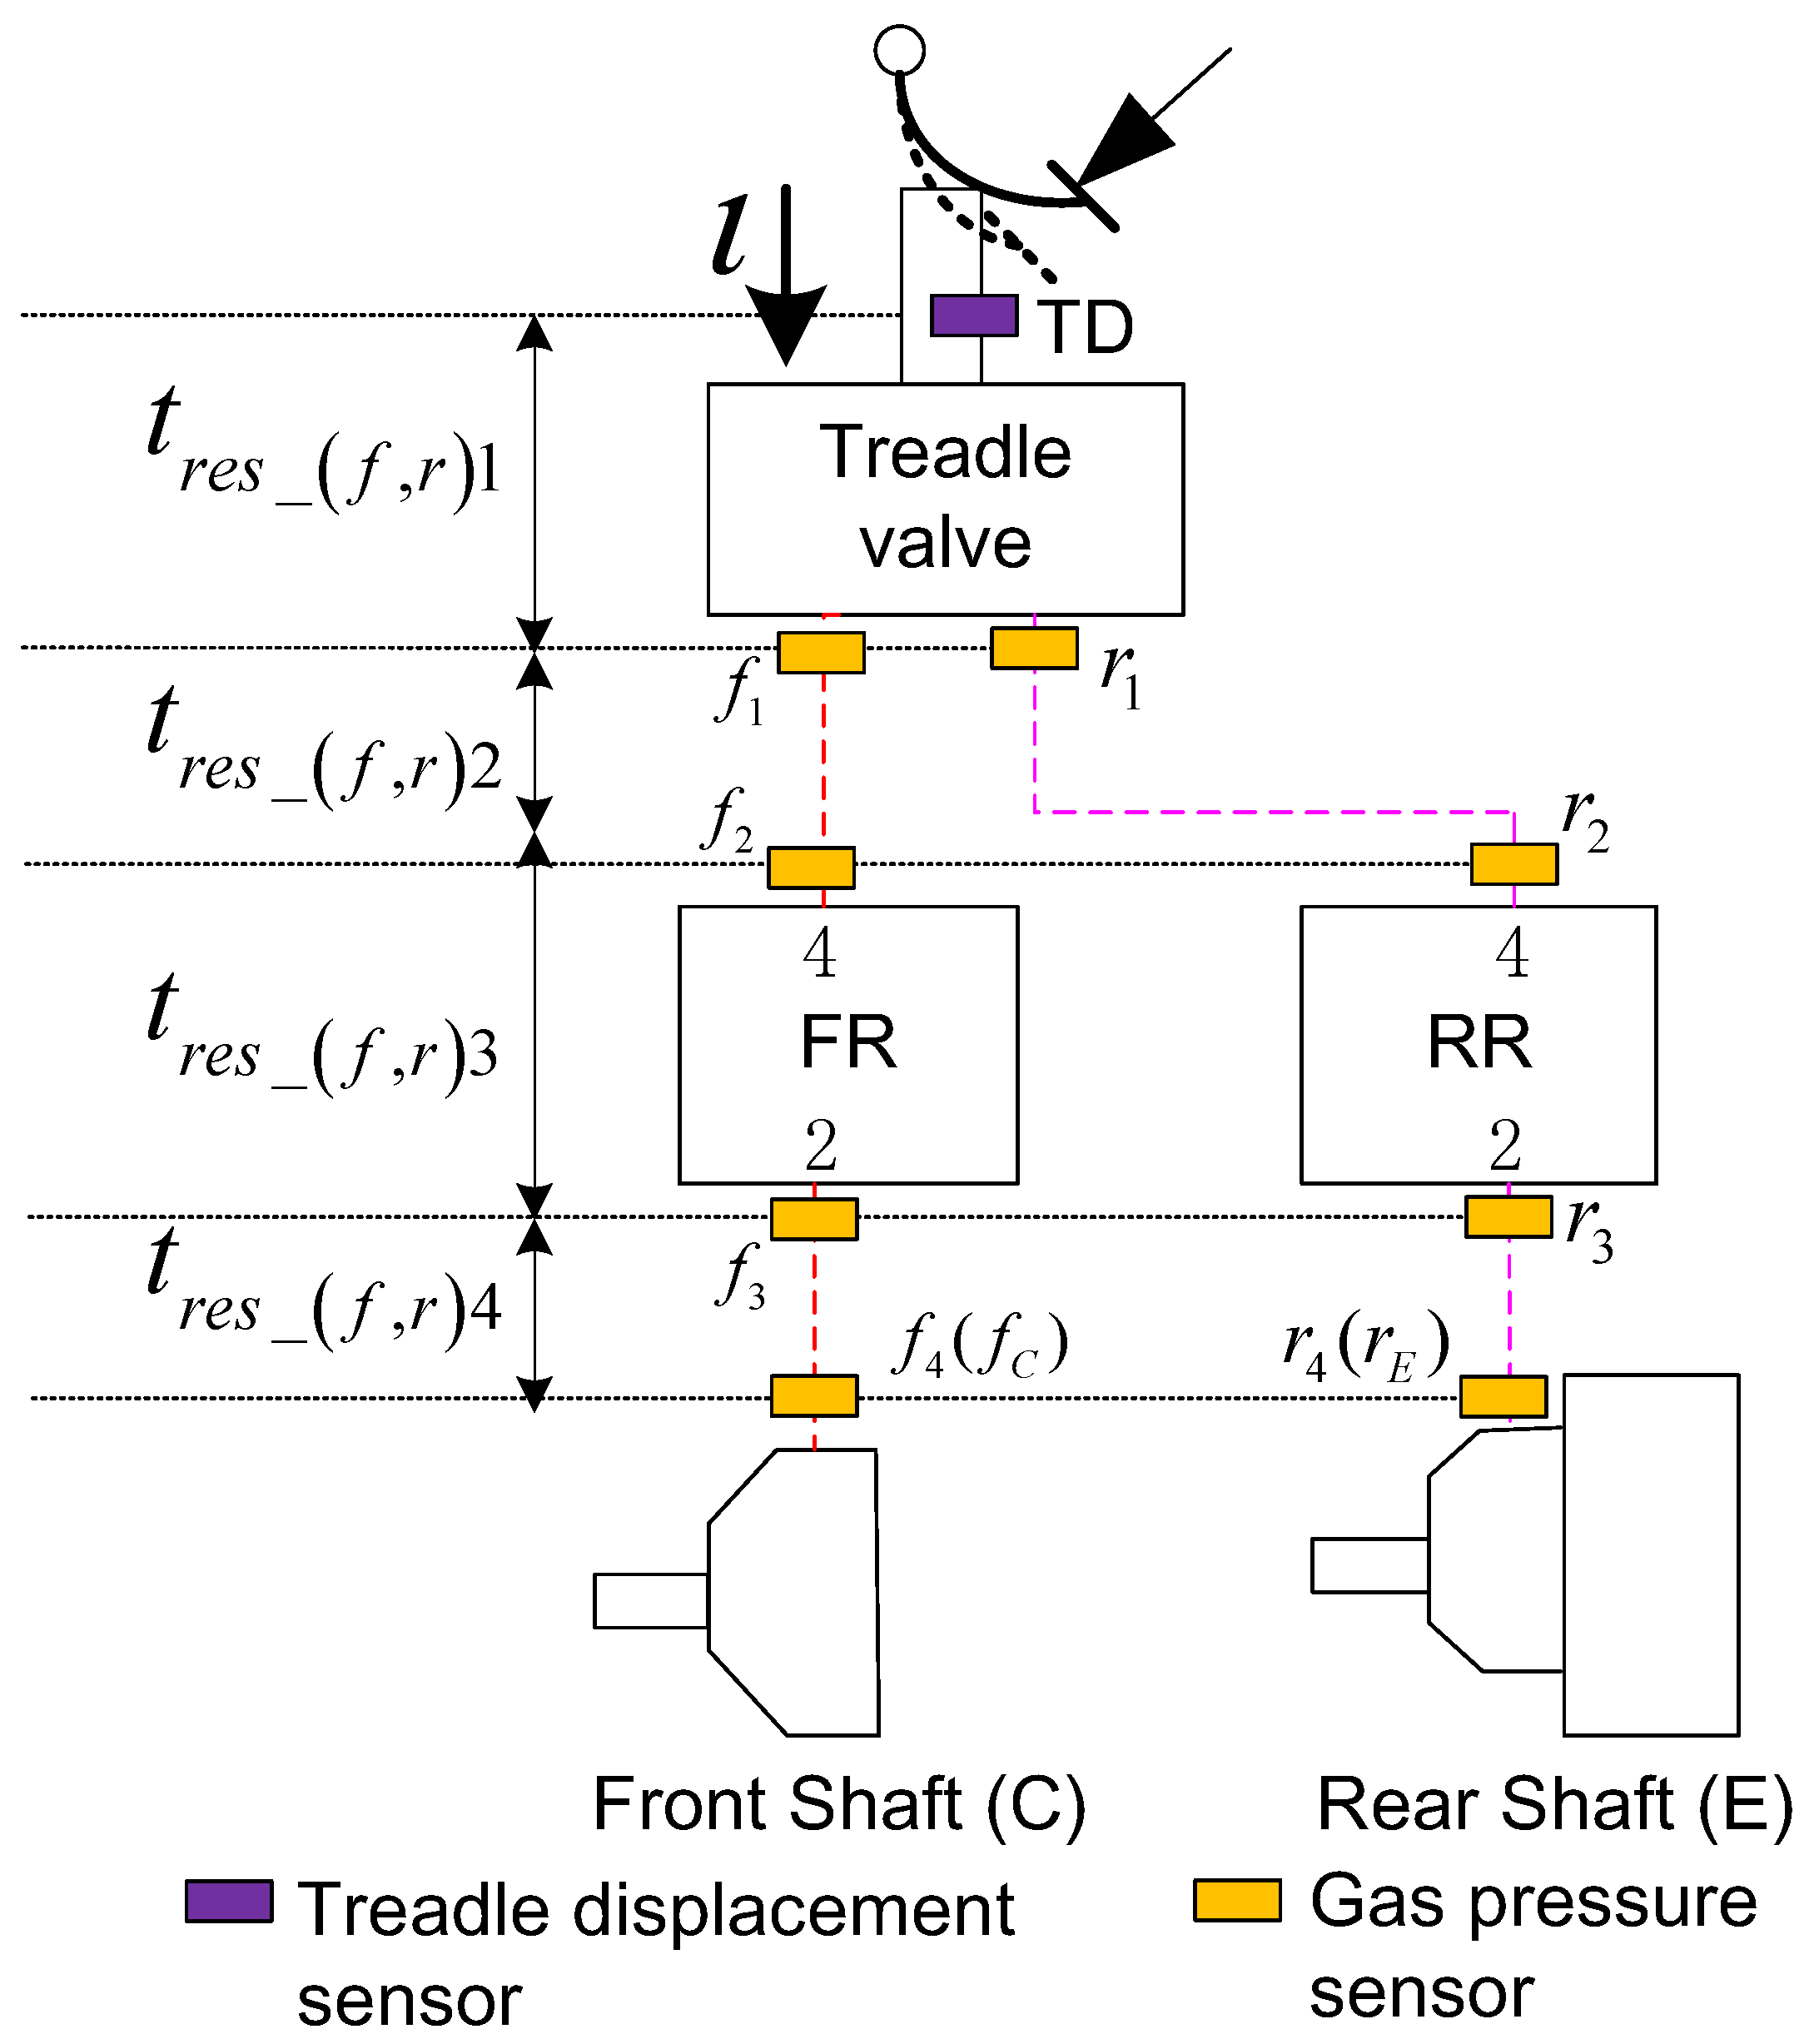
3.2. Arrangement of Sensors
3.3. Key Parameters of the Test Bench
3.4. Testing Conditions
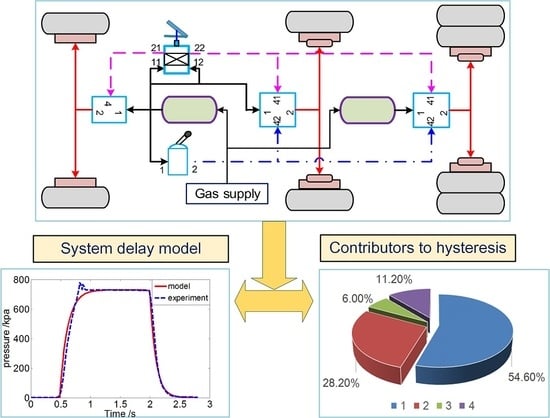
4. Results and Discussion
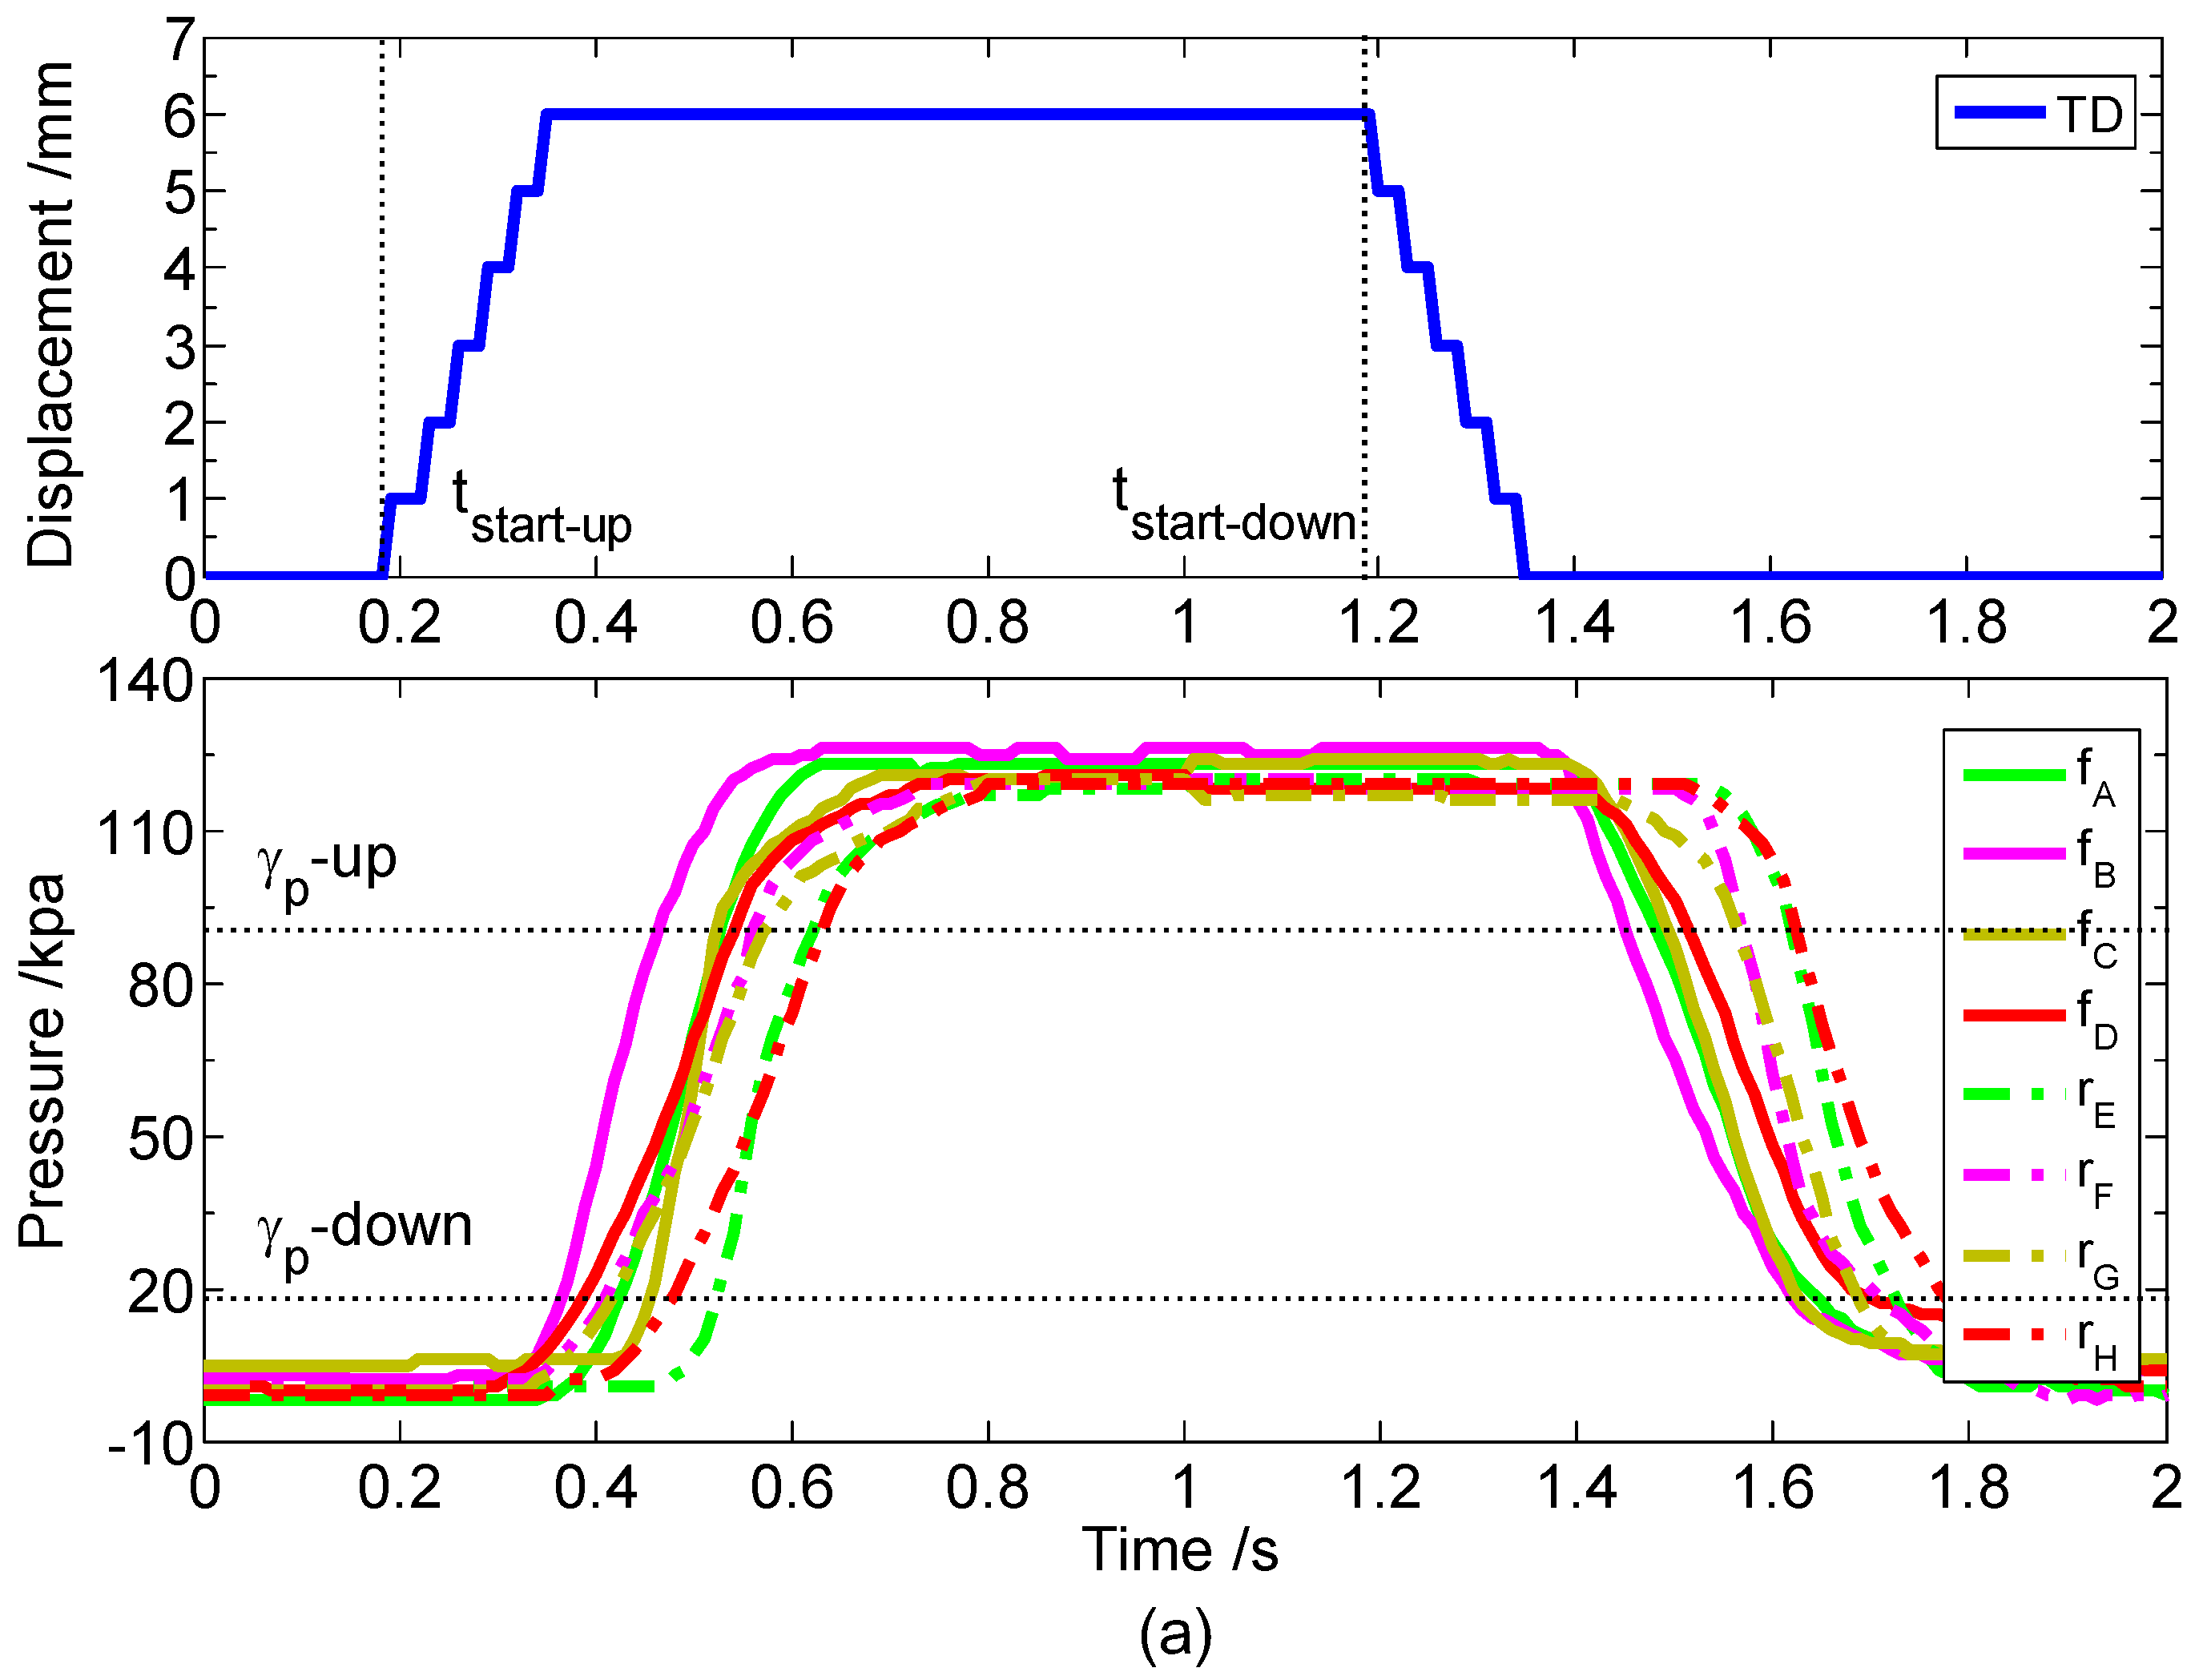
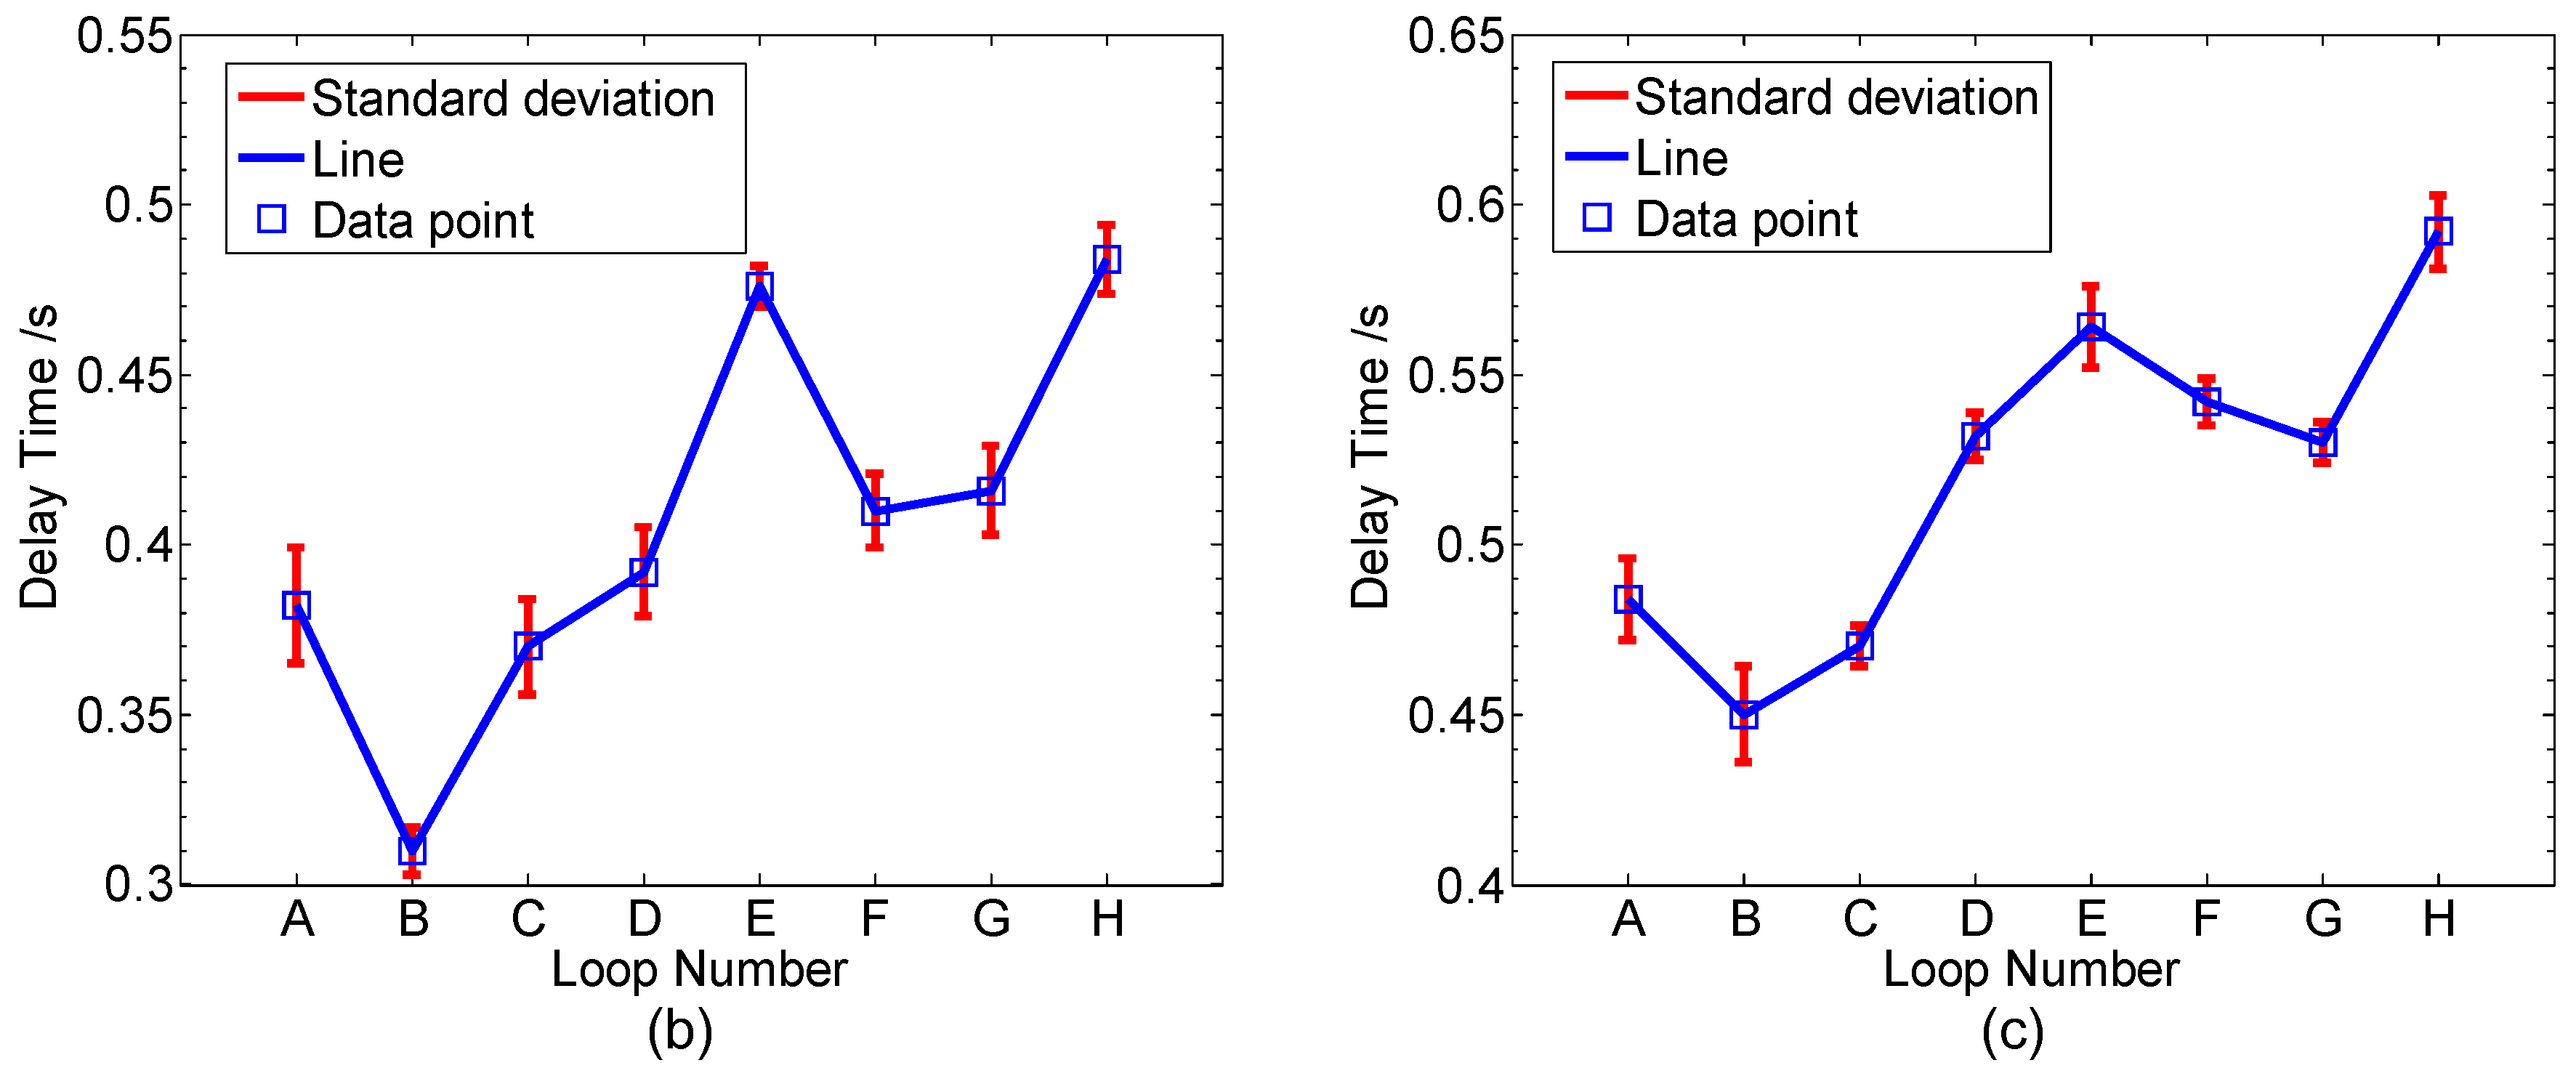
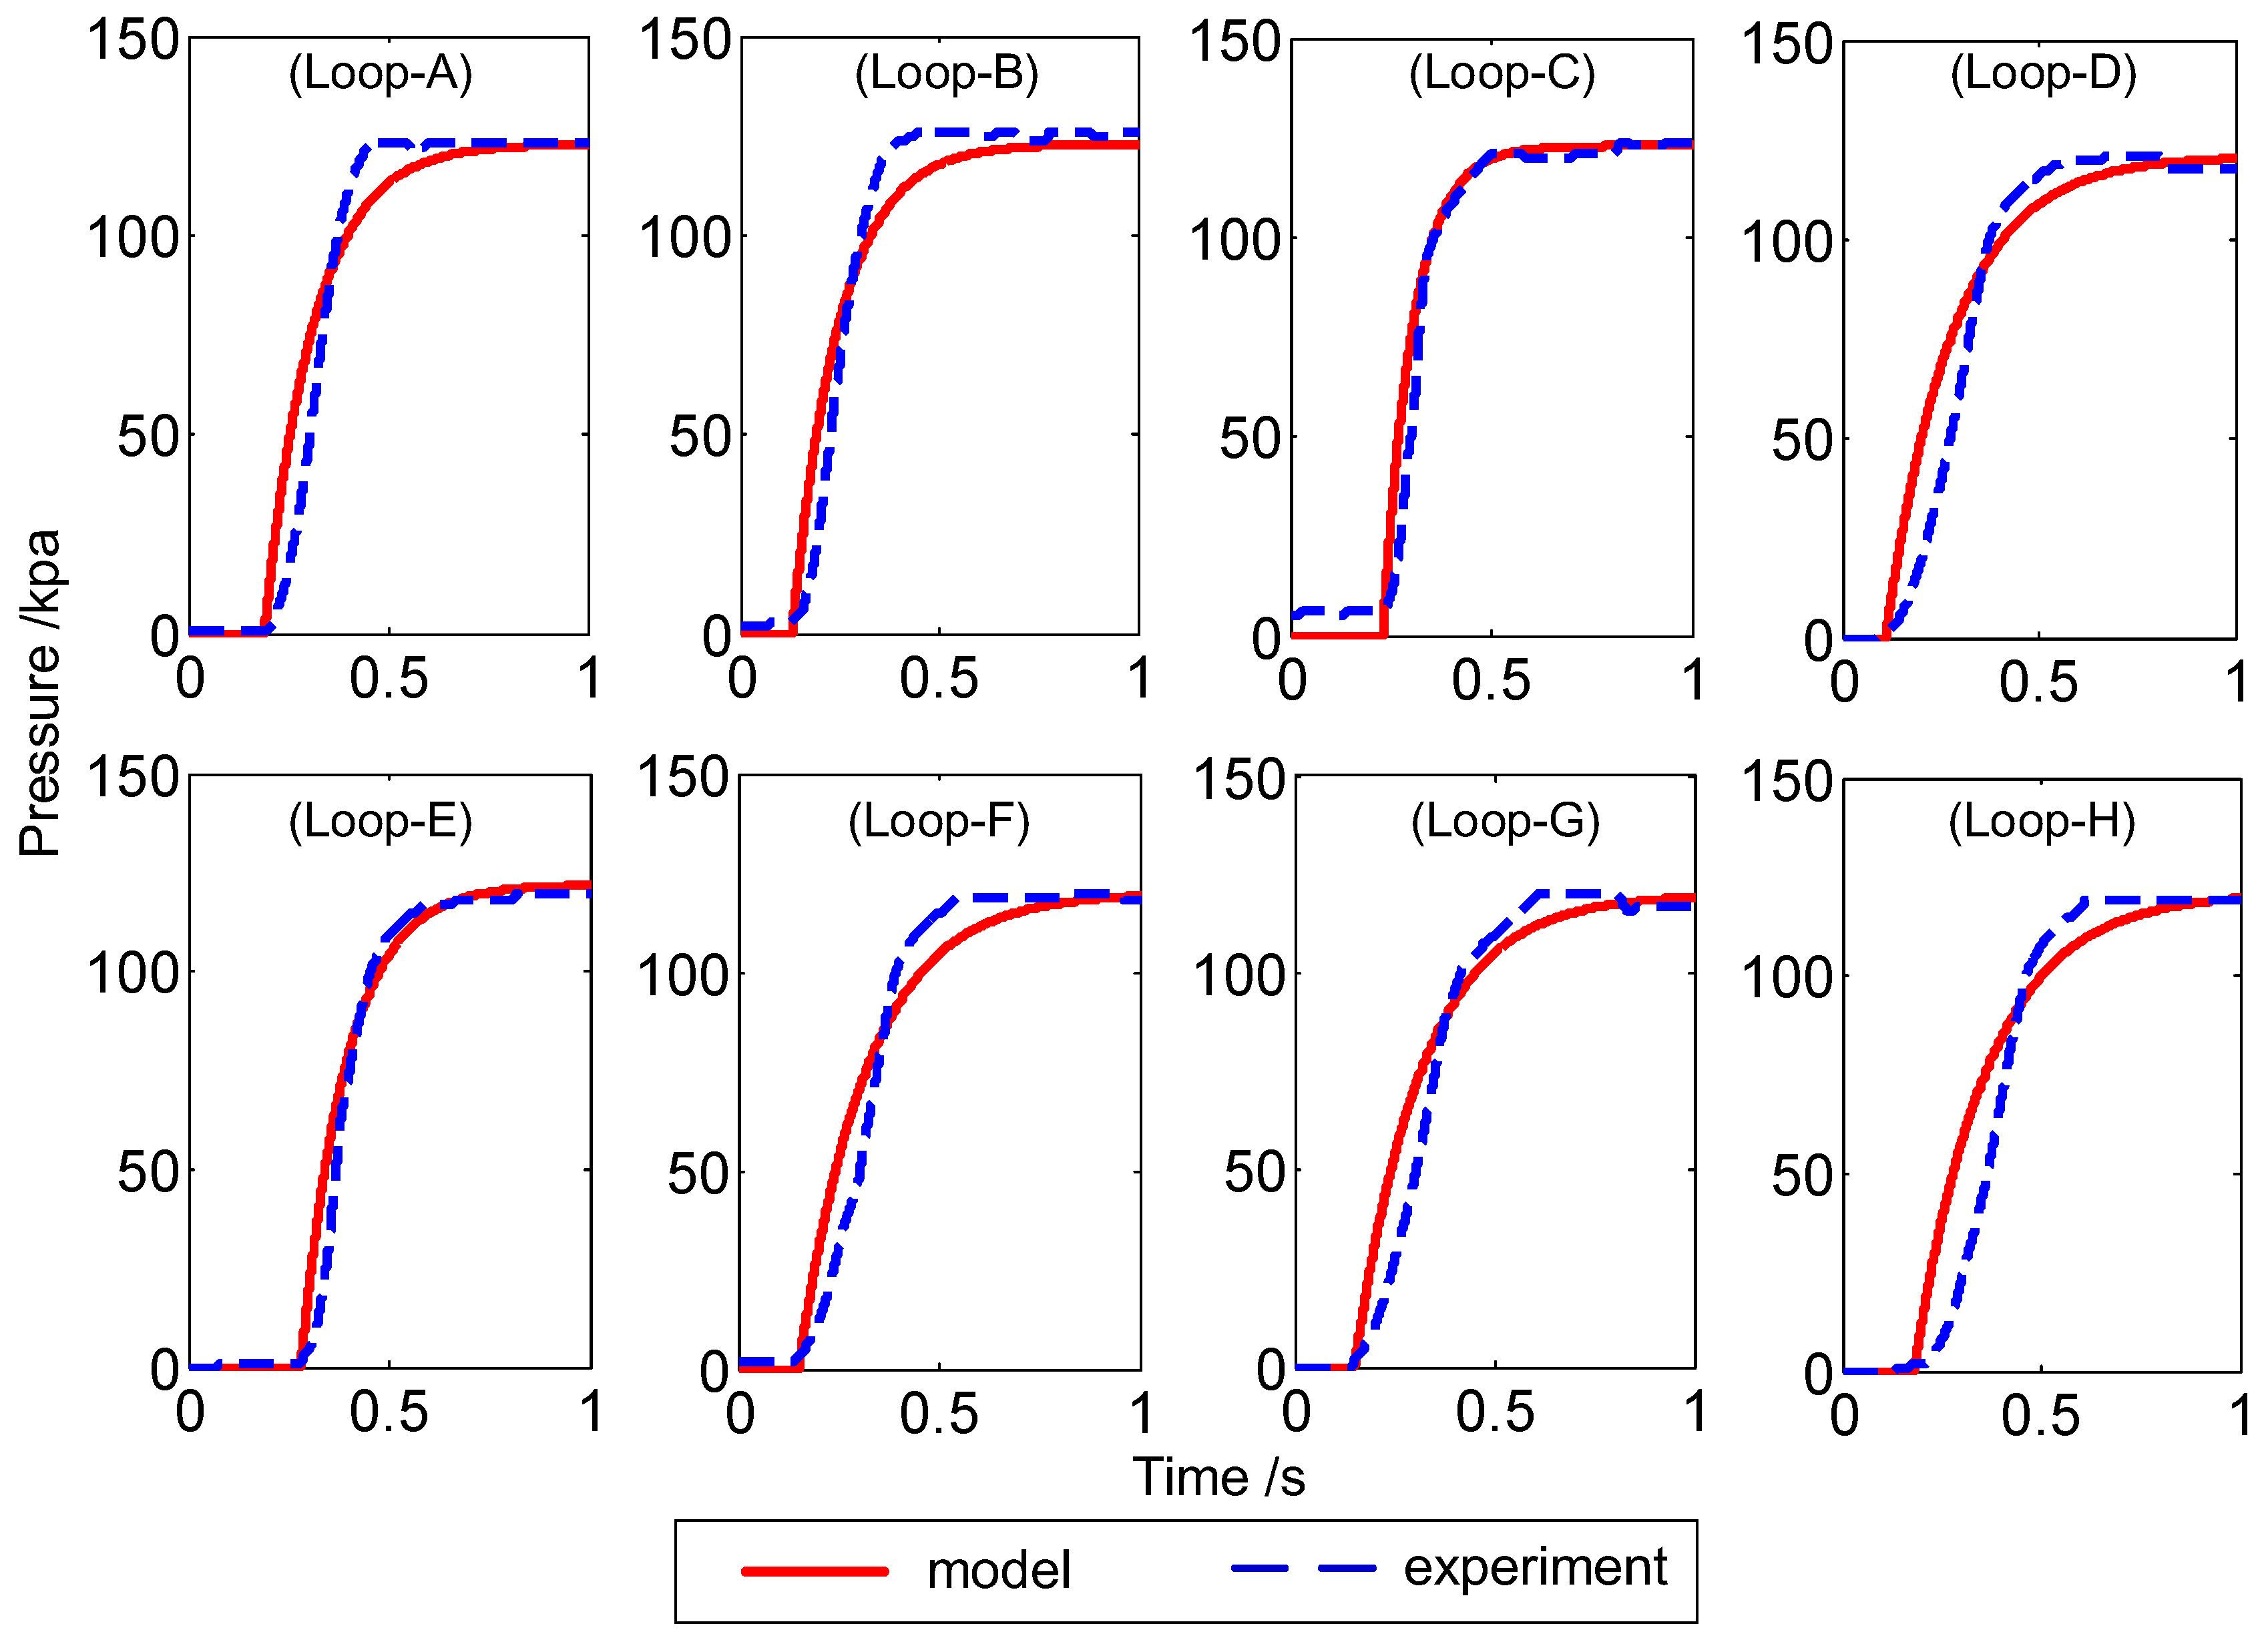
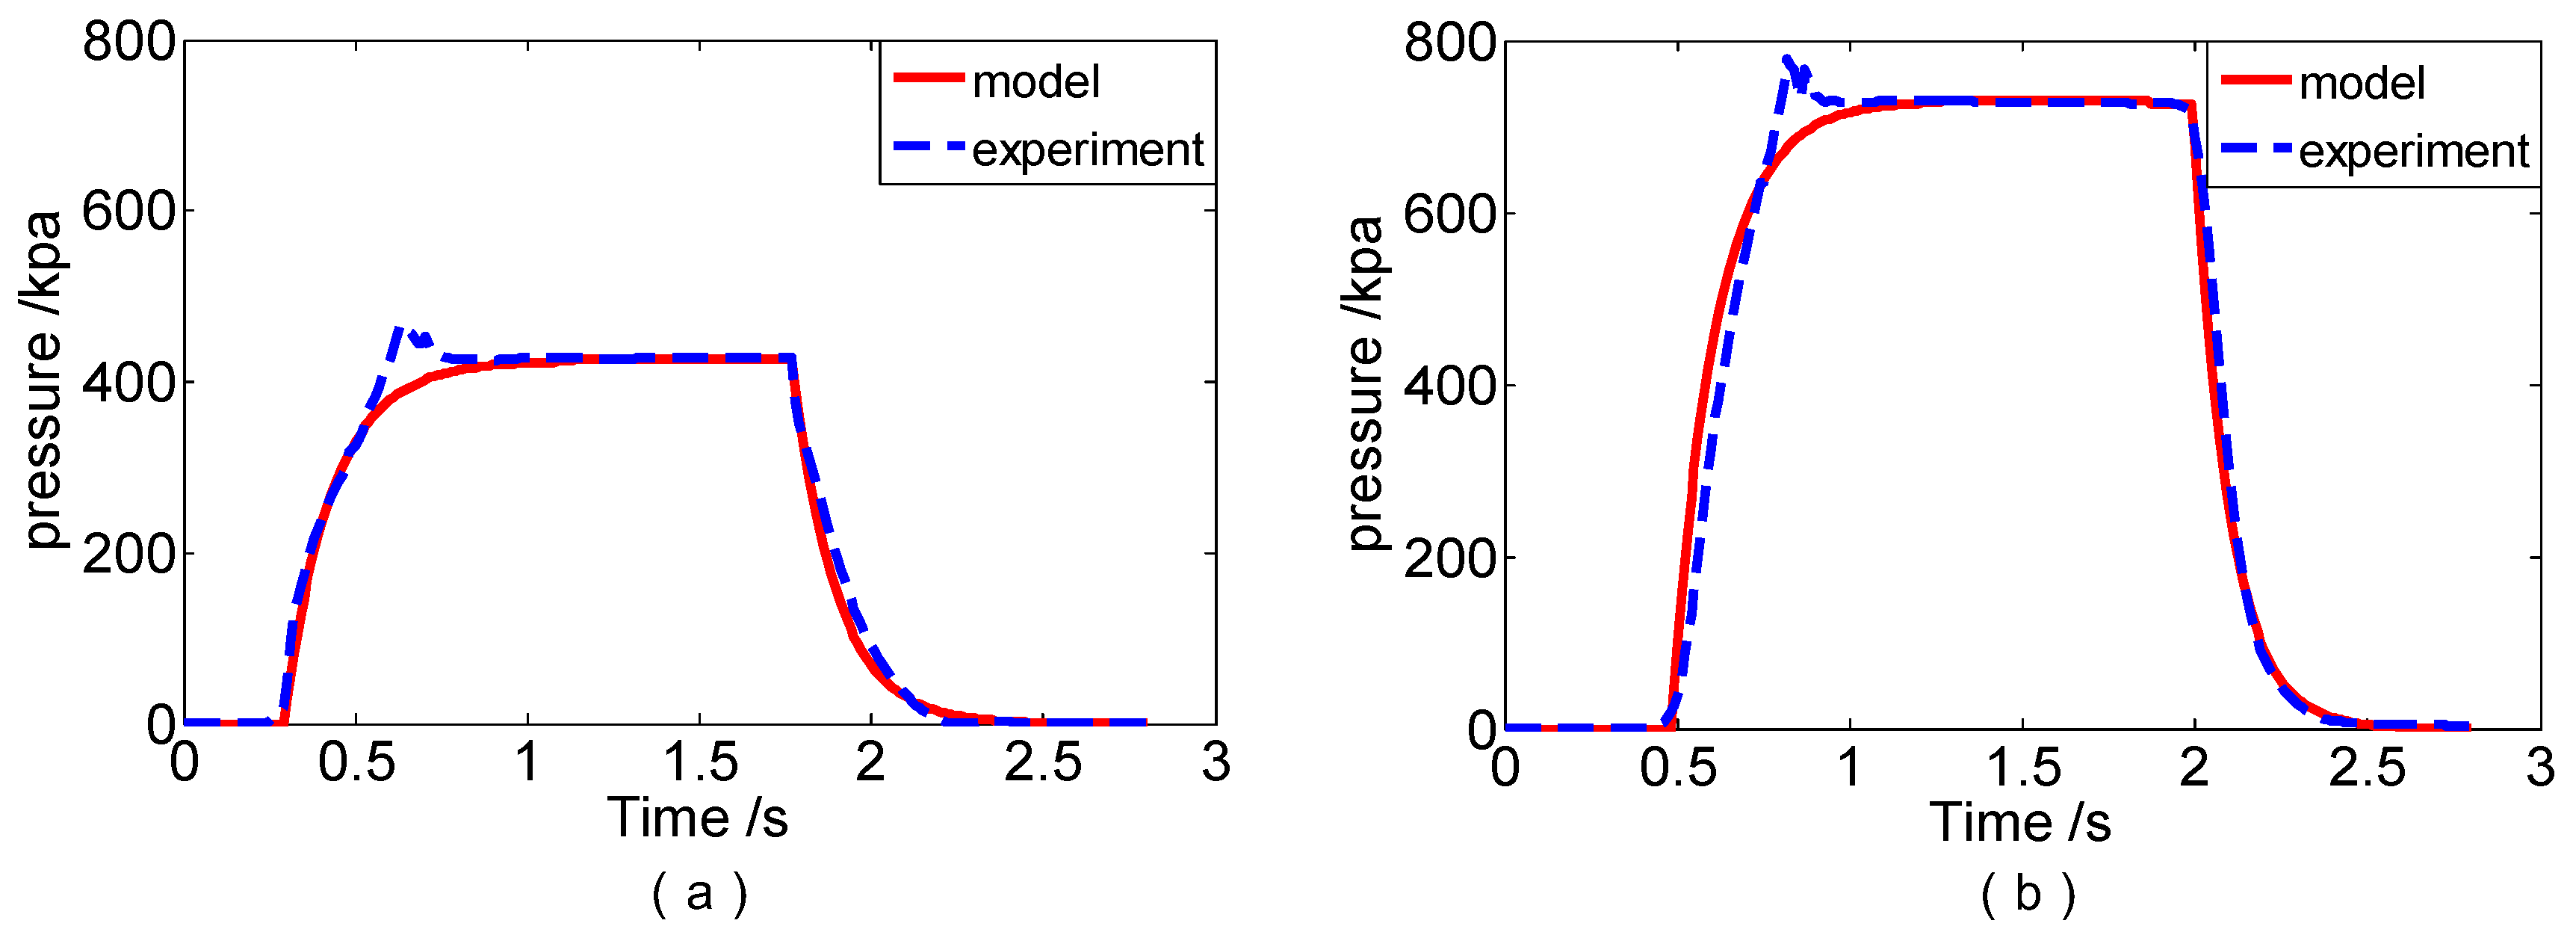
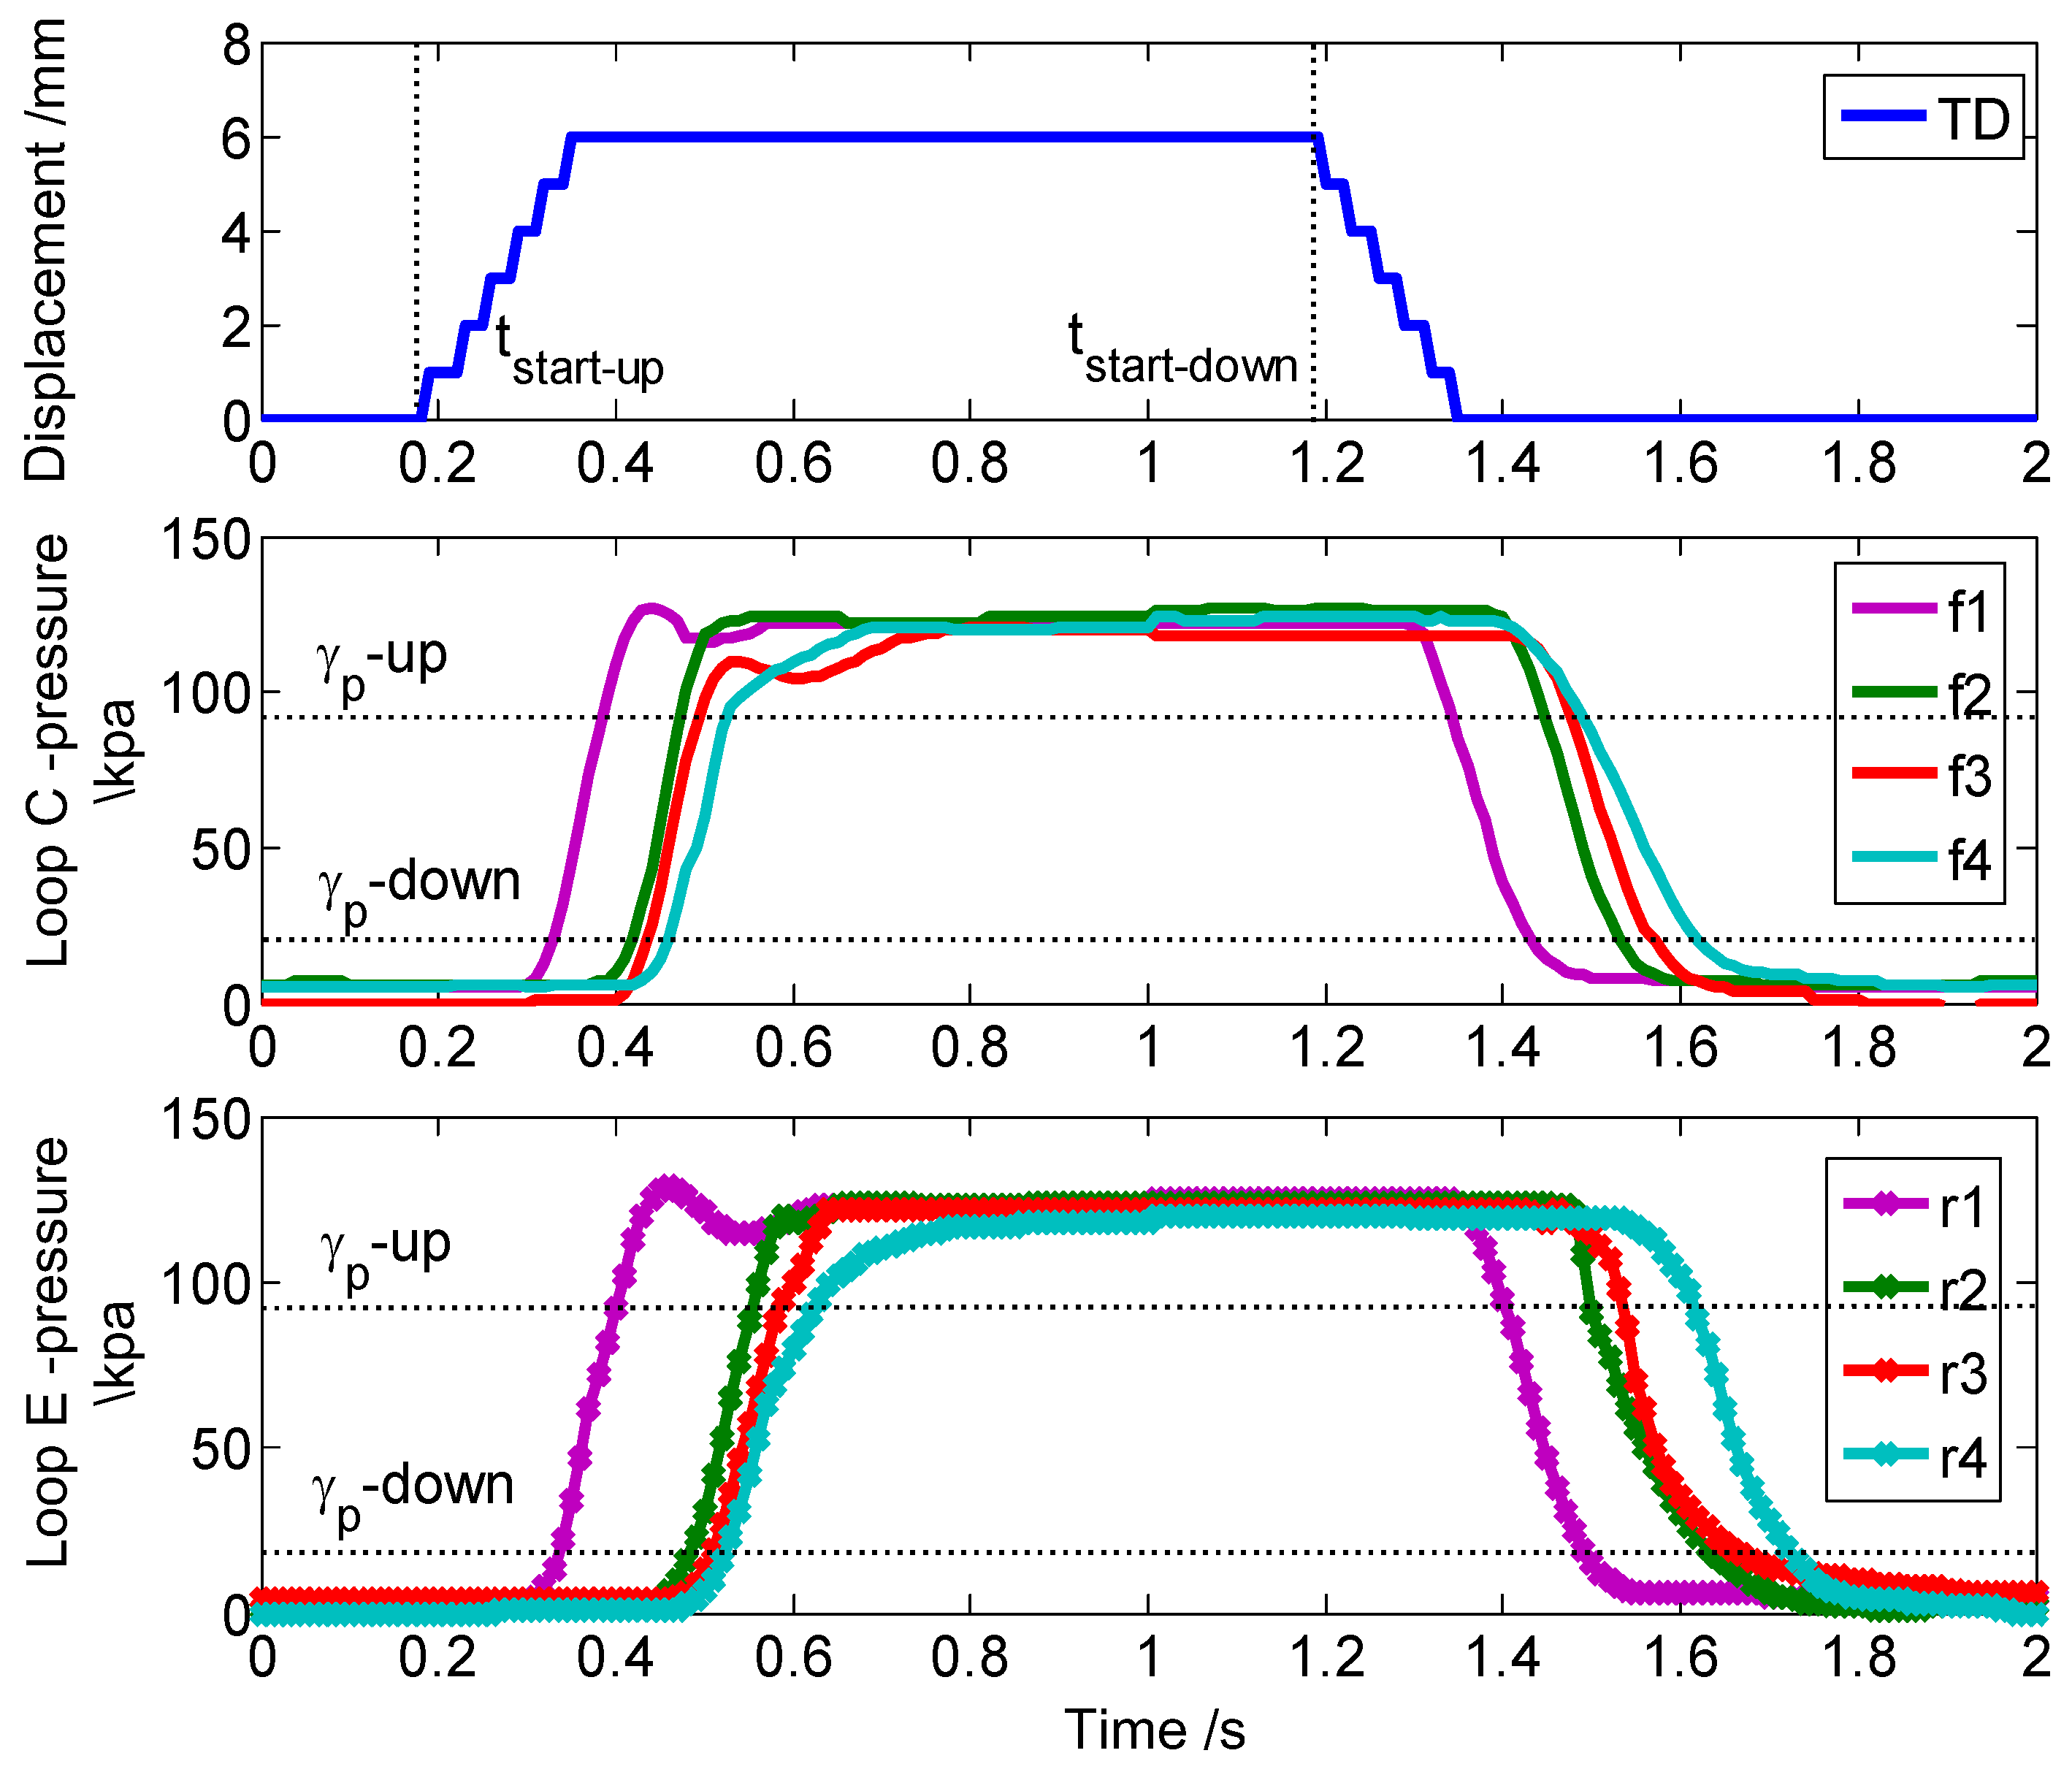
4.1. Hysteresis Effect of 8 Axle
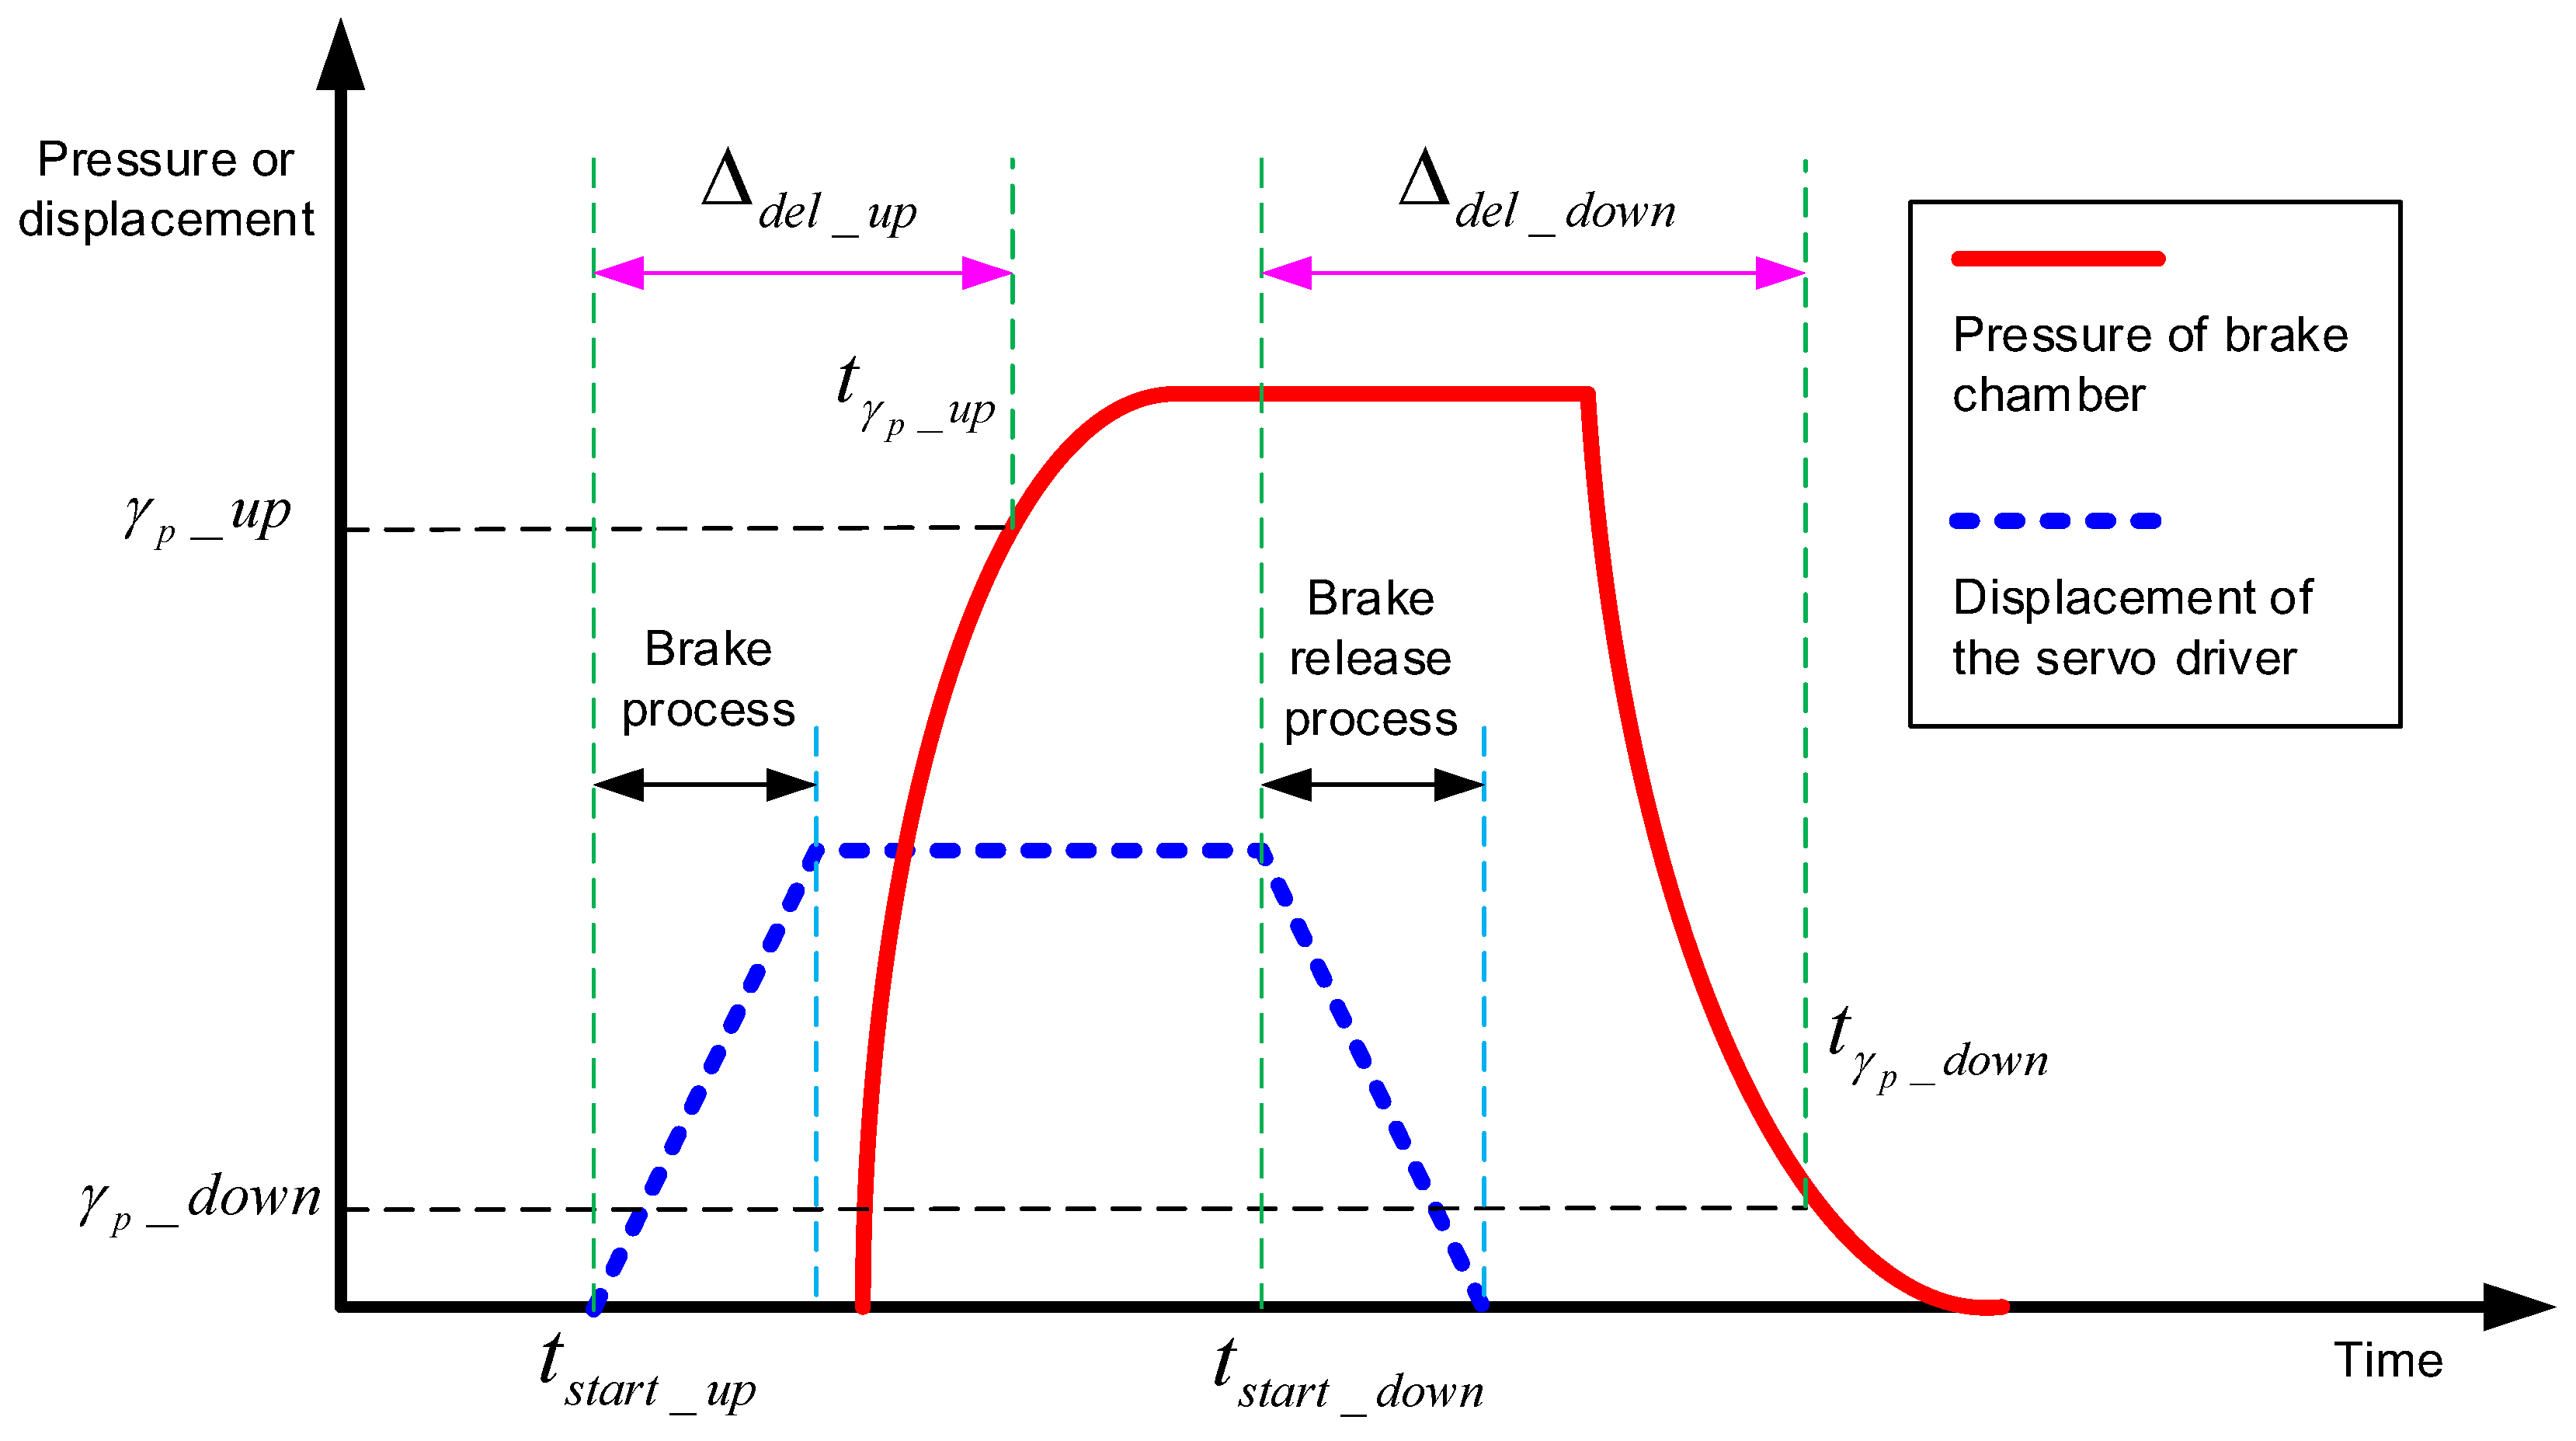
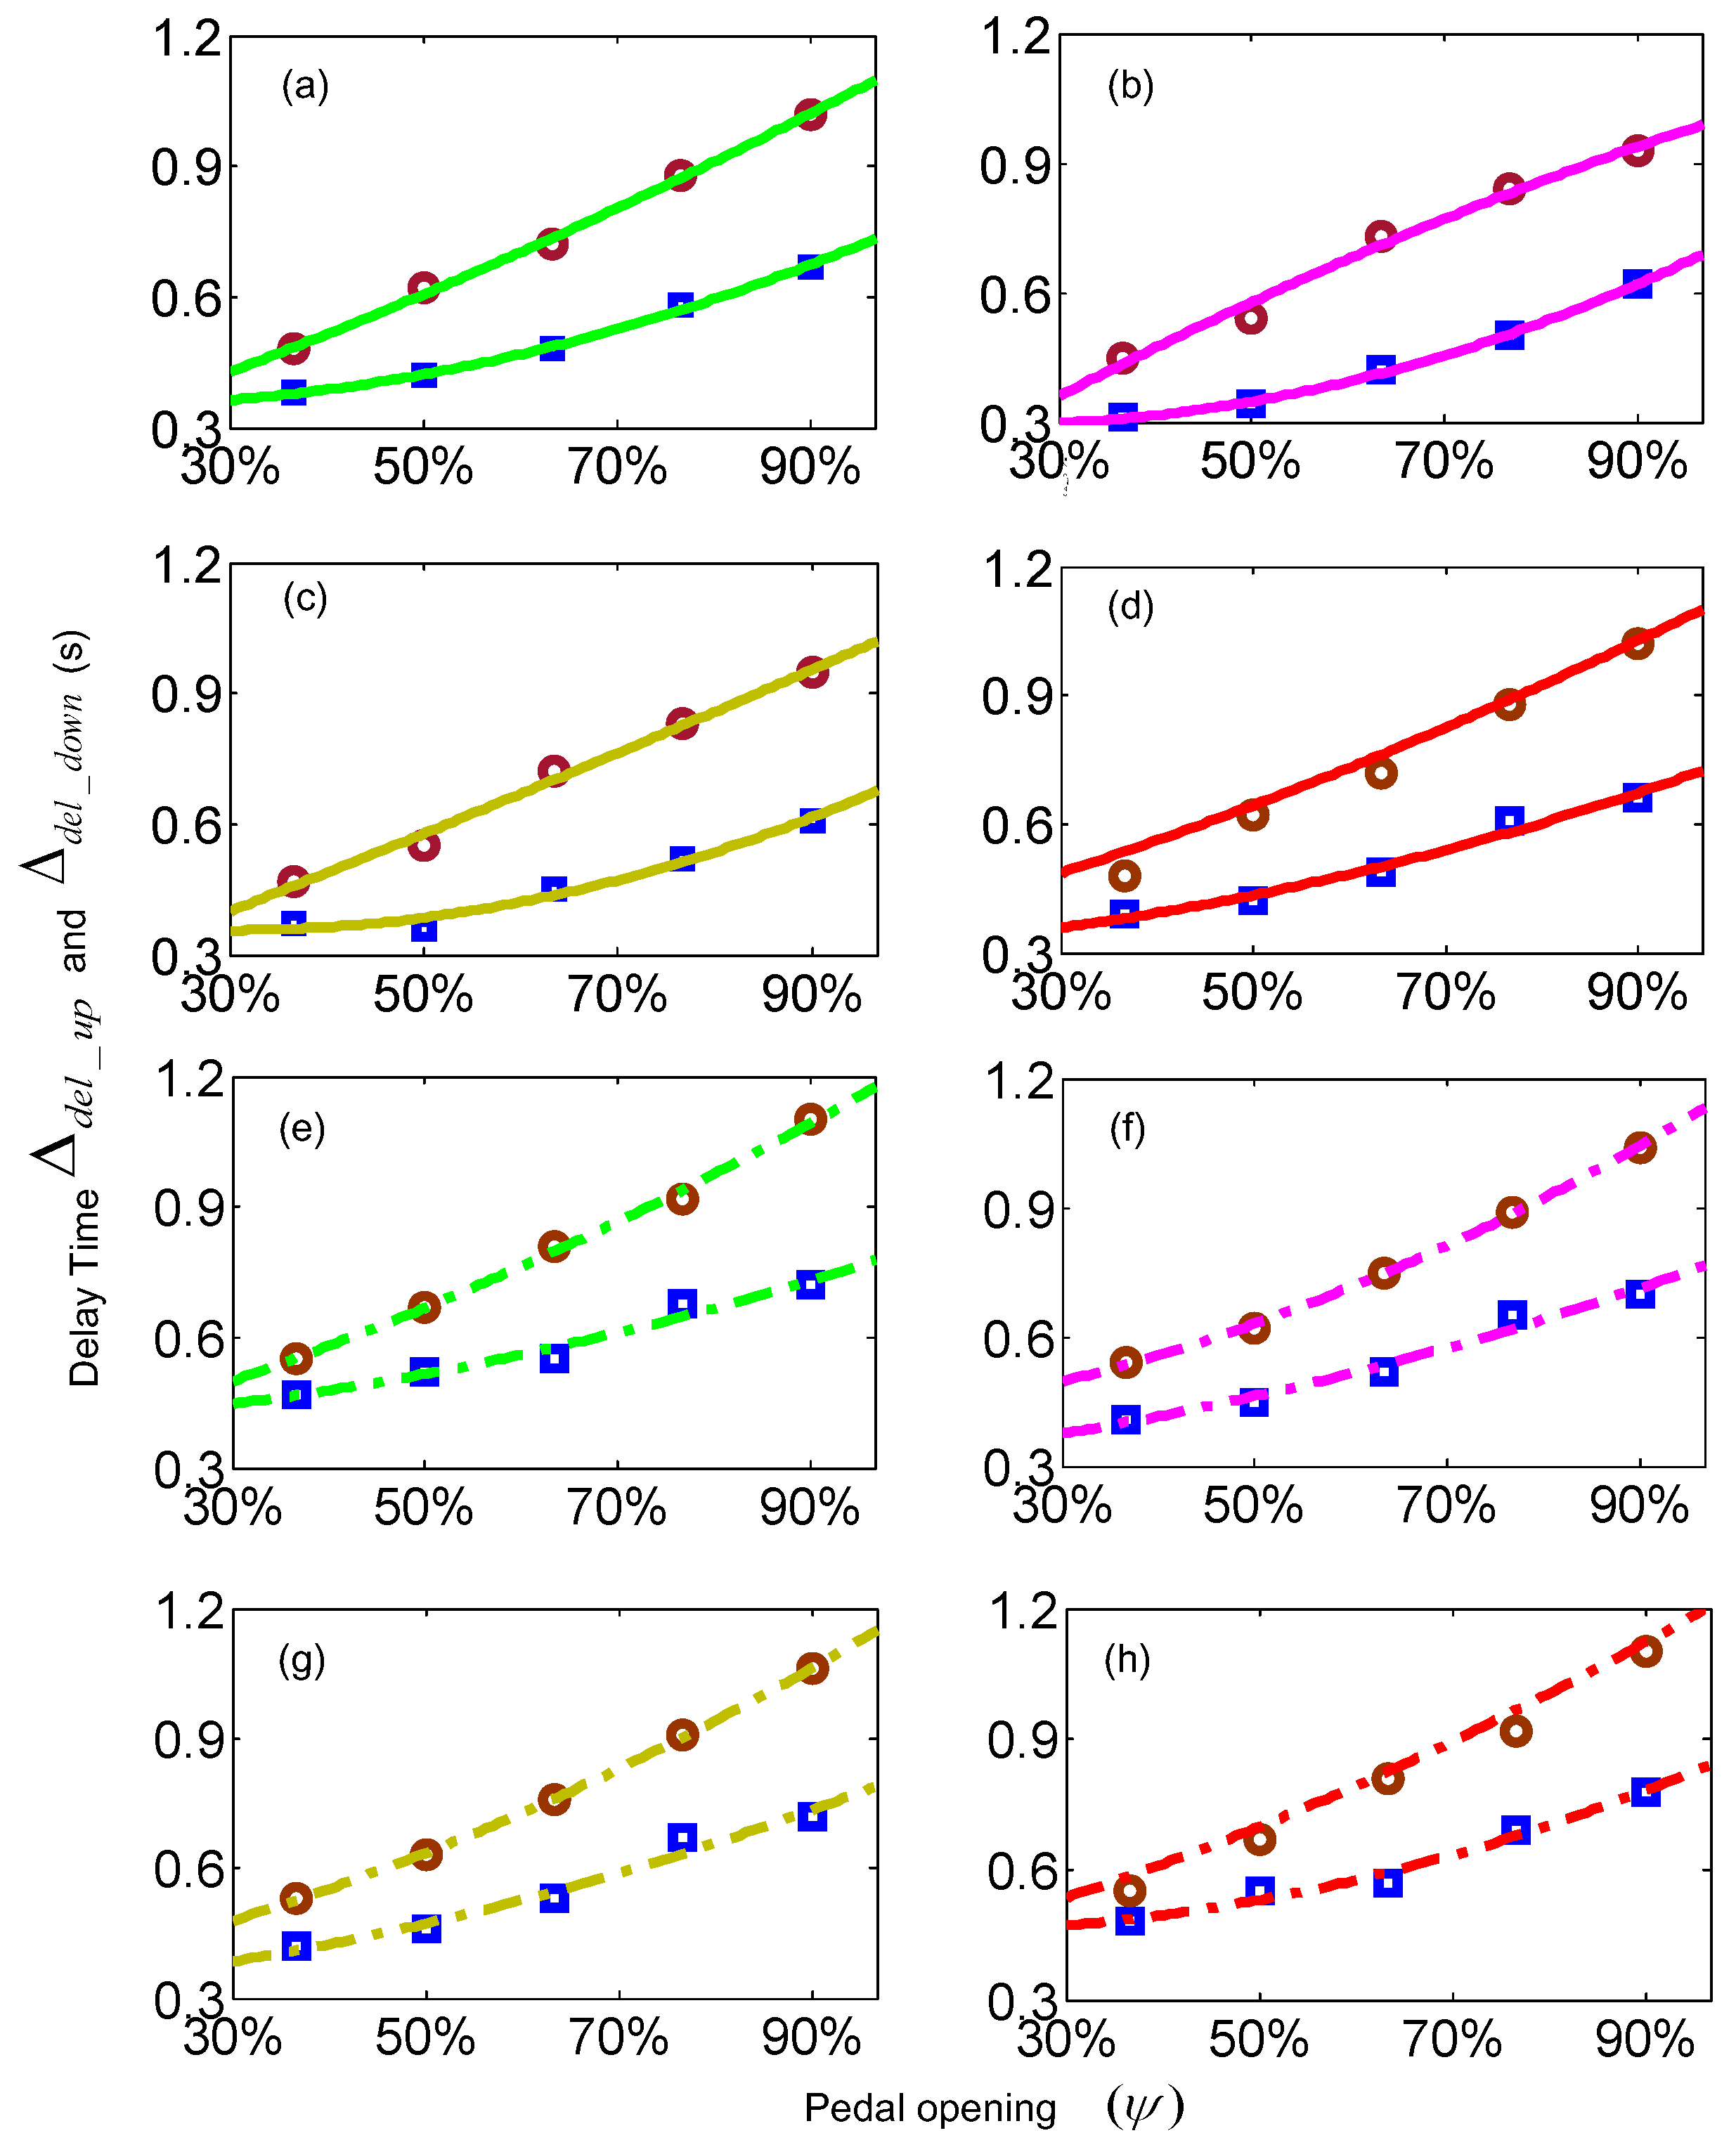
4.1.1. Relationship between Pedal Opening and Delay Time
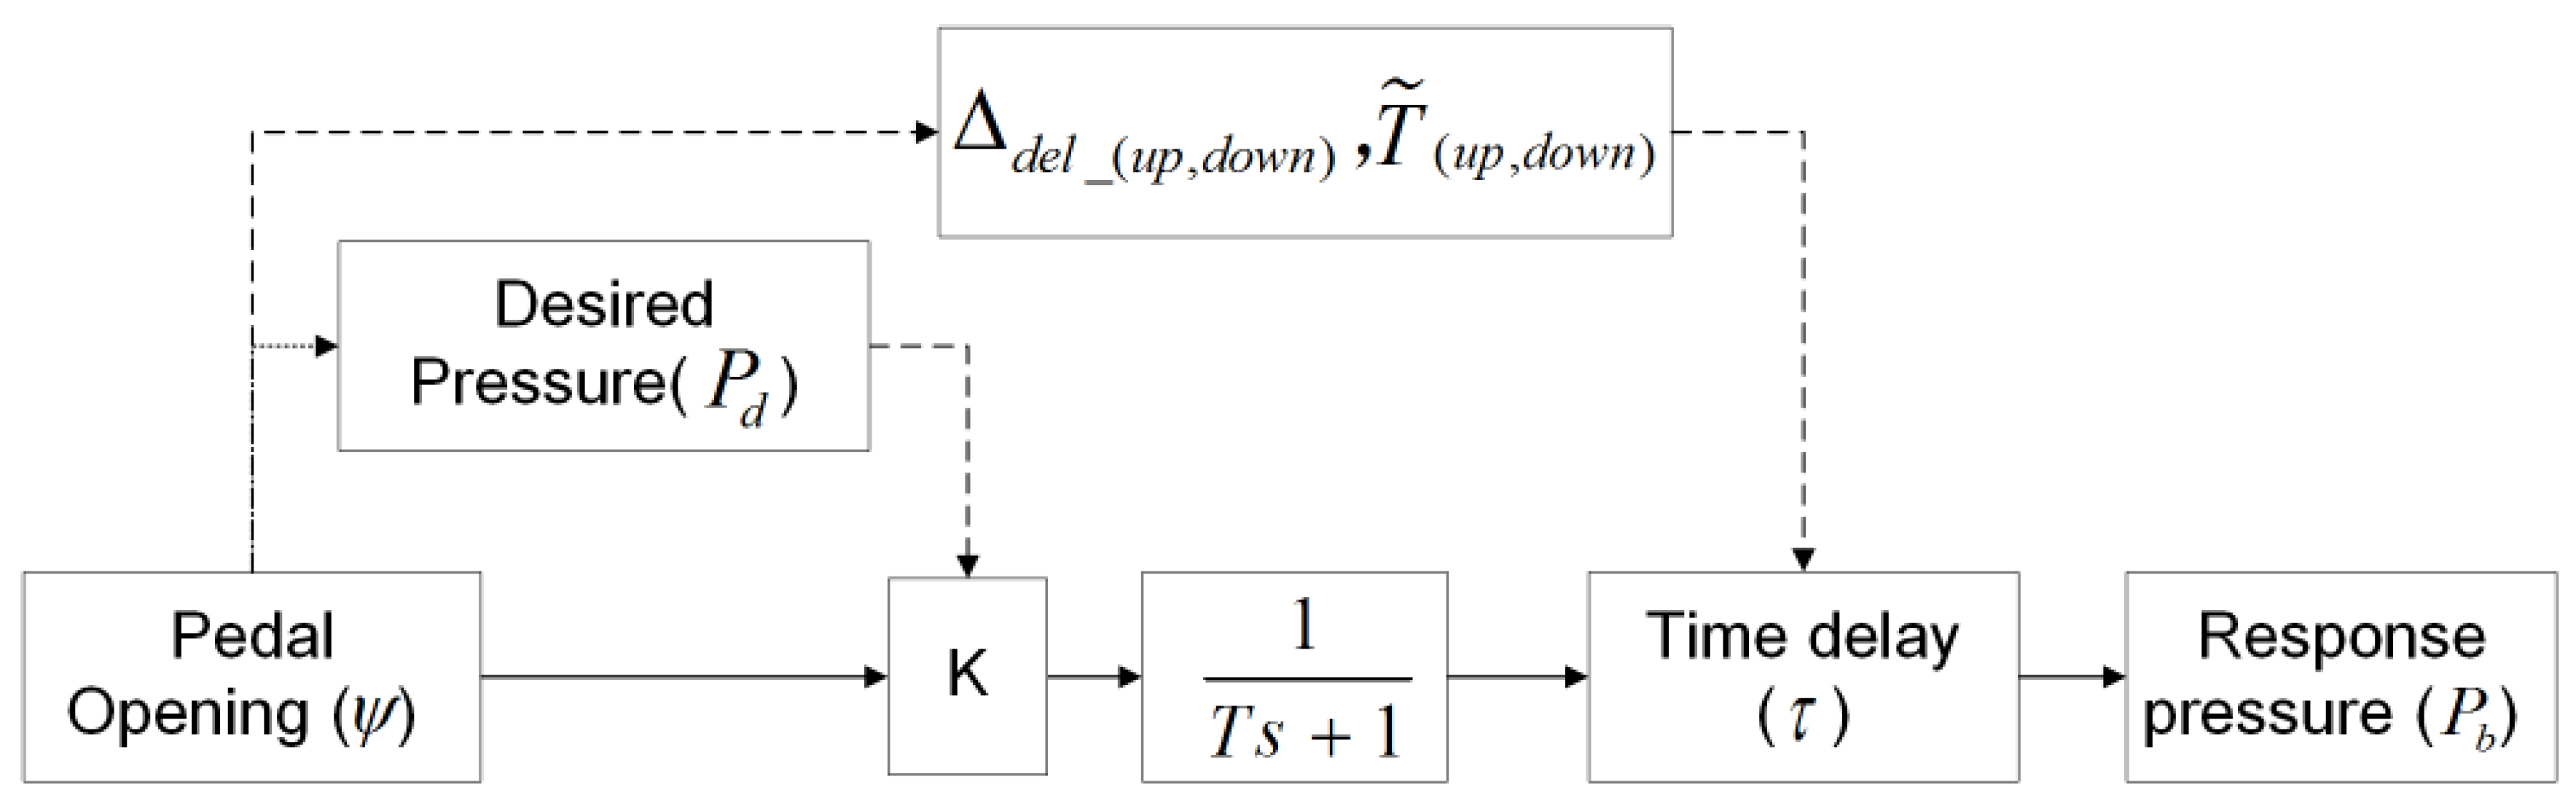
4.1.2. First-Order Plus Time Delay Model
4.1.3. Relationship between Moving Speed and Delay Time
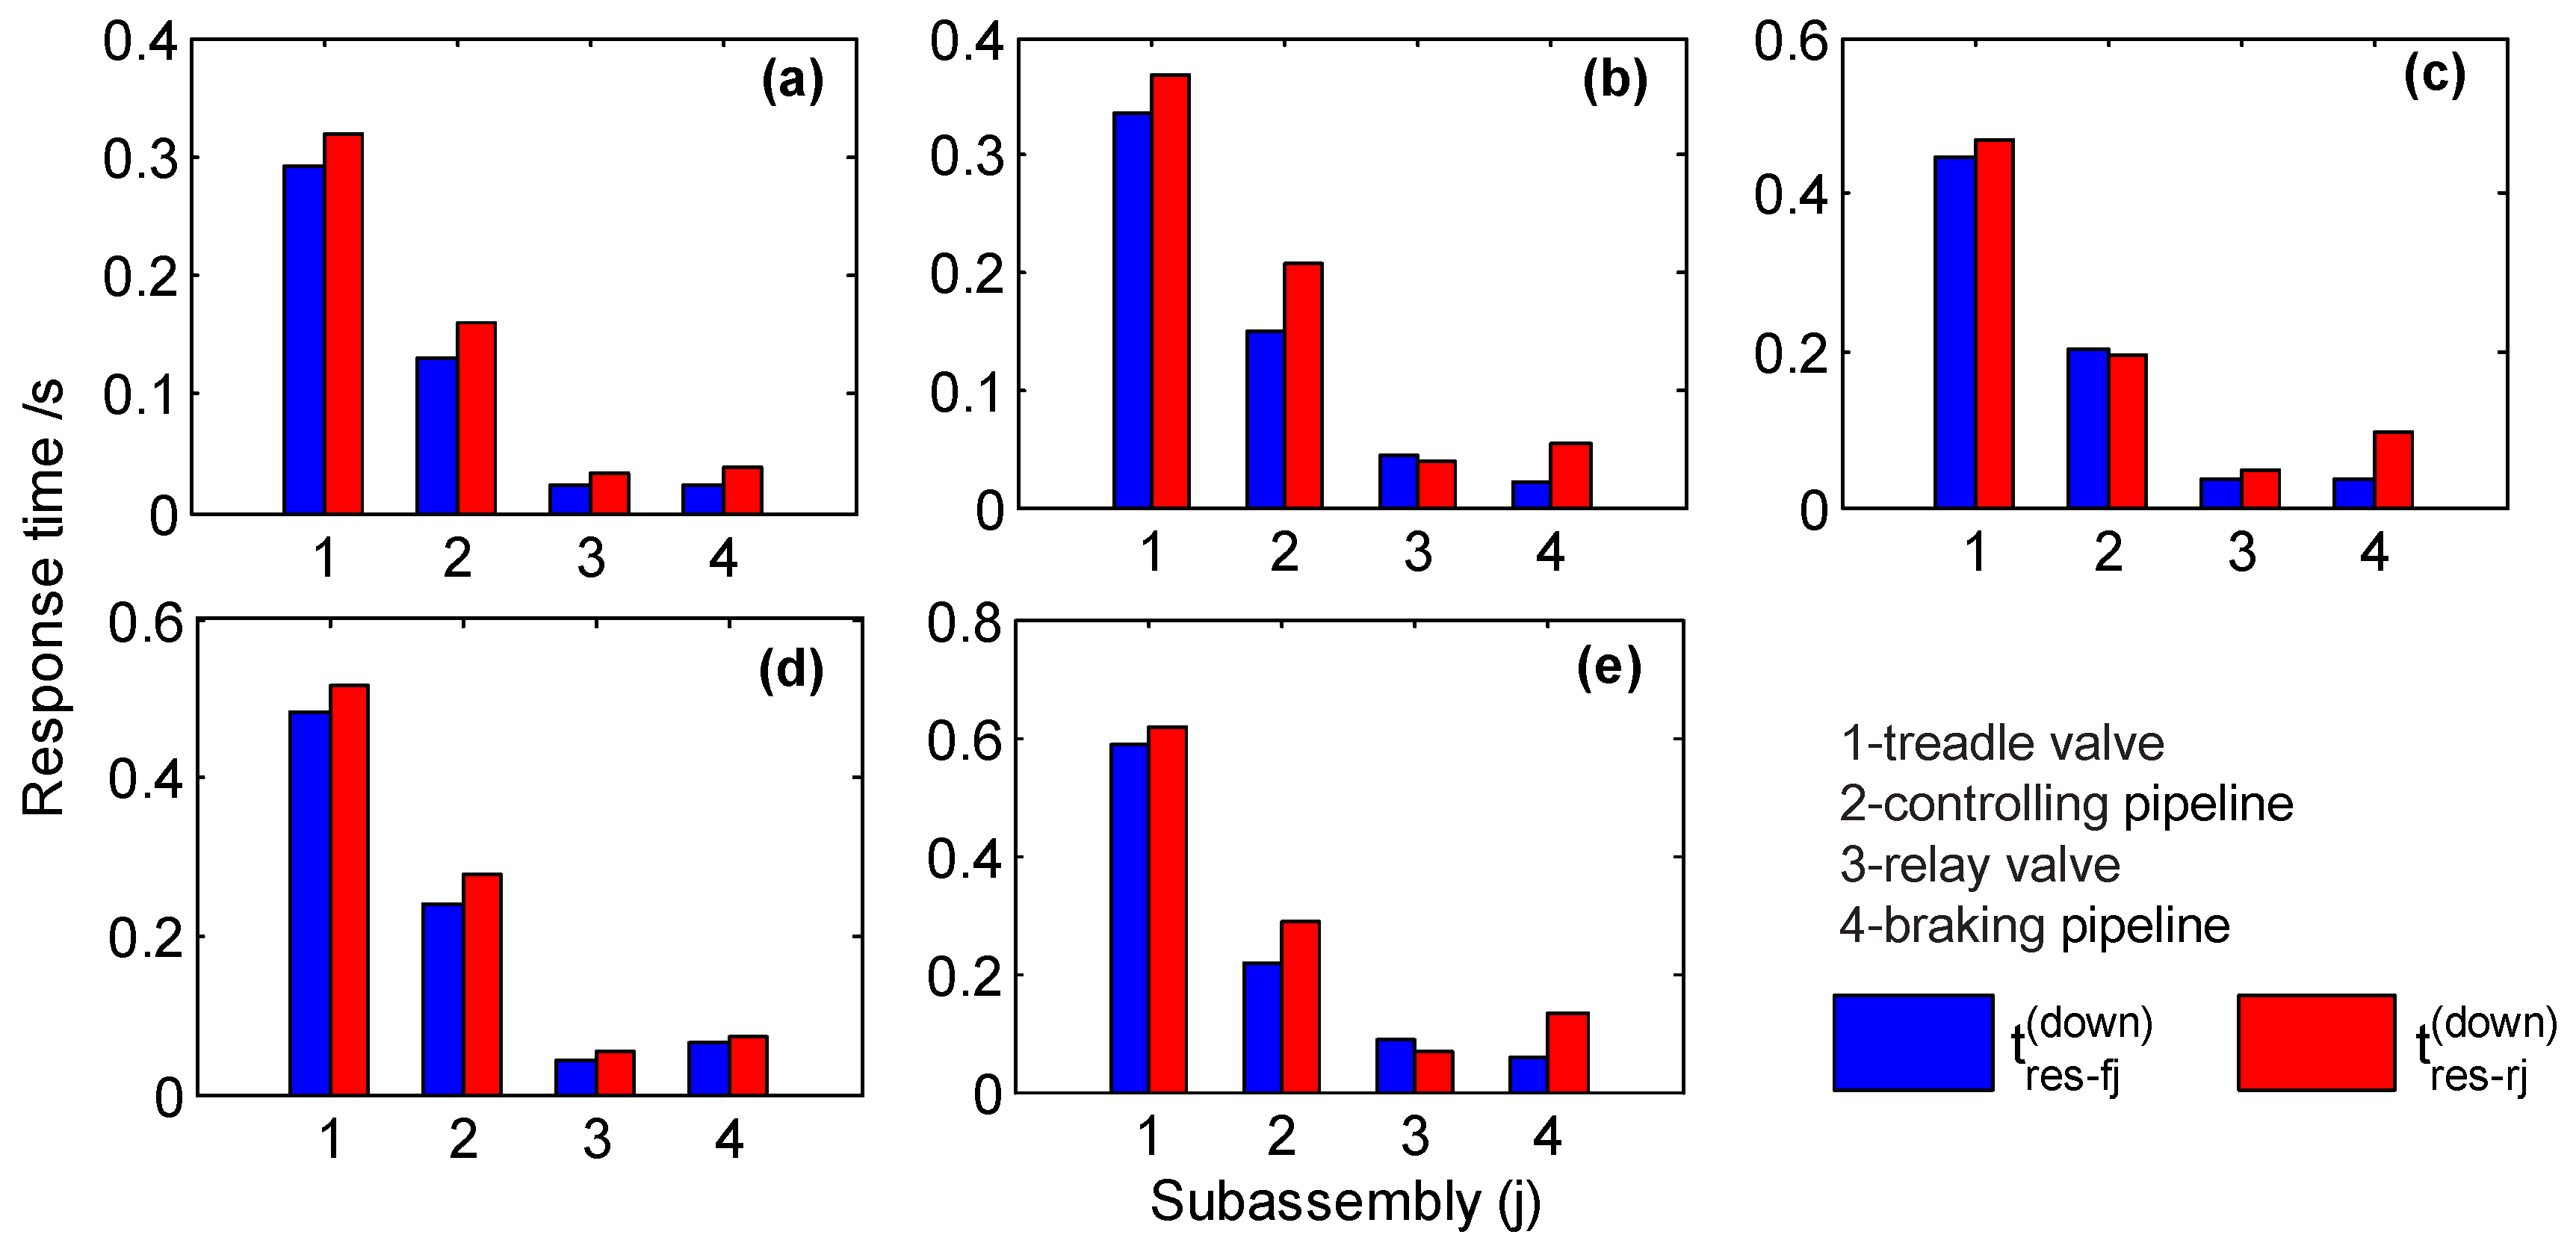
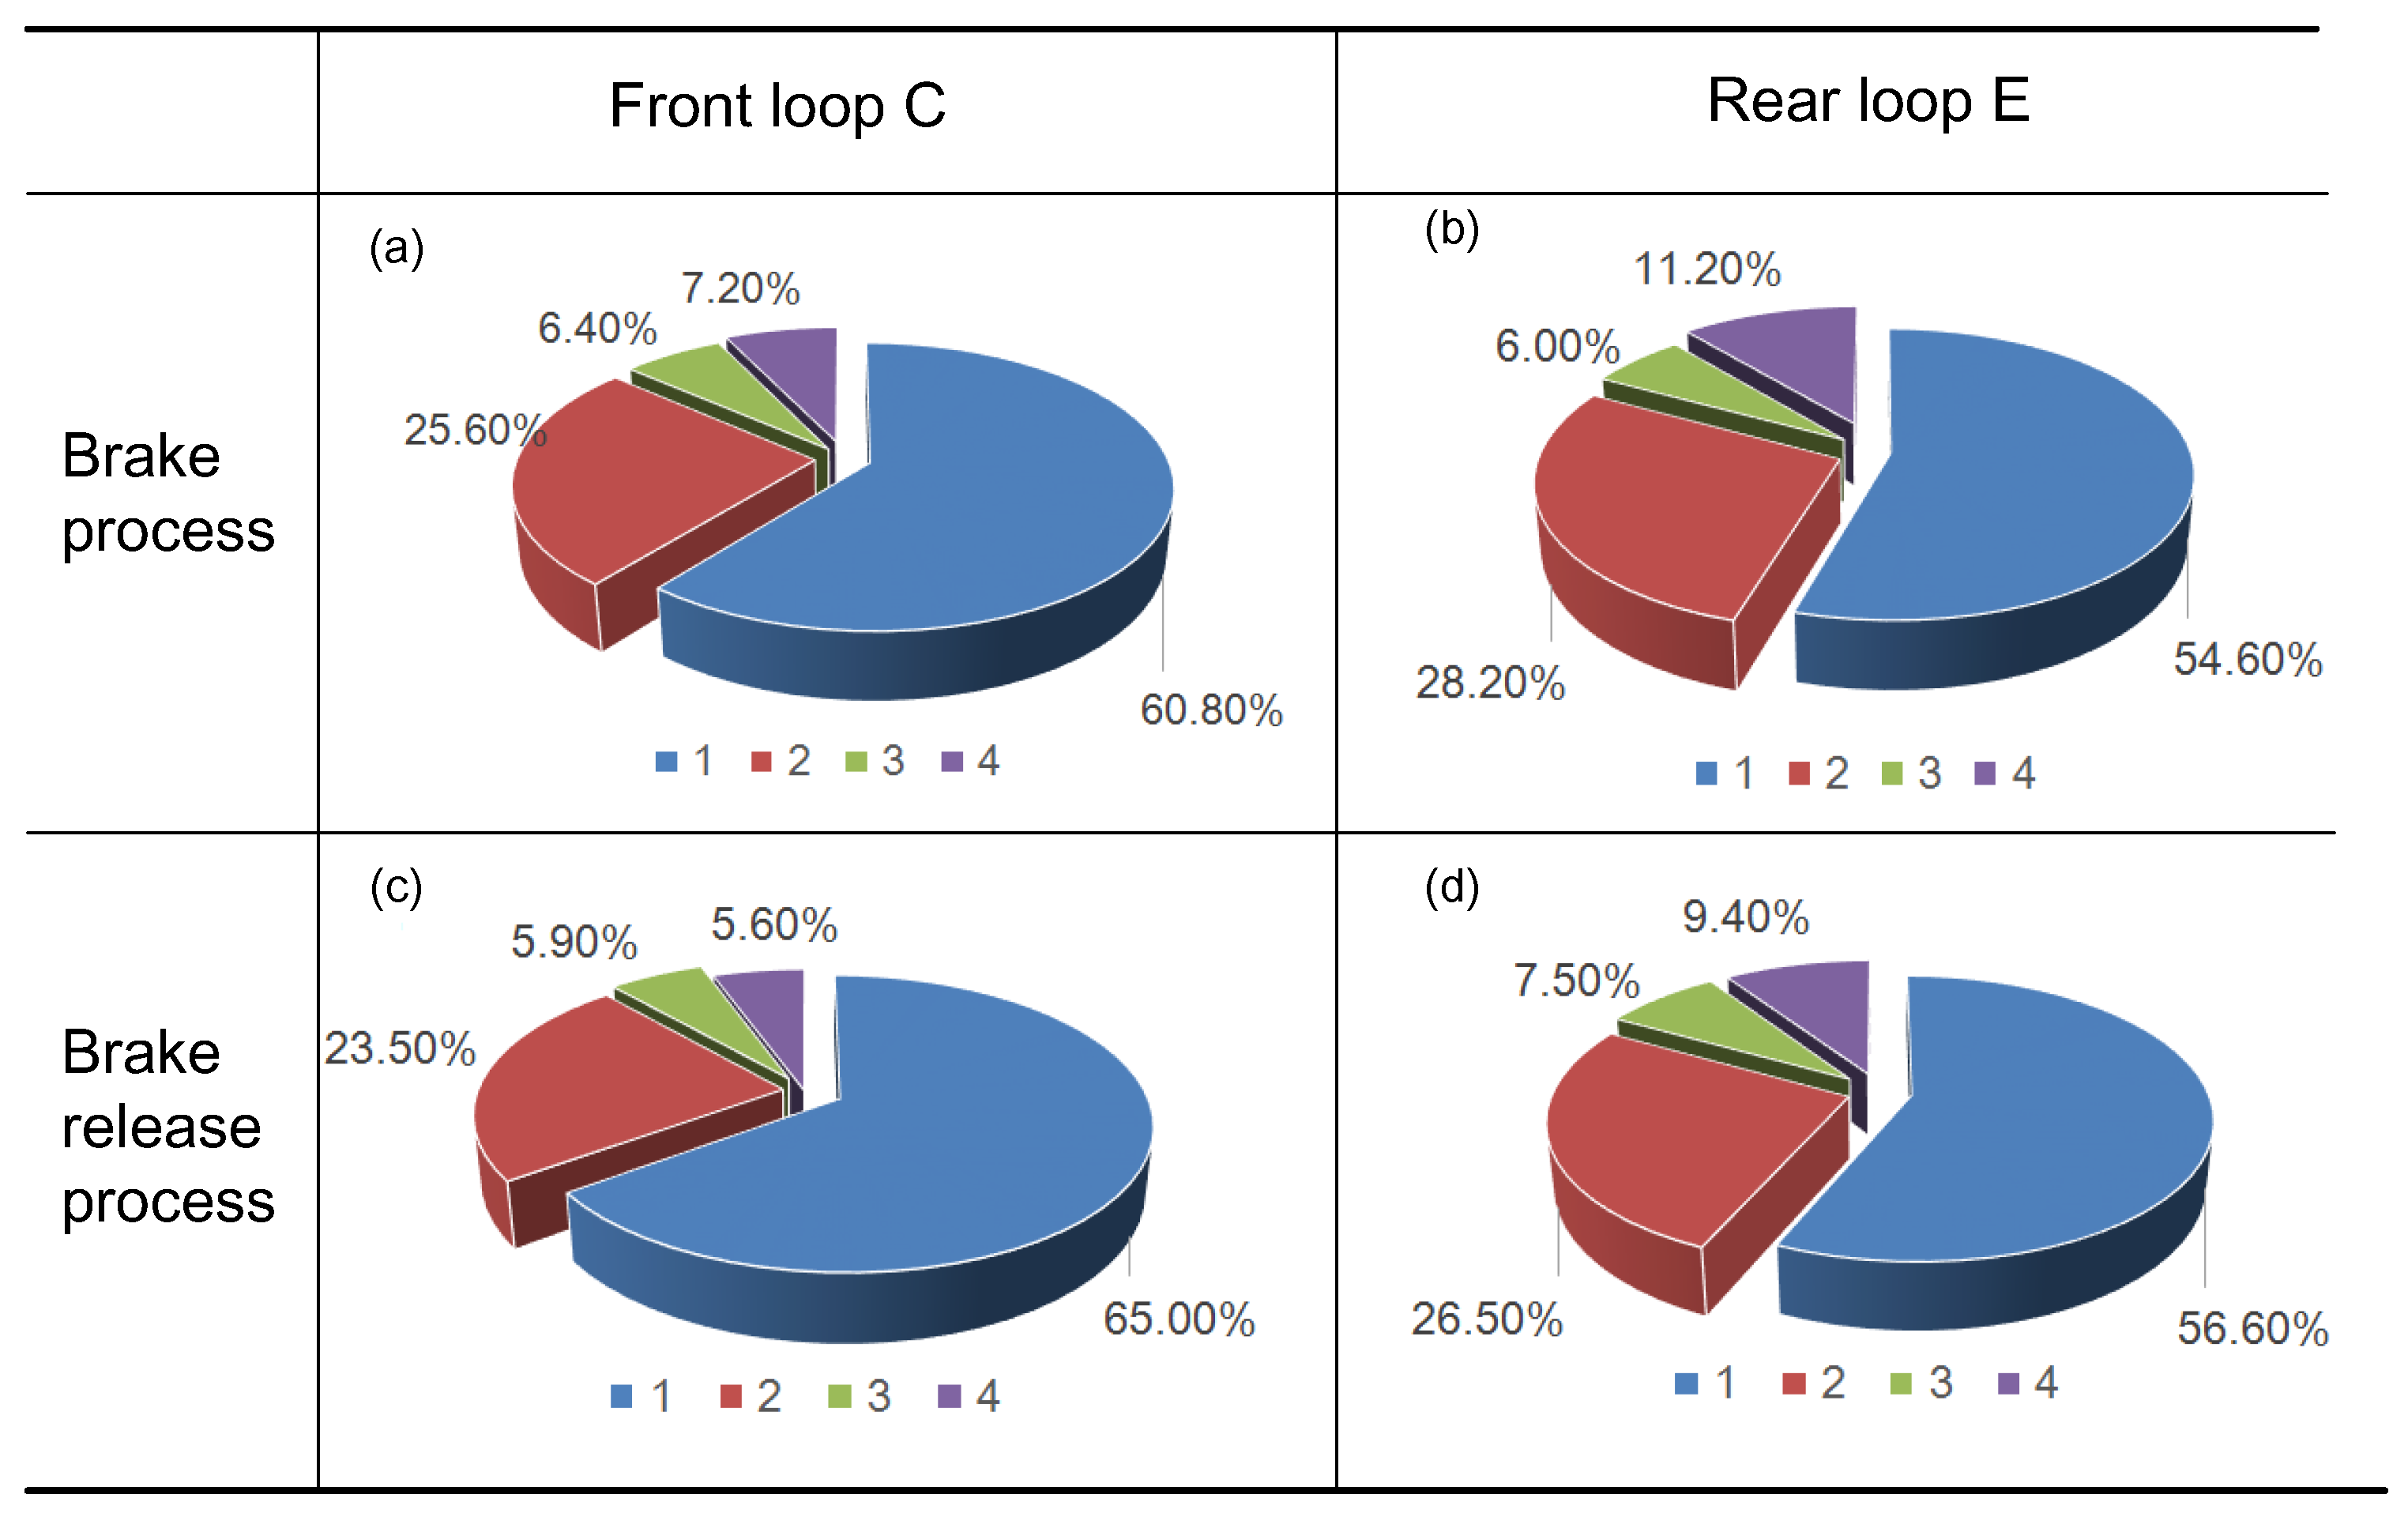
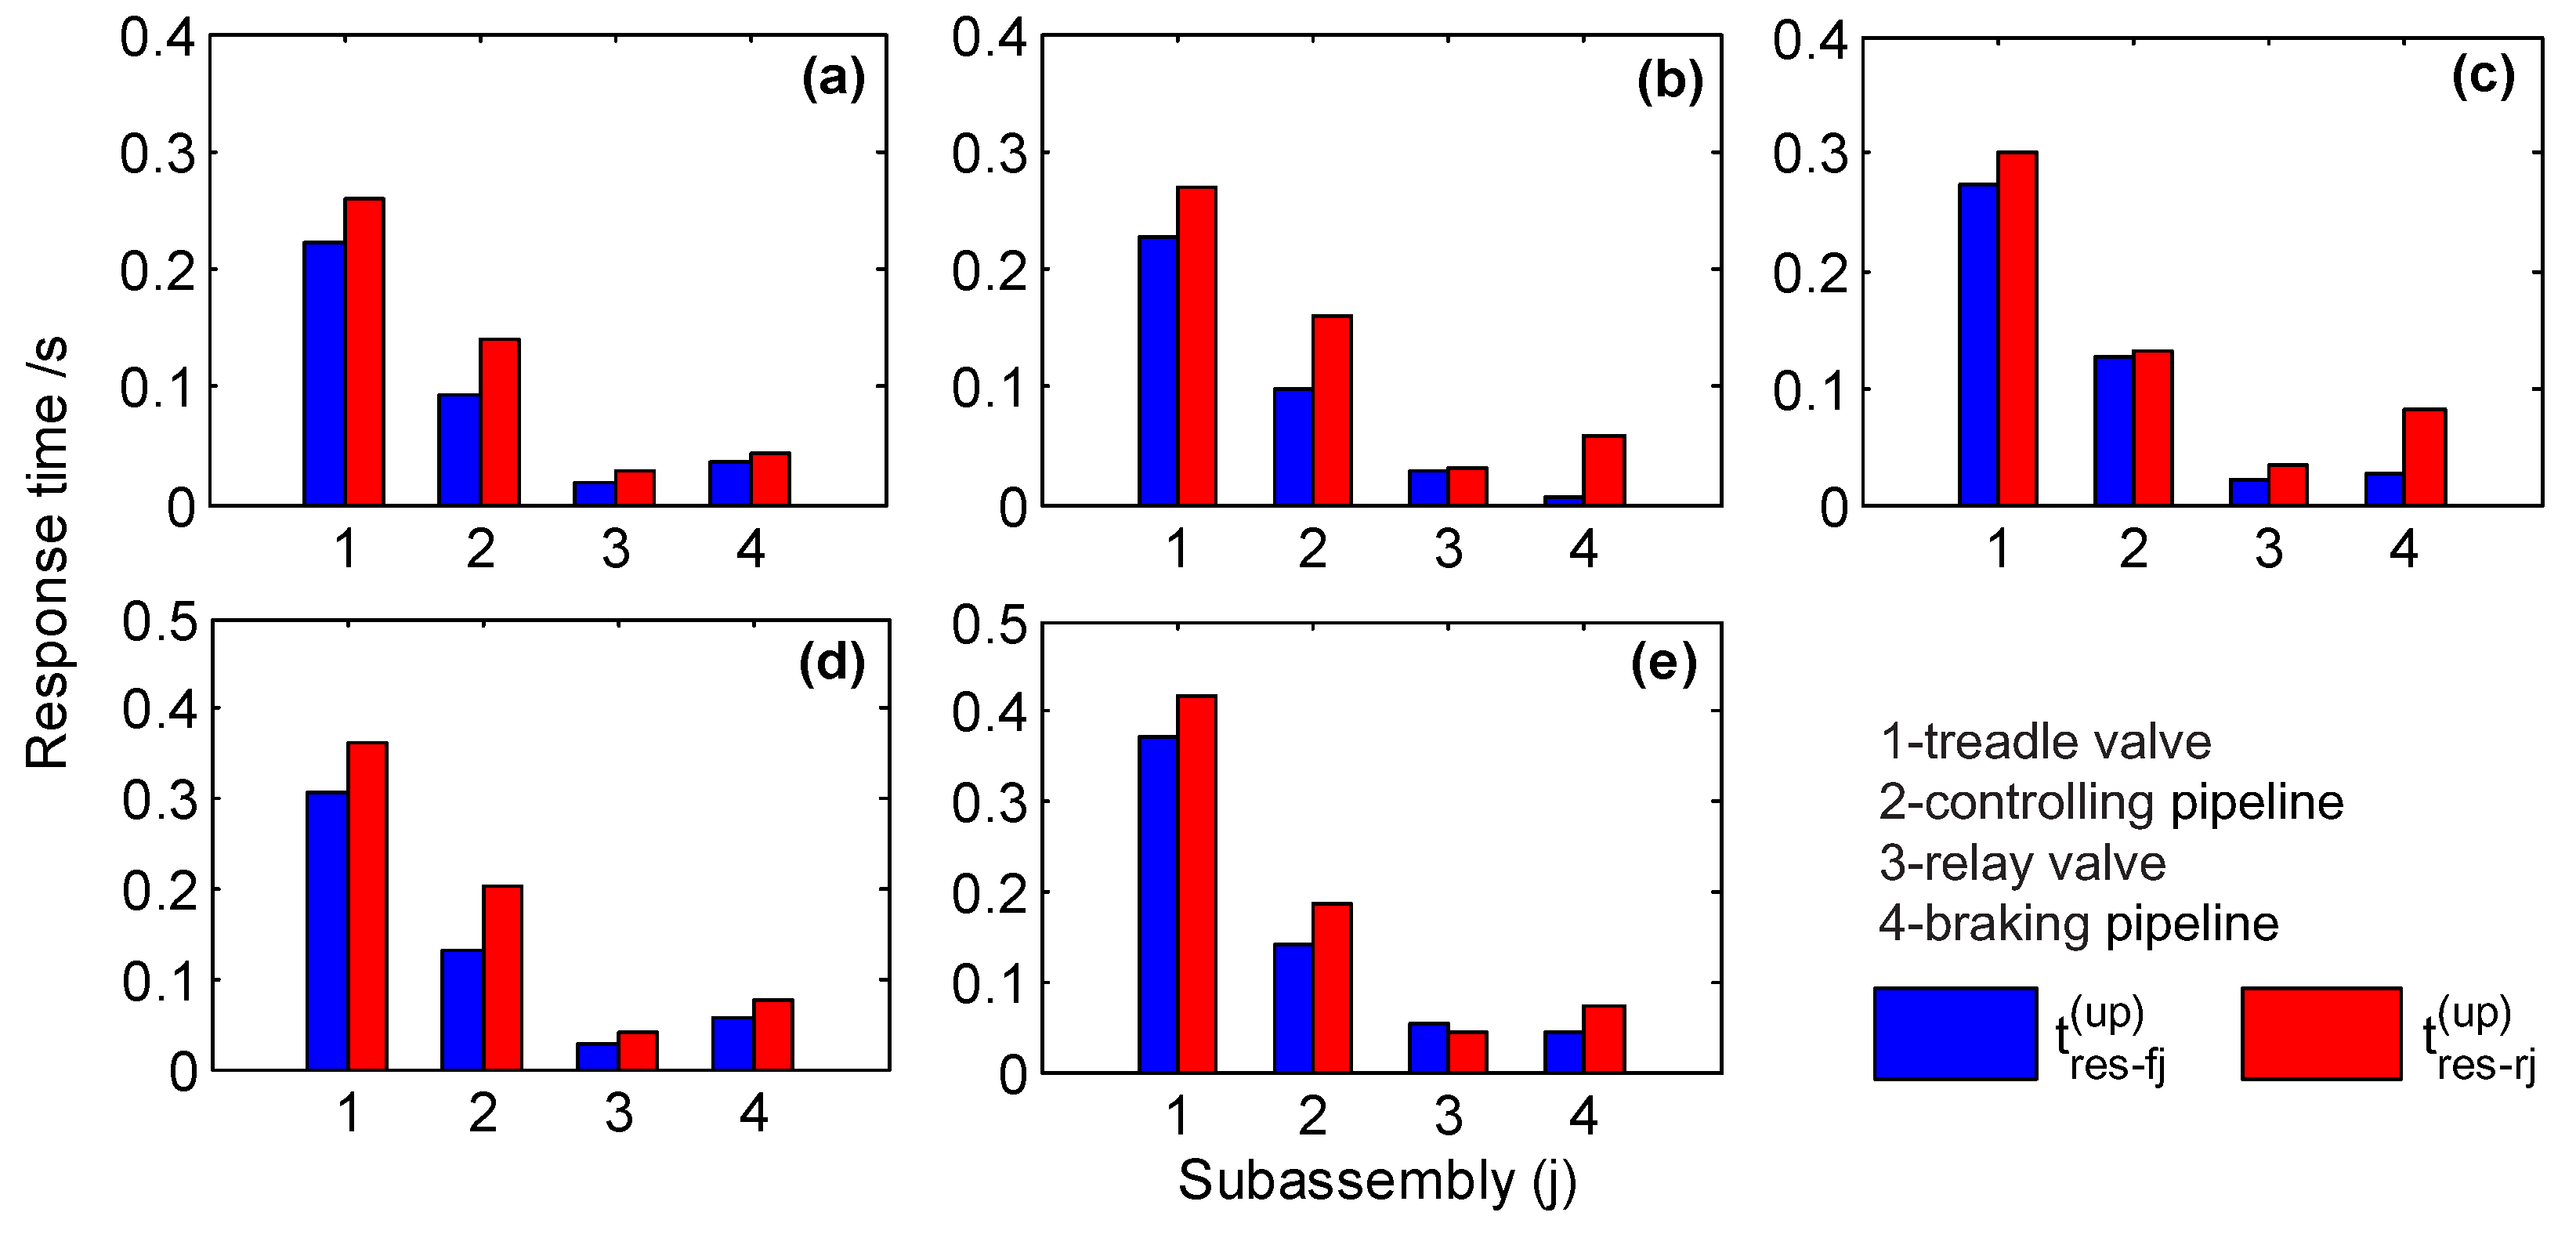
4.2. Response Time of Subassemblies in a Single Axle
5. Conclusions
Acknowledgments
Author Contributions
Conflicts of Interest
References
- Wu, J.L.; Zhang, H.C.; Zhang, Y.Q. Robust design of a pneumatic brake system in commercial vehicles. SAE Int. J. Commer. Veh. 2009, 2, 17–28. [Google Scholar] [CrossRef]
- Harris, P.G.; O’Donnell, G.E.; Whelan, T. Modelling and identification of industrial pneumatic drive system. Int. J. Adv. Manuf. Technol. 2012, 58, 1075–1086. [Google Scholar] [CrossRef]
- Pugi, L.; Malvezzi, M.; Allotta, B.; Banchi, L.; Presciani, P. Parametric library for the simulation of a Union Internationale des Chemins de Fer (UIC) pneumatic braking system. Proc. Inst. Mech. Eng. Part F J. Rail Rapid Transit 2004, 218, 117–132. [Google Scholar] [CrossRef]
- Zheng, H.; Wang, L. Multi-objective stability control algorithm of heavy duty based on EBS. SAE Int. J. Commer. Veh. 2014, 7, 514–519. [Google Scholar] [CrossRef]
- Miller, J.; Cebon, D. An investigation of the effects of pneumatic actuator design on slip control for heavy vehicles. Veh. Syst. Dyn. 2013, 51, 139–164. [Google Scholar] [CrossRef]
- Kienhofer, F. Heavy Vehicle Wheel Slip Control. Ph.D. Thesis, University of Cambridge, Cambridge, UK, 2011. [Google Scholar]
- Henderson, L.; Cebon, D. Full-scale testing of a novel slip control braking system for heavy vehicles. Proc. Inst. Mech. Eng. Part D J. Automob. Eng. 2016, 230, 1221–1238. [Google Scholar] [CrossRef] [Green Version]
- Zhang, R.; Li, K.; He, Z.; Wang, H.; You, F. Advanced emergency braking control based on a nonlinear model predictive algorithm for intelligent vehicles. Appl. Sci. 2017, 7, 504. [Google Scholar] [CrossRef]
- Bu, F.; Tan, H.S. Pneumatic brake control for precision stopping of heavy-duty vehicles. IEEE Trans. Control Syst. Technol. 2007, 15, 53–63. [Google Scholar] [CrossRef]
- Miller, J.; Henderson, L.M.; Cebon, D. Designing and testing an advanced pneumatic braking system for heavy vehicles. Proc. Inst. Mech. Eng. Part C J. Mech. Eng. Sci. 2013, 227, 1715–1729. [Google Scholar] [CrossRef]
- Wan, Z.; Gao, F.; Ding, J. Dynamics model and braking performance analysis of multi-axle vehicle. China Mech. Eng. 2008, 19, 365–369. [Google Scholar]
- Jiang, F.; Gao, Z. An application of nonlinear PID control to a class of truck ABS problems. In Proceedings of the 40th IEEE Conference on Decision and Control (CDC), Orlando, FL, USA, December 2001; Volume 1, pp. 516–521. [Google Scholar]
- Patil, J.; Palanivelu, S.; Jindal, A. Mathematical model of dual brake valve for dynamic characterization. SAE Tech. Pap. 2013. [Google Scholar] [CrossRef]
- Russomanno, A.; Gillespie, R.B.; O’Modhrain, S. Modeling pneumatic actuators for a refreshable tactile display. In Haptics: Neuroscience, Devices, Modeling and Applications 2014; Springer: Berlin/Heidelberg, Germany, 2014; pp. 385–393. [Google Scholar]
- Natarajan, S.V.; Subramanian, S.C.; Darbha, S. A model of the relay valve used in an air brake system. Nonlinear Anal. Hybrid Syst. 2007, 1, 430–442. [Google Scholar] [CrossRef]
- Gastaldi, L.; Pastorelli, S.; Sorli, M. Static and dynamic experimental investigation of a pneumatic open loop proportional valve. Exp. Mech. 2016, 40, 1377–1385. [Google Scholar] [CrossRef]
- Selvaraj, M.; Gaikwad, S.; Suresh, A.K. Modeling and simulation of dynamic behavior of pneumatic brake system at vehicle level. SAE Tech. Pap. 2014. [Google Scholar] [CrossRef]
- He, L.; Wang, X.L. Modeling and simulation vehicle air brake system. In Proceedings of the IEEE 8th Modelica Conference, Dresden, Germany, 20–22 March 2011; pp. 430–435. [Google Scholar]
- Pugi, L.; Malvezzi, M.; Tarasconi, A.; Palazzolo, A.; Cocci, G.; Violani, M. HIL simulation of WSP systems on MI-6 test rig. Veh. Syst. Dyn. 2006, 44, 843–852. [Google Scholar] [CrossRef]
- Bartlett, W.D. Calculation of deceleration rates for S-Cam Air-Braked heavy trucks equipped with Anti-Lock brake systems. SAE Tech. Pap. 2007. [Google Scholar] [CrossRef]
- Lei, Y.; Liu, K.; Fu, Y. Research on driving style recognition method based on driver’s dynamic demand. Adv. Mech. Eng. 2016, 8, 1–14. [Google Scholar] [CrossRef]
- Meng, D.; Zhang, L.; Yu, Z. A dynamic model for brake pedal feel analysis in passenger cars. Proc. Inst. Mech. Eng. Part D J. Automob. Eng. 2015, 230, 955–968. [Google Scholar] [CrossRef]
- Bowlin, C.L.; Subramanian, S.C.; Darbha, S.; Rajagopal, K.R. Pressure control scheme for air brakes in commercial vehicles. IEE Proc. Intell. Transp. Syst. 2006, 153, 21–32. [Google Scholar] [CrossRef]
- Qin, T. Research on Delay Time Analysis and Its Control Techniques of Bus Pneumatic Braking System. Ph.D. Thesis, Wuhan University of Technology, Wuhan, China, 2012. [Google Scholar]
- Fang, E.; Zhang, D.L.; Cheng, Z.D. Research on the method and application of driver’s braking intention recognition for passenger car. Shanghai Auto 2016, 1, 49–53. [Google Scholar]
- Kumar, Y.S.R.R.; Sonawane, D.B.; Subramanian, S.C. Application of PID control to an electro-pneumatic brake system. Int. J. Adv. Eng. Sci. Appl. Math. 2012, 4, 260–268. [Google Scholar] [CrossRef]
- Qin, T.; Li, G.Y.; Tu, M. Bus pneumatic braking circuit delay analysis and control. Trans. Beijing Inst. Technol. 2012, 32, 470–474. [Google Scholar]
- Wang, Y.; Ning, G.A. Parameter selection for the identification of driver’s braking intention for passenger car. Automot. Eng. 2011, 33, 213–216. [Google Scholar]


| Name | Type | Range | Precision |
|---|---|---|---|
| Servo driver | TJE075-S100 | 0–40 mm | 0.5% FS (measurement) 1% FS (control) |
| Pressure sensor | MEAS | 0–1.6 Mpa | 0.3% FS |
| Force sensor | PST2T | 0–20000 N | 0.5% FS |
| Displacement sensor | DA35 | 0–35 mm | 0.5% FS |
| pipeline | Φ10PA | 0–2 Mpa | - |
| Control valves | WABCO | - | |
| Group | Propulsion Displacement (l/mm) (Brake and Brake Release) | Action Time (t/s) (Brake and Brake Release) |
|---|---|---|
| 1 | 6 | 0.20 |
| 2 | 8 | 0.27 |
| 3 | 10 | 0.33 |
| 4 | 12 | 0.40 |
| 5 | 14 | 0.46 |
| 6 | 14 | 2.50 |
| Testing Groups | |||||||||||||
|---|---|---|---|---|---|---|---|---|---|---|---|---|---|
| Loop | 1 | 2 | 3 | 4 | 5 | 6 | |||||||
| Up | Dw | Up | Dw | Up | Dw | Up | Dw | Up | Dw | Up | Dw | ||
| Delay Time/Δdel | A | 0.38 | 0.48 | 0.42 | 0.62 | 0.48 | 0.72 | 0.58 | 0.88 | 0.67 | 1.02 | 2.49 | 2.66 |
| B | 0.31 | 0.45 | 0.34 | 0.51 | 0.42 | 0.73 | 0.50 | 0.84 | 0.62 | 0.93 | 2.41 | 2.63 | |
| C | 0.37 | 0.47 | 0.36 | 0.55 | 0.45 | 0.72 | 0.52 | 0.83 | 0.61 | 0.95 | 2.42 | 2.67 | |
| D | 0.39 | 0.53 | 0.42 | 0.65 | 0.49 | 0.78 | 0.61 | 0.86 | 0.66 | 1.04 | 2.47 | 2.71 | |
| E | 0.47 | 0.55 | 0.52 | 0.67 | 0.55 | 0.81 | 0.68 | 0.92 | 0.72 | 1.10 | 2.56 | 2.73 | |
| F | 0.41 | 0.54 | 0.45 | 0.62 | 0.52 | 0.75 | 0.65 | 0.89 | 0.70 | 1.04 | 2.50 | 2.68 | |
| G | 0.42 | 0.53 | 0.46 | 0.63 | 0.53 | 0.76 | 0.67 | 0.91 | 0.72 | 1.06 | 2.52 | 2.69 | |
| H | 0.48 | 0.59 | 0.55 | 0.69 | 0.57 | 0.83 | 0.69 | 0.97 | 0.78 | 1.12 | 2.57 | 2.75 | |
| Loop | K1 | K2 | W | R2 | ||||
|---|---|---|---|---|---|---|---|---|
| Up | Down | Up | Down | Up | Down | Up | Down | |
| A | 0.597 | 0.290 | −0.238 | 0.621 | 0.378 | 0.192 | 0.997 | 0.996 |
| B | 0.759 | 0.158 | −0.423 | 0.746 | 0.356 | 0.109 | 0.998 | 0.985 |
| C | 0.754 | 0.117 | −0.520 | 0.778 | 0.447 | 0.130 | 0.980 | 0.993 |
| D | 0.393 | 0.321 | 0.026 | 0.497 | 0.308 | 0.287 | 0.975 | 0.990 |
| E | 0.353 | 0.407 | 0.026 | 0.473 | 0.401 | 0.299 | 0.958 | 0.997 |
| F | 0.355 | 0.653 | 0.115 | 0.087 | 0.299 | 0.394 | 0.975 | 0.999 |
| G | 0.397 | 0.533 | 0.081 | 0.298 | 0.316 | 0.324 | 0.971 | 0.999 |
| H | 0.601 | 0.450 | −0.243 | 0.409 | 0.488 | 0.352 | 0.977 | 0.998 |
© 2017 by the authors. Licensee MDPI, Basel, Switzerland. This article is an open access article distributed under the terms and conditions of the Creative Commons Attribution (CC BY) license (http://creativecommons.org/licenses/by/4.0/).
Share and Cite
Wang, Z.; Zhou, X.; Yang, C.; Chen, Z.; Wu, X. An Experimental Study on Hysteresis Characteristics of a Pneumatic Braking System for a Multi-Axle Heavy Vehicle in Emergency Braking Situations. Appl. Sci. 2017, 7, 799. https://doi.org/10.3390/app7080799
Wang Z, Zhou X, Yang C, Chen Z, Wu X. An Experimental Study on Hysteresis Characteristics of a Pneumatic Braking System for a Multi-Axle Heavy Vehicle in Emergency Braking Situations. Applied Sciences. 2017; 7(8):799. https://doi.org/10.3390/app7080799
Chicago/Turabian StyleWang, Zhe, Xiaojun Zhou, Chenlong Yang, Zhaomeng Chen, and Xuelei Wu. 2017. "An Experimental Study on Hysteresis Characteristics of a Pneumatic Braking System for a Multi-Axle Heavy Vehicle in Emergency Braking Situations" Applied Sciences 7, no. 8: 799. https://doi.org/10.3390/app7080799