3.1. Physicochemical Properties of Biodiesel
Biodiesel has promising lubricating properties and cetane number compared to low sulfur diesel fuels [
19]. The lower heating value of biodiesel is about 37.4 MJ/kg, which is 9% lower than regular fossil diesel. Biodiesel has higher cetane values, resulting in better ignition. The higher cetane number a fuel possesses, the more easily the fuel can combust in a compression ignition engine. Faster premixed combustion can effectively shorten the ignition delay period, reducing the peak of pressure rise rate. Therefore, higher-cetane fuel is usually considered to cause an engine to run more smoothly and quietly. The basic physical and chemical properties of biodiesel and standard diesel are shown in
Table 3.
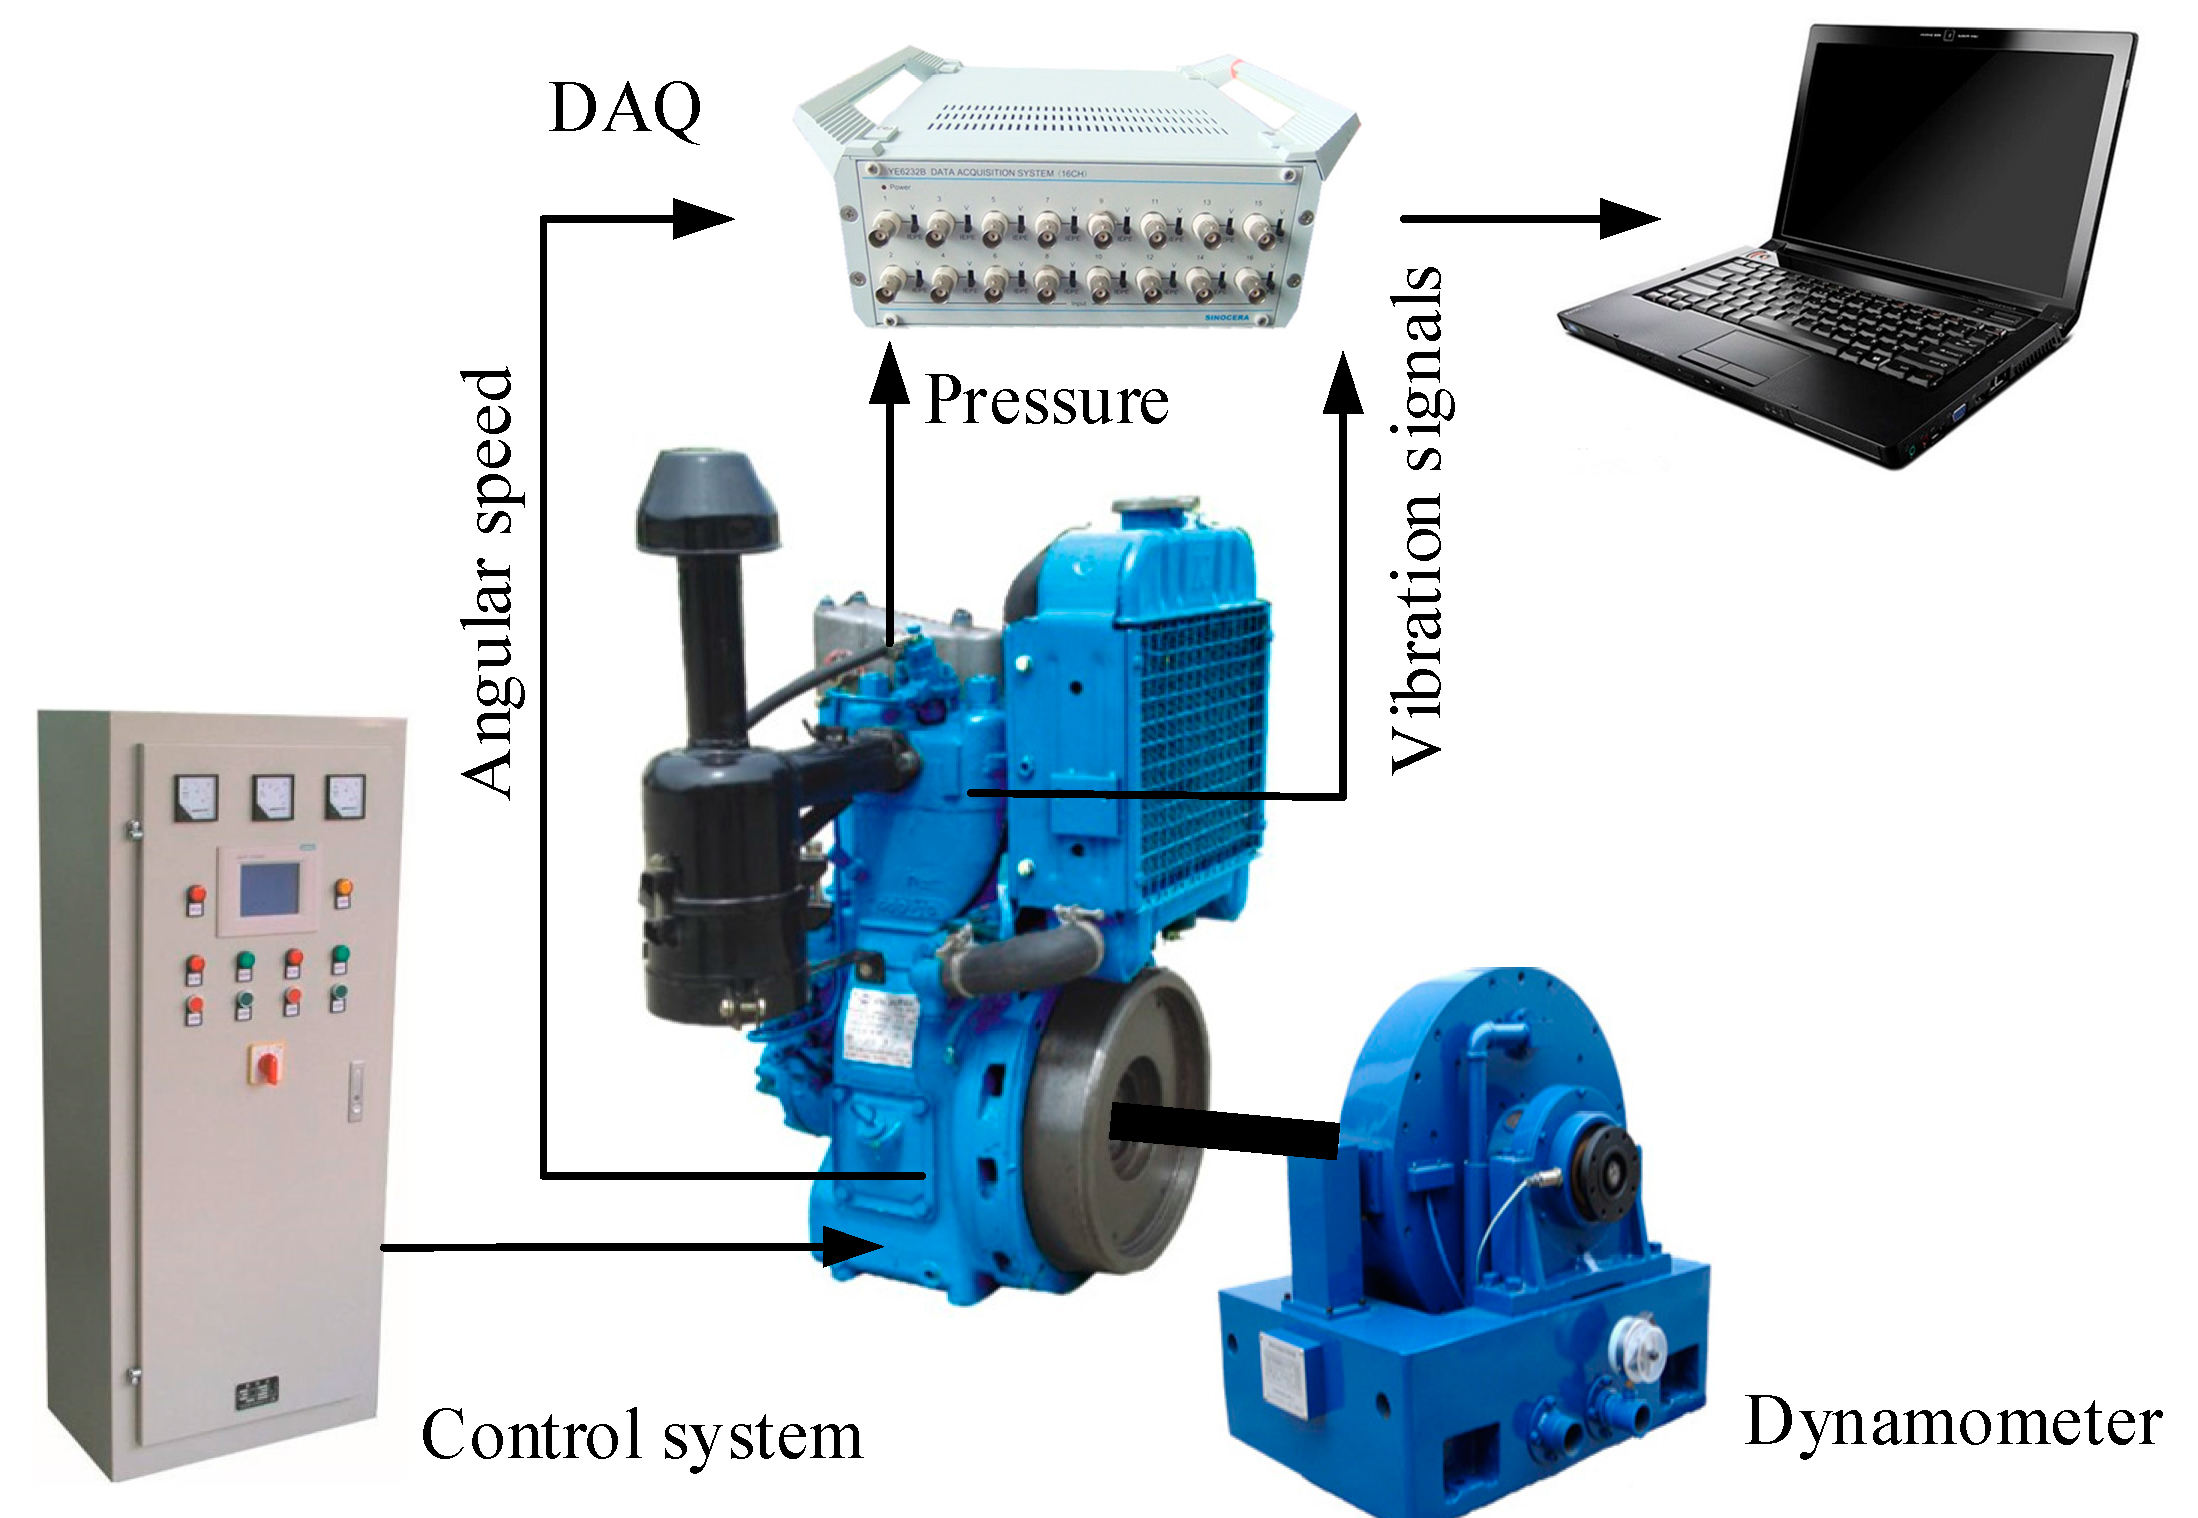
In this study, pure biodiesel and pure fossil diesel were prepared and used as the basis for investigating the influences of alternative fuels. The biodiesel was produced from waste cooking oil based on ASTM D6751-09 standard [
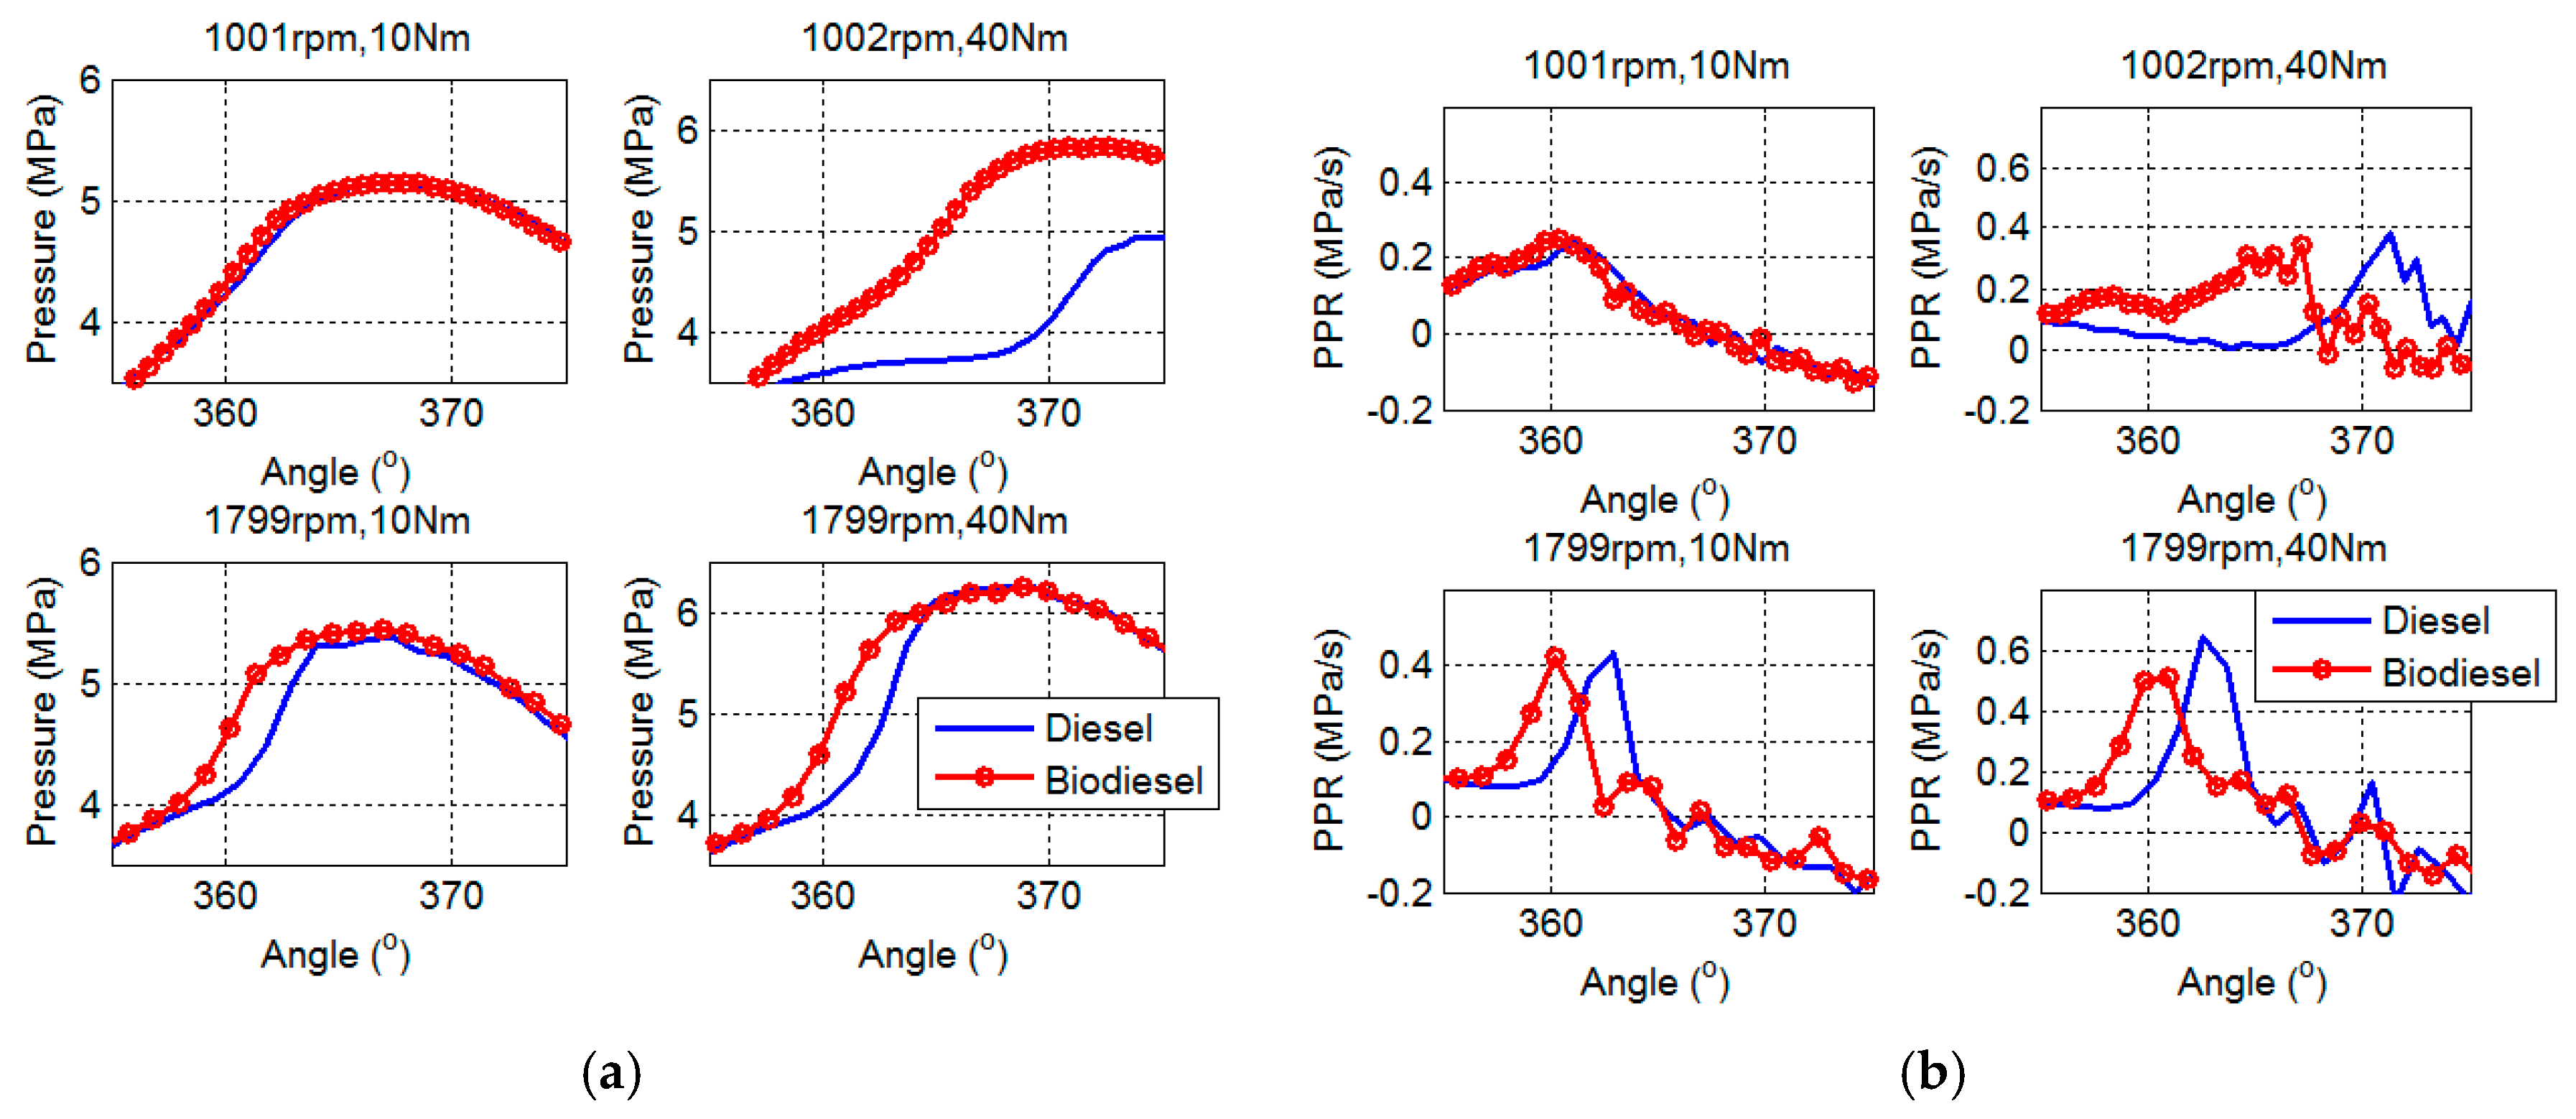
20]. The in-cylinder combustion pressures of two kinds of fuels at four different operating conditions were acquired from a single-cylinder diesel engine. The measured pressure curves and calculated pressure rise rates are presented in
Figure 8.
Compared with fossil diesel, biodiesel always shows a pre-ignition phenomenon in different operating conditions, as seen in
Figure 8. A higher cetane number of biodiesel means faster in-cylinder burning velocity. The faster the premixed combustion, the shorter the ignition delay period and the lower the peak of pressure rise rate. This also explains why biodiesel possesses a lower magnitude in the peak of pressure rise rate than the others.
In the operating condition of 1000 rpm engine speed and 40 Nm torque output, both fuels exhibit substantial delays in the peak of combustion pressure. With the engine load going up, the increased fuel delivery per cycle will significantly enhance the heat release of the premixed combustion phase, and enlarge the in-cylinder pressure. In the meantime, the increased proportion of premixed combustion can cause phase delay in the whole combustion process, resulting in the appearance of a significantly delayed pressure peak.
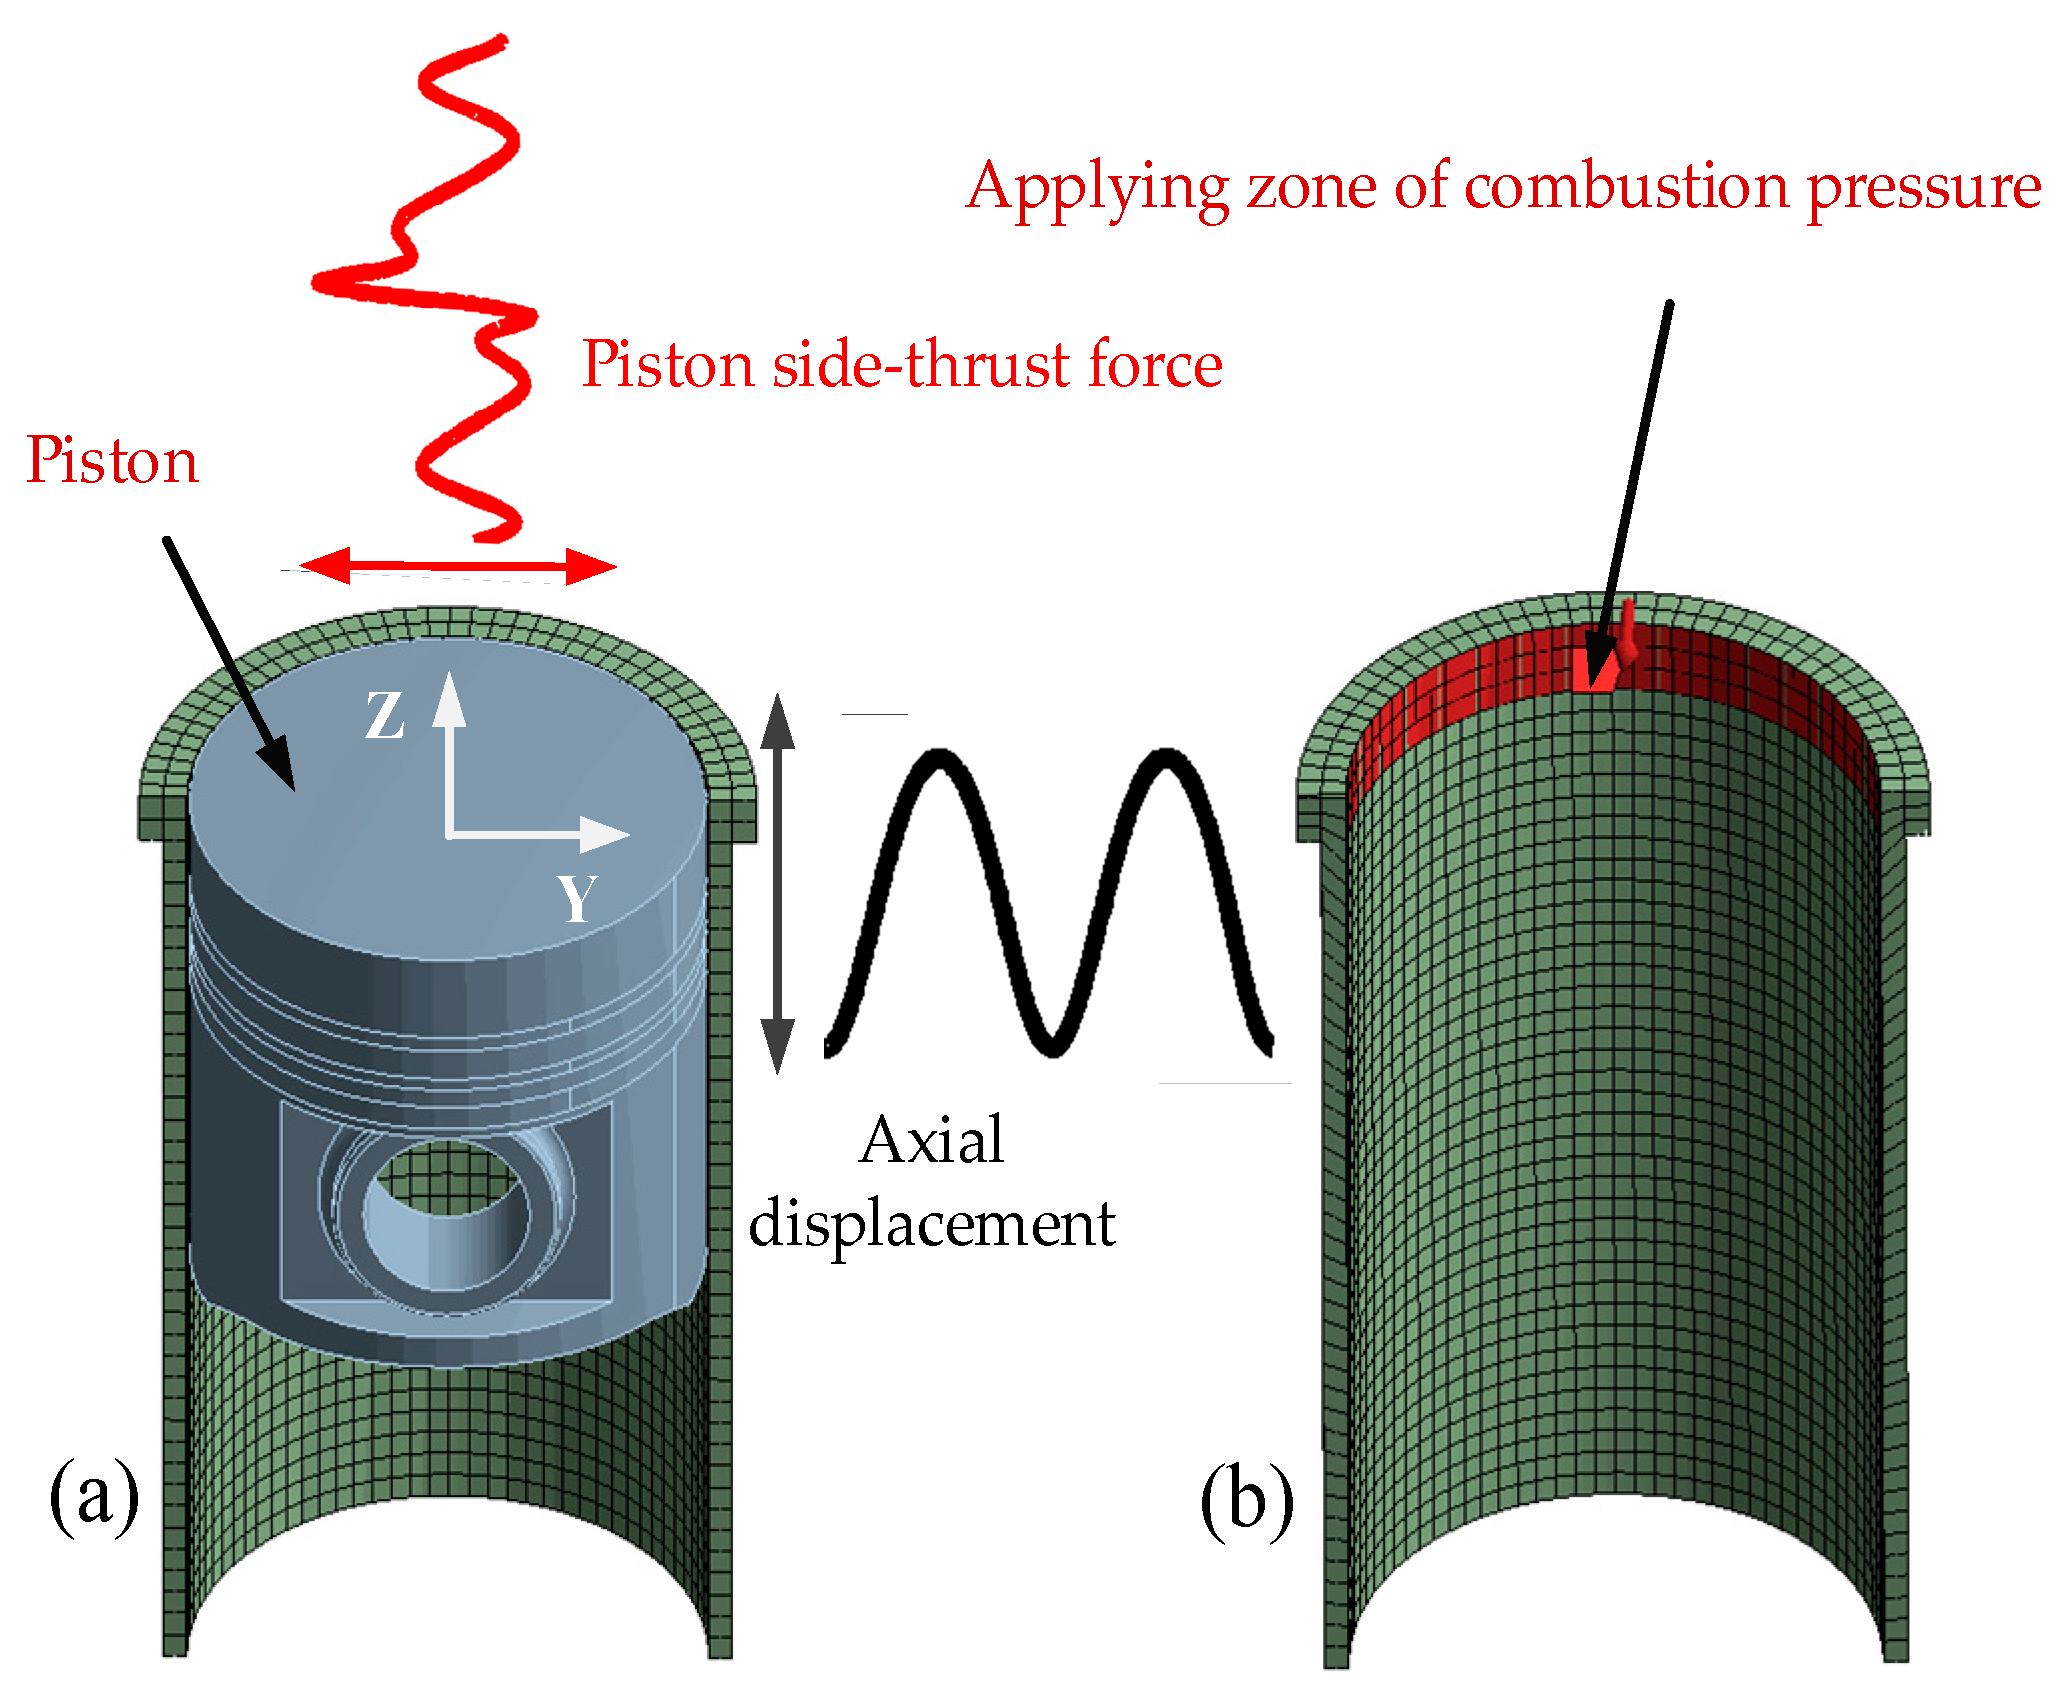
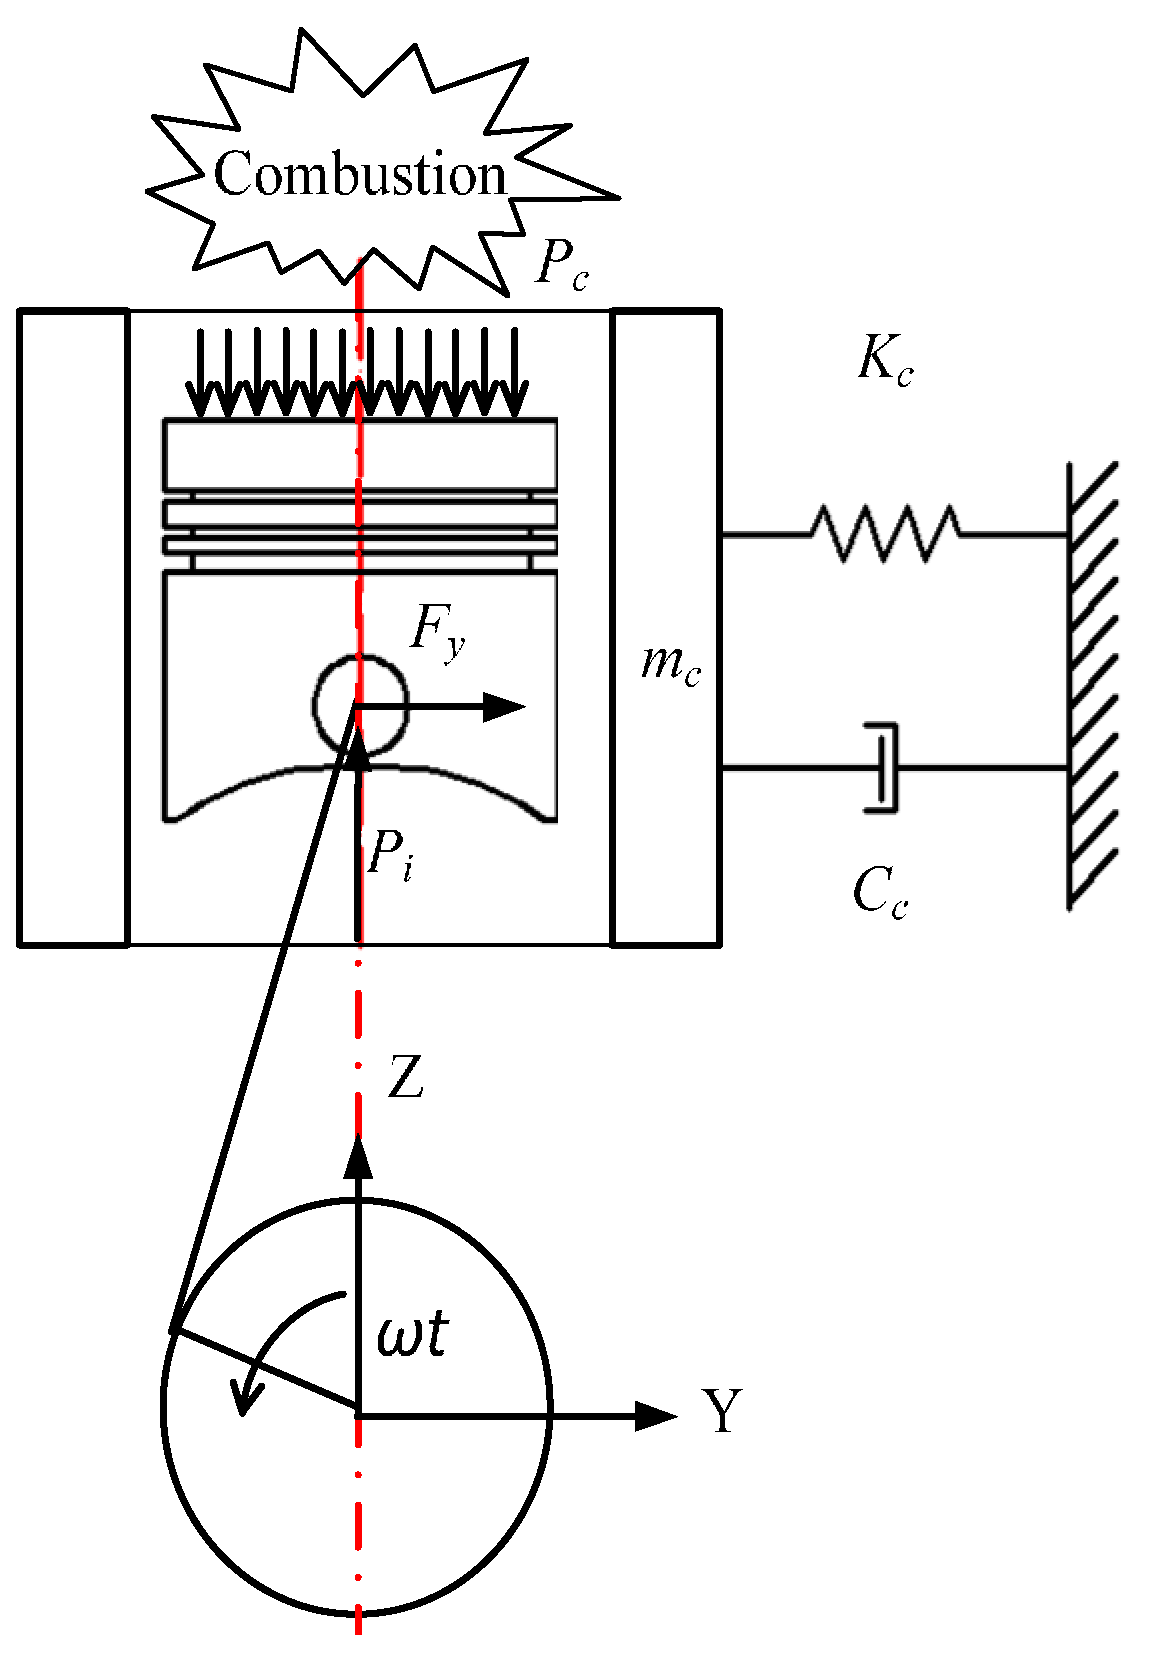
As mentioned above, the periodically changing side-thrust force can be decomposed from the longitudinally acting combustion force and inertial force of the moving piston assembly. Therefore, the lateral driving force of the piston that is applied to the cylinder liner is bound to be affected by variations in the combustion force, determined by the combustion characteristics of different fuels.
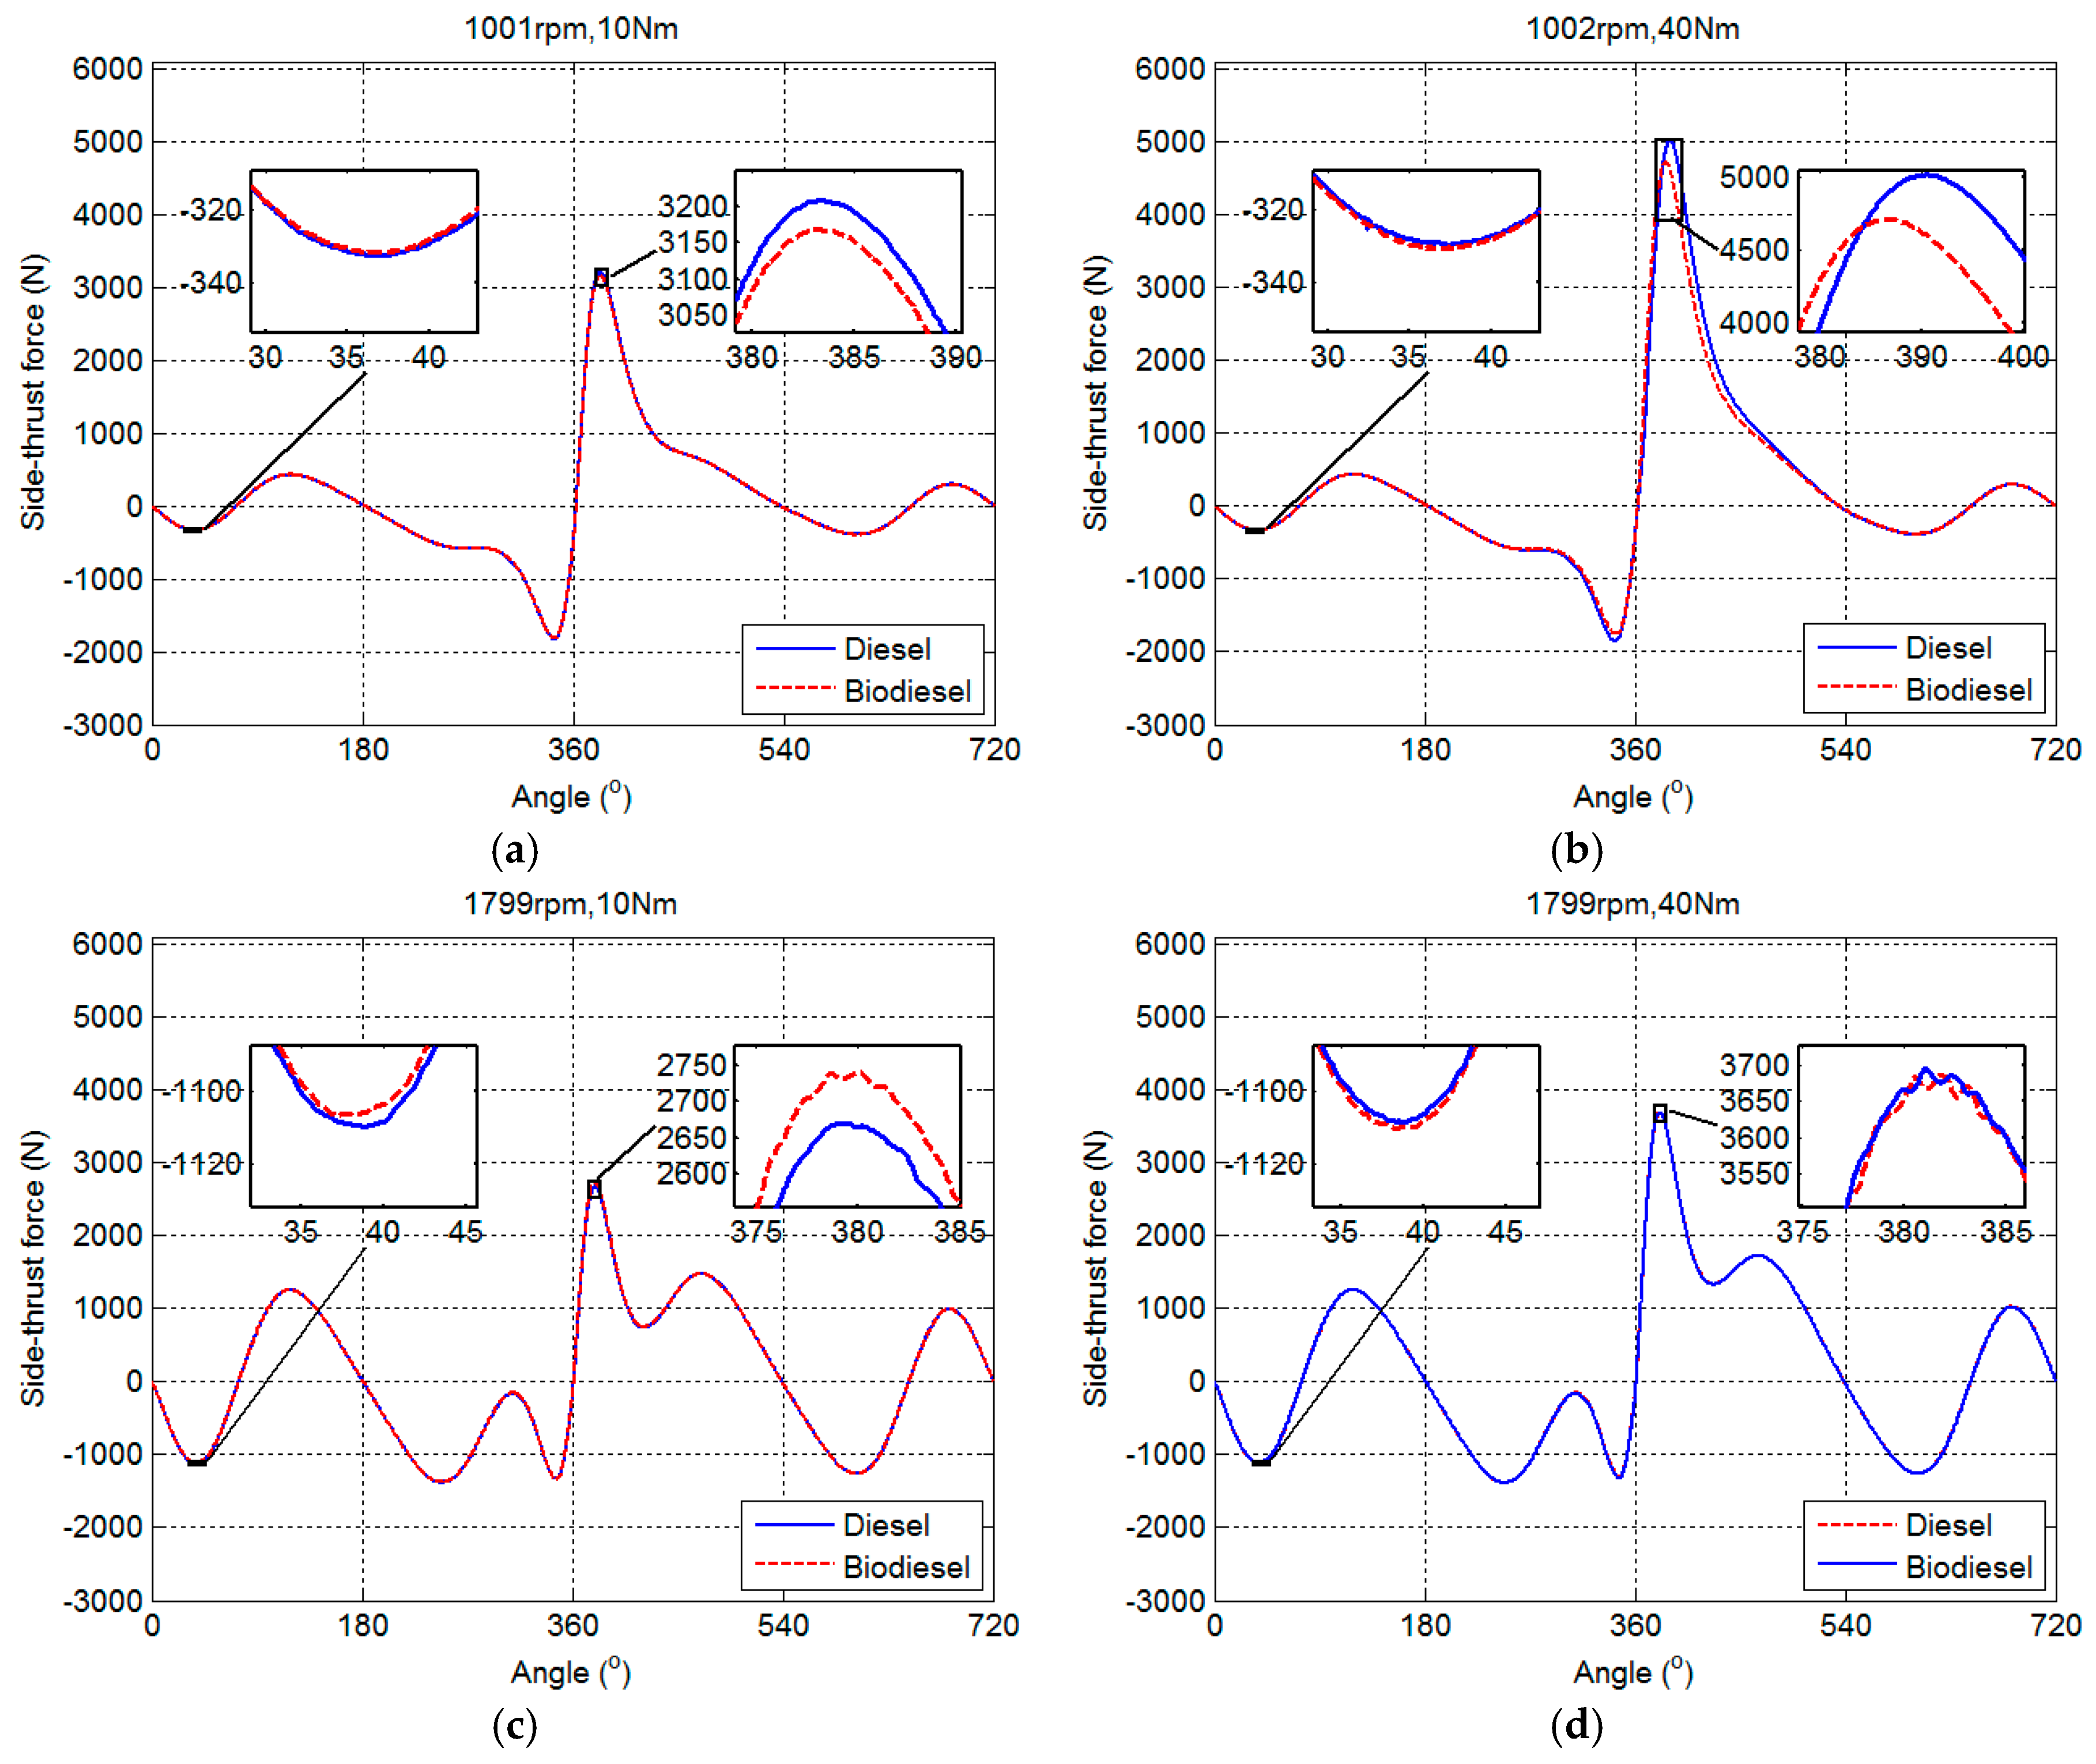
The influence of differences in fuel types on the piston side-thrust force mainly manifests clear differences in its peak value and associated phase. Under low speed conditions, the peak value of the side-thrust force after combustion top dead center (TDC) burning with biodiesel is lower than that with diesel, as seen in
Figure 9a,b, which might be attributed to the lower pressure peaks. In the high-speed condition of 1800 rpm and 10 Nm, the peak value of biodiesel is slightly larger than that of diesel. Under high-speed conditions, the peak values of side force burning with biodiesel are close to those of diesel. This is because biodiesel has lower energy content than diesel fuel. Therefore, more fuel is injected into the combustion chamber to obtain the same amount of power as that of the diesel-fueled engine, resulting in a longer period of high-pressure in-cylinder state, i.e., prolonged mixing-controlled combustion phase. A prolonged mixing-controlled combustion phase can lead to a separation between the peaks of the combustion force and the longitudinal inertia force of piston assembly. The combustion force acting on the piston head is not completely cancelled, thereby resulting in a greater lateral force around the crank angle of 380°.
Due to the compound effect between the combustion force and inertia force, the peaks of piston side-thrust force appear around the crank angle of 380–385°, which shows that there is a large deviation between the peaks of side-thrust force and pressure. Therefore, to understand the cause of changes in piston side-thrust forces fueled with biodiesel relative to fossil diesel, it is essential to contrast and analyze the amplitude of in-cylinder pressure from the crank angle of 375° to 385°.
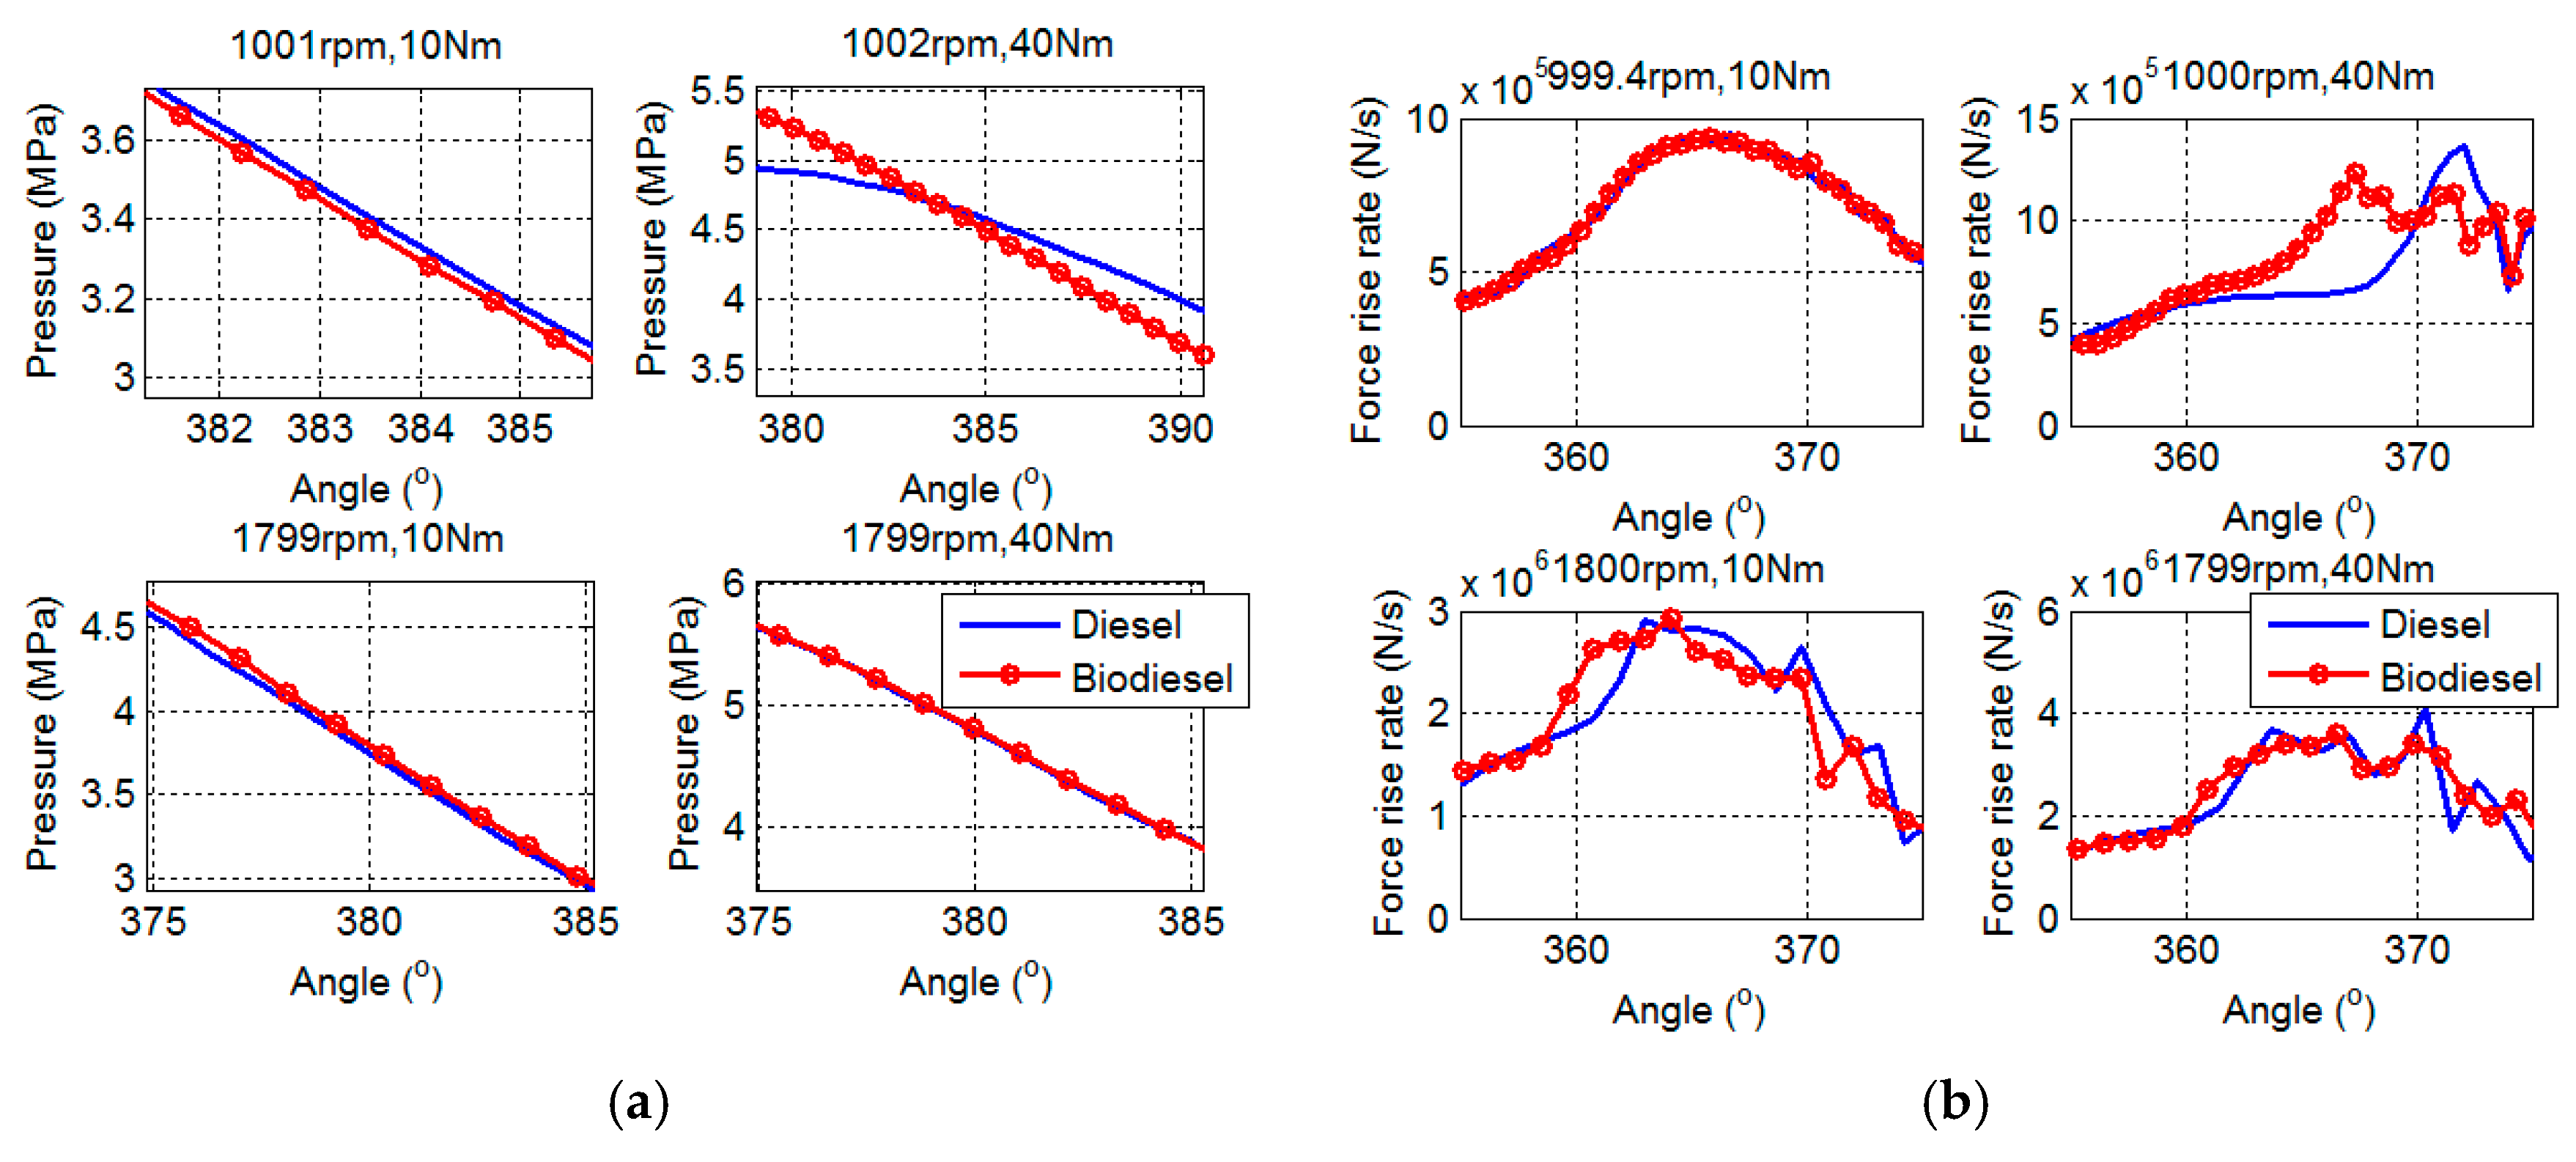
As seen in
Figure 10a, the amplitudes of in-cylinder pressure burning with biodiesel and diesel are consistent with the peak value of side thrust forces under all four operating conditions in
Figure 9, suggesting that the peak value of piston side-thrust force depends more on the amplitude of pressure during mixing-controlled combustion period around 380–385°, rather than the amplitude of peak pressure or pressure rise rate. The amplitude of combustion pressure at the initial stage of mixing-controlled combustion period is jointly determined by the cetane number and the heating value of fuel types. The advanced ignition phase, caused by the higher cetane number of biodiesel, results in a lower amplitude of in-cylinder pressure burning with biodiesel during the initial stage of mixing-controlled combustion period than diesel. Under high-speed conditions, the combustion-supporting characteristic of the high oxygen fraction in biodiesel improves the combustion process, thus leading to a combustion pressure close to, or even above, the pressure of diesel.
The peak values of force rise rates show a high similarity to the rise rates of in-cylinder pressure, as shown in
Figure 10b. This may be because the changing trend of inertia force is relatively gentle; the rise rate of in-cylinder pressure is more likely to dominate the changes of piston side-thrust force. In addition, these differences in the force rise rate may cause significant changes in the lateral displacement and velocity of piston assembly before the collision, thus affecting the impact process and its subsequent vibrational responses. The similarity between the rise rates of piston side-thrust force and in-cylinder pressure indicates that the high cetane number is the most critical factor affecting the piston lateral movement and cylinder dynamics.
For a better understanding of the differences in the dynamic responses to combustion shocks and piston slaps, the radial displacement responses of a node on the anti-thrust side of the liner, corresponding to the measuring point in the actual test, are examined in subsequent sections.
3.2. Dynamic Responses to Combustion Forces
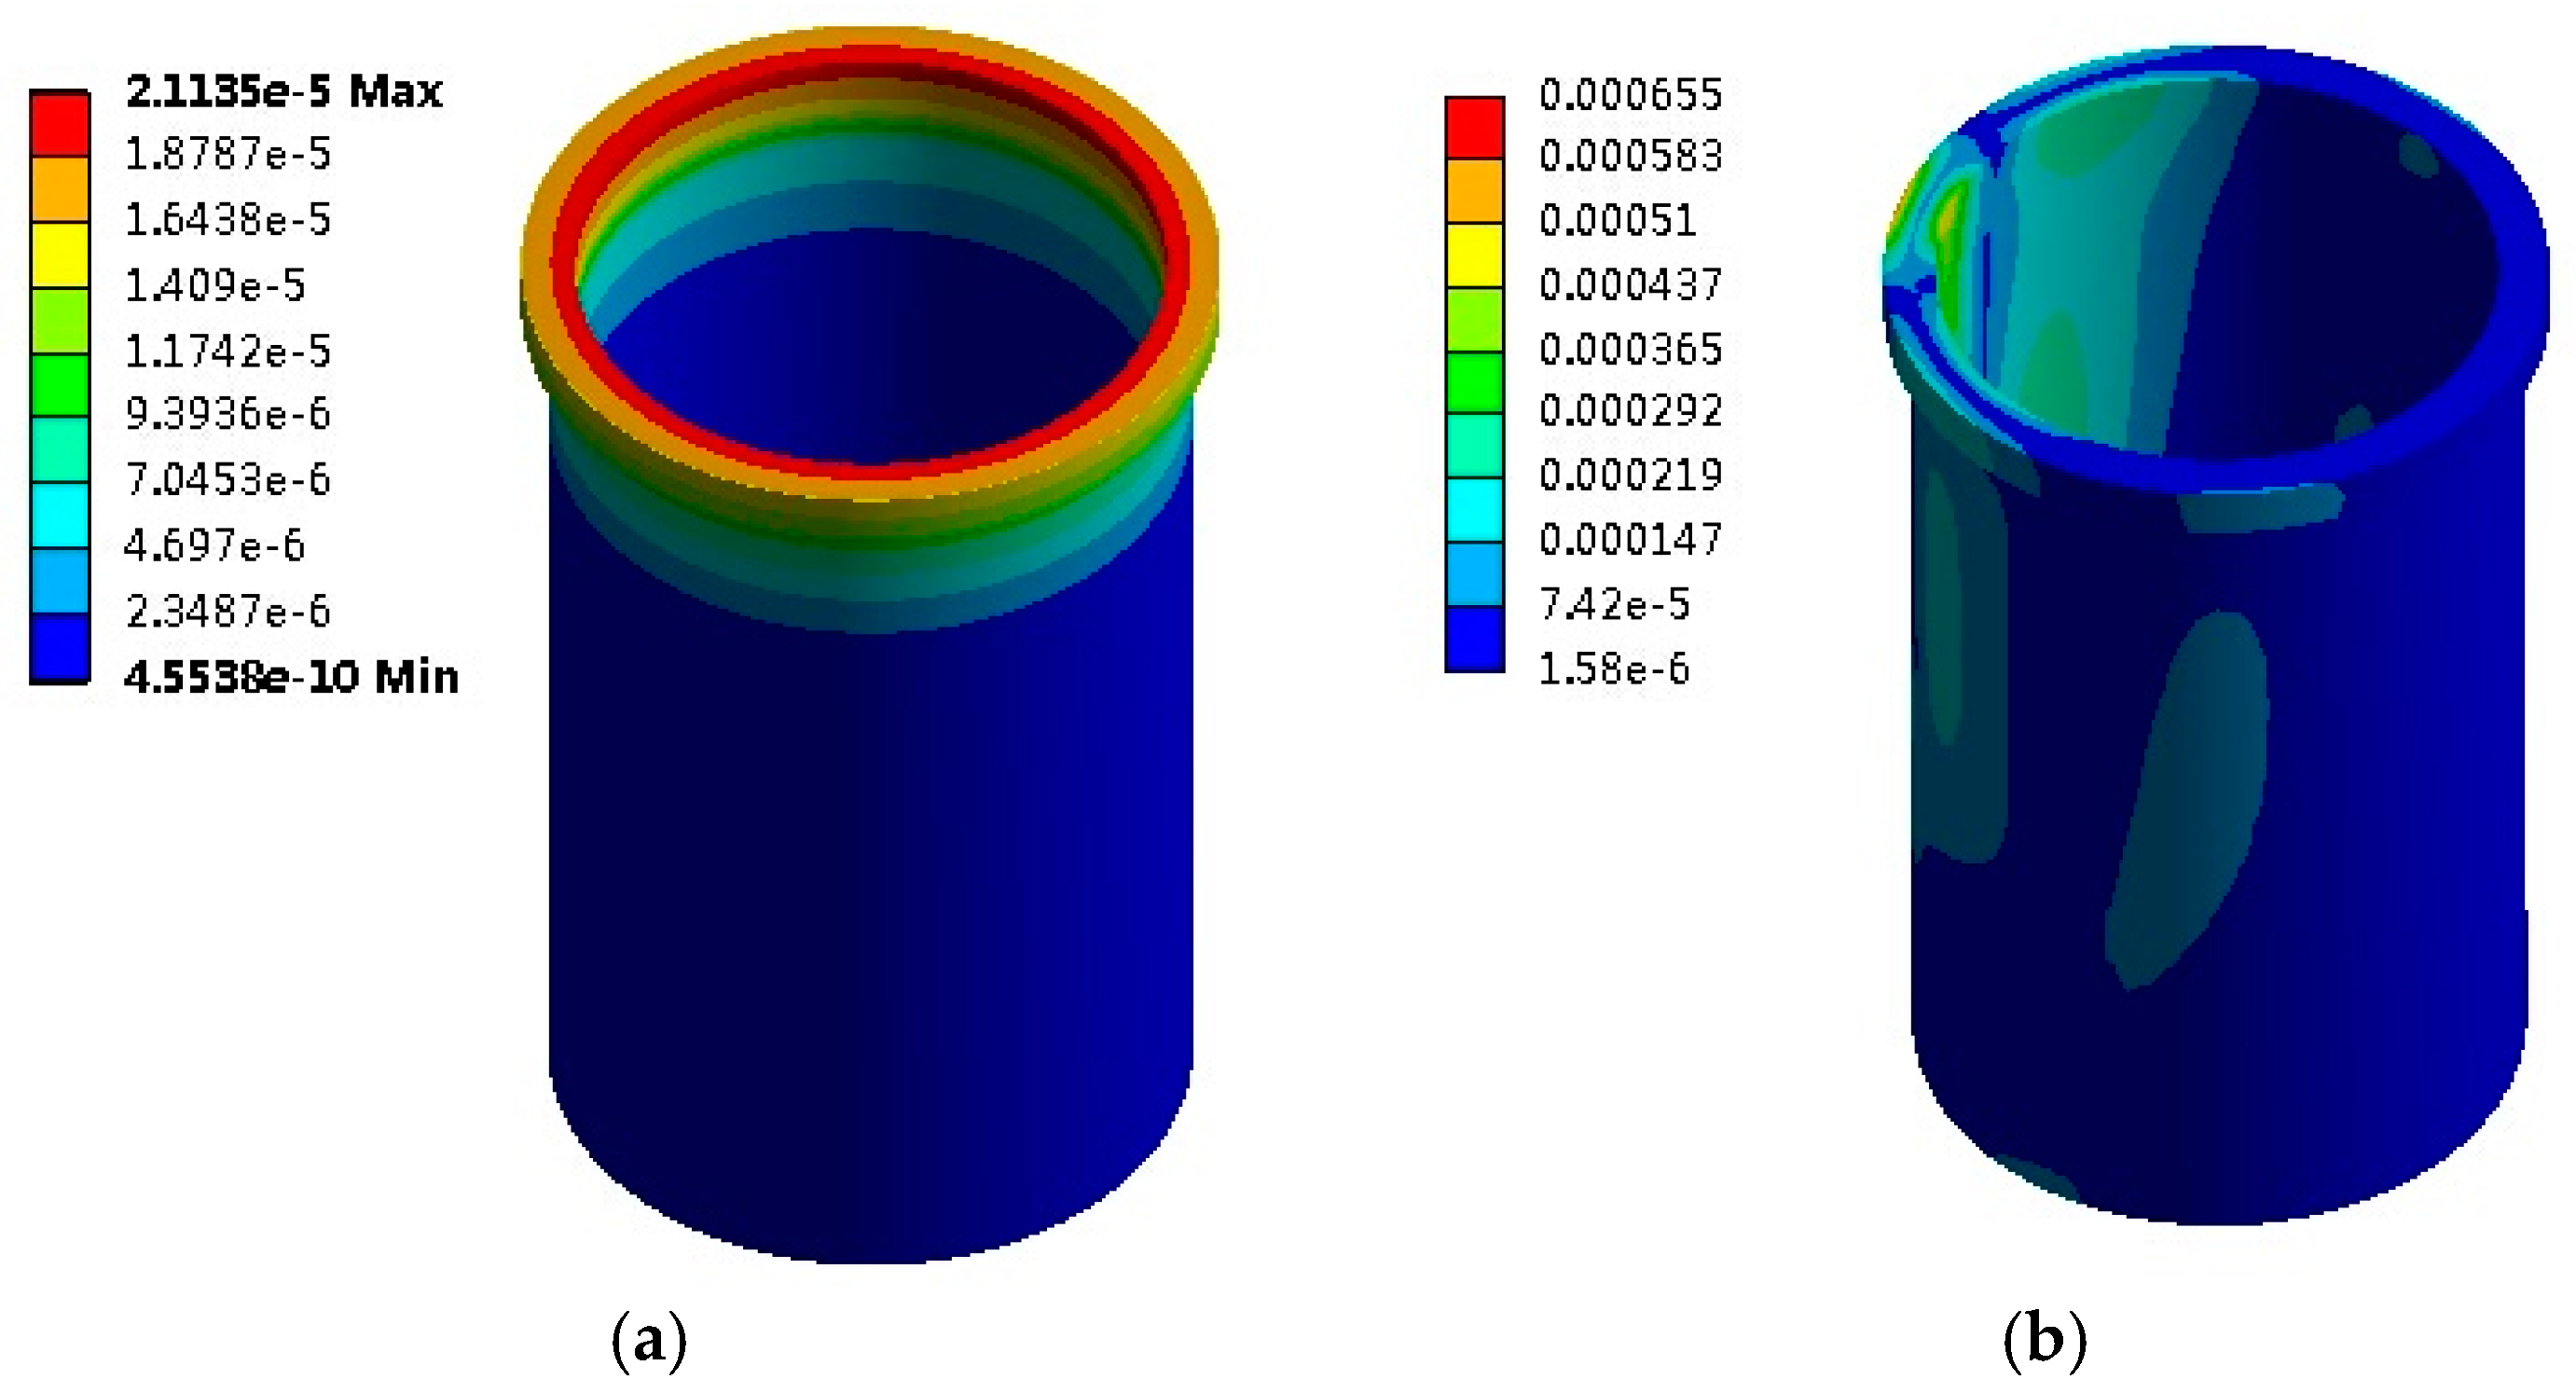
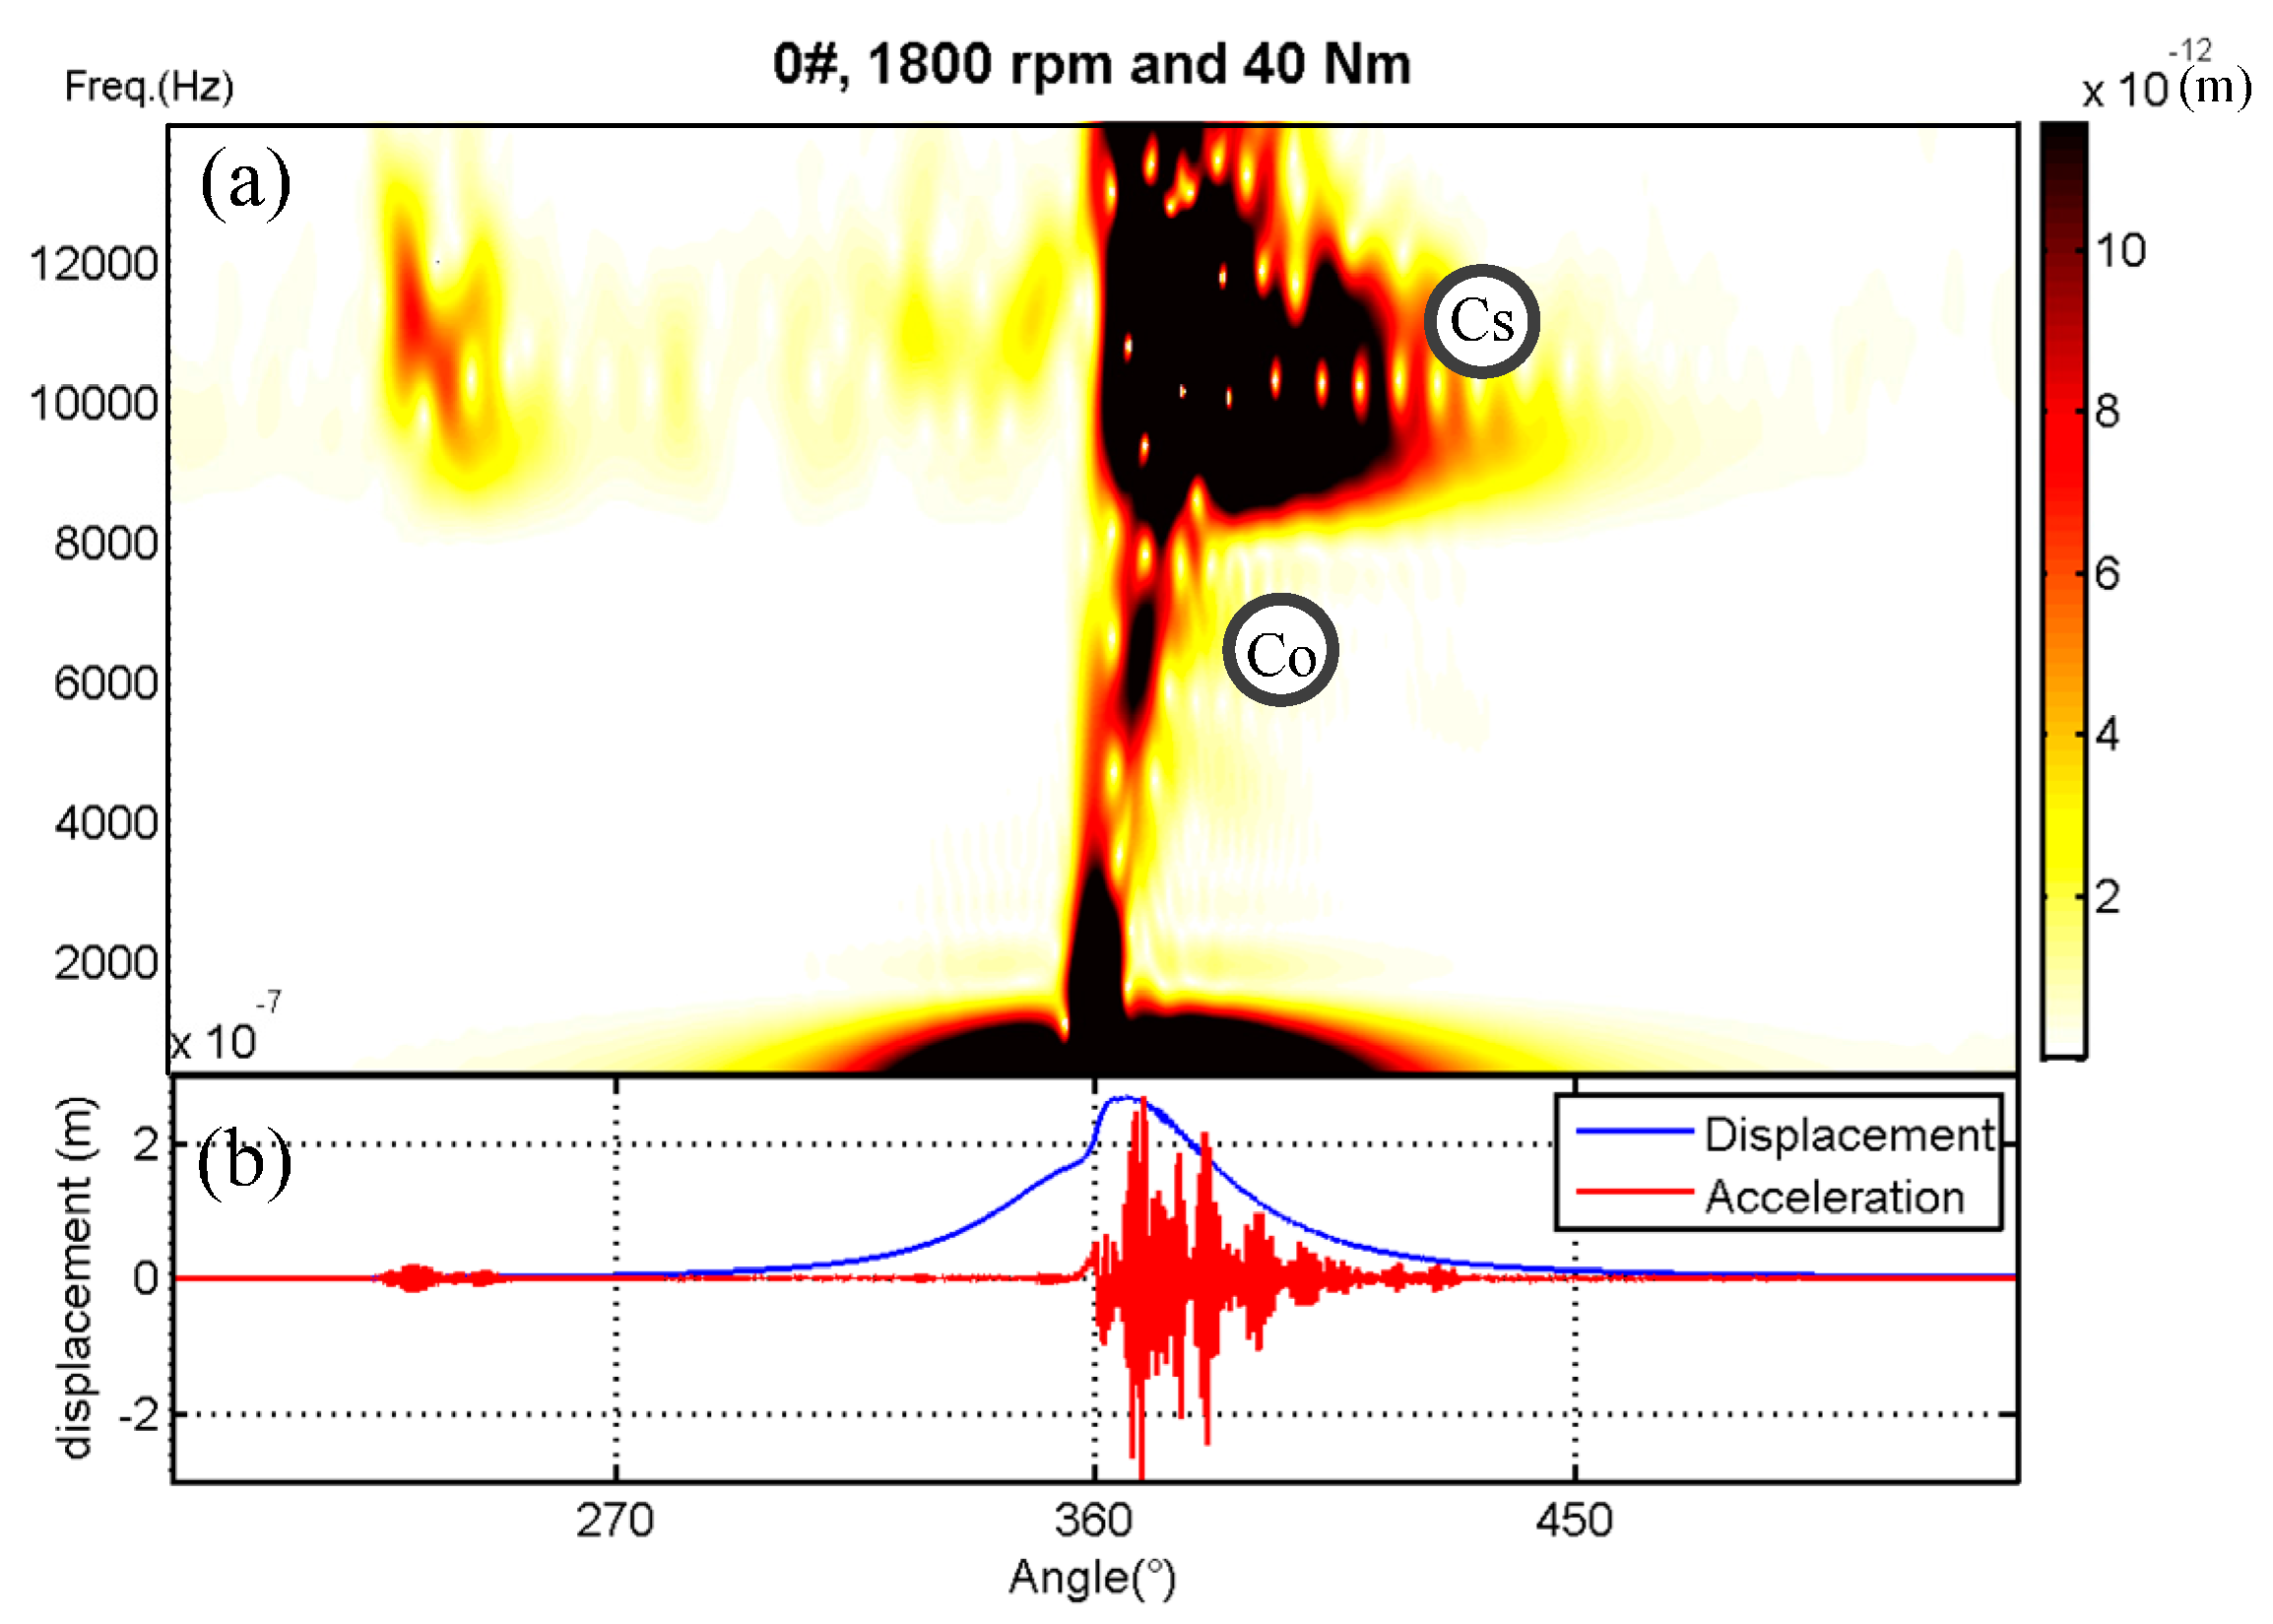
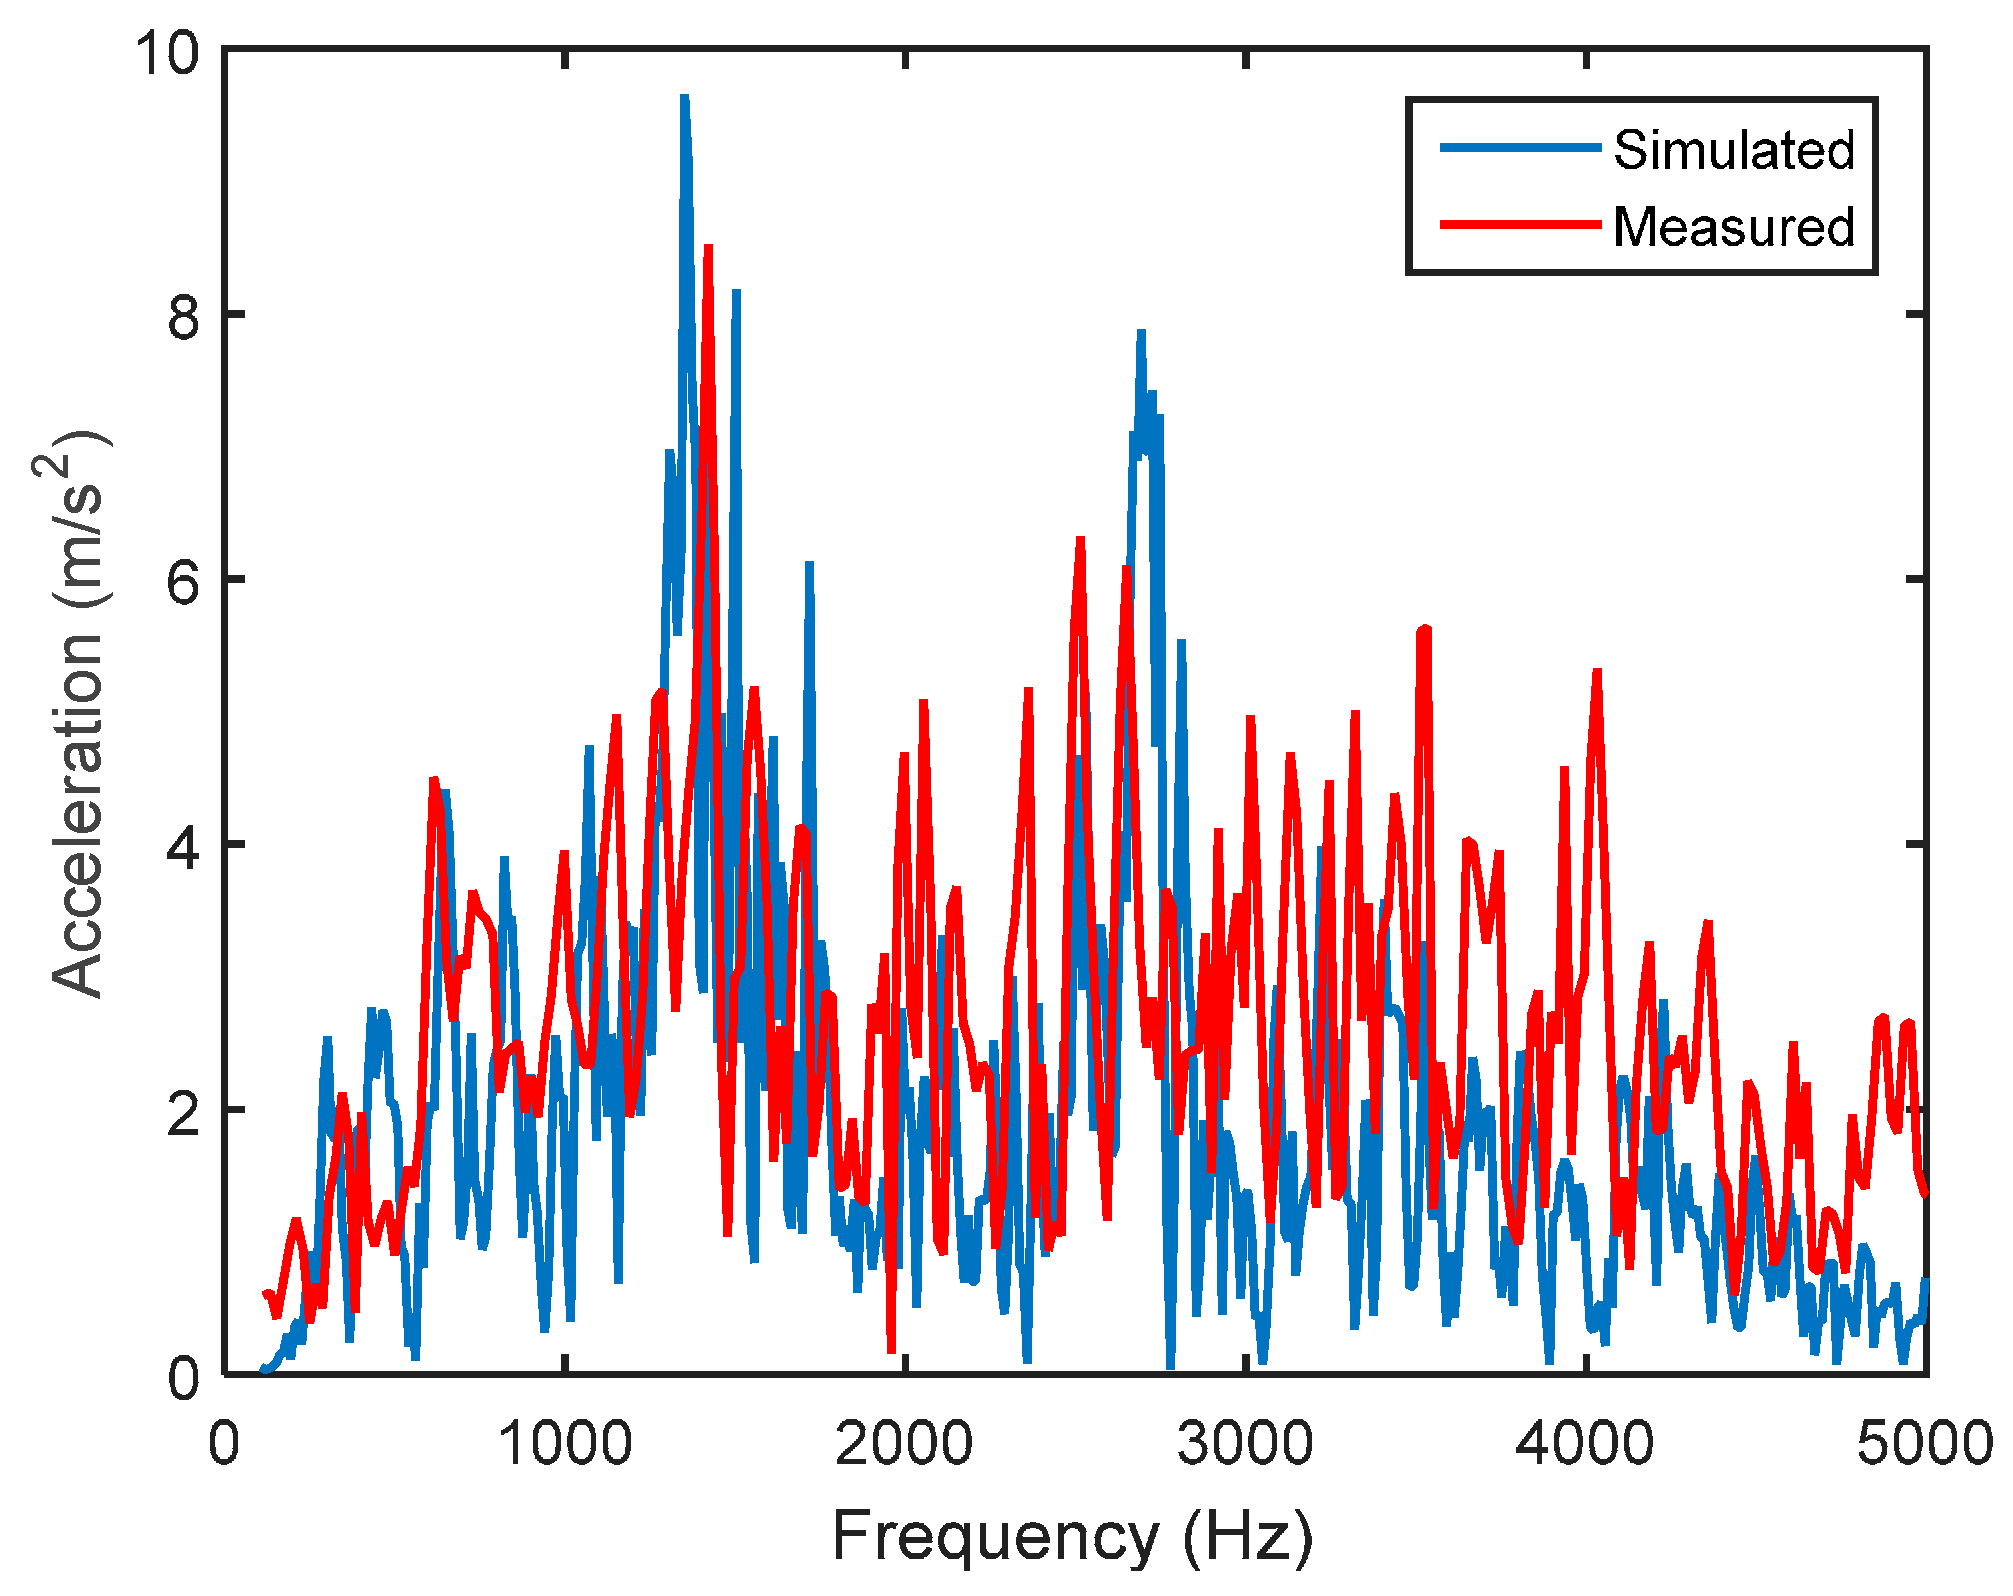
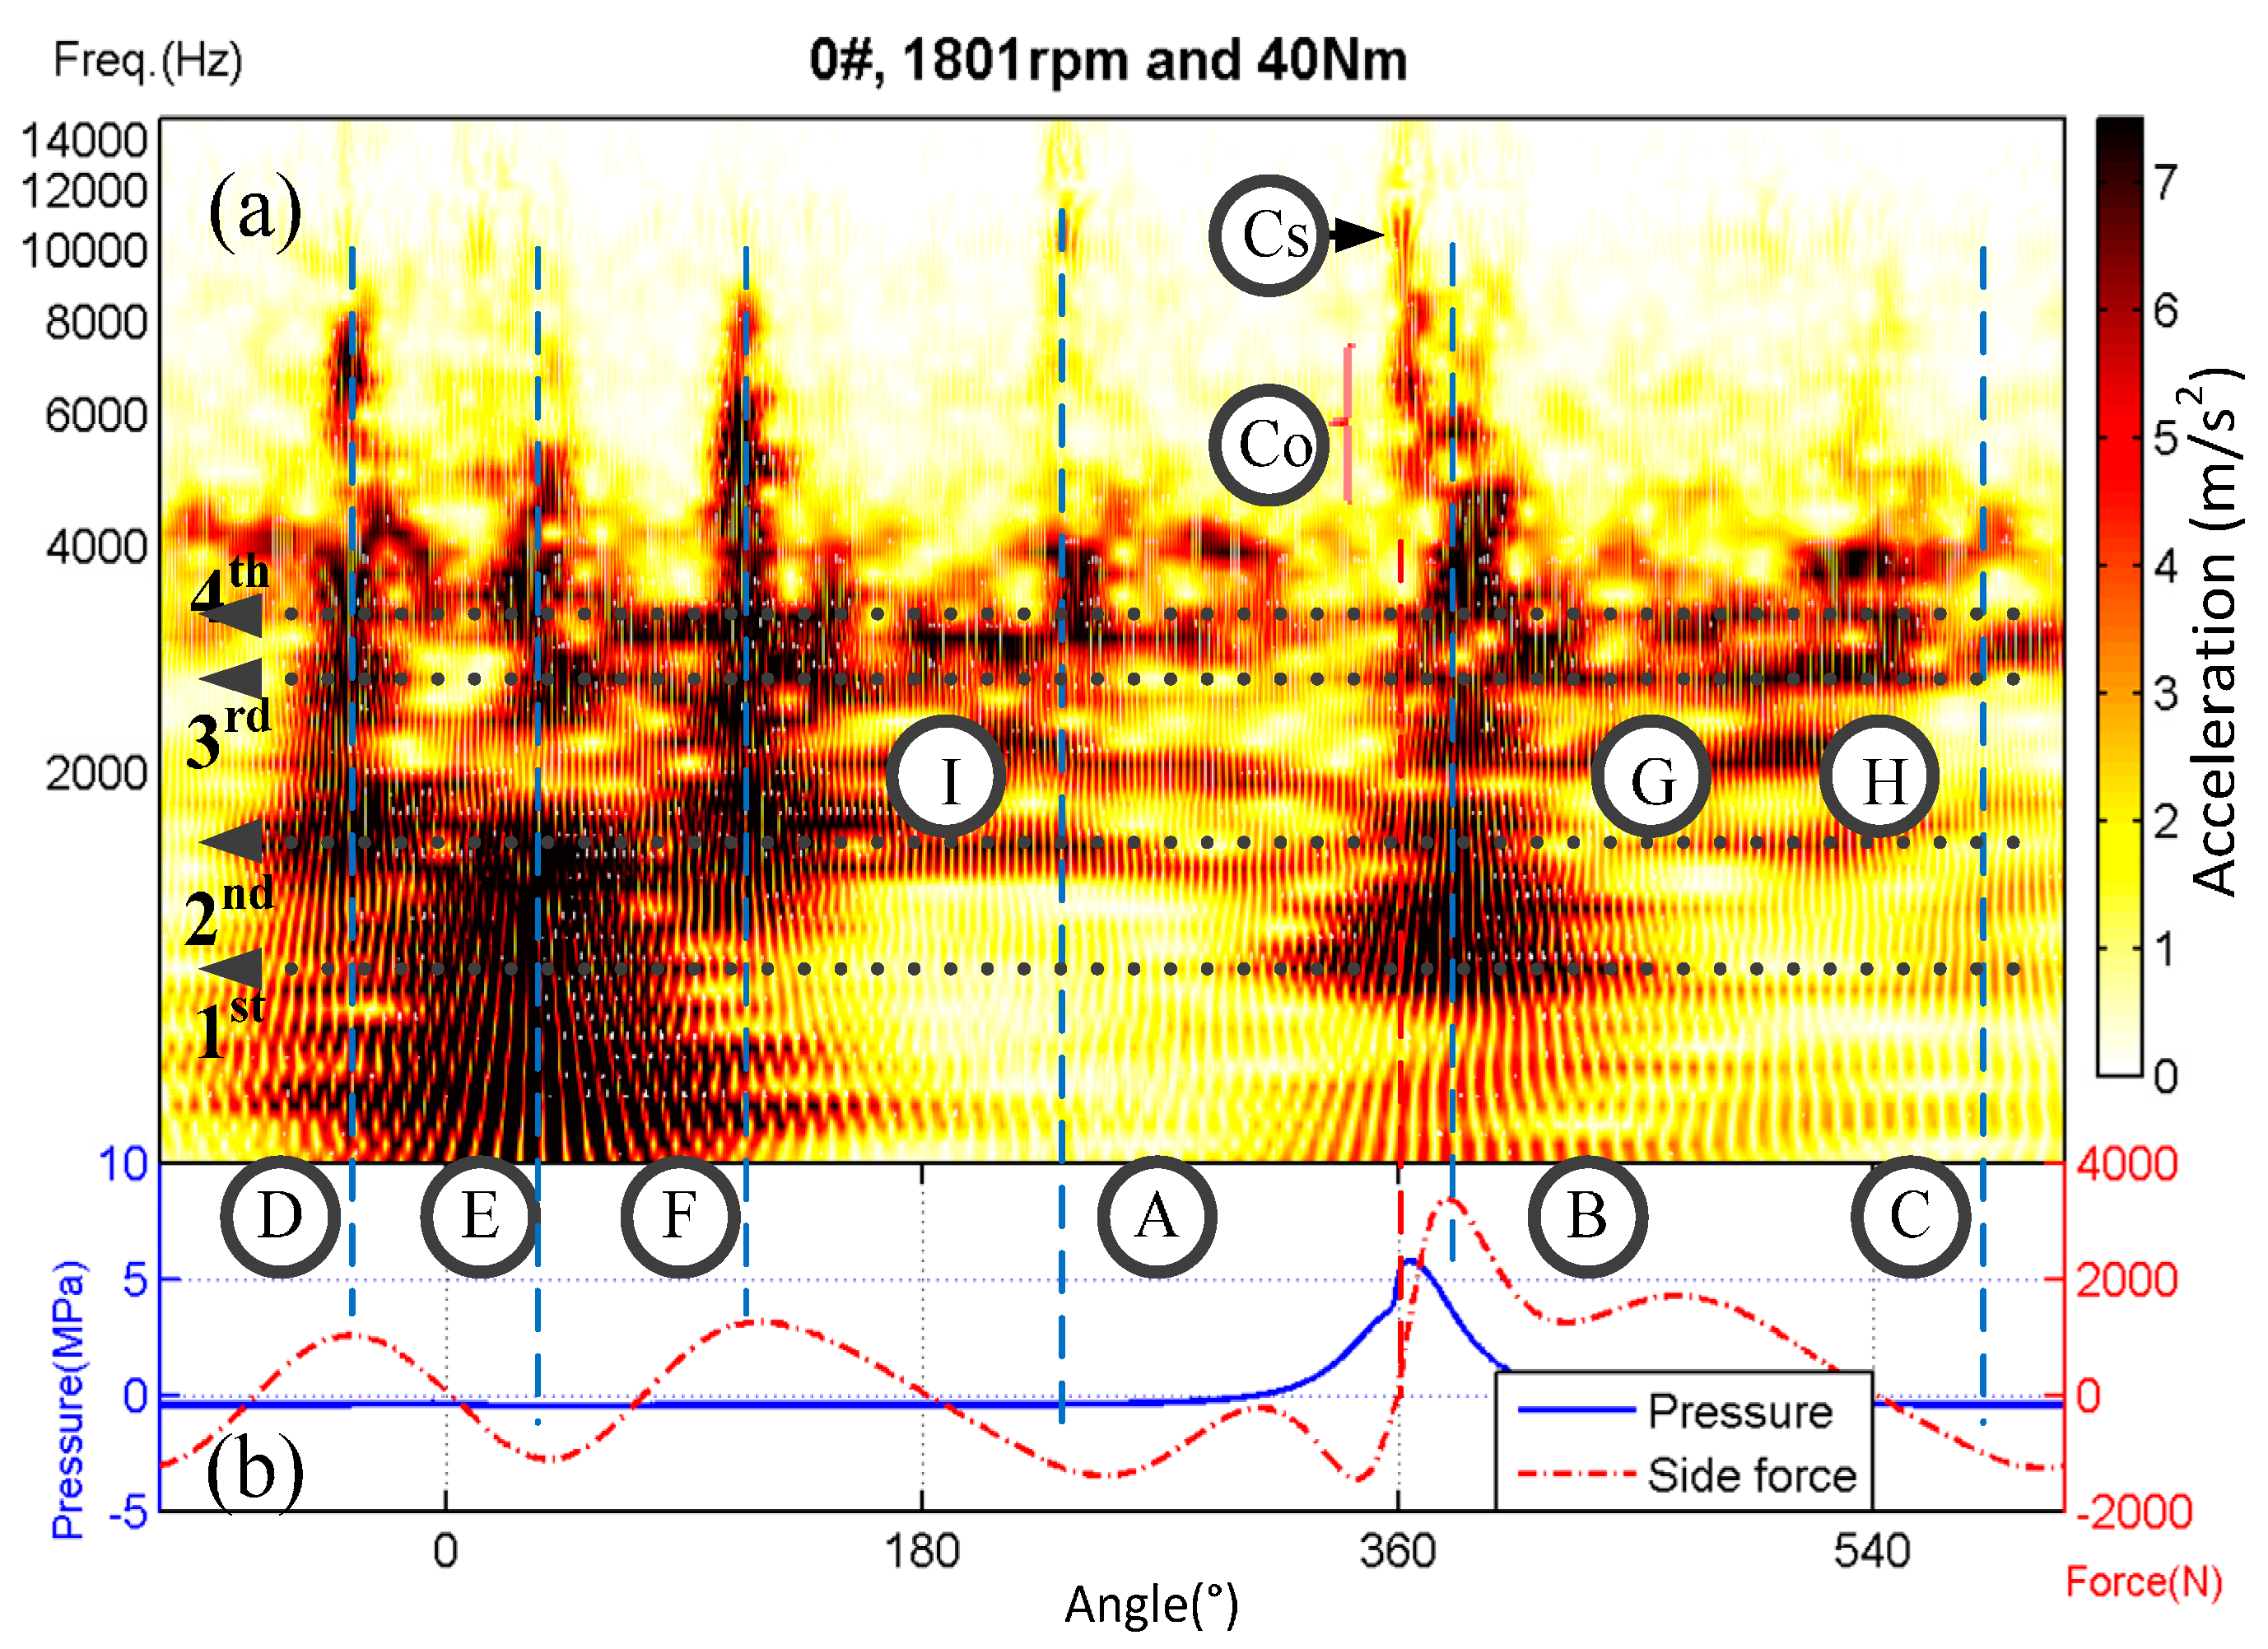
Figure 11 shows the predicted liner responses to a measured combustion force burning standard diesel fuel at a working condition of 1800 rpm speed and 40 Nm torque. The predicted displacement response in
Figure 11b shows a profile close to the curve of combustion pressure; significant responses cluster near combustion top dead center. In addition to the quasi-static response, a series of high-frequency responses appeared at combustion TDC and sustained for a relatively long duration, which are more obvious in the predicted acceleration responses. After combustion TDC,
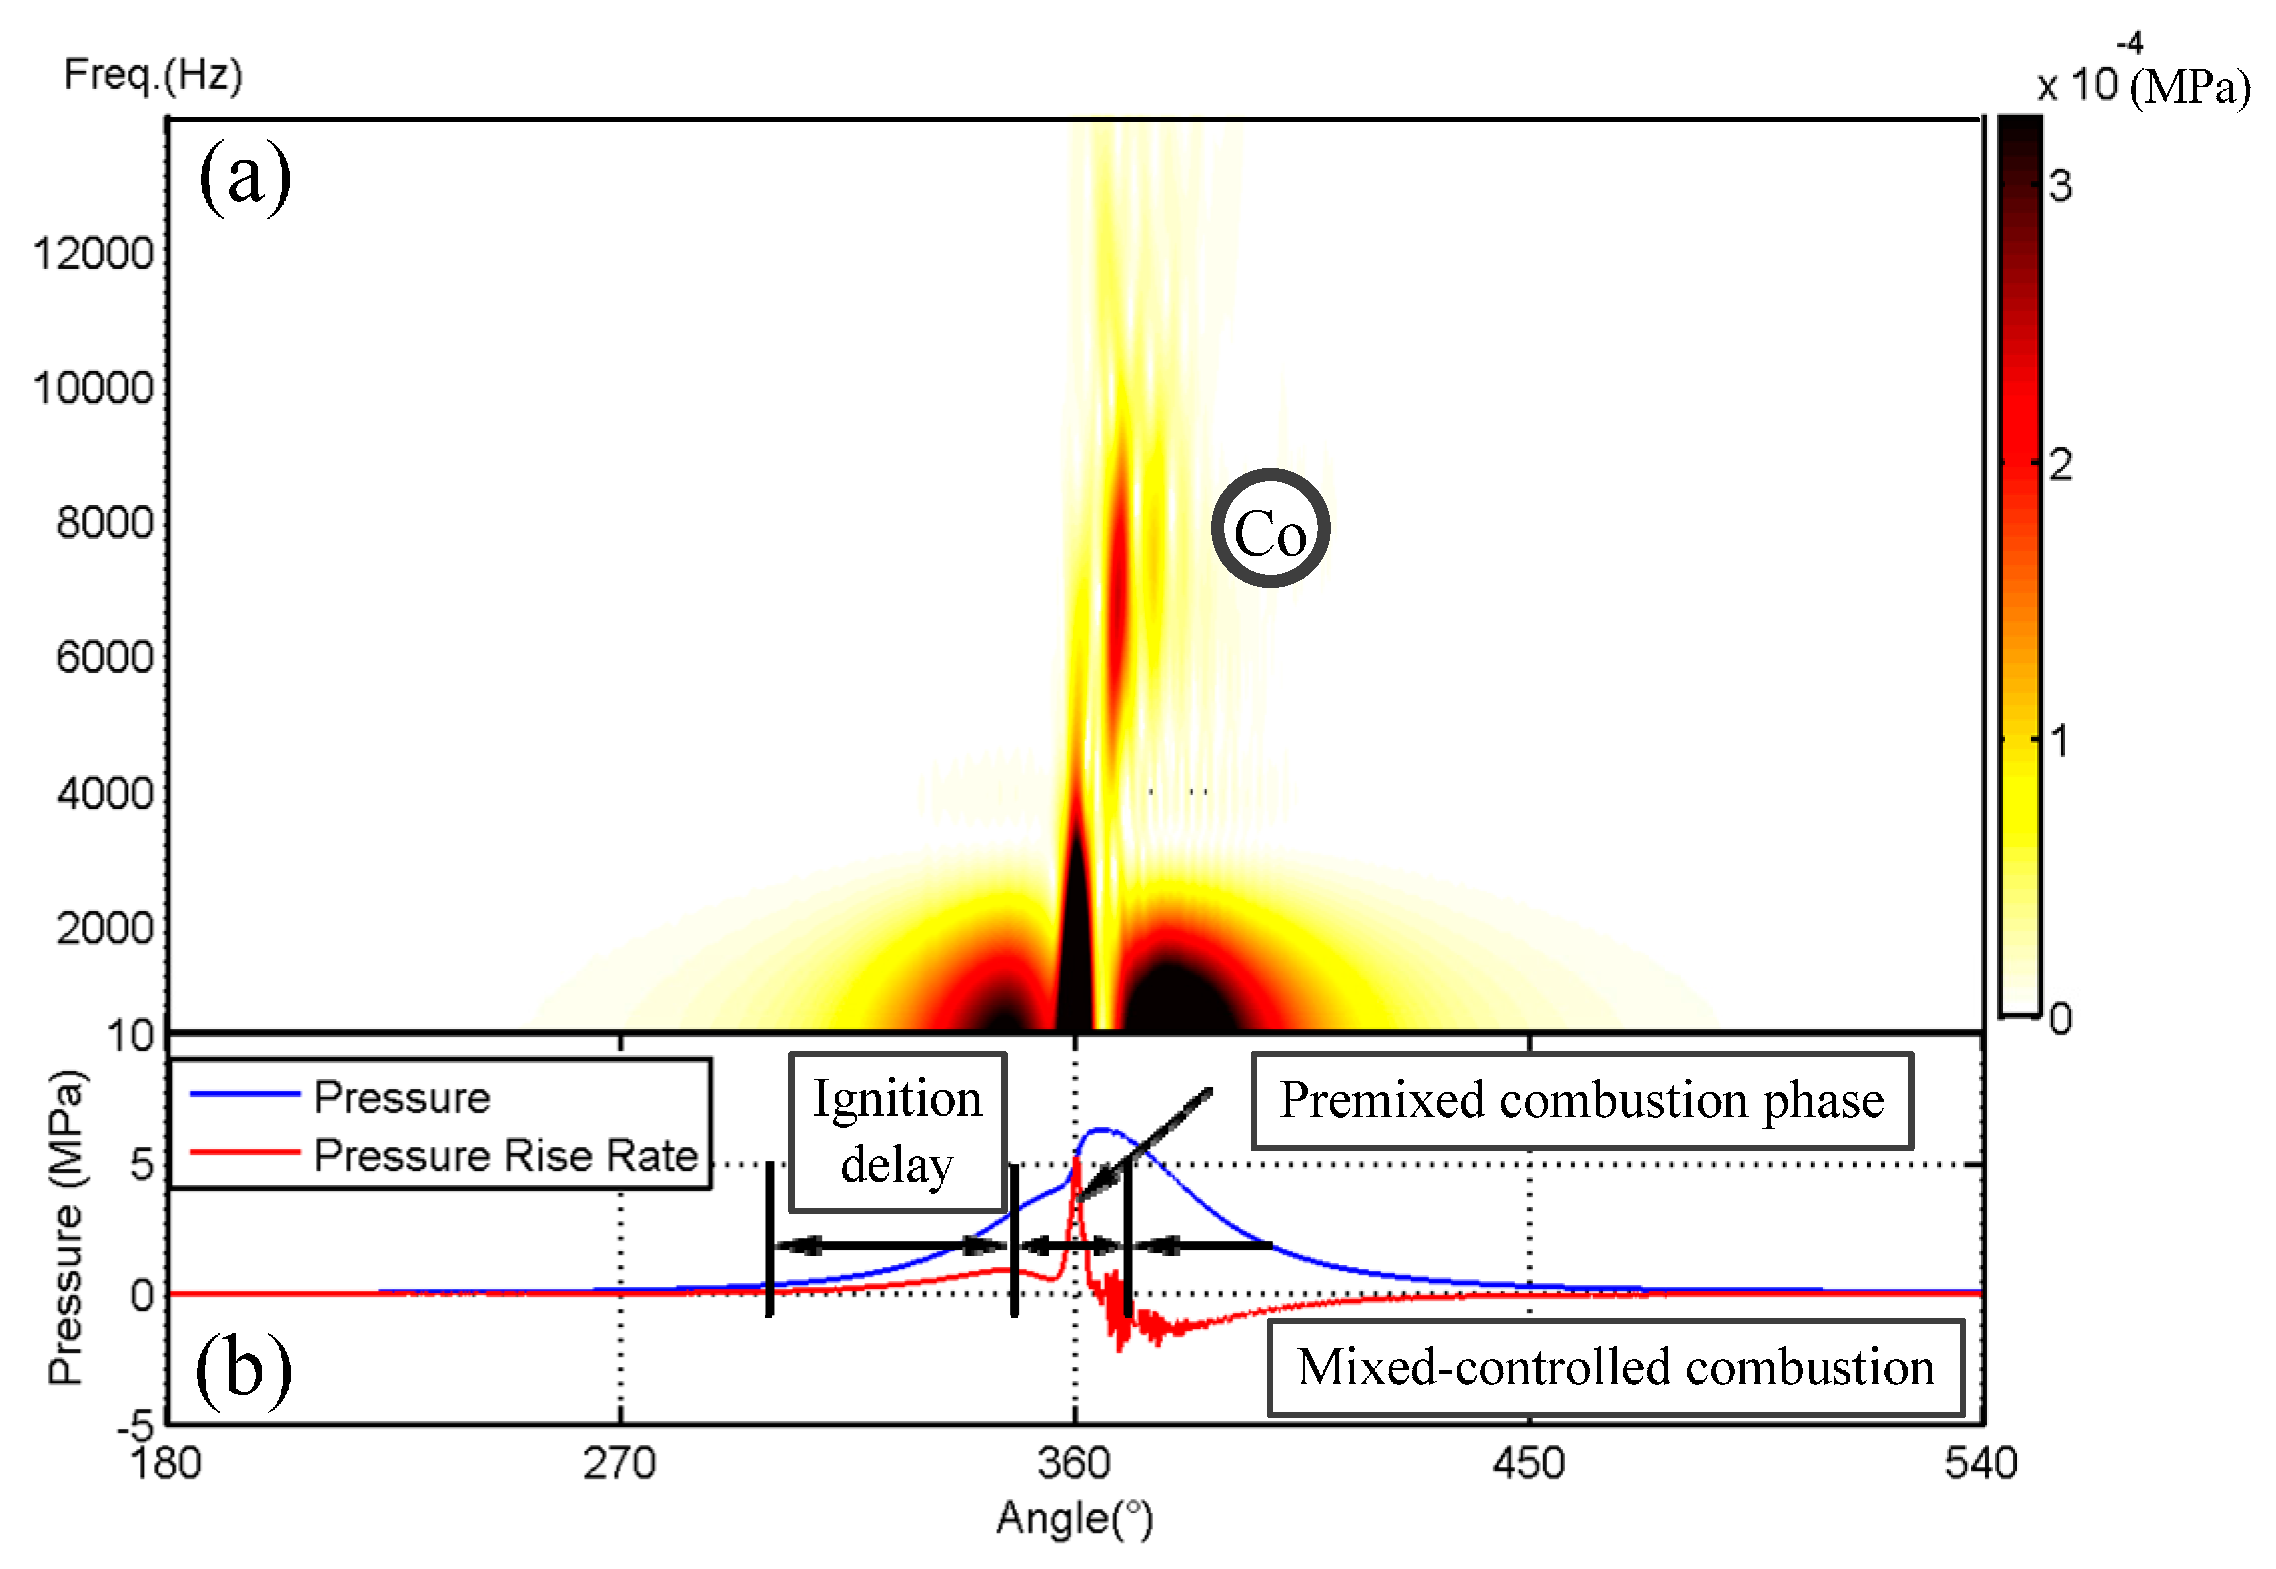
Figure 11a shows a noticeable dynamic response in the frequency range from 5000 to 8000 Hz; it is marked as Impact Co. Given the high similarity between the predicted dynamic response and oscillations in combustion pressure observable in
Figure 3a in the frequency location and the attenuation pattern, it is clear that this event is primarily a forced response caused by high frequency oscillations of in-cylinder pressure.
It can be clearly seen that a series of oscillating components appear at about 365° and in the frequency band of 8000–12,000 Hz, marked as Impact Cs. As there are no such frequency contents in the pressure profile and the oscillation sustains for a long period, which exists even when the input pressure is very low, it is regarded as the modal responses of the liner. Further examination places the frequency band at 8559 to 10,012 Hz, corresponding to the range of the 8th–12th modes identified by modal experiment, as shown in
Table 2.
Simulation results show that the liner structure’s high-frequency modal responses can be activated by the in-cylinder combustion shock, which are attributed to the rapid rise rate of pressure during the premixed combustion period. After high-pass filtering, the amplitude of local deformation was calculated. As operating speed and load increase from 1000 rpm/10 Nm to 1800 rpm/40 Nm, the deformation magnitude of the measuring node rises from 0.004 to 0.015 microns. The combustion shock-induced deformation may be negligible to affect lubrications, because its amplitude is less than 3% of the surface roughness amplitude.
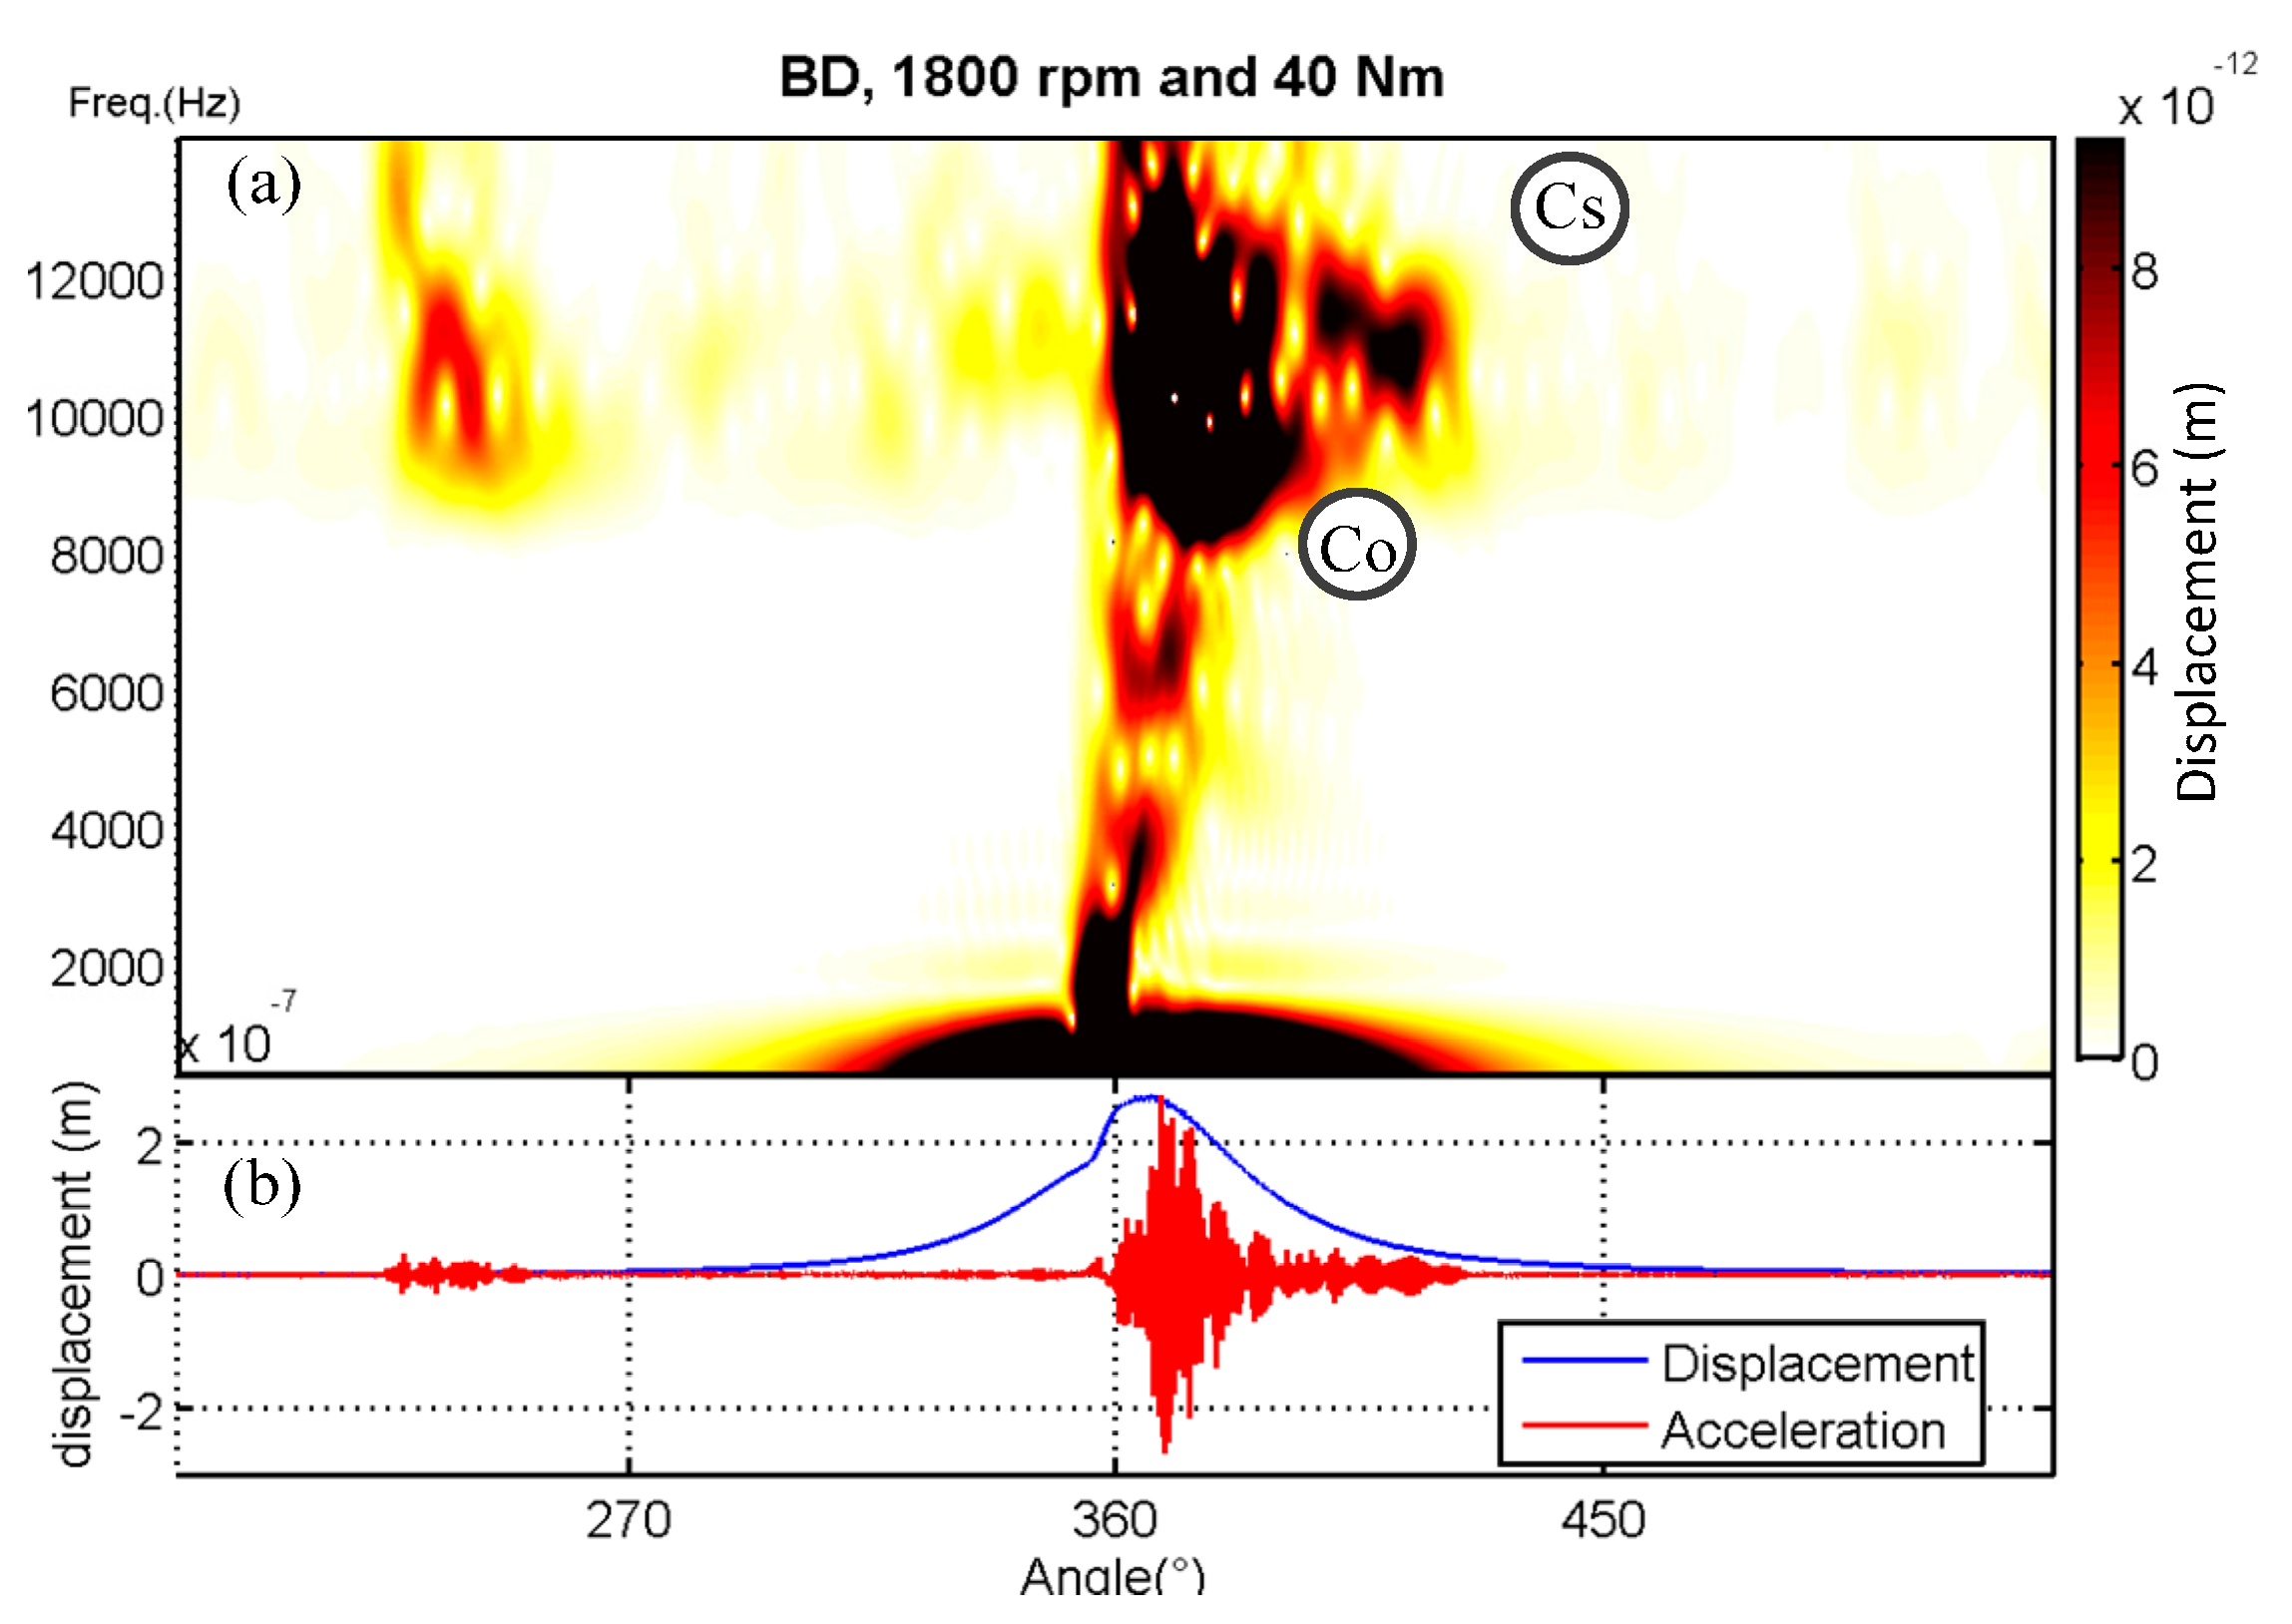
Predicted dynamic responses to combustion force measured from the test engine burning biodiesel under the same operating condition of 1800 rpm speed and 40 Nm torque are shown in
Figure 12. Basically, the response patterns of biodiesel are similar to those of diesel.
As
Figure 12 shows, the modal responses of biodiesel sustain longer than those of diesel, which can be attributed to the longer duration of mixed-controlled combustion period. Because of the lower calorific value of biodiesel, a much larger amount of fuel delivery needed to be injected into the combustion chamber in order to output the same mechanical power, thereby resulting in a longer combustion duration.
3.3. Dynamic Responses to Piston Slaps
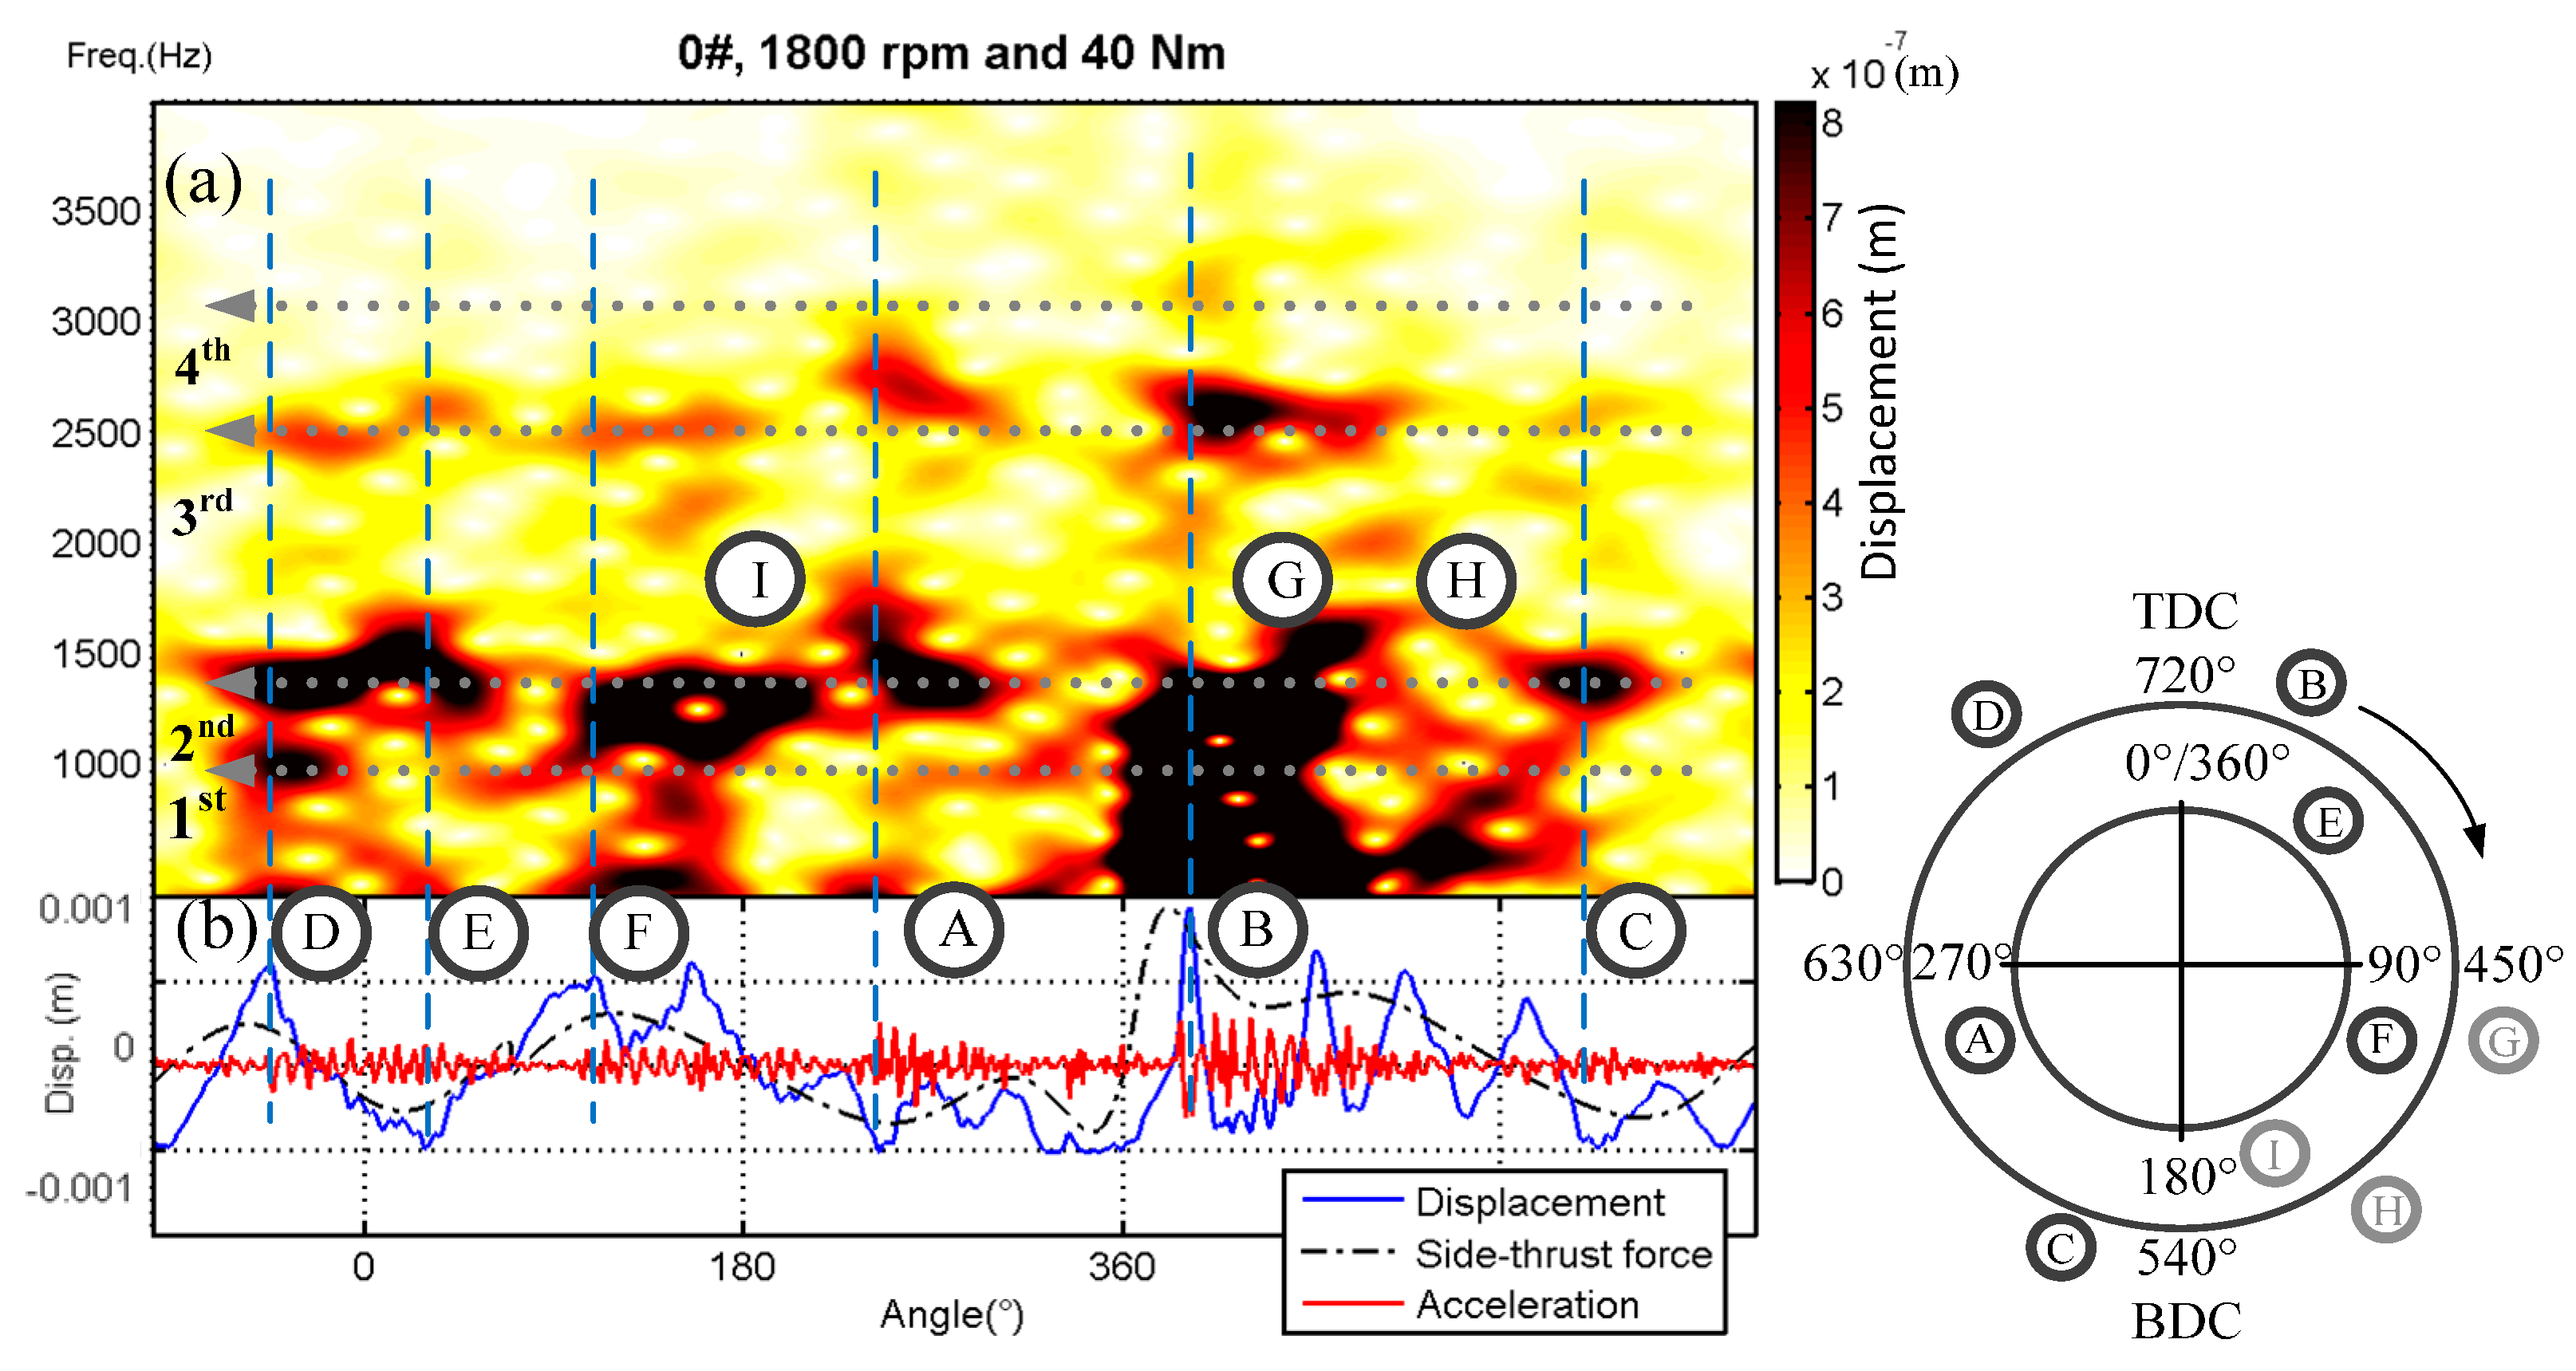
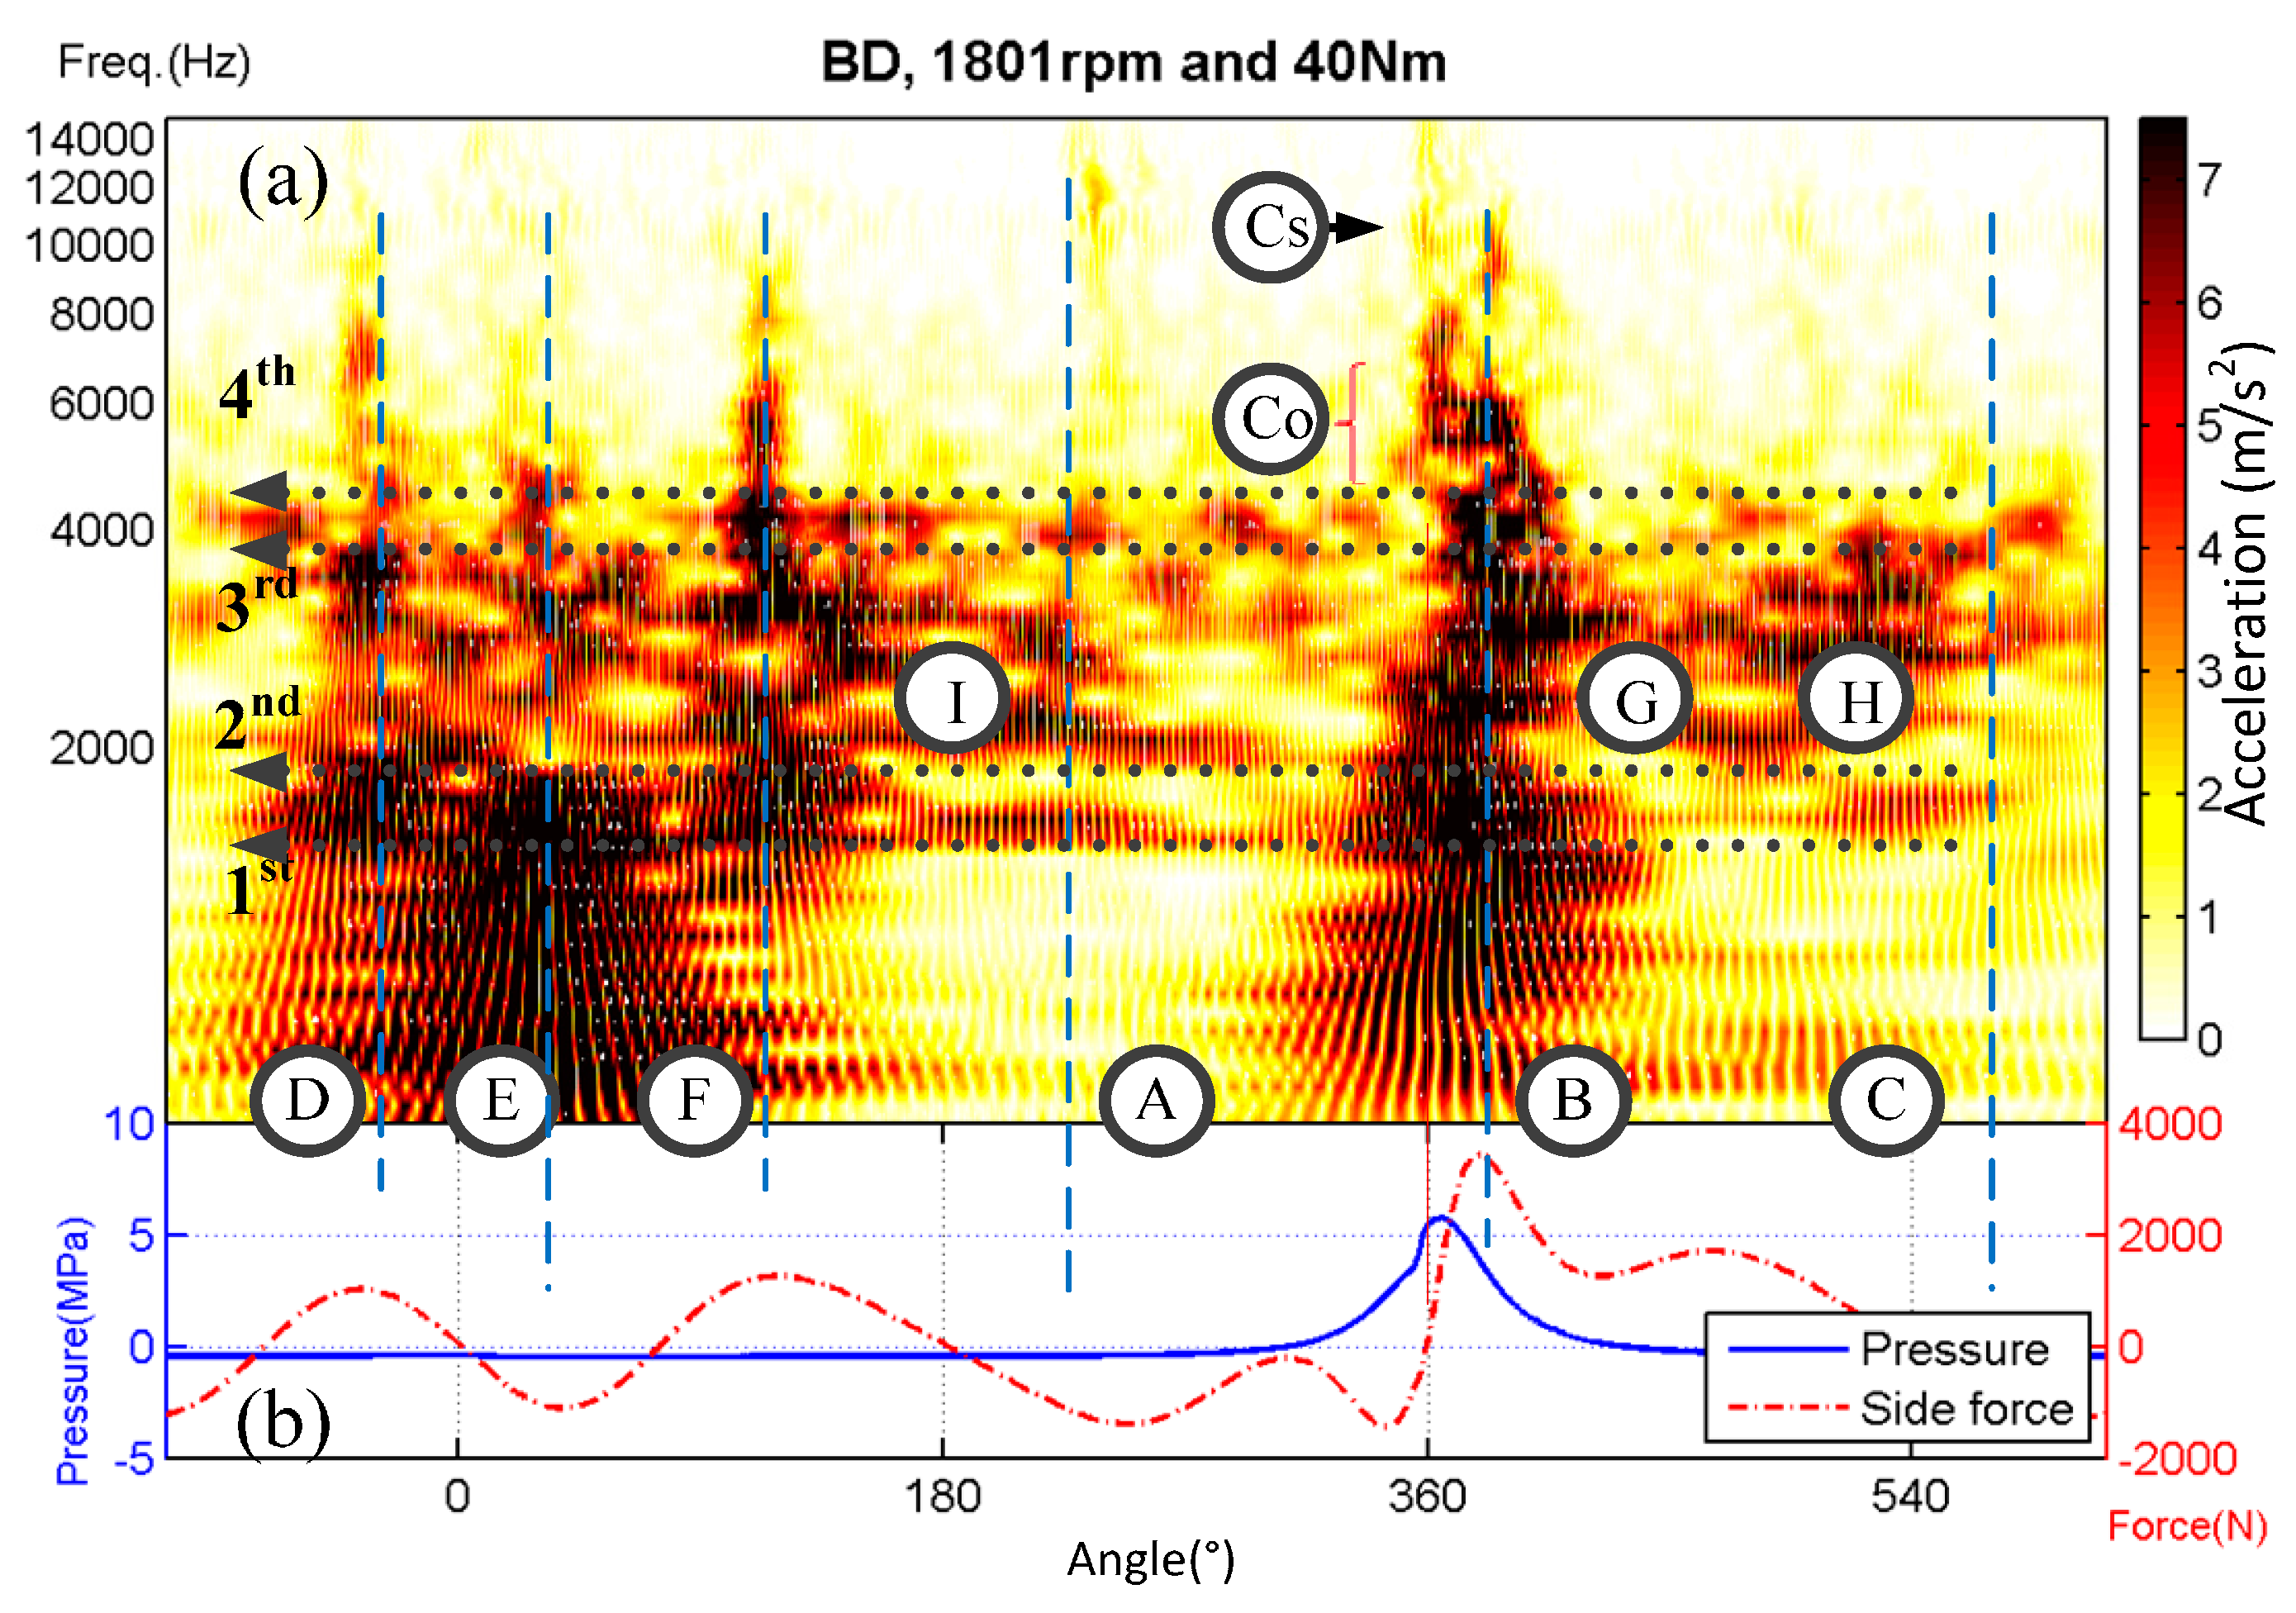
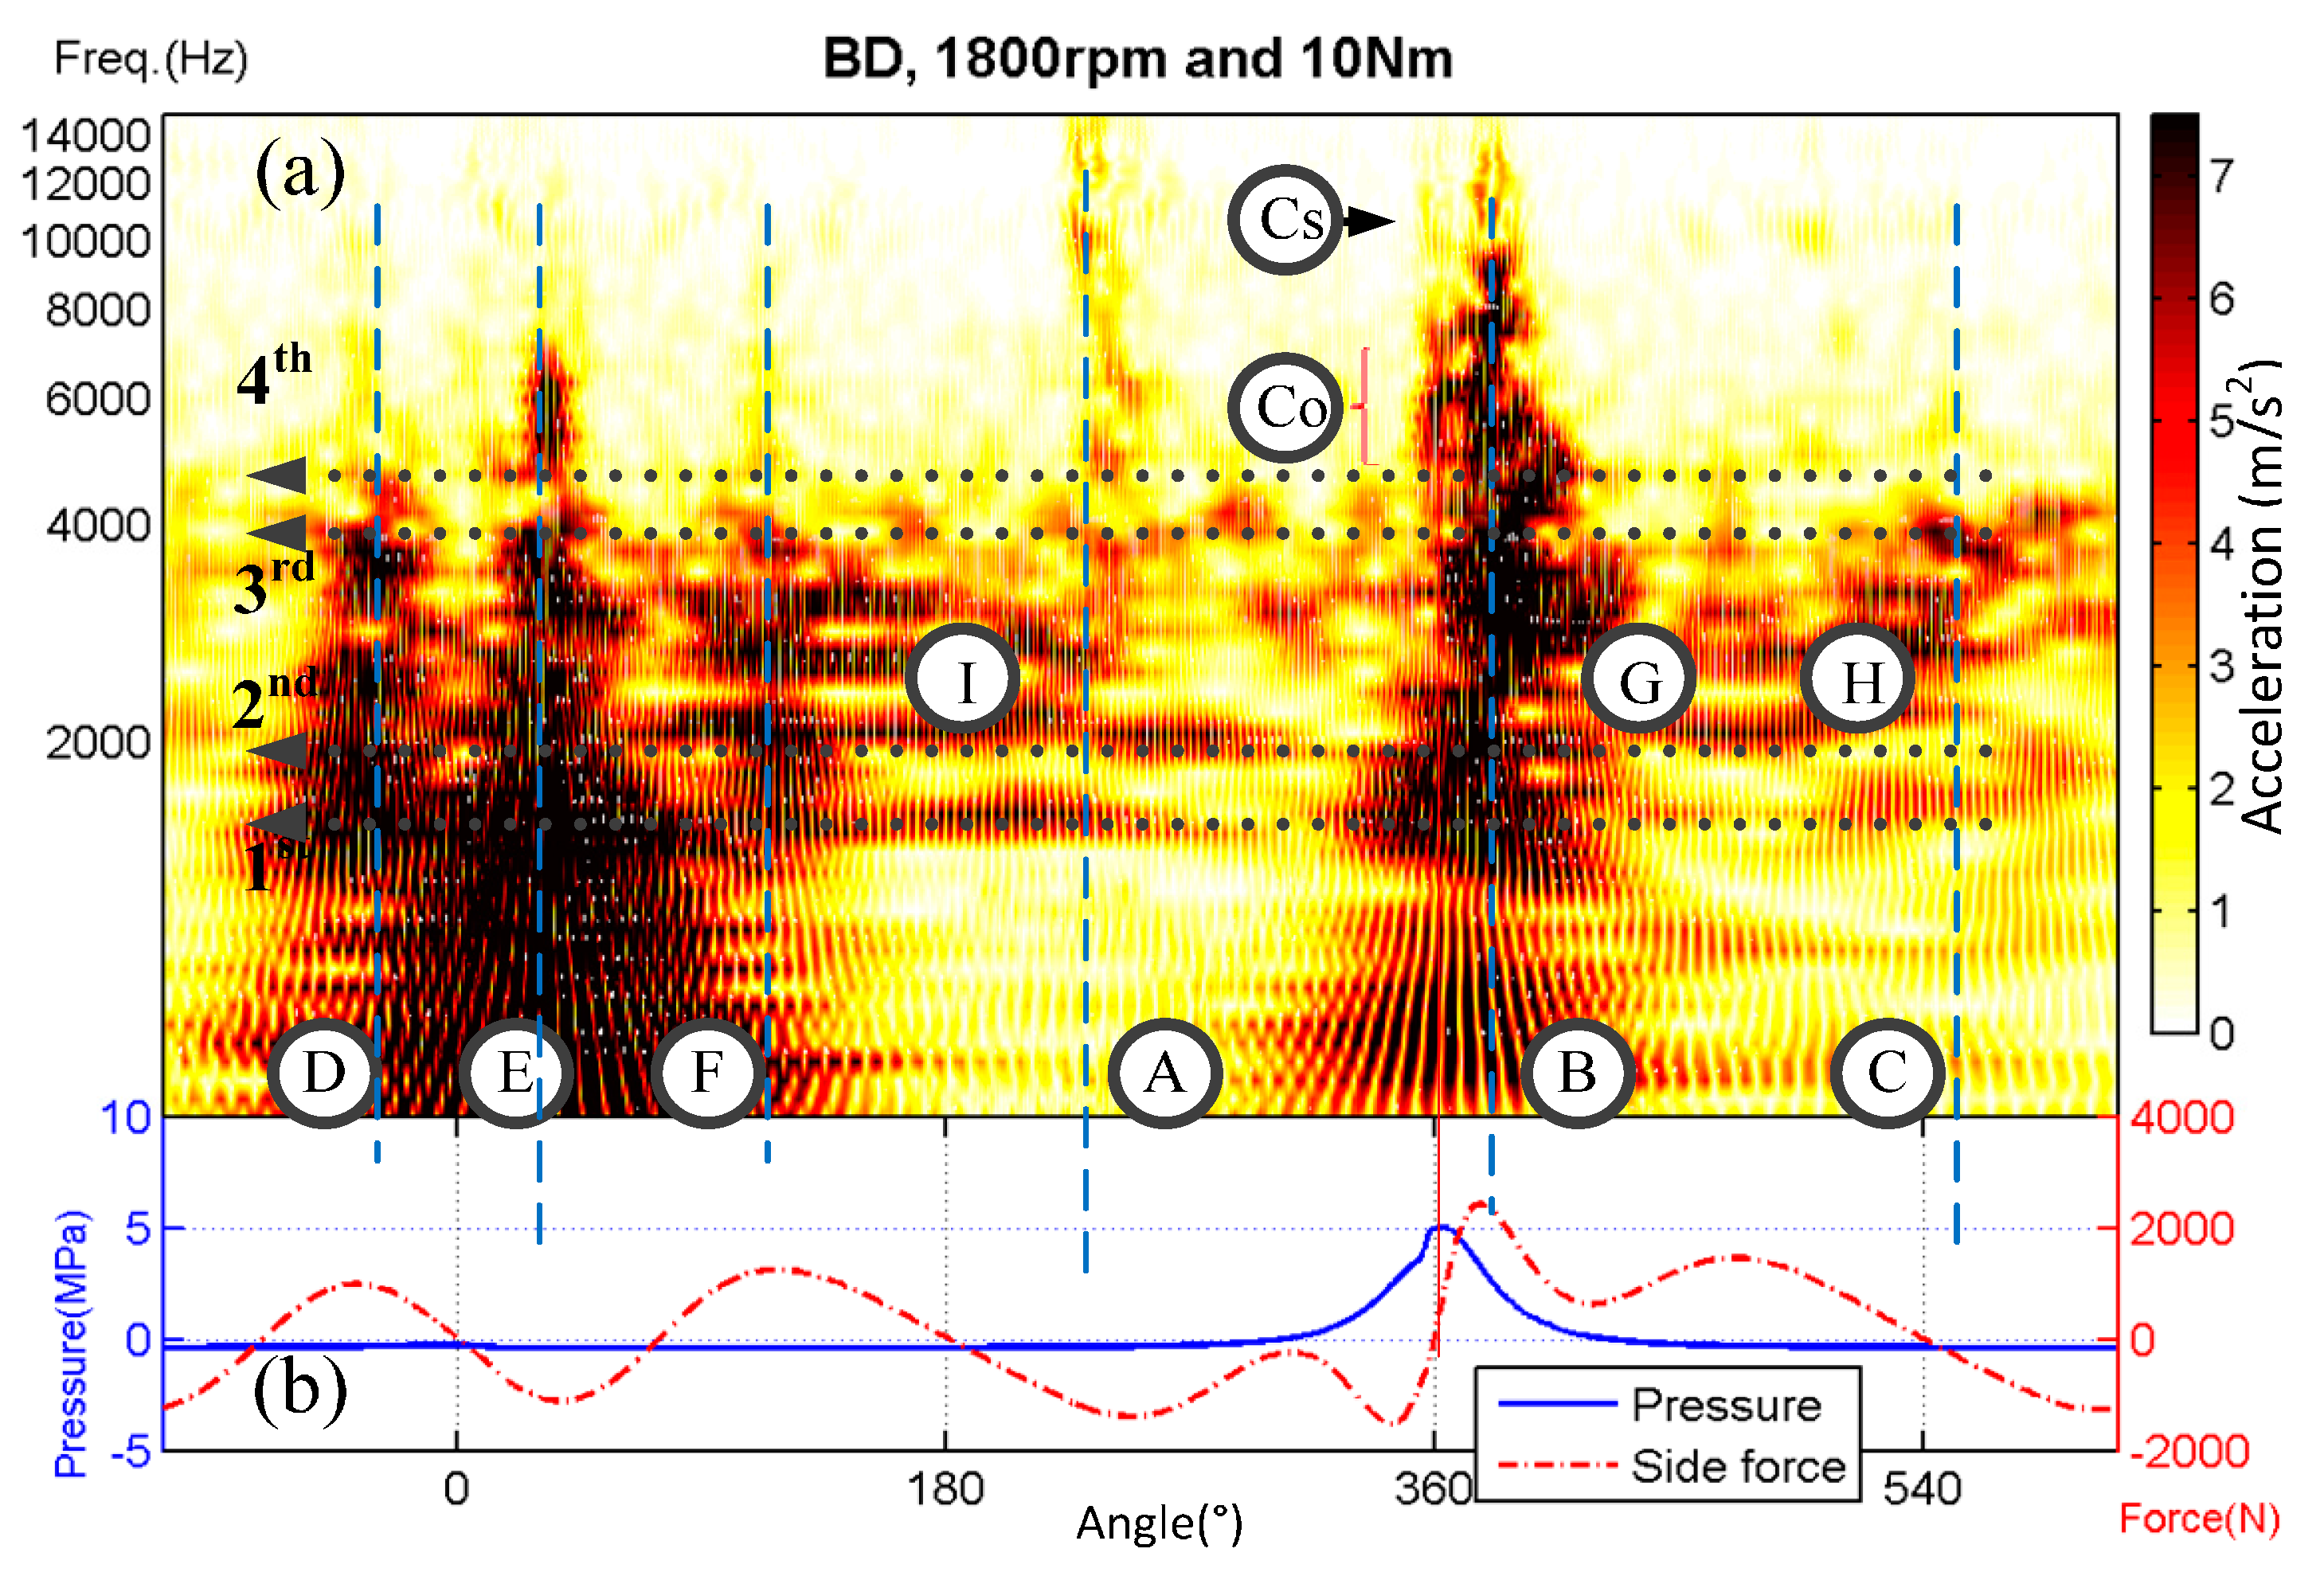
In the case of the piston side slaps being considered alone, the dynamic response of the liner measured from the same sampling point shows more complex and abundant patterns, as seen in
Figure 13a, under the operating condition of 1800 rpm and 40 Nm. In
Figure 13a, it is possible to identify six separate and transient responses to highs and troughs of piston side-thrust force, and these are marked Impact A to Impact F. For the most part, these responses are in the frequency band relating to the first three modes, and that is particularly so for responses to slaps away from combustion.
Three other dynamic events are also observable in
Figure 13a, and these are marked as Impact G, H and I. These events arise from secondary impacts caused by sustained high-amplitude side-thrust force, rather than by any particular force peak or trough, indicating that a sustained high-amplitude side-thrust force might cause additional impacts.
The frequency range between 500 and 3000 Hz has been chosen by earlier studies [
9,
10,
21,
22,
23] to identify and analyze the piston slap-induced events. As
Figure 13 shows, there is probably some truth to this, which may stem from mode characteristics inherent in liner structures. As this study shows, piston slap-induced dynamic responses occur for the most part in the 600–3500 Hz range, near the first four modes’ frequency band, suggesting that the way cylinder liners respond dynamically may depend on their structural modes to a high degree.
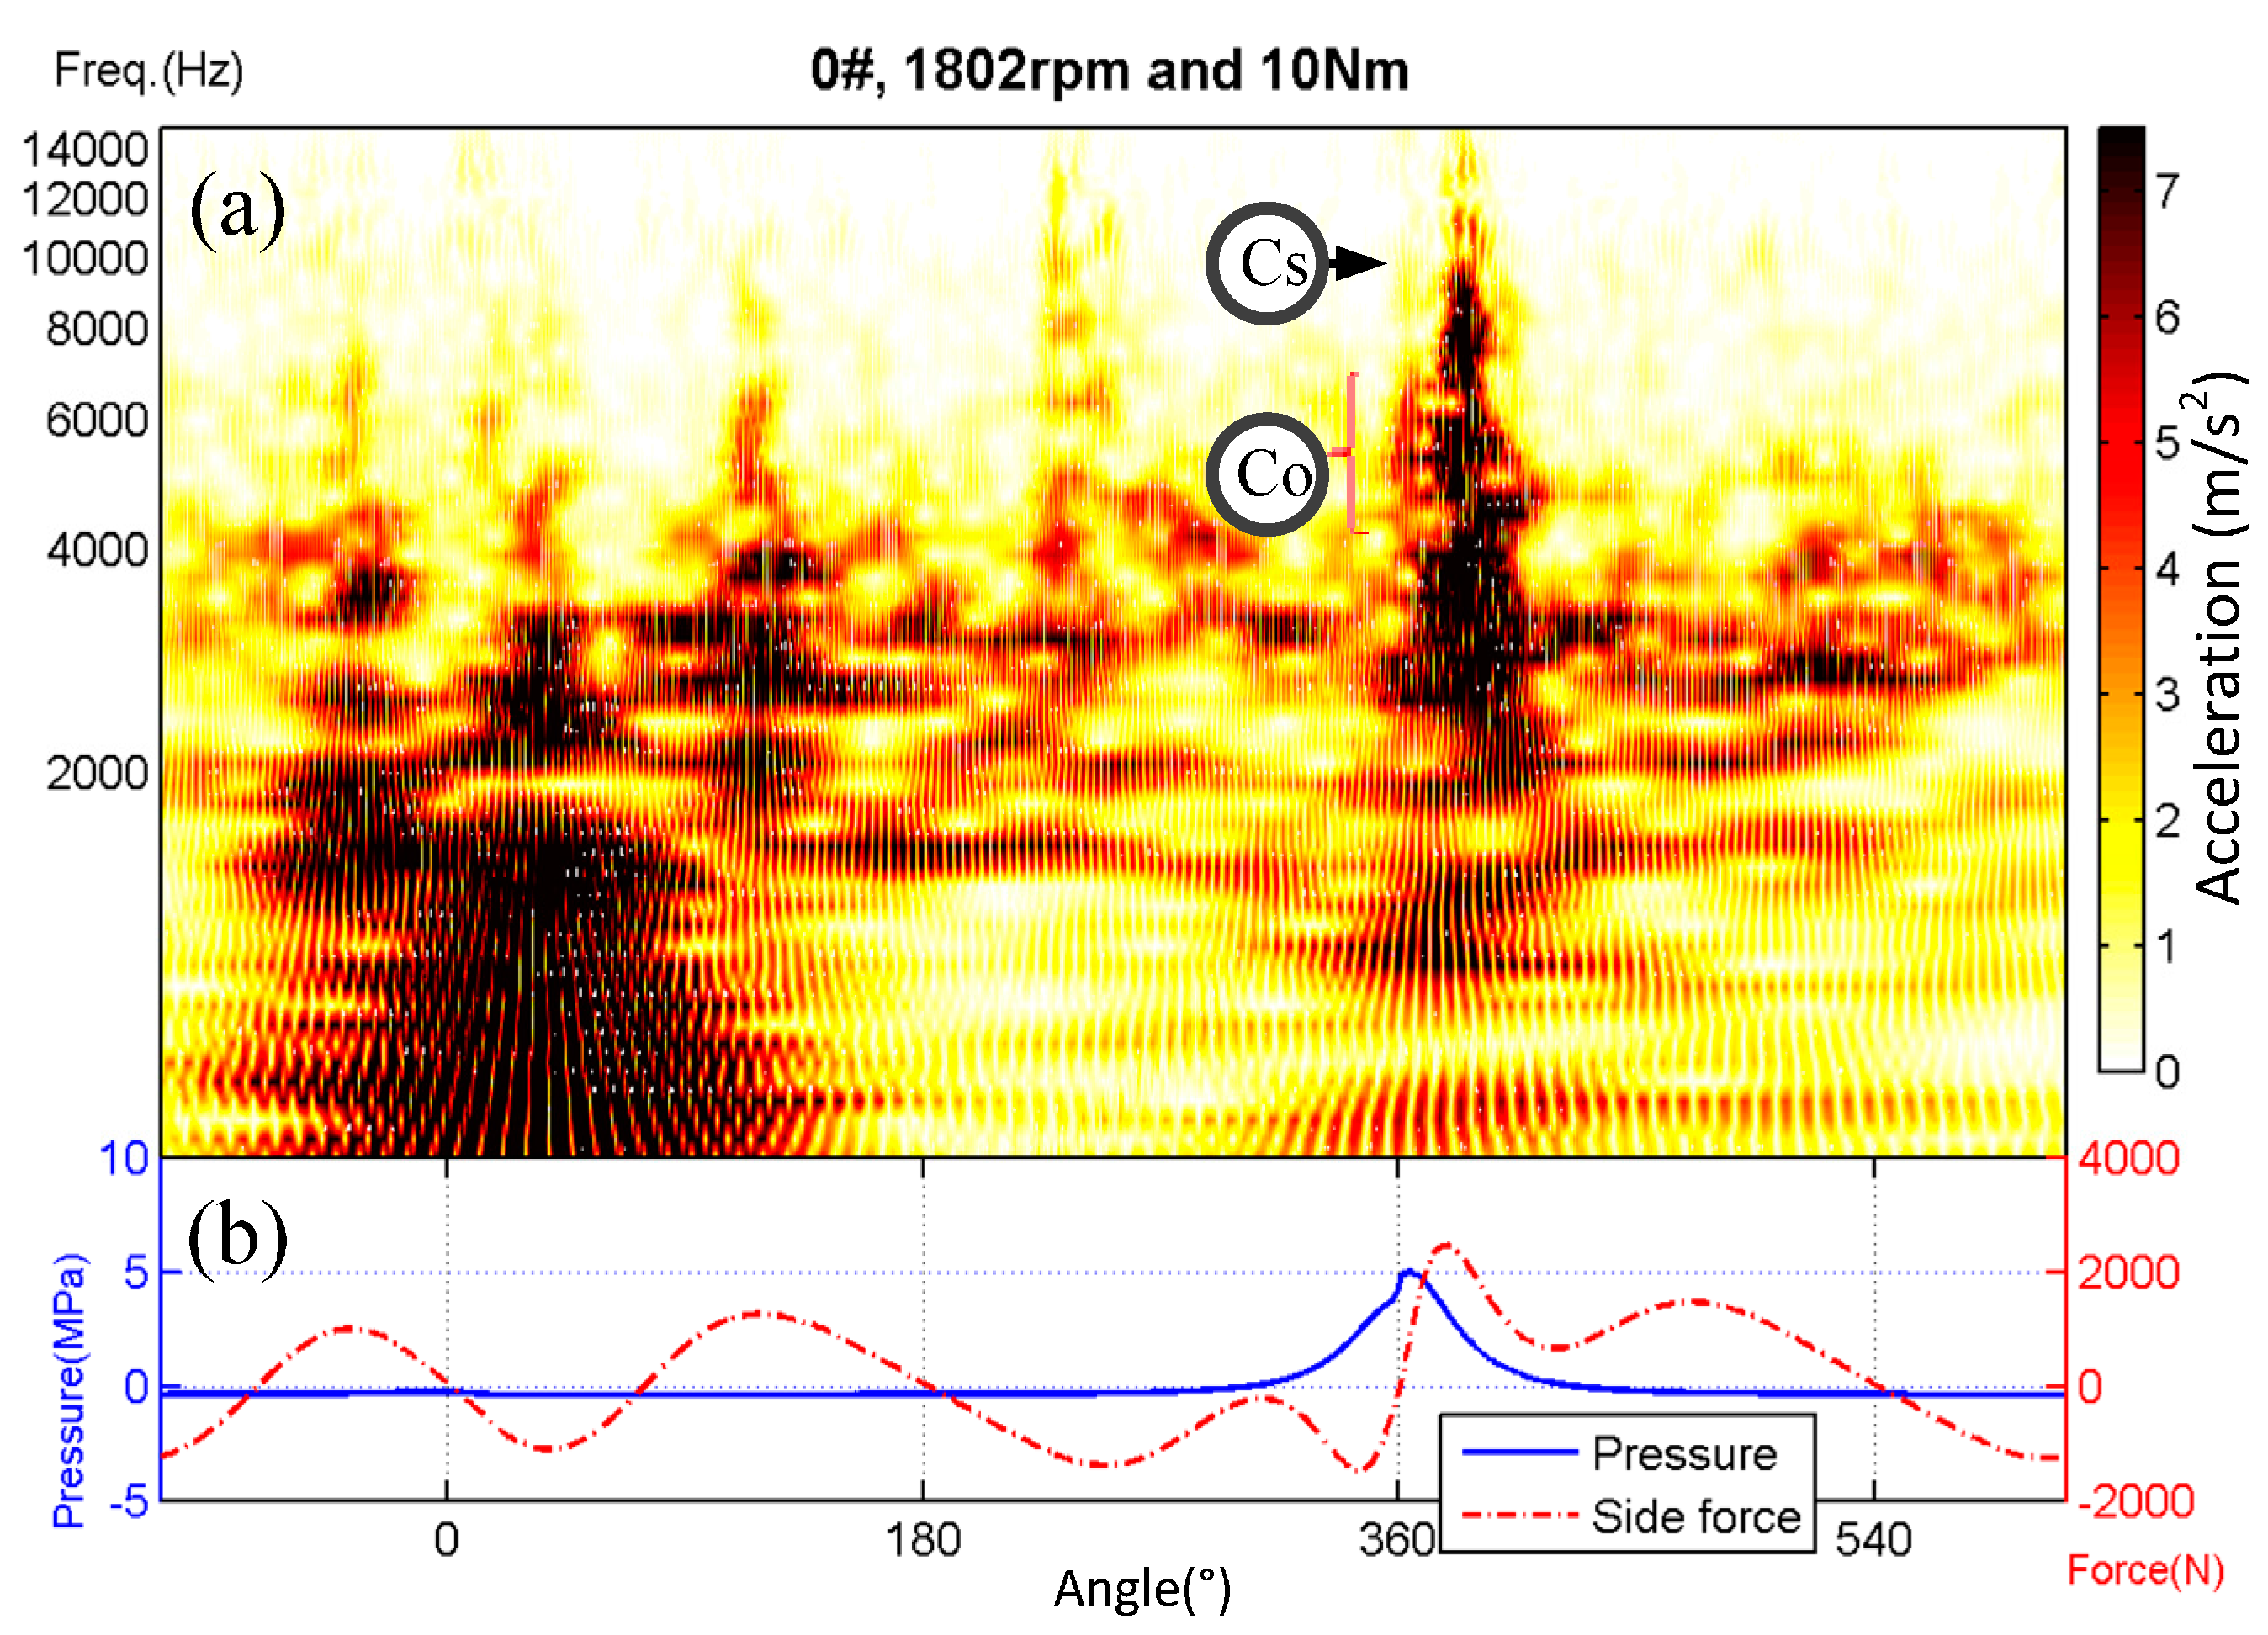
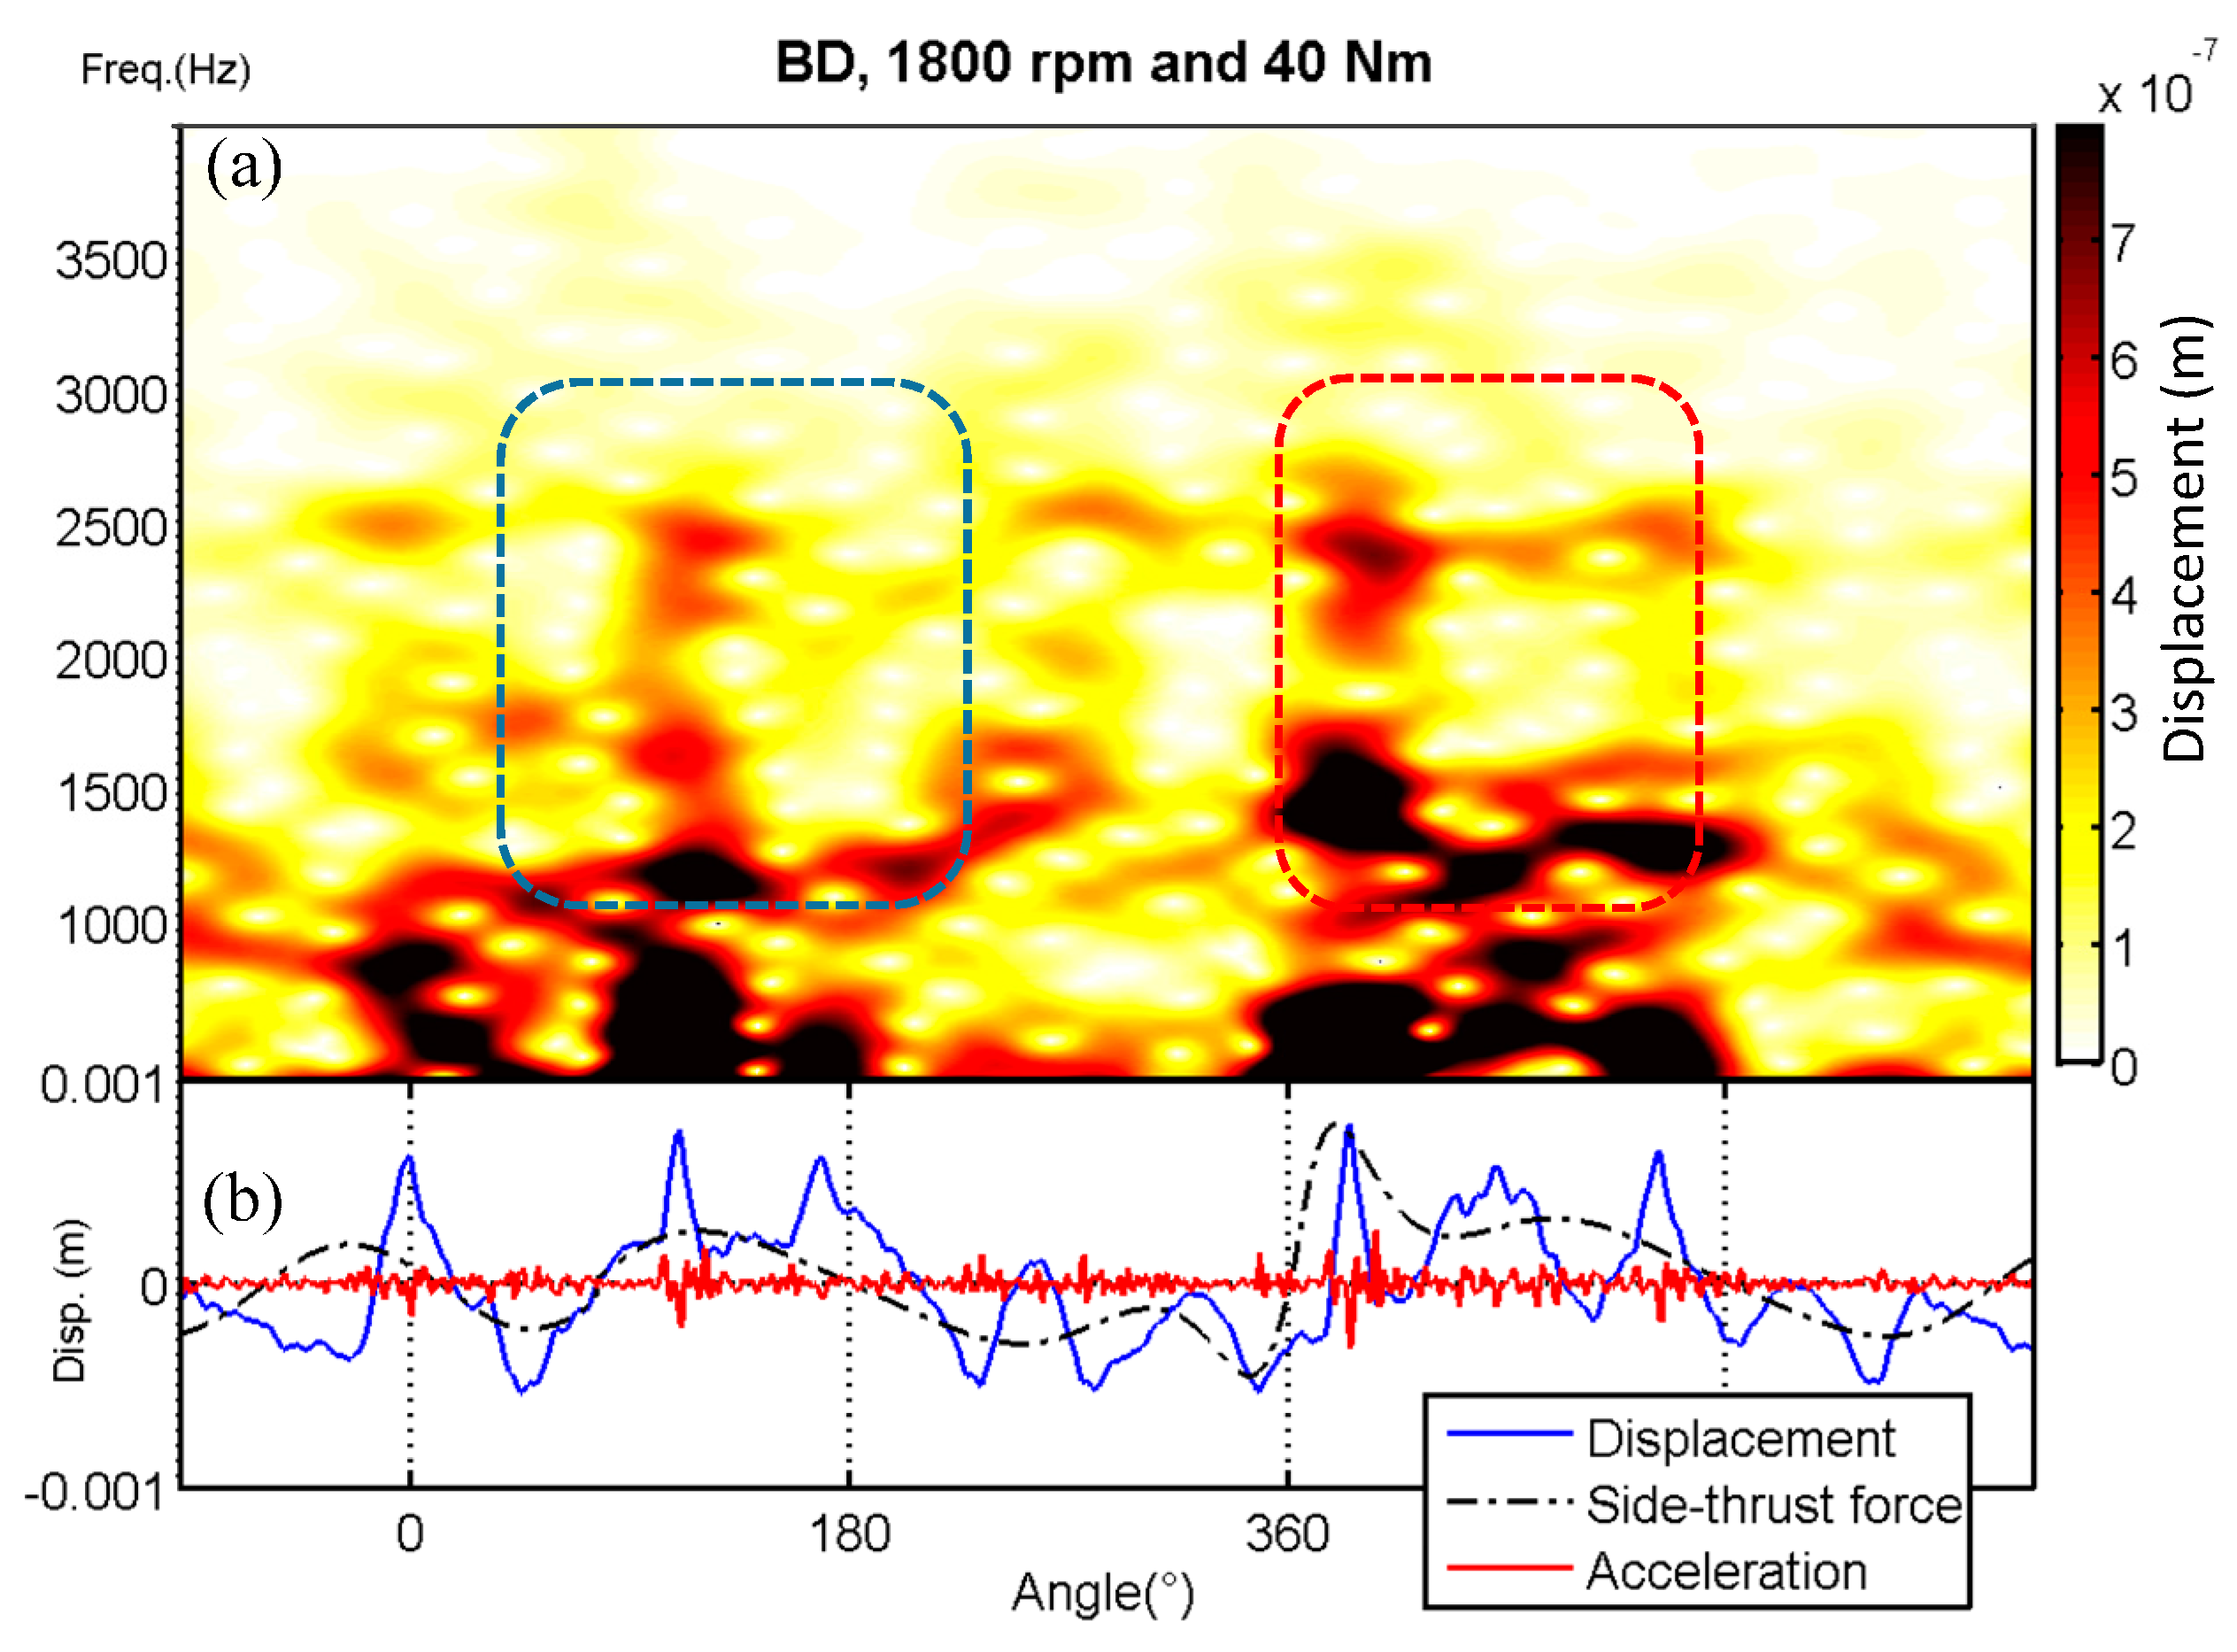
In the case of the piston lateral slap being considered alone, the dynamic responses of the liner burning biodiesel show a similar pattern in STFT results to that of diesel, under the same operating condition of 1800 rpm and 40 Nm. As can be seen in
Figure 14a, the overall energy distribution of slap-induced responses fueled with biodiesel is significantly reduced compared to that of diesel in
Figure 13a. This shows that the piston movement driven by the smoother combustion excites fewer mode components in low frequency ranges.
It should be noted that distinguishable differences in the local response features between the two fuels can be clearly observed around the combustion TDC and exhaust TDC, marked with red and blue rectangles in
Figure 14. The STFT result of biodiesel shows much more localized dynamic responses about the exhaust TDC compared with those of diesel. Conversely, the diesel presents more intense dynamic responses around the combustion TDC than the biodiesel. These complex and even reverse trends of local features can hardly be interpreted using the differences in the physical and chemical properties of fuel types. Therefore, it is necessary to perform some contrastive and diagnostic analyses on these features under different operating conditions to understand the generating mechanisms behind them in depth.
3.4. Diagnostic Analysis
To achieve the diagnostic quantitative analysis for different operating conditions, the RMS results of four local responses, respectively marked as Impact Co and Impact Cs, the blue rectangle and red rectangle in
Figure 14, have been calculated and drawn as shown in
Figure 15 and
Figure 16.
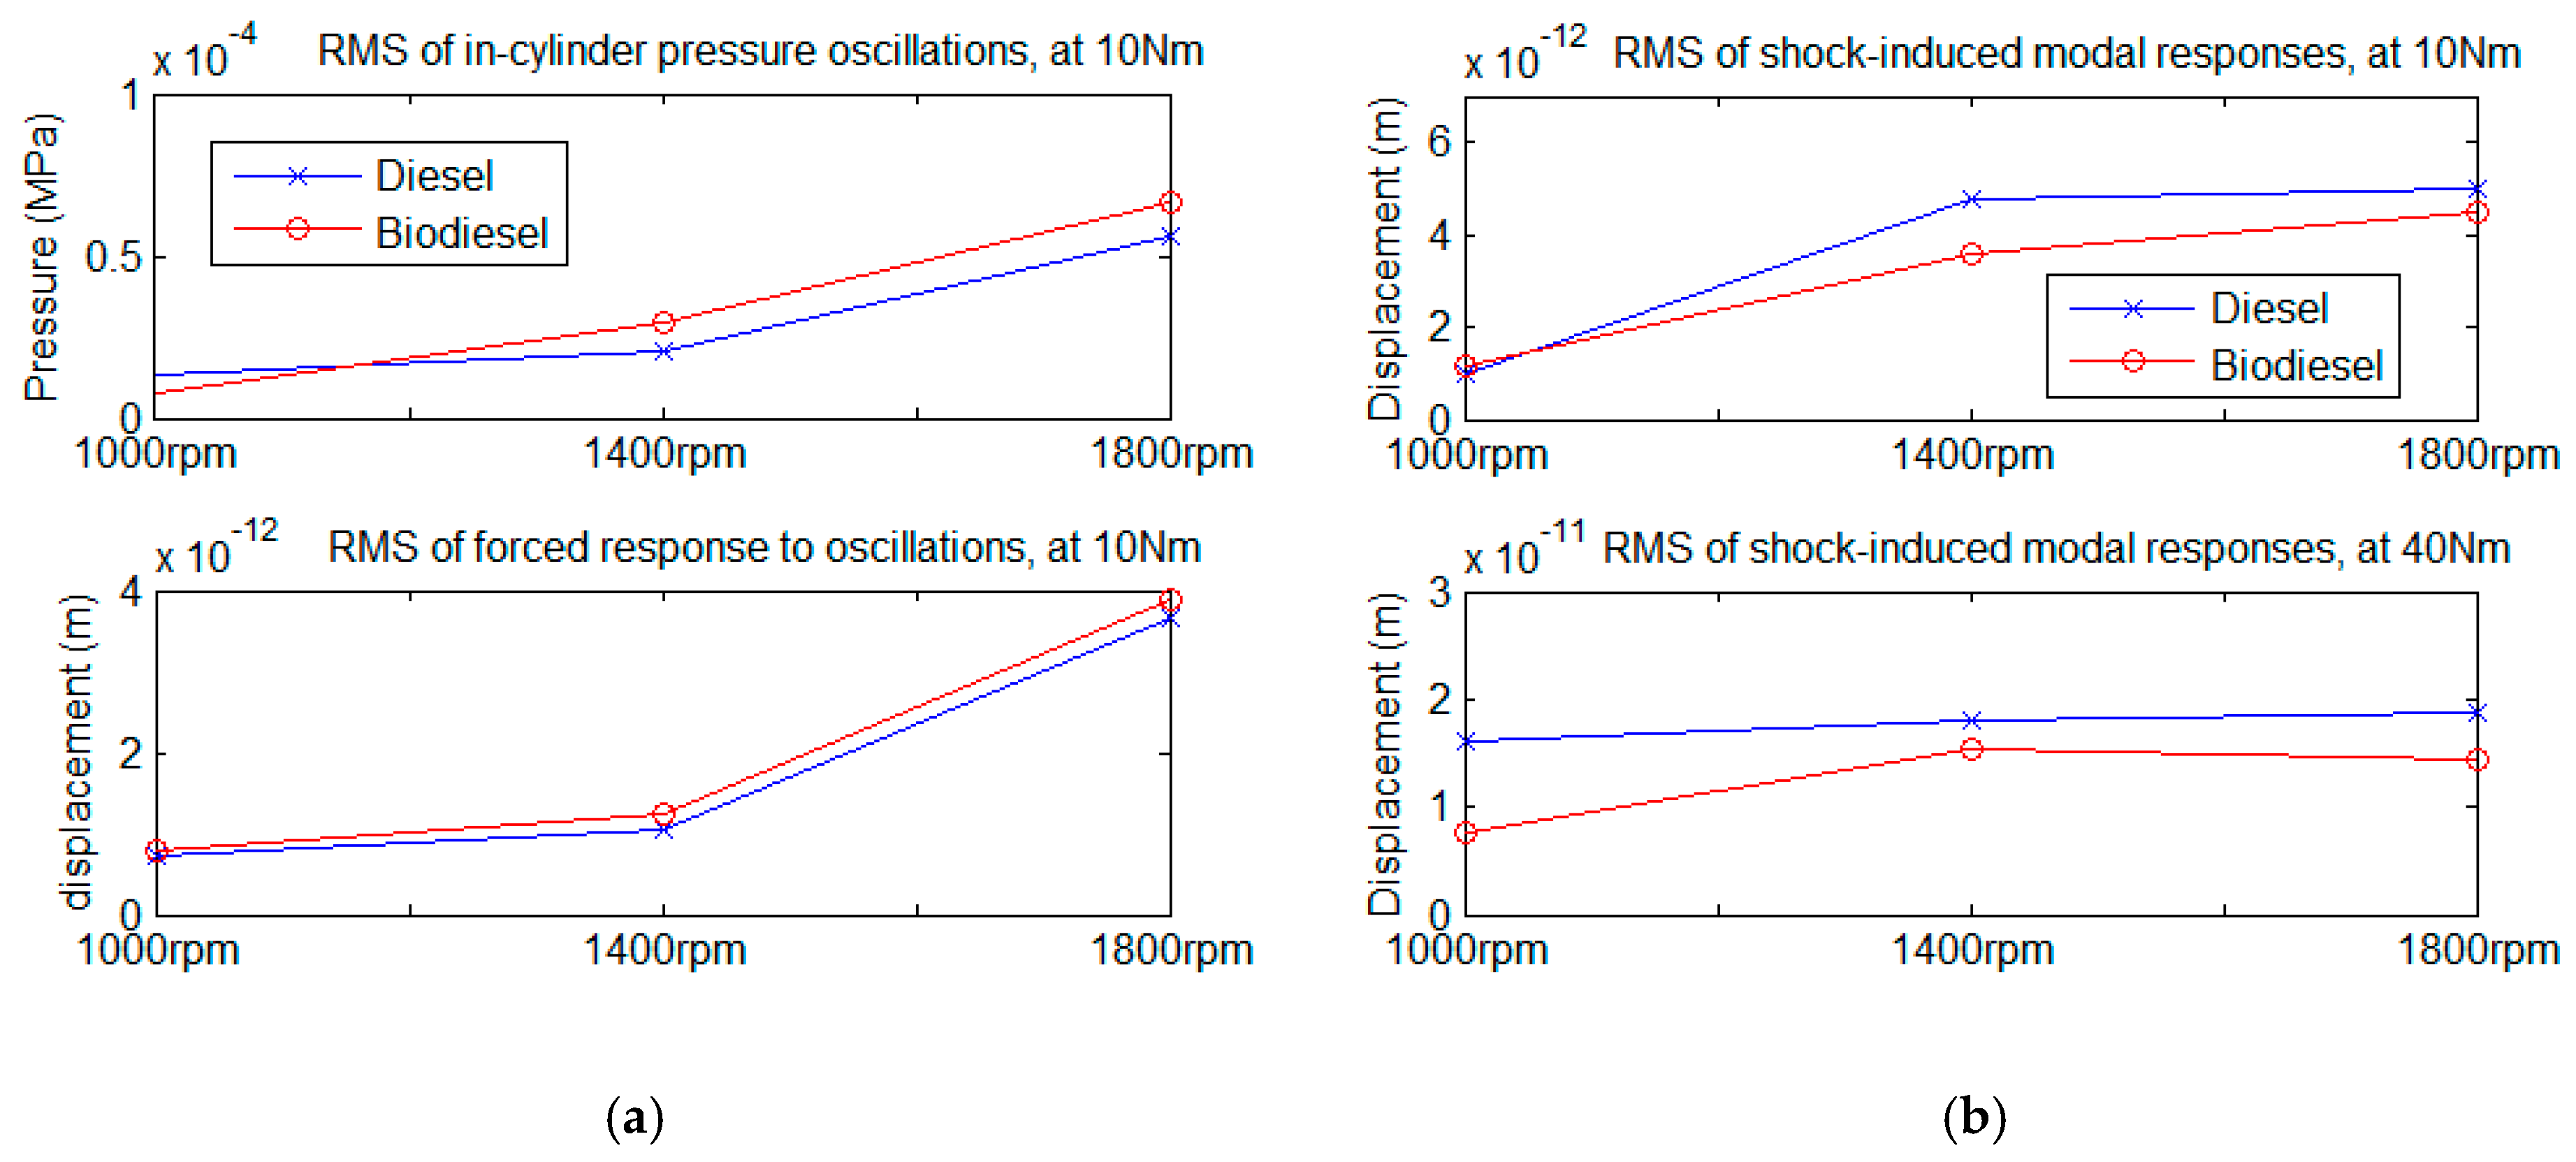
Figure 15a presents the RMS results of local features with regard to the oscillations in combustion pressure and the simulated responses to combustion oscillations Impact Co. It can be clearly seen that the changing trends of simulated dynamic responses Impact Co are highly proportional to those of combustion oscillations. This consistency provides clear evidence that the event associated with Impact Co is primarily the forced response caused by the high frequency oscillations of in-cylinder pressure.
The RMS results of modal responses of Impact Cs induced by different fuels show more abundant information. As can be seen in the bottom plot of
Figure 15b, under high load conditions, with the fuel injection quantity increasing, the atomisation of biodiesel during the premixed combustion phase deteriorated significantly, thereby resulting in a reduction of the shock strength and the consequent dynamic responses.
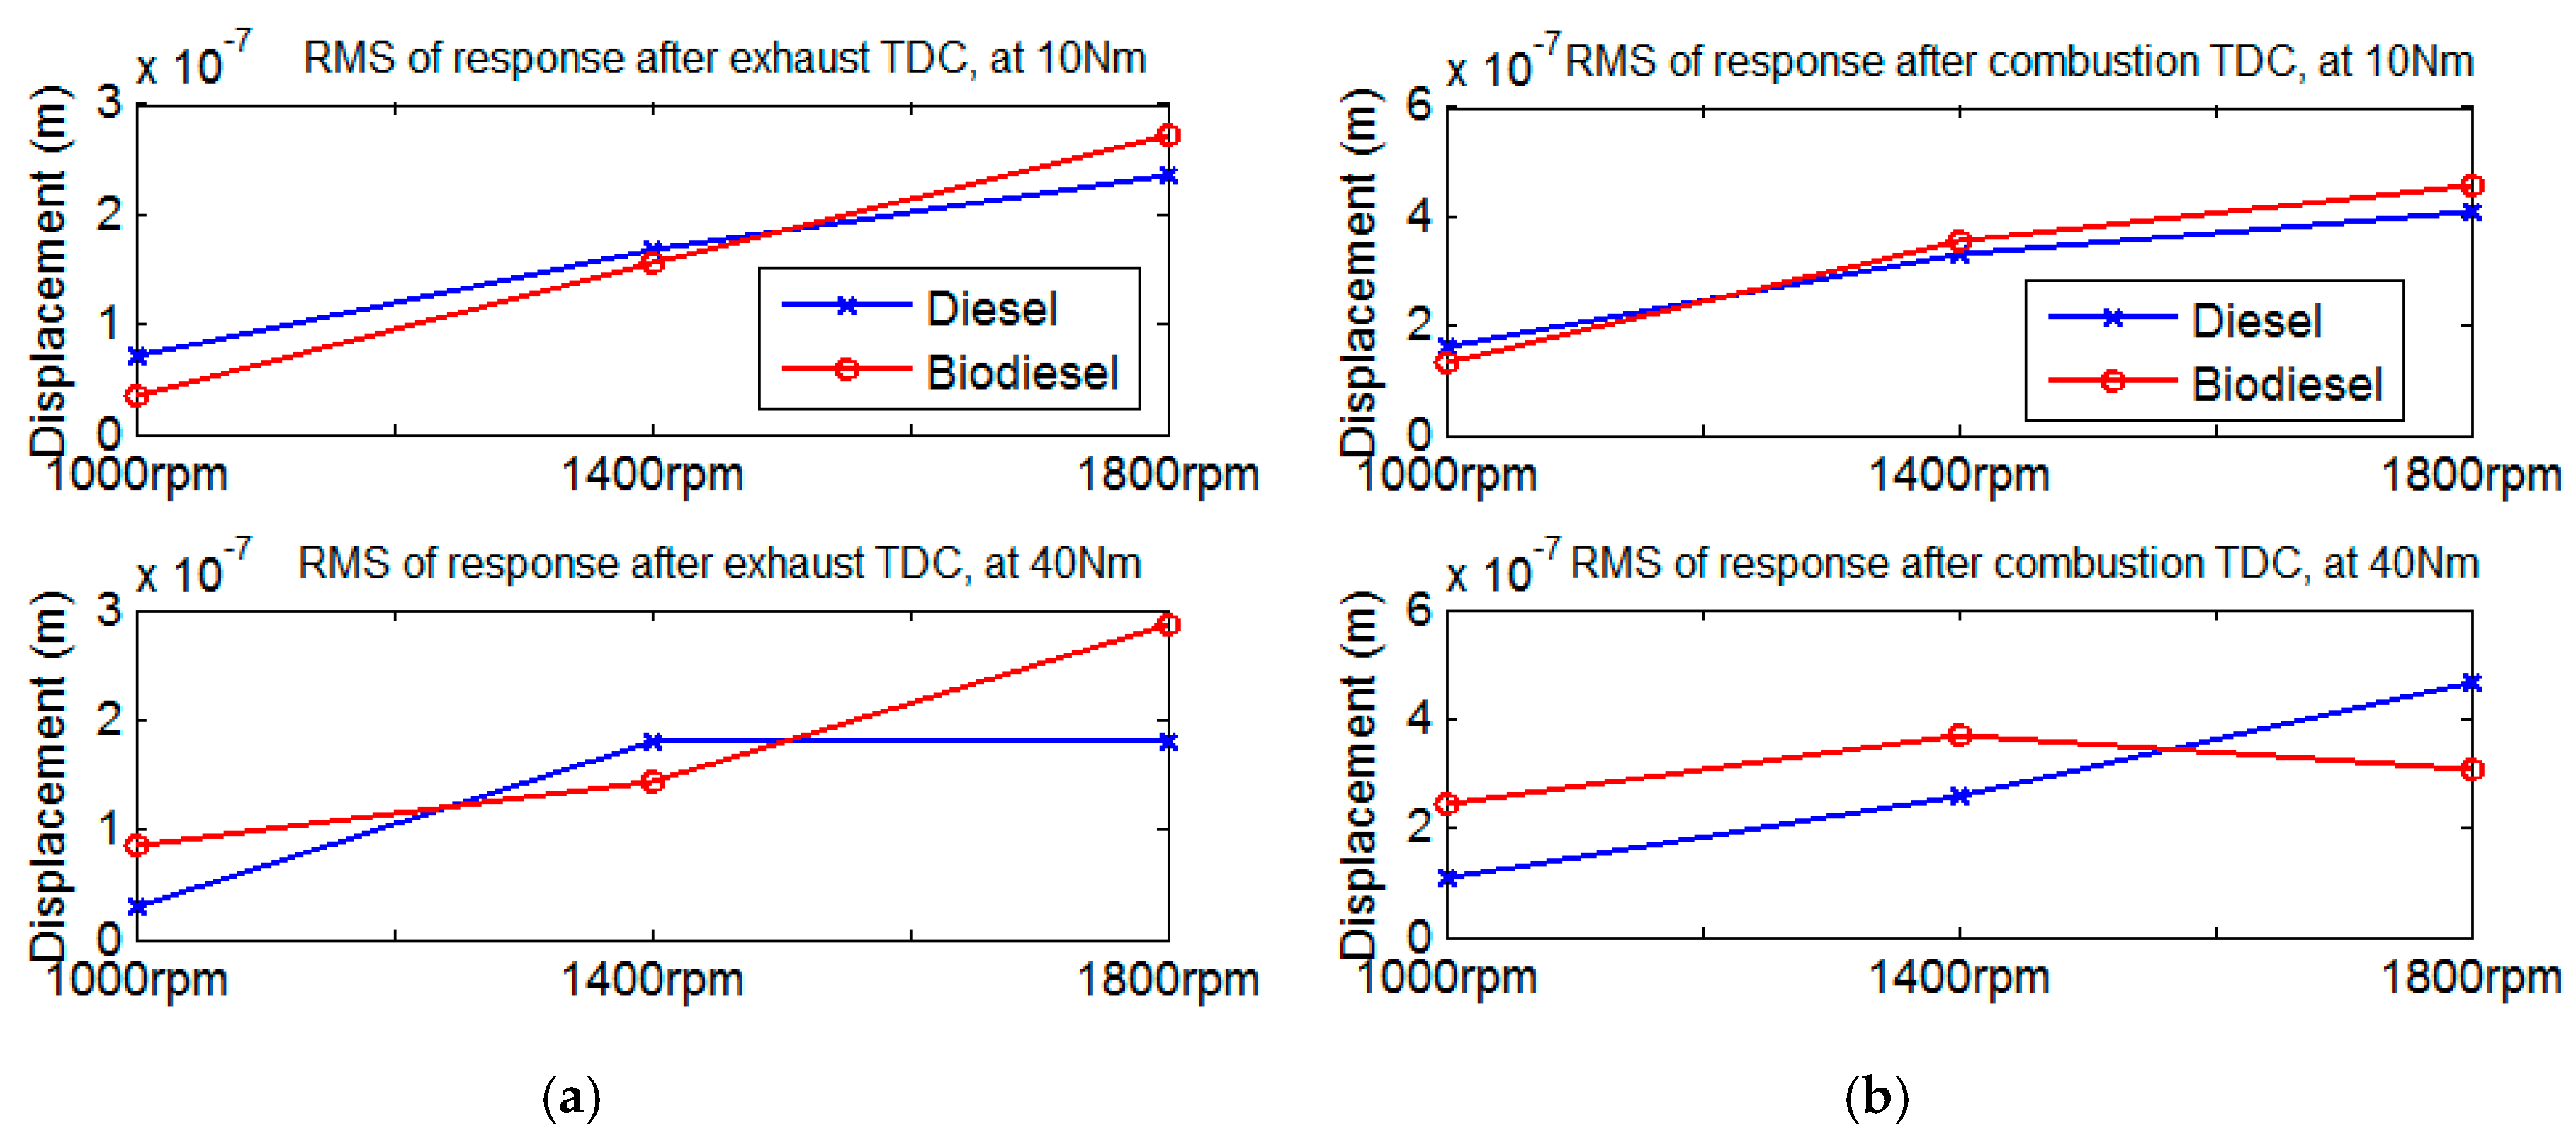
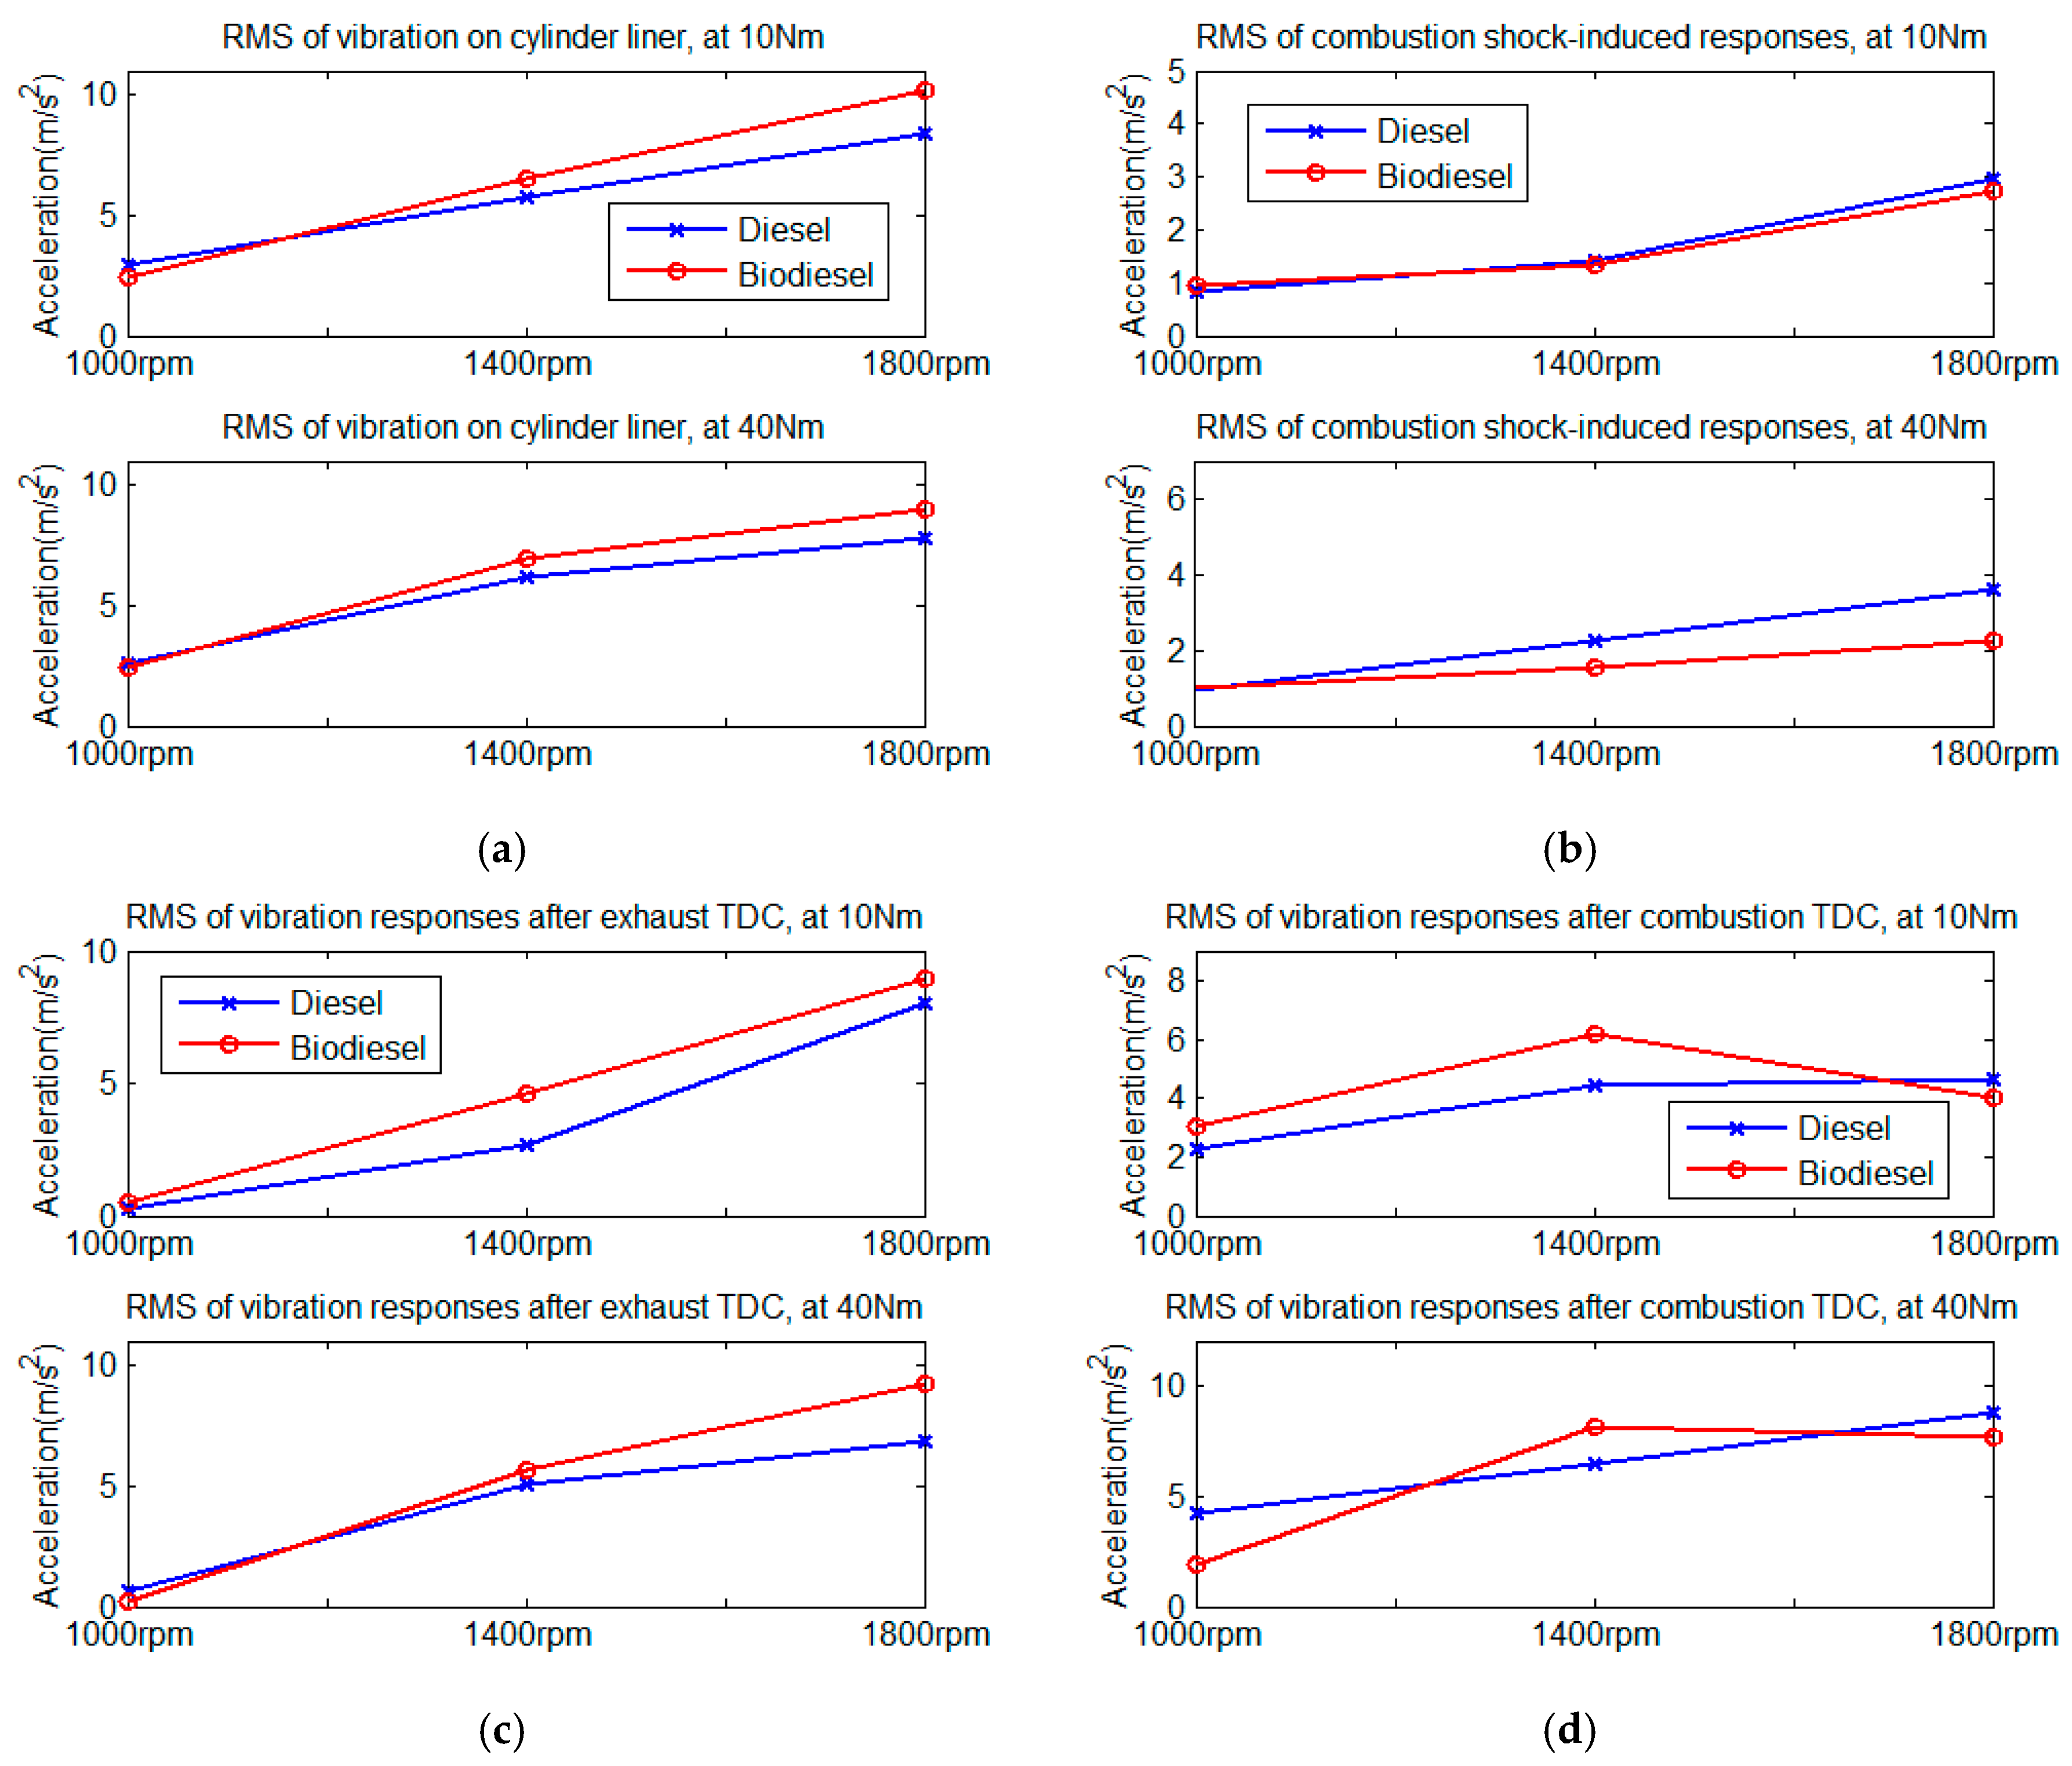
To analyze the variation trends of dynamic responses to piston slaps, the RMS results of local responses around two TDCs, marked with blue and red rectangles in
Figure 14, have been calculated and drawn, as shown in
Figure 16.
As shown in
Figure 16a, under low load conditions, almost all of the RMSs of dynamic responses to slap events after the exhaust TDC increase steadily with the running speed rising. The upward trend of RMSs fueled with biodiesel shows the most rapid rise, which may be due to the prolonged combustion duration as a result of the larger amount of biodiesel injection (biodiesel possesses a lower calorific value). The delayed mixing-controlled combustion phase can cause a relative increase in the kinetic energy of piston side slaps in the exhaust stroke, thereby resulting in the rise of RMSs around the exhaust TDC.
The RMS results of two fuels after combustion TDC show more complex variation tendencies, as shown in
Figure 16b. Under low-load conditions, with the increase in the operating speed, both fuels show similar trends to the forced responses Impact Co of combustion oscillations, indicating that the slap-induced responses around the combustion TDC are basically consistent with the in-cylinder combustion behaviors under low-load conditions. Under high-load conditions, the RMS result of biodiesel shows a clearly decreasing tendency after an increase, which cannot be well interpreted by the combustion characteristics of biodiesel itself.
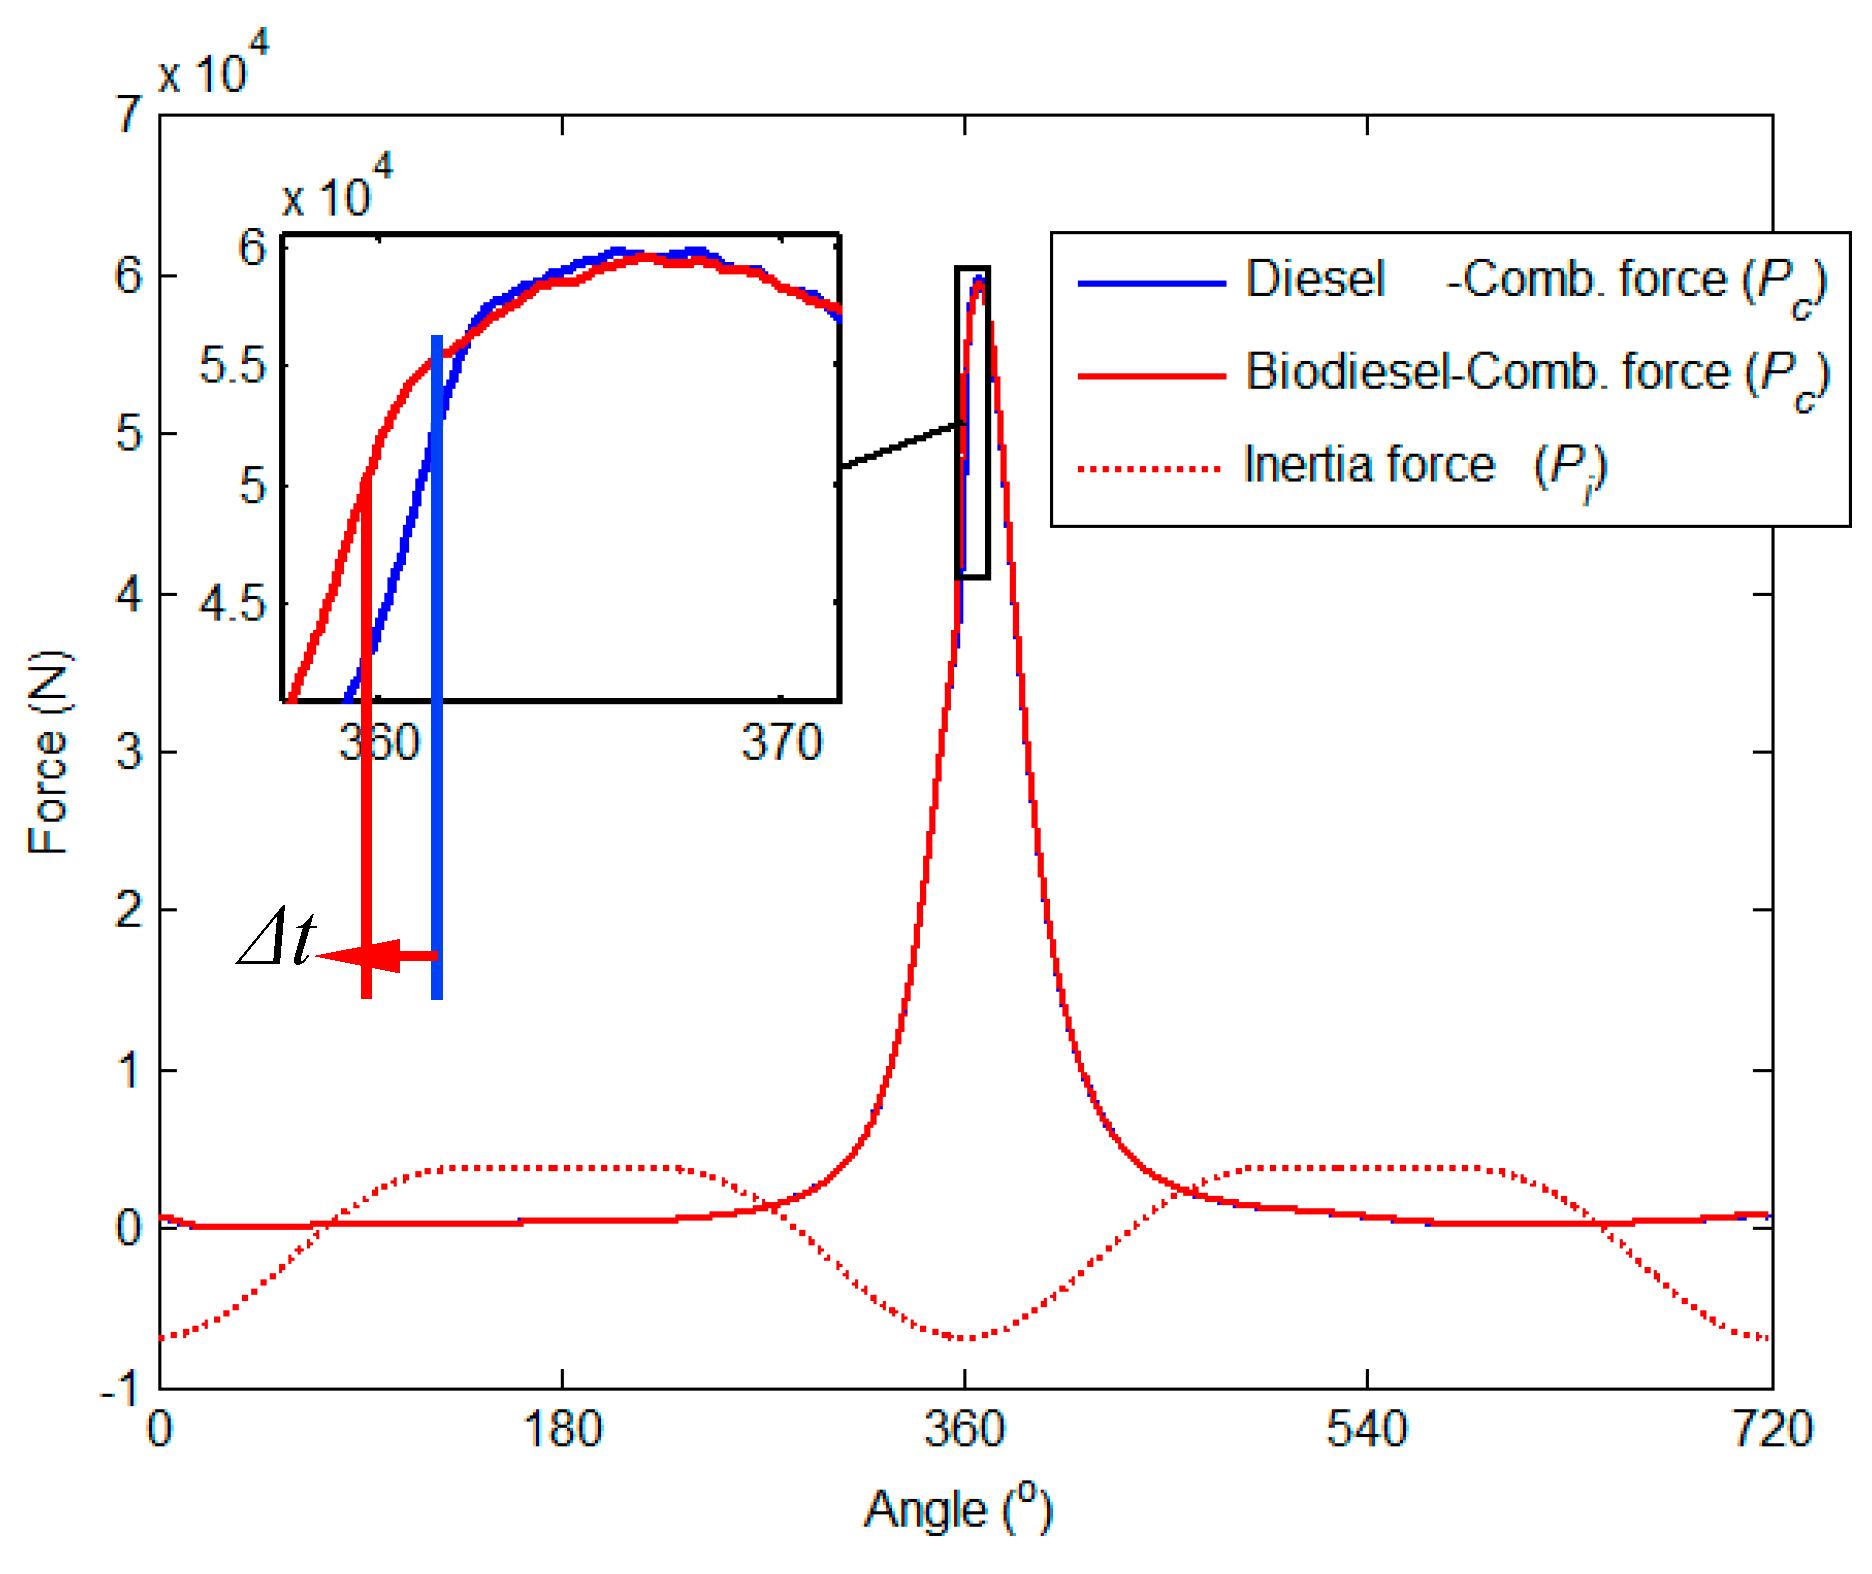
To reveal the reasons for this trend, it is necessary to have an in-depth understanding of the formation mechanism of the piston side-thrust force, and especially the effects of combustion pressure on the peak value of piston thrust force around the combustion TDC.
Figure 17 shows a typical characteristic of the piston side-thrust force, combined with the longitudinally acting combustion force
Pc and axial inertia force of piston assembly
Pi, obtained based on the engine in this study.
As the piston side-thrust force is decomposed from the longitudinally acting combustion force and the inertia force of the moving piston assembly, which pushes the piston assembly from one side of the cylinder wall, skipping onto the other side [
9]. Mathematically, this phenomenon can be expressed by the following equations:
The inertia force of the piston assembly is roughly proportional to the square of the crankshaft speed, which means that the inertia force will grow rapidly with the increase of the running speed. Due to the opposite sign, when the increment of the inertia force is greater than that of the combustion force, the cancellation between the combustion force and the inertia force will lead to a decrease in the peak value of the side-thrust force, thereby resulting in a decreasing trend after an increase, as shown in
Figure 16b.
Principally, with the increase of running speed, the piston inertia force of the entire work cycle increases significantly, which results in a corresponding rise in the kinetic energy of piston slaps. Therefore, the RMS result of the liner dynamic response rises steadily with the increase of running speed, represented by the RMSs of local responses near the combustion TDC, as shown in
Figure 16a. The advanced ignition caused by the high cetane number of biodiesel can have a significant contribution to the compound effect on the piston side-thrust force, thereby resulting in a nonlinear trend of the RMSs of local response near the combustion TDC.


