
Permeability and Stiffness Assessment of Paved and Unpaved Roads with Geocomposite Drainage Layers


1
Department of Civil Construction and Environmental Engineering, Iowa State University, Ames, IA 50011, USA
2
Ingios Geotechnics, Inc., Northfield, MN 55057, USA
*
Author to whom correspondence should be addressed.
Appl. Sci. 2017, 7(7), 718; https://doi.org/10.3390/app7070718
Submission received: 10 June 2017
/
Revised: 7 July 2017
/
Accepted: 9 July 2017
/
Published: 13 July 2017
(This article belongs to the Special Issue Advanced Asphalt Materials and Paving Technologies)
Abstract
:Poor subsurface drainage is frequently identified as a factor leading to the accelerated damage of roadway systems. Geocomposite drainage layers offer an alternative to traditional methods but have not been widely evaluated, especially in terms of the impact of changes on both drainage capacity and stiffness. In this study, both paved and unpaved test sections with and without an embedded geocomposite drainage layer were constructed and tested. The geocomposite layers were installed directly beneath the roadway surface layers to help the rapid drainage of any infiltrated water and thus prevent water entering the underlying foundation materials. The laboratory, field, and numerical analysis results showed that the geocomposite layers increased the permeability of roadway systems by two to three orders of magnitude and that it can effectively prevent the surface and foundation materials from becoming saturated during heavy rainfall events. For the stiffness of the sections, the paved sections with and without a geocomposite layer showed that the composite modulus values measured at the surface were more reflective of the foundation layer support conditions beneath the geocomposite layer than the geocomposite layer itself. The unpaved road section with the geocomposite layer yielded lower composite modulus values than the control section but showed overall better road surface conditions after a rain event due to the improved subsurface drainage condition.
1. Introduction
Poor subsurface drainage is frequently identified as a factor leading to the accelerated damage of both paved and unpaved roadway systems. Typically, subsurface drainage is controlled with ditches, edge drains, drainable aggregate layers, and/or roadway crowns. These methods typically require maintenance, and the drainage capacity degrades with time. Geocomposite drainage layers offer an alternative to traditional methods but have not been widely field tested, especially in terms of the impact of changes on both drainage capacity and pavement foundation stiffness.
Geocomposites usually consist of two geotextile outer layers and an internal drainage layer (i.e., geonet) and are typically designed to provide three-dimensional subsurface drainage, soil separation, and filtration [1,2]. Previous lab and field studies have shown the potential for using geocomposite drainage layers to reduce drainage-related damage for both paved and unpaved roads [3,4,5,6,7]. However, the influence of geocomposite layers on the composite stiffness of pavement systems and the drainage performance under transient water flow conditions are not well documented. A numerical analysis showed that geotextiles on either side of a geocomposite layer can decrease plastic deformation through combined mechanistic and hydraulic actions for both paved and unpaved roads, but increasing the surface course or base course thickness reduces the reinforcement benefits [3]. The effects of the location of a geocomposite drainage layer in an asphalt pavement system were studied by Christopher et al. [4], in which it was found that geocomposite drainage layers were quickest at removing water during spring thaws when placed on or within the subgrade. Falling weight deflectometer (FWD) test results from the same study showed that a section with geocomposite in the subgrade had a higher stiffness than sections with geocomposites embedded at higher positions in the pavement foundation.
In this study, paved (with either concrete or asphalt surfaces) and unpaved roadway test sections with and without an embedded geocomposite drainage layer were constructed and tested in Iowa, USA. The geocomposite drainage layers were placed directly beneath the roadway surface layers to help the rapid drainage of any infiltrated water through the pavement joints, cracks, or unpaved road surface materials and thus prevent water entering into the underlying foundation layers. However, since the locations of the relatively soft geocomposite layers are close to the roadway surfaces, the impact of changes on both the drainage capacity and stiffness of the systems need to be evaluated. A laboratory large-scale horizontal permeameter test (HPT) device was developed to measure the horizontal saturated hydraulic conductivities of the system with and without an embedded geocomposite drainage layer. Core-hole permeameter (CHP) and air permeameter test (APT) devices were also used to evaluate the in situ drainage conditions of the test sections. To assess the influence of the geocomposite layers on the composite stiffness of the roadway systems, falling weight deflectometer (FWD) tests were used to measure the composite elastic modulus of the test sections. A two-dimensional (2D) water infiltration model was also developed based on Richard’s equation and Haverkamp’s soil water retention characteristic (WRC) model to simulate a heavy rain event (i.e., transient flow condition) and to compare the effectiveness of the geocomposite drainage layer with the current practice of improving the drainage conditions of unpaved roads by building and maintaining a 4% crown to enable lateral water flow.
2. Descriptions of Materials and Test Sections
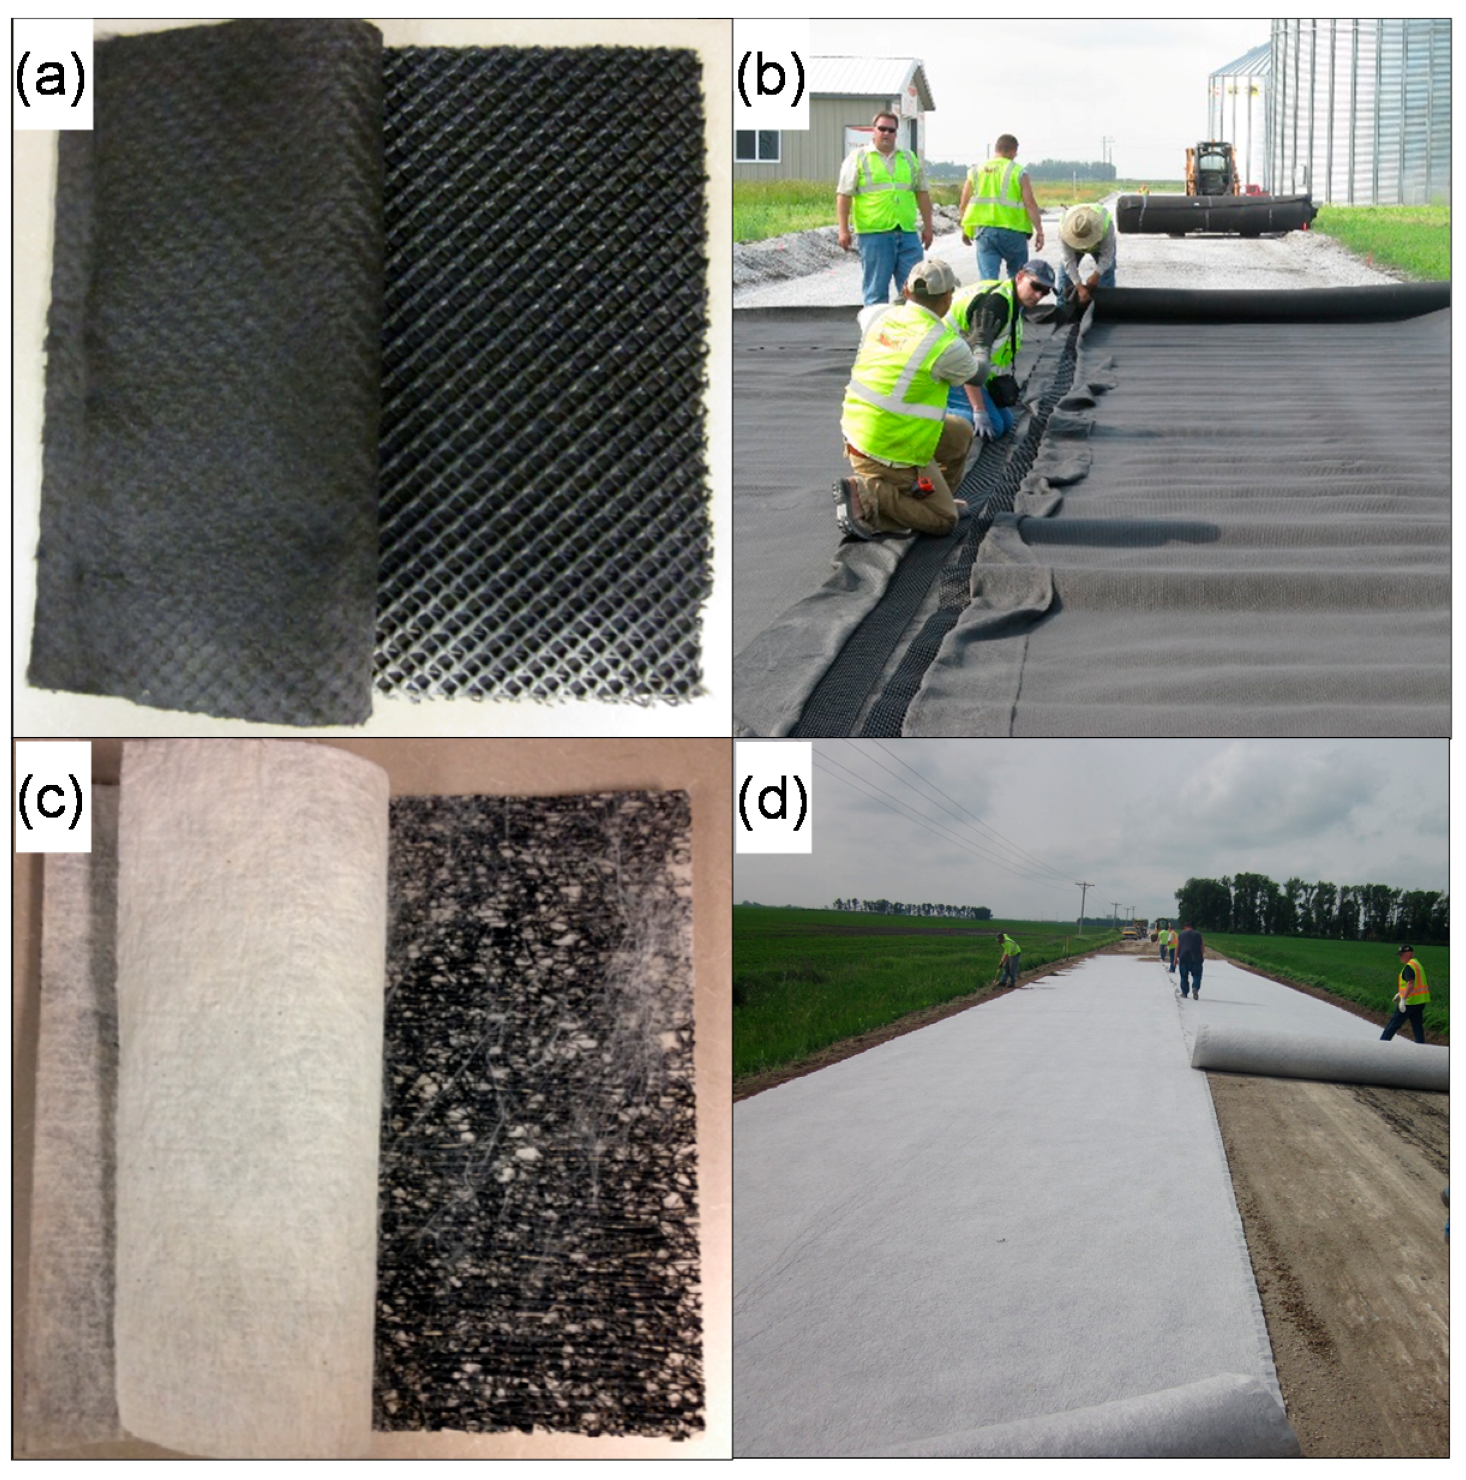
In this study, the two different geocomposite materials (GC-1 and GC-2) consisting of two layers of non-woven geotextile with synthetic polymer geonet cores were evaluated. The properties of the two materials provided by the manufactures are shown in Table 1. Geocomposite GC-1 (Figure 1a,b) possessed a thicker non-woven geotextile and a stiffer geonet core than GC-2 (Figure 1c,d). The stiffness values of the geocomposite materials were not provided by the manufacturers.
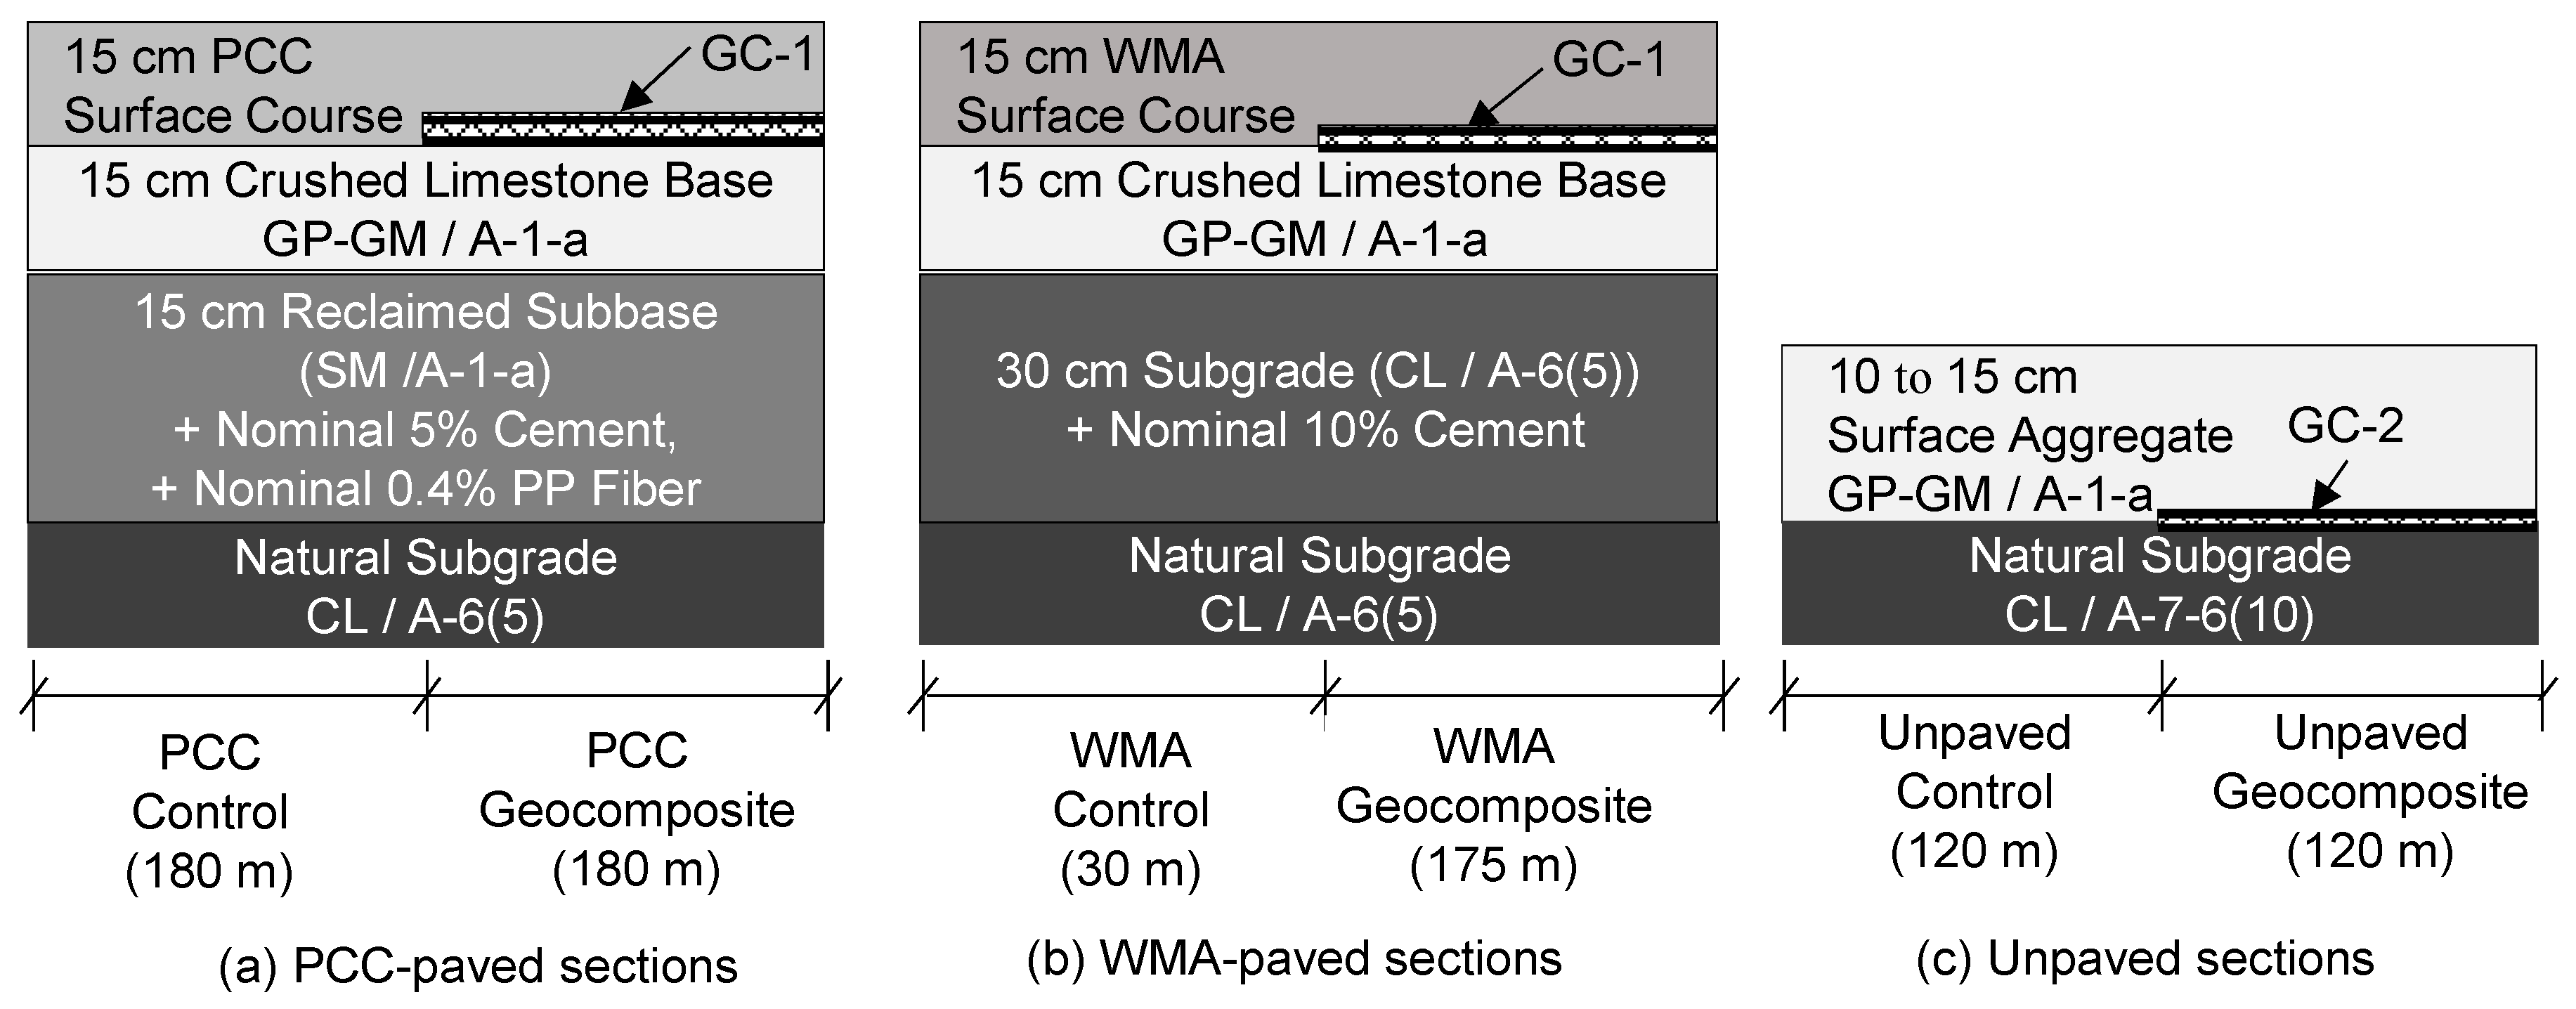
A total of six test sections were constructed at two different sites, with the Portland cement concrete (PCC) and warm-mixed asphalt (WMA) sections located at the same site. The nominal cross-section profiles of the test sections are shown in Figure 2. For the paved test sections, GC-1 was installed at the top of the base layer (directly beneath the pavement layer) prior to paving. For the unpaved test sections, GC-2 was placed at the interface of the subgrade and surface aggregate layers. The soil index properties of the geomaterials used in this study are summarized in Table 2.
For the PCC-paved sections, discrete fibrillated polypropylene (PP) fibers with 5% Portland cement (PC) were used to stabilize the reclaimed subbase layer. Two WMA sections were constructed at the same site as the PCC sections (Figure 2). The top 30 cm of natural subgrade of the WMA sections were stabilized with 10% Portland cement. The detailed test section designs, construction processes, material properties, and costs are beyond the scope of this paper but are reported in [12,13].
The unpaved road test sections were constructed at a different site. The final thickness of the surface aggregate layer after construction ranged between 10 and 15 cm, and the subgrade had a slightly higher fines content than the subgrade of the paved test sections. The GC-2 geocomposite was placed at the interface of the surface aggregate layer and subgrade. The construction processes and costs of the test sections are described in detail in [14].
3. Test Methods
To compare the drainage conditions of the roadway systems with and without a geocomposite drainage layer and determine inputs for the numerical simulations, a large-scale laboratory horizontal permeameter test (HPT) was conducted to evaluate the saturated horizontal hydraulic conductivity of the systems. For the field-test sections, two innovative devices, core-hole permeameter (CHP) and air permeameter test (APT) devices, designed at Iowa State University, were used to measure the in situ hydraulic conductivities of the different test sections. The influences of the geocomposite layers on the composite stiffness of the roadway systems were assessed using the falling weight deflectometer (FWD) test. The descriptions, theories, and testing procedures of the different testing methods are described in the following sections.
3.1. Laboratory Large-Scale Horizontal Permeameter Test (HPT)
The large-scale horizontal permeameter test (HPT) was developed to measure the saturated hydraulic conductivity of the aggregate materials under horizontal flow conditions because most permeability tests employ vertical flow, which does not accurately represent how water typically drains or flows through the pavement base layers horizontally in the field. The device can simulate direct horizontal flow situations under different pressure heads and is large enough (soil tank dimensions are 1 m × 0.46 m × 0.33 m) to effectively test multiple material layers, as shown in Figure 3. The inside wall of the HPT soil tank has several ribs (1 cm in height) installed perpendicular to the flow direction to prevent water flowing through the interface of the soil specimen and the inside wall of the soil tank.
To quantify the improvement in horizontal drainage offered by the geocomposite layer, representative base material (Unified soil classification system (USCS) group symbol: GP-GM) were collected from the field and compacted in the HPT soil tank with and without a layer of geocomposite. Three HPTs were conducted; one specimen consisted of the base material only, and the other two had one of the two types of geocomposite drainage materials embedded (i.e., GC-1 and GC-2). The testing specimens were compacted to the standard Proctor maximum dry unit weight of 22.0 kN/m3, determined in accordance with ASTM D698 [15]. The saturated horizontal hydraulic conductivities of the three specimens were measured under four different constant water heads of 50, 100, 150 and 200 mm. In the field, the geocomposite materials are placed at the interface of material layers. However, for the HPT test, the geocomposite layer was embedded at the middle of the test specimen to prevent any boundary issues such as the water flowing through the gap between the geocomposite layer and the bottom of the soil tank.
3.2. Core-Hole Permeameter (CHP) Test
The CHP device (Figure 4a) was developed to assess the in situ drainage capacities of pavement base systems. The test method follows the procedure in ASTM D6391 [16]. In this study, the CHP test results were used to compare the relative drainage capacities of the foundation system with and without a geocomposite layer placed at the pavement/base layer interface. The condition this simulates is the ability to drain any infiltrated water through the pavement surface via joints/cracks. Vennapusa et al. [17] showed that by using the American Association of State Highway and Transportation Officials (AASHTO) 1993 design guide PCC pavement design procedure, an increase in the drainage coefficient (Cd) value of the base material from 1.0 to 1.2 can reduce the required PCC pavement thickness by up to 10%. The CHP test uses the falling head method to measure the in situ hydraulic conductivity of the drainable base and geocomposite drainage layers of the paved test sections after drilling cores, as shown in Figure 4b,c. The test involves drilling a 15 cm diameter core hole through the pavement surface to the underlying base or geocomposite layer, inserting the device and sealing it against the bottom foam ring and interior of the core hole using a rubber tube inflated to 135–175 kPa, and recording the rate of water head loss from the device over a period of 30 to 60 min. The hydraulic conductivity (K) of the tested layer was calculated using Equation (1). The testing procedure is described in detail by Zhang et al. [18].
where and are the effective heads (cm) at time and (s), respectively; is the ratio of the kinematic viscosity of the permeant at the temperature of the test during time increment to to that of water at 20 °C; T is the temperature of the test permeant (°C); d is the inside diameter of the standpipe (3.6 cm for the top standpipe and 33 cm for the middle standpipe); is the inside diameter of bottom casing (12.7 cm); is the thickness of tested layer (cm); and a is equal to for an impermeable base at , 0 for the infinite depth of the tested layer (i.e., > 20), and for a permeable base at .
3.3. Air Permeameter Test (APT)
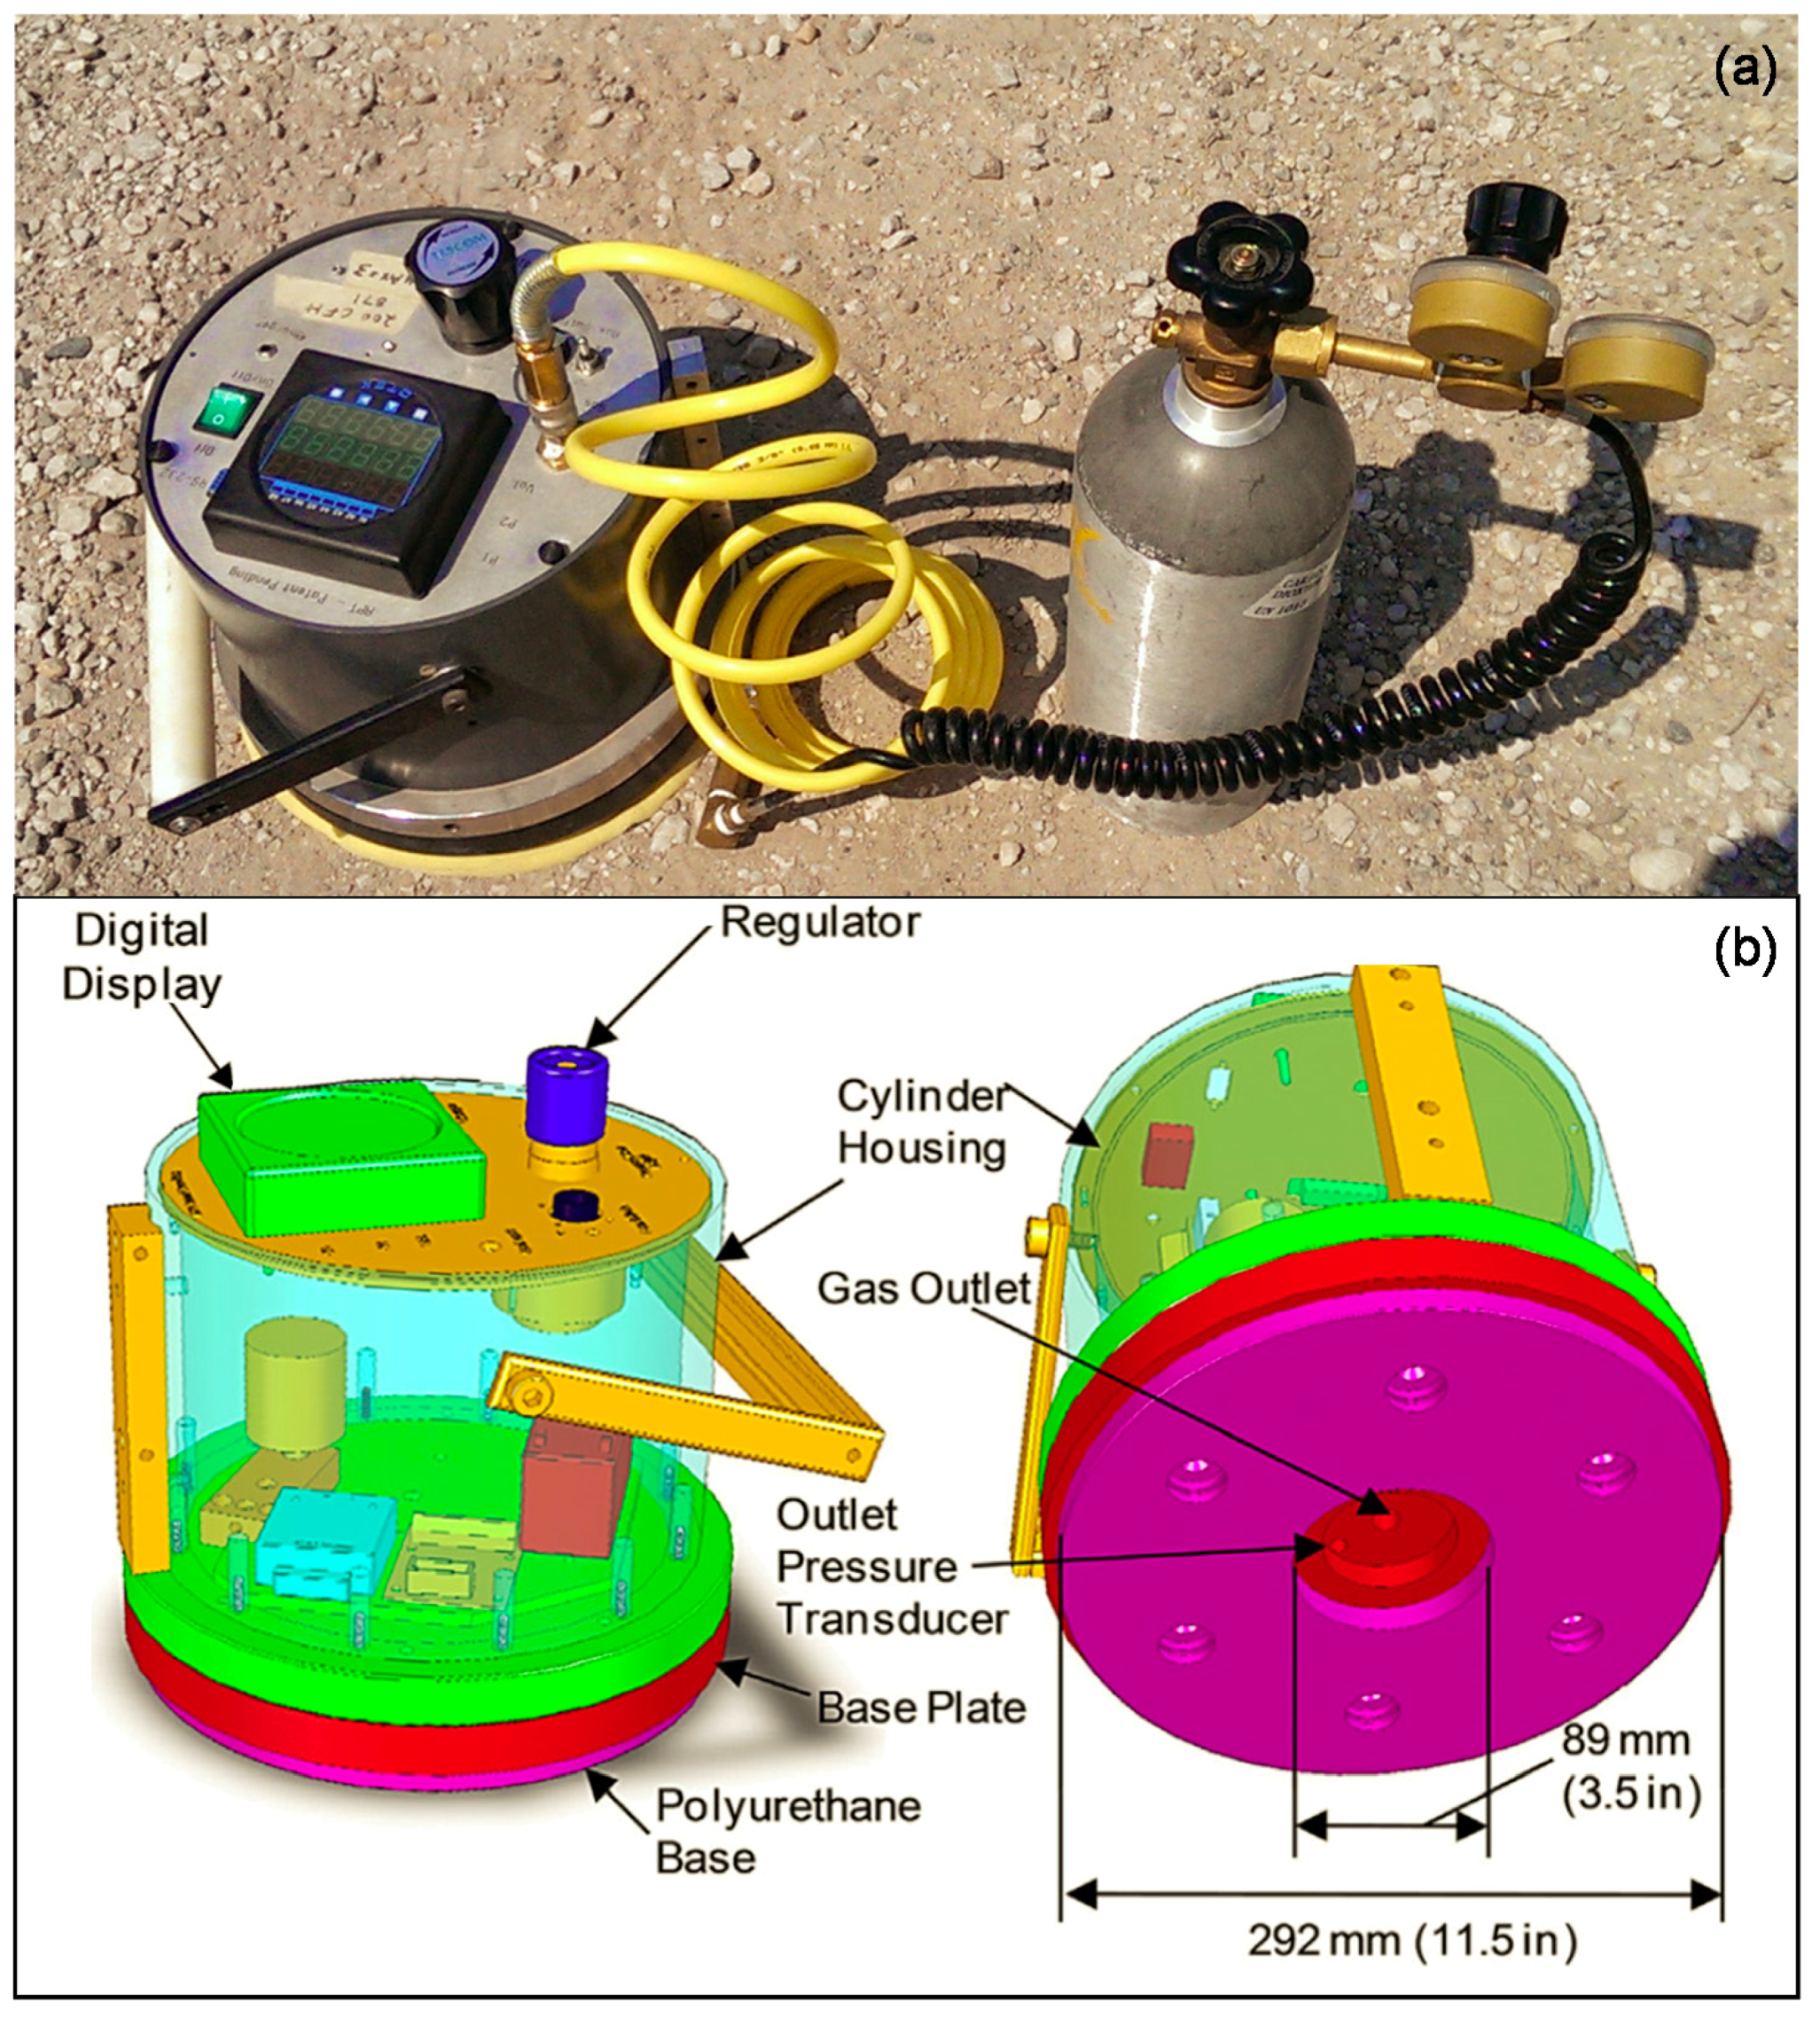
The APT device was developed for rapid in situ saturated hydraulic conductivity determination for granular materials (Figure 5a). The APT device consists of a contact ring, differential pressure gauges, precision orifices, and a programmable digital display (Figure 5b).
The APT device measures the gas pressure on the inlet and outlet sides of the precision orifice and calculates the gas flow rate. From these measurements and the material parameters, the gas permeability of the material being tested can be derived and converted to water saturated hydraulic conductivity (Ksat) by taking into account the effect of partial saturation (Equation (4)).
where Ksat is the saturated hydraulic conductivity (cm/s), μgas is the kinematic viscosity of the gas (Pa-s), Q is the flow rate (cm3/s), P2a is the absolute gas pressure on the surface (Pa), r is the radius at the outlet (cm), G0 is the geometric factor determined from test layer thickness, Patm is the atmospheric pressure (Pa), ρ is the density of water (g/cm3), g is the acceleration due to gravity (cm/s2), μwater is the kinematic viscosity of water, Se is the effective saturation, and λ is the Brooks-Corey pore size distribution index.
The derivation of Equation (4) involves an expansion of Darcy’s Law considering the compressibility and viscosity of the gas, the gas flow under partially saturated conditions, and the Brooks-Corey pore size distribution index. The development of the testing method, description of the device, and derivations of the theoretical relationship to calculate the hydraulic conductivity from the gas flow are detailed by White et al. [19]. The repeatability of the APT measurements, expressed as a coefficient of variation (COV), is ≤1% [20]. In this study, the APT test was conducted to measure the in situ saturated hydraulic conductivity as a function of depth for the unpaved road test sections.
3.4. Falling Weight Deflectometer (FWD) Test
FWD tests were conducted using a Kuab Model 150 2m device with a 300-mm diameter segmented loading plate to apply a relatively uniform stress distribution. A 40 kN impact load was applied on the roadway surface, which is the AASHTO standard axle load [21]. The induced roadway surface deflection at the center of the loading plate was recorded by a seismometer. For each test location, a single equivalent composite elastic modulus of the roadway system was calculated based on Boussinesq’s solution using Equation (5);
where EComposite is the composite elastic modulus (MPa), is the measured deflection under the center of the loading plate (mm), σ is the Poisson’s ratio (assumed to be 0.4), σ0 is the normalized applied peak stress (MPa), A is the radius of the plate (mm), and f is the shape factor, assumed to be 2 because of the assumed uniform stress distribution.
4. Laboratory Horizontal Permeameter Test (HPT) Results
The saturated horizontal hydraulic conductivities of the specimens with and without an embedded geocomposite layer were measured under four different constant water heads (i.e., 50, 100, 150 and 200 mm). The relationships between the hydraulic conductivity (K) and hydraulic gradient (i) of the three specimens are shown in Figure 6. The horizontal saturated hydraulic conductivity of the specimen without a geocomposite layer at 20 °C (K20 °C) was approximately 0.8 m/day and remained relatively constant as the hydraulic gradient increased. Compared to the specimen without a geocomposite layer, the geocomposite drainage layer increased the saturated hydraulic conductivity by two to three orders of magnitude.
Figure 6 also shows that the GC-2 geocomposite had a higher horizontal hydraulic conductivity (~1500 m/day) than the GC-1 geocomposite (~350 m/day). The total thickness of GC-1 is greater than that of GC-2 due to the thicker geotextile on each side of the geonet core for GC-1 However, the geonet core of GC-2 is more porous and has the approximately the same thickness as GC-1.
5. In Situ Permeability and Stiffness of The Test Sections
5.1. In Situ Permeability Assessment
The CHP test was conducted on the PCC and WMA sections to compare the subsurface drainage conditions of the GC-1 geocomposite layer and conventional base materials. The CHP test results showed that the in situ hydraulic conductivity of the GC-1 layer varied between 637 and 695 m/day with a coefficient of variation (COV) of 5.8%, whereas that of the crushed limestone base layer was between 0.1 and 34.2 m/day with a COV of 110%. The hydraulic conductivity of the geocomposite varied within a much smaller range compared to the base material, which may indicate that the segregation of the traditional base material can cause significant variation in the drainage performance of roadway systems.
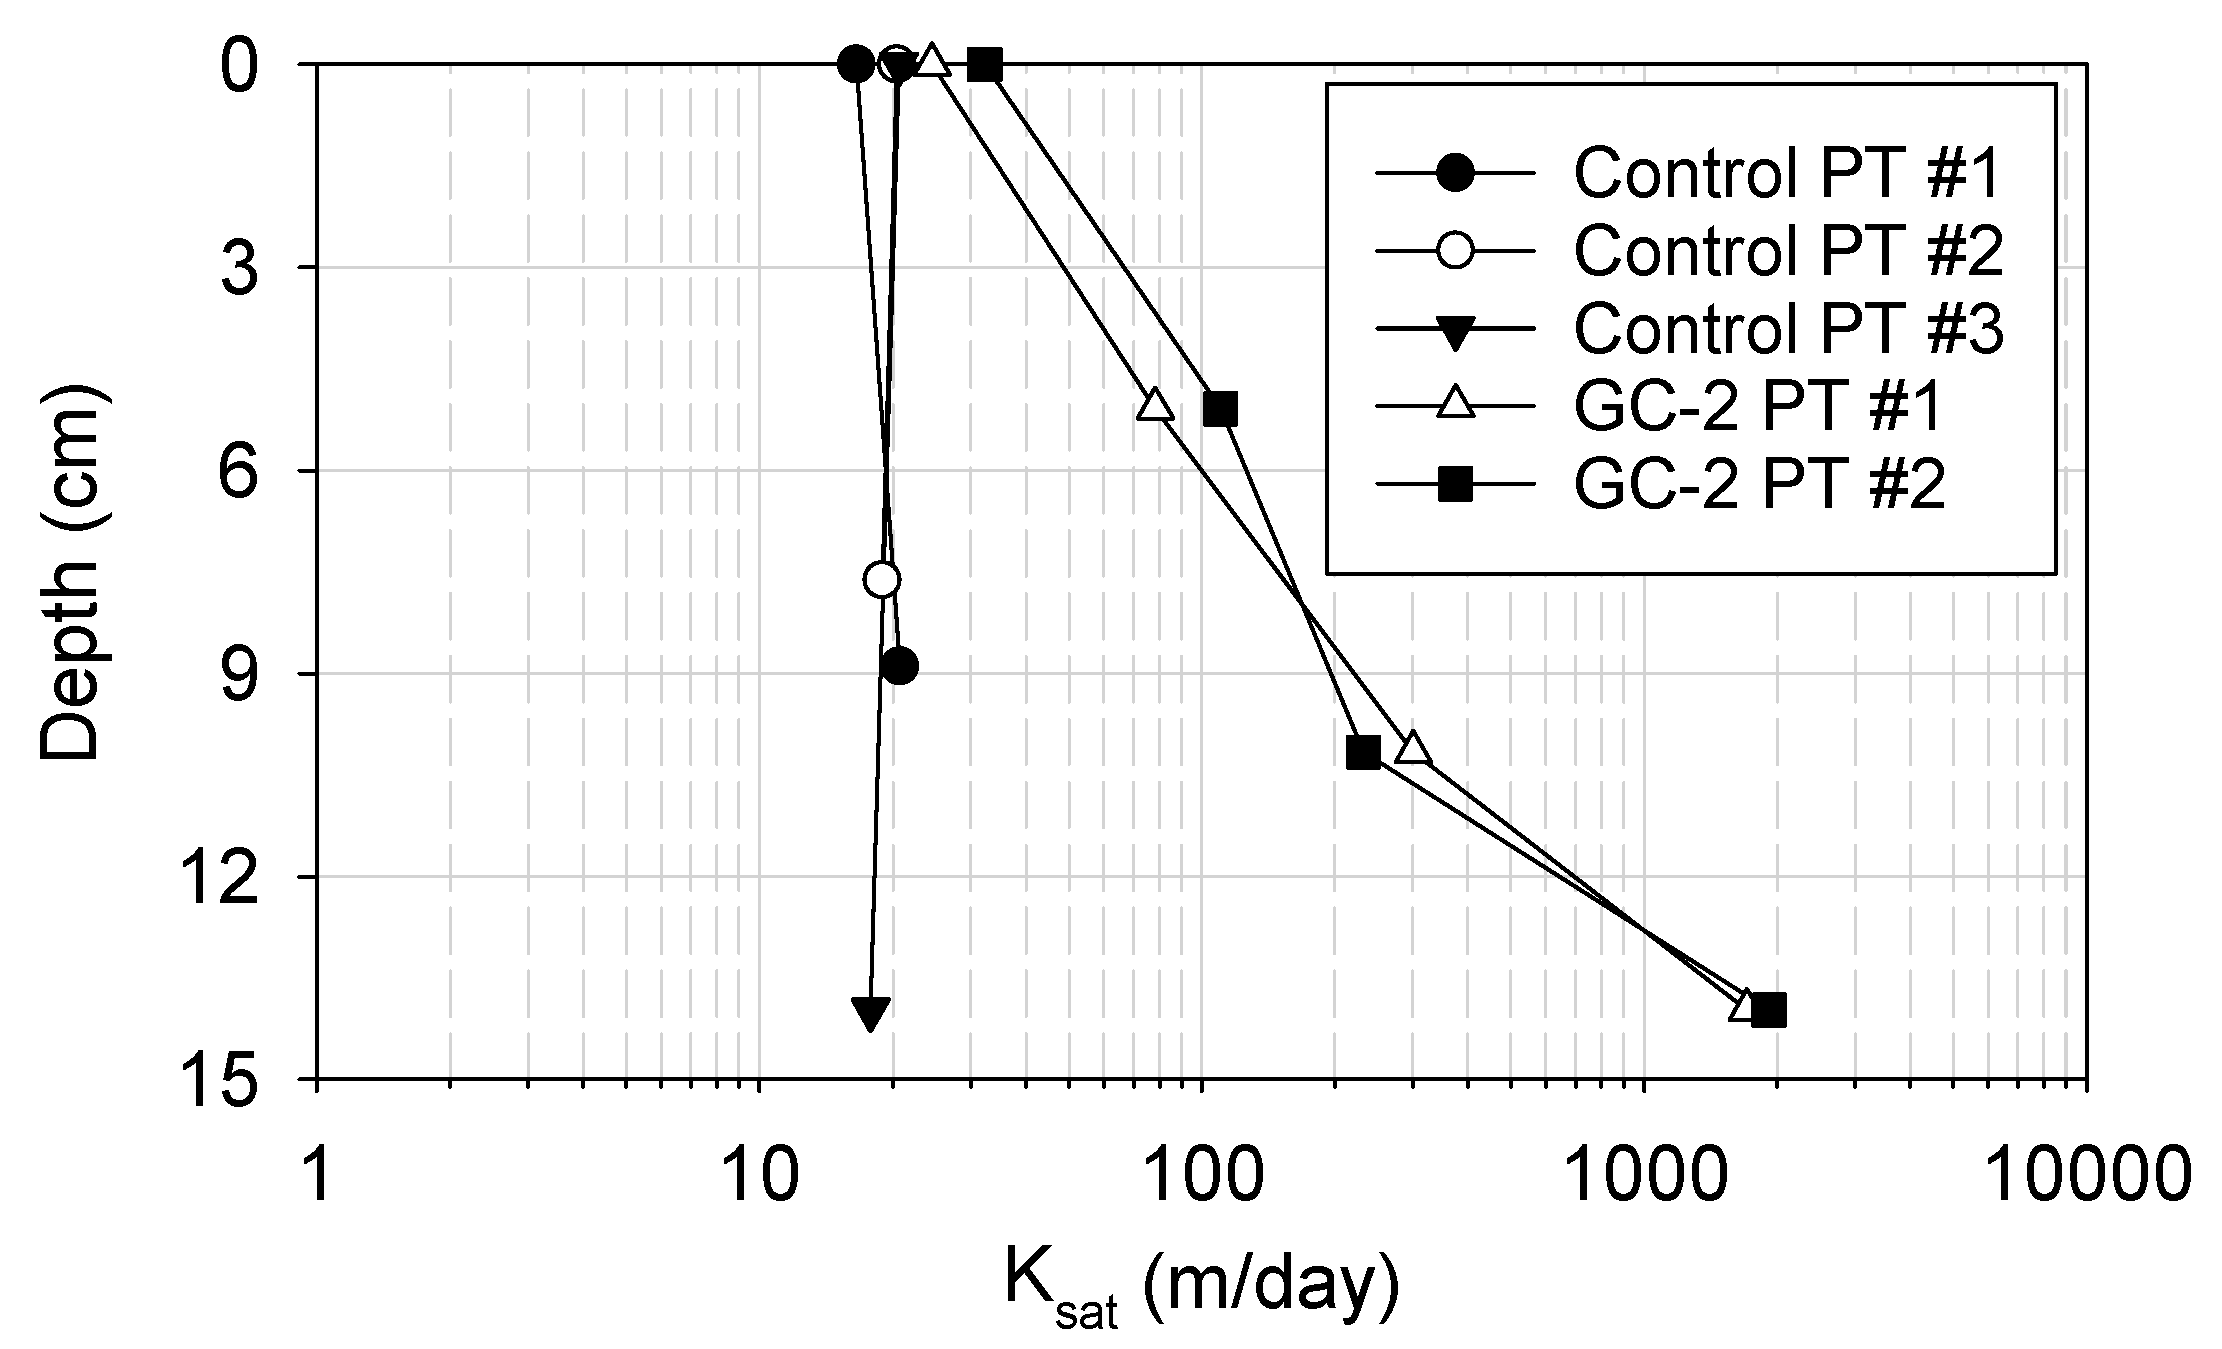
The APT device was used to quantify the improvement in drainage offered by the geocomposite layer (GC-2) for the unpaved road test sections. For each test location, APTs were performed at different depths within the overlying aggregate layer to determine the variation of saturated hydraulic conductivity (Ksat) with depth. The test results are summarized in Figure 7. For the control section, the Ksat values at the three test locations were similar (~19 m/day) and remained relatively constant with depth. However, for the geocomposite section, Ksat in the surface aggregate layer increased consistently with depth from the roadway surface. The Ksat of the GC-2 drainage layer is approximately 1920 m/day, which is more than two orders of magnitude greater than that of the control section. The field-measured Ksat of the GC-2 agreed very well with the HPT test results shown in Figure 6.
5.2. In Situ Stiffness Assessment
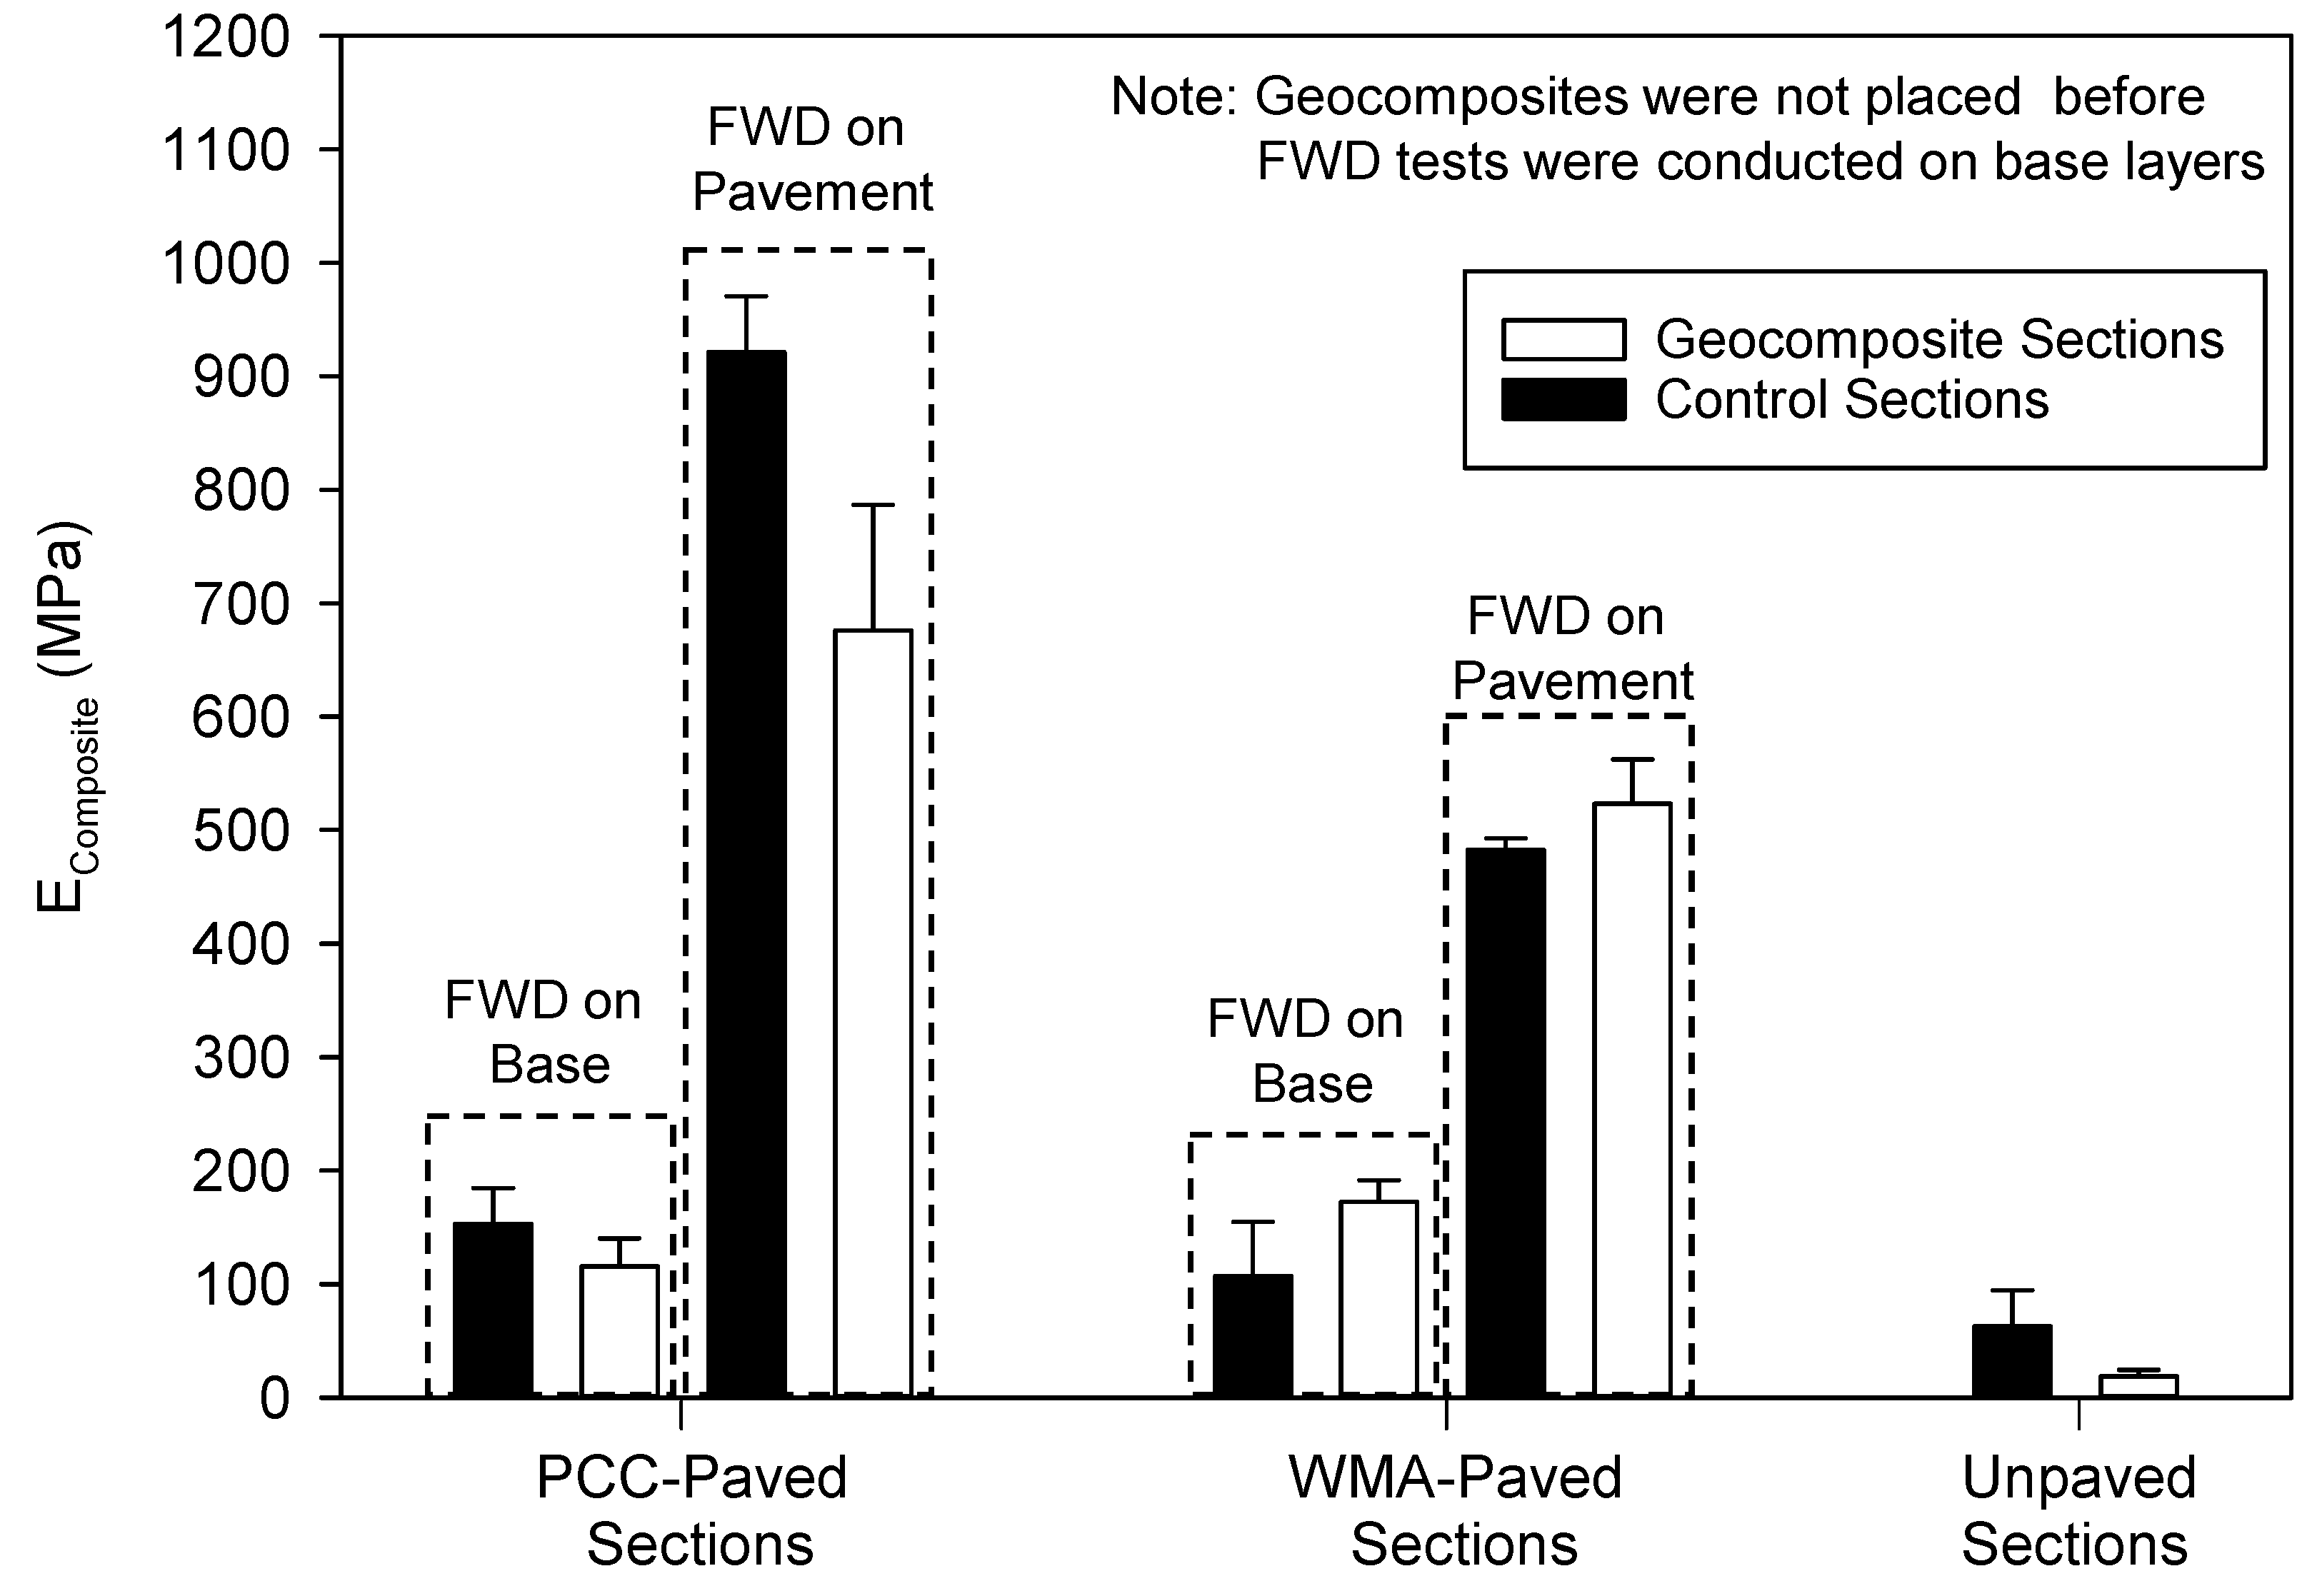
To assess the influence of the geocomposite layer on the composite stiffness of the PCC- and WMA-paved sections, two groups of FWD tests were conducted; (1) on the base layer prior to placing the geocomposite layers on the base layer and (2) on the pavement surfaces after paving, with the geocomposite layer installed at the pavement/base layer interface. The FWD tests were conducted at the same test locations on both the base and the pavement surface layers. A comparison of the two groups of test results shows the influence of the geocomposite on the composite stiffness (Figure 8).
For the PCC sections prior to paving, the foundation layer in the geocomposite section had a lower average EComposite value than the control section. After placing the geocomposite layer and paving, the FWD tests conducted on the pavement surface showed similar trends, wherein the control section had a higher average EComposite value than the geocomposite section. For the WMA sections, the composite modulus values in the geocomposite section were higher than in the control section for tests conducted both on the foundation layer and the pavement layer. These FWD results from the paved road test sections, although limited, suggest that the composite stiffness measurements obtained at the pavement surface were more reflective of the foundation layer support conditions beneath the geocomposite layer than of the stiffness of the geocomposite layer itself.
FWD tests were also conducted on the unpaved sections after the spring thaw in 2015 because the spring thaw is when unpaved roads are most susceptible to moisture-related damage. Figure 8 shows that the average EComposite of the geocomposite section is less than half that of the control section. However, the roadway surface performance of the geocomposite section was much better than that of the control section based on observations after a heavy rainfall and subsequent traffic, as can be clearly seen in Figure 9. The control section suffered much greater rutting and moisture retention than the geocomposite section. These field observations after the rain event indicate that the improved subsurface drainage conditions offered by the geocomposite layer can effectively prevent the surface material from becoming saturated during a heavy rain event, reduce the amount of water infiltrating into the subgrade, and thus reduce the surface damage. To further examine this hypothesis, a numerical analysis is conducted in the following section to compare the drainage performance of the geocomposite and control sections after a simulated heavy rain event.
6. Numerical Simulation of Drainage Performance under Heavy Rainfall
To improve the drainage conditions of unpaved roads, most agencies choose to build and maintain a 4% roadway crown to enable lateral water flow to drain excess water from the surface course into side drains or ditches. However, this practice requires frequent maintenance, and the effectiveness of the method needs to be quantified. In this study, a numerical simulation was performed to compare the drainage capacity offered by the geocomposite drainage layer with that of a 4% roadway surface crown for unpaved roads. A 2D water infiltration model was programmed in Matlab using Richard’s equation and Haverkamp’s soil water retention characteristic (WRC) model [22,23].
Richards’ equation (Equation (6)) is used to predict volumetric water content () and matric potential () changes of the unpaved road surface material during transient water flow;
Liquid water flow in the vertical and horizontal directions is expressed using the well-known Darcy-Buckingham flux equations:
where is the water flux in cm/s, is the unsaturated hydraulic conductivity in cm/s, h is the matric potential in cm, or is the matric potential gradient, is the slope of the soil layer in degrees, and the material is assumed to be isotropic and homogenous.
Haverkamp’s water retention characteristic (WRC) model was used to estimate relationships between unsaturated hydraulic conductivity, matric potential, and the water content of the unpaved surface material during transient flow, as shown in Equations (9) and (10):
where is the volumetric water content at the corresponding matric potential (h), is the residual volumetric water content, is the saturated volumetric water content, is equal to 1.611 × 10⁶, and is equal to 3.96.
where is the unsaturated hydraulic conductivity at the corresponding matric potential (h) in cm/s, is the saturated hydraulic conductivity in cm/s, is equal to 1.175 × 10⁶, and, is equal to 4.74.
In the above two equations, the coefficient values (, , and A) were those suggested by Haverkamp et al. for granular materials based on infiltration experiments [22]. The residual and saturated volumetric water contents (0.034 and 0.27 cm3/cm3) and the saturated hydraulic conductivity (34.56 cm/day) of the base material were measured in the laboratory using the HPT tests. The saturated hydraulic conductivity of the subgrade of the unpaved road sections was measured using the laboratory rigid-wall compaction mold permeameter test in accordance with ASTM D5856 [24]. The measured saturated hydraulic conductivity of the subgrade is 1.8 × 10⁻⁸ cm/day, which can be considered impermeable relative to the surface aggregate material.
In the present numerical analysis, the rate of the simulated rainfall event was taken as 12.7 cm/h, which can be considered a violent rain event for the local weather conditions. This rainfall rate is less than the saturated hydraulic conductivity (Ksat) of the surface aggregate so surface runoff cannot occur. The rainfall duration was 30 min, and the total simulation time was 90 min. The rainfall direction is assumed to be perpendicular to the ground surface. The left side boundary condition is fixed at zero flux due to symmetry about the centerline of the road section; therefore water can only drain laterally to the bottom and the ditch side, which is open to the air. Two different bottom boundary conditions were prescribed to simulate the test sections with and without a geocomposite layer. For the section without the geocomposite, the natural subgrade (Table 2) was assumed to be impermeable due to the extremely low saturated hydraulic conductivity. For the test section with a geocomposite drainage layer, the hydraulic conductivity of the bottom boundary was updated after each time step of 0.25 s and set equal to the unsaturated hydraulic conductivity of the bottom layer of the surface material at the previous time step because the flow capacity of the geocomposite is much greater than that of the overlying surface aggregate. Therefore, the hydraulic conductivity of the bottom boundary (the geocomposite layer) is controlled by that of the surface course material.
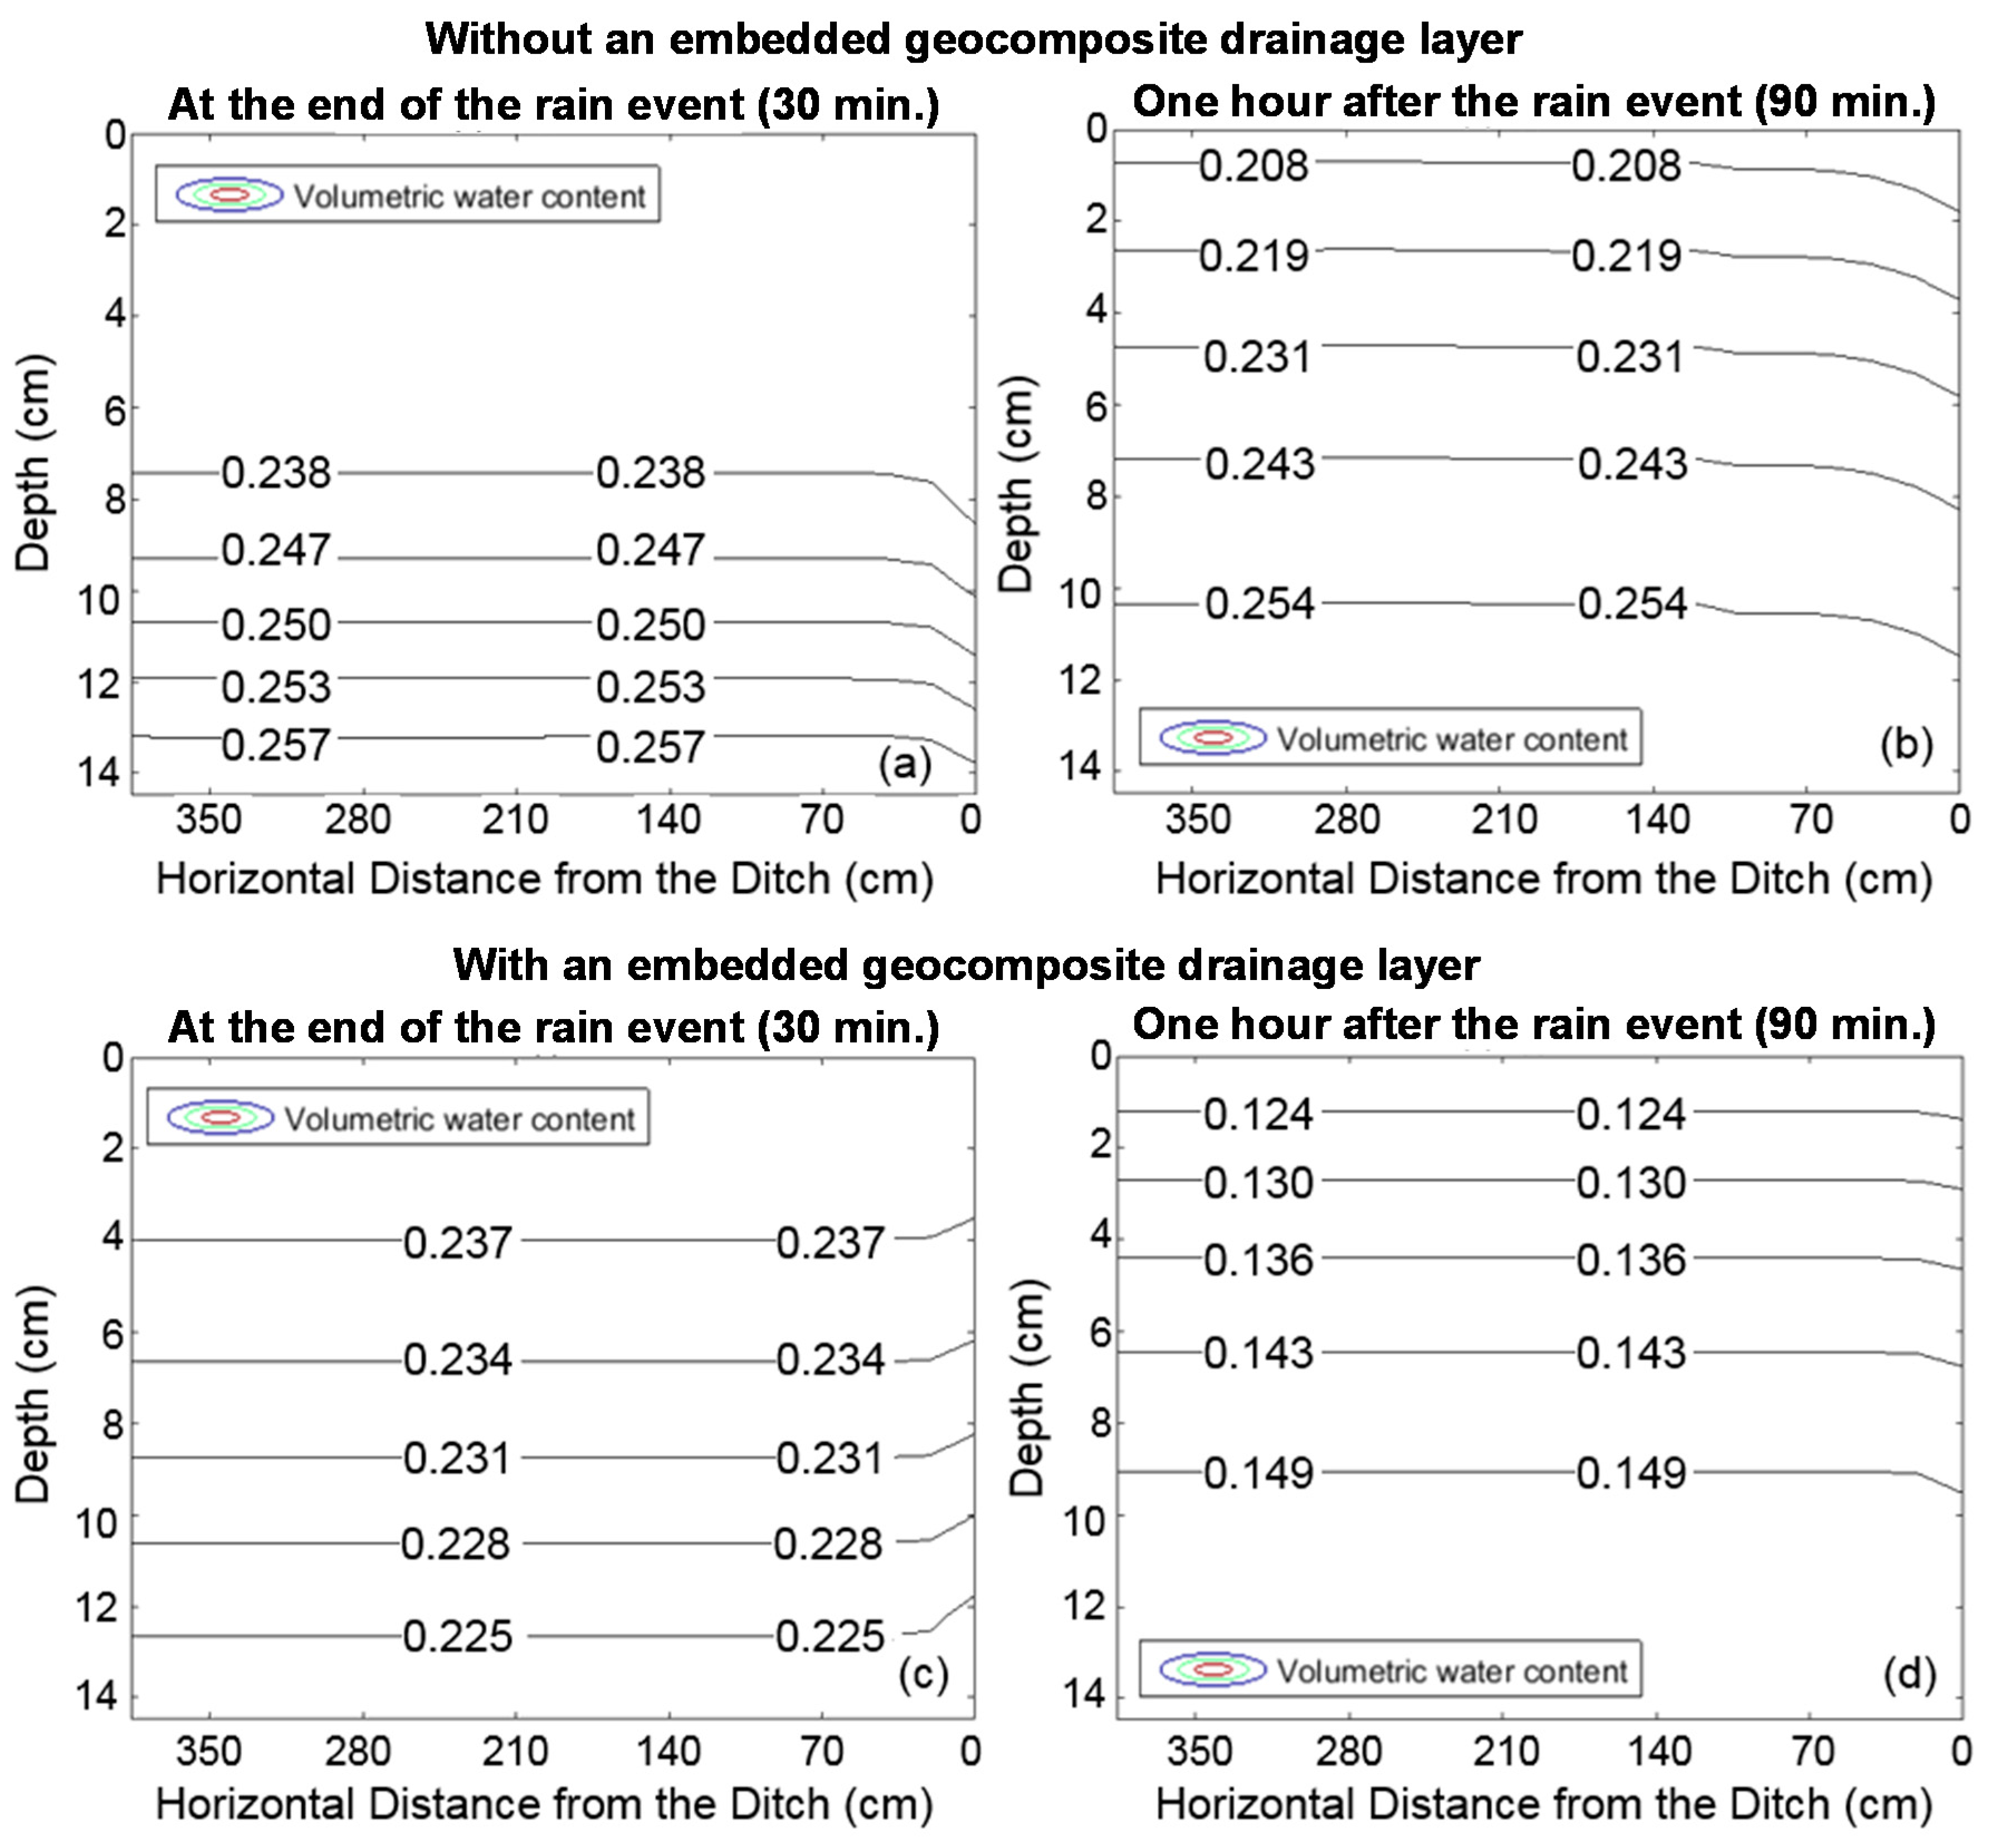
The numerical analysis results in terms of the 2D volumetric water content distributions of half of the roadway cross-section with and without the geocomposite layer are shown in Figure 10. At the end of the simulated rainfall event, the volumetric water content of the control section surface aggregate is close to the lab-measured saturated volumetric water content of 0.27 cm3/cm3 and increases with depth (Figure 9a). One hour after the rain stopped, the water content of the bottom layer remained relatively unchanged, as shown in Figure 10a,b, and the shoulder material was not significantly drier than the centerline material.
Compared to the control section with the 4% crown, the system with a geocomposite layer shows a slightly lower water content at the end of the rain event as shown in Figure 10c, but the water content is greatly reduced one hour after the rain stops (Figure 10d). For the particular rainfall event simulated, these comparisons clearly demonstrate that the 4% road crown cannot remove water from the unpaved road surface material as effectively as the geocomposite drainage layer, which significantly improves the subsurface drainage conditions and effectively prevents the unpaved road surface material from becoming saturated.
7. Summary and Conclusions
This study evaluated the influence of an embedded geocomposite drainage layer on the permeability and stiffness of both paved and unpaved roadway systems using laboratory tests, field tests, and numerical simulations. Both the paved and unpaved test sections constructed using two geocomposite materials were tested in Iowa, USA. A two-dimensional water infiltration model was developed to compare the drainage performance of the geocomposite drainage layer with the 4% roadway surface crown after a simulated heavy rain event. Based on the experimental and numerical analysis data, although limited, some conclusions can be drawn from this study.
For the PCC and WMA sections, the GC-1 geocomposite layer increased the horizontal and vertical saturated hydraulic conductivities by two to three orders of magnitude without significant changes in composite stiffness of the pavement systems. For the unpaved test section, the GC-2 geocomposite layer yielded a lower composite stiffness than the control section due to the relatively softer geonet core of the GC-2. However, the visual observations, field permeability test, and numerical analysis results indicate that the unpaved road section with a geocomposite drainage layer performs better than the control section after a heavy rainfall event and traffic loading, which is attributed to the geocomposite drainage layer rapidly draining water out of the system and effectively preventing the overlying surface material and top layer of subgrade from becoming saturated.
The field permeameter test results indicate that the drainage performance can be significantly influenced by the segregation of the traditional base material, but the geocomposite drainage layer can provide a more uniform subsurface drainage condition. The numerical analysis also showed that the current practice of using the 4% surface crown cannot remove water from the unpaved road surface material as effectively as the geocomposite drainage layer.
The initial construction costs of using the geocomposite for pavement systems might be considered high, but a breakeven cost analysis conducted for the unpaved road project showed that the geocomposite will begin to provide cost savings after 11 years relative to continuation of the current maintenance practices [25]. In addition, the better performance of the roadway system with a geocomposite layer can provide benefits beyond economic ones such as significantly improved ride quality.
Acknowledgments
The research projects were sponsored by the Iowa Department of Transportation and the Federal Highway Administration. The authors would like to thank the Hamilton County Secondary Roads Departments for assistance with constructing the test sections. The assistance of Yang Zhang, Jinhui Hu, and Ji Lu in performing the field tests is also greatly appreciated.
Author Contributions
David White, Pavana Vennapusa, Jeramy Ashlock, and Cheng Li conceived and designed the experiments; David White, Jeramy Ashlock, Pavana Vennapusa, and Cheng Li designed and supervised the constructions of the test sections. Cheng Li, Pavana Vennapusa and Jeramy Ashlock performed the experiments; Cheng Li, Pavana Vennapusa, and Jeramy Ashlock analyzed the data; David White and Pavana Vennapusa contributed materials and analysis tools; Cheng Li, Jeramy Ashlock, David White, and Pavana Vennapusa wrote the paper.
Conflicts of Interest
The authors declare no conflict of interest.
References
- Han, J. Design of Planar Geosynthetic-Improved Unpaved and Paved Roads. In First International Symposium on Pavement and Geotechnical Engineering for Transportation Infrastructure; Huang, B., Bowers, B.F., Mei, G.-X., Luo, S.-H., Zhang, Z., Eds.; American Society of Civil Engineers (ASCE): Nanchang, China, 2011; pp. 31–41. [Google Scholar]
- Holtz, R.D.; Christopher, B.R.; Berg, R.R. Geosynthetic design and construction guidelines. In Highway Capacity Manual: A Guide for Multimodal Mobility Analysis, 6th ed.; Federal Highway Administration, U.S. Department of Transportation: Washington, DC, USA, 2008; p. 592. [Google Scholar]
- Bahador, M.; Evans, T.M.; Gabr, M.A. Modeling effect of geocomposite drainage layers on moisture distribution and plastic deformation of road sections. J. Geotech. Geoenviron. Eng. 2013, 139, 1407–1418. [Google Scholar] [CrossRef]
- Christopher, B.R.; Hayden, S.A.; Zhao, A. Roadway base and subgrade geocomposite drainage layers. In The Symposium of ‘Testing and Performance of Geosynthetics in Subsurface Drainage; ASTM: Seattle, WA, USA, 2000; pp. 35–51. [Google Scholar]
- Henry, K.S.; Holtz, R.D. Geocomposite Capillary Barriers to Reduce Frost Heave in Soils. Can. Geotech. J. 2001, 38, 678–694. [Google Scholar] [CrossRef]
- Stormont, J.C.; Ramos, R.; Henry, K.S. Geocomposite Capillary Barrier Drain Systems with Fiberglass Transport Layer. Transp. Res. Rec. J. Transp. Res. Board 2001, 1772, 131–136. [Google Scholar] [CrossRef]
- Sweet, J.G. Vertical Stiffness Characterization of a Geocomposite Drainage Layer for PCC Highway Pavements. Master’s Thesis, West Virginia University, Morgantown, WV, USA, 2005. [Google Scholar]
- AASHTO. Geotextile Specification for Highway Applications. In Standard Specifications for Transportation Materials and Methods of Sampling and Testing, AASHTO M 288; American Association of State Highway and Transportation Officials: Washington, DC, USA, 2014. [Google Scholar]
- ASTM. Standard Test Method for Breaking Force and Elongation of Textile Fabrics (Strip Method). In Annual Book of ASTM Standards ASTM D5035-11; ASTM International: West Conshohocken, PA, USA, 2013. [Google Scholar]
- ASTM. Standard Test Methods for Water Permeability of Geotextiles by Permittivity. In Annual Book of ASTM Standards ASTM D4491-99; ASTM International: West Conshohocken, PA, USA, 2013. [Google Scholar]
- ASTM. Standard Test Methods for Determining Apparent Opening Size of a Geotextile. In Annual Book of ASTM Standards ASTM D4751-12; ASTM International: West Conshohocken, PA, USA, 2013. [Google Scholar]
- White, D.J.; Becker, P.; Vennapusa, P.K.; Dunn, M.J.; White, C.I. Assessing Soil Stiffness of Stabilized Pavement Foundations. Transp. Res. Rec. J. Transp. Res. 2013, 2335, 99–109. [Google Scholar] [CrossRef]
- White, D.J.; Vennapusa, P.K.; Becker, P.J.; Zhang, Y.; Dunn, M.J. Performance Assessment of Cement Stabilized, Polymer Fiber-Reinforced Pavement Foundation Layers. In Proceedings of the Geosynthetics Conference, Portland, OR, USA, 15–18 February 2015. [Google Scholar]
- Li, C.; Ashlock, J.C.; White, D.J.; Vennapusa, P. Mechanistic-based comparisons of stabilised base and granular surface layers of low-volume roads. Int. J. Pavement Eng. 2017. [Google Scholar] [CrossRef]
- ASTM. Standard Test Methods for Laboratory Compaction Characteristics of Soil Using Standard Effort (12,400 ft-lbf/ft3 (600 kN-m/m3)). In Annual Book of ASTM Standards ASTM D698-07; ASTM International: West Conshohocken, PA, USA, 2013. [Google Scholar]
- ASTM. Standard Test Method for Field Measurement of Hydraulic Conductivity Using Borehole Infiltration. In Annual Book of ASTM Standards ASTM D6391-11; ASTM International: West Conshohocken, PA, USA, 2013. [Google Scholar]
- Vennapusa, P.; White, D.J.; Jahren, C.T. In-Situ Permeability of Unbound Granular Bases Using the Air Permeameter Test. In Proceedings of the 85th Annual Transportation Research Board Conference, Washington, DC, USA, 22–26 January 2006. [Google Scholar]
- Zhang, J.; White, D.; Taylor, P.C.; Shi, C. A case study of evaluating joint performance in relation with subsurface permeability in cold weather region. Cold Reg. Sci. Technol. 2015, 110, 19–25. [Google Scholar] [CrossRef]
- White, D.J.; Vennapusa, P.K.R.; Suleiman, M.T.; Dahren, C.T. An in-situ device for rapid determination of permeability for granular bases. Geotech. Test. J. 2007, 30, 282–291. [Google Scholar]
- White, D.J.; Vennapusa, P.; Zhao, L. Verification and repeatability analysis for the in situ air permeameter test. Geotech. Test. J. 2014, 37, 365–376. [Google Scholar] [CrossRef]
- AASHTO. AASHTO Guide for Design of Pavement Structures; American Association of State Highway and Transportation Officials: Washington, DC, USA, 1993. [Google Scholar]
- Haverkamp, R.; Vauclin, M.; Touma, J.; Wierenga, P.J.; Vachaud, G. A Comparison of Numerical Simulation Models for One-Dimensional Infiltration. Soil Sci. Soc. Am. J. 1977, 41, 285–294. [Google Scholar] [CrossRef]
- Jury, W.A.; Horton, R. Soil Physics, 6th ed.; John Wiley & Sons: Hoboken, NJ, USA, 2004. [Google Scholar]
- ASTM. Standard Test Method for Measurement of Hydraulic Conductivity of Porous Material Using a Rigid-Wall, Compaction-Mold Permeameter. In Annual Book of ASTM Standards ASTM D5856-07; ASTM International: West Conshohocken, PA, USA, 2013. [Google Scholar]
- Li, C.; Ashlock, J.C.; White, D.J.; Vennapusa, P. Low-Cost Rural Surface Alternatives: Demonstration Project; Iowa Highway Research Board (IHRB) Project TR-664; Iowa State University: Ames, IA, USA, 2015. [Google Scholar]
Figure 1.
Photos of the (a,b) Roadrain RD-5 (GC-1) and (c,d) Macdrain W 1091 (GC-2) geocomposite materials placed beneath paved and unpaved surface courses, respectively.
Figure 1.
Photos of the (a,b) Roadrain RD-5 (GC-1) and (c,d) Macdrain W 1091 (GC-2) geocomposite materials placed beneath paved and unpaved surface courses, respectively.

Figure 2.
Nominal cross-section profiles (not to scale) of the (a) Portland cement concrete (PCC) paved; (b) warm-mixed asphalt (WMA) paved and (c) unpaved test sections.
Figure 2.
Nominal cross-section profiles (not to scale) of the (a) Portland cement concrete (PCC) paved; (b) warm-mixed asphalt (WMA) paved and (c) unpaved test sections.

Figure 3.
Photo of the large-scale horizontal permeameter test (HPT) device used in this study.
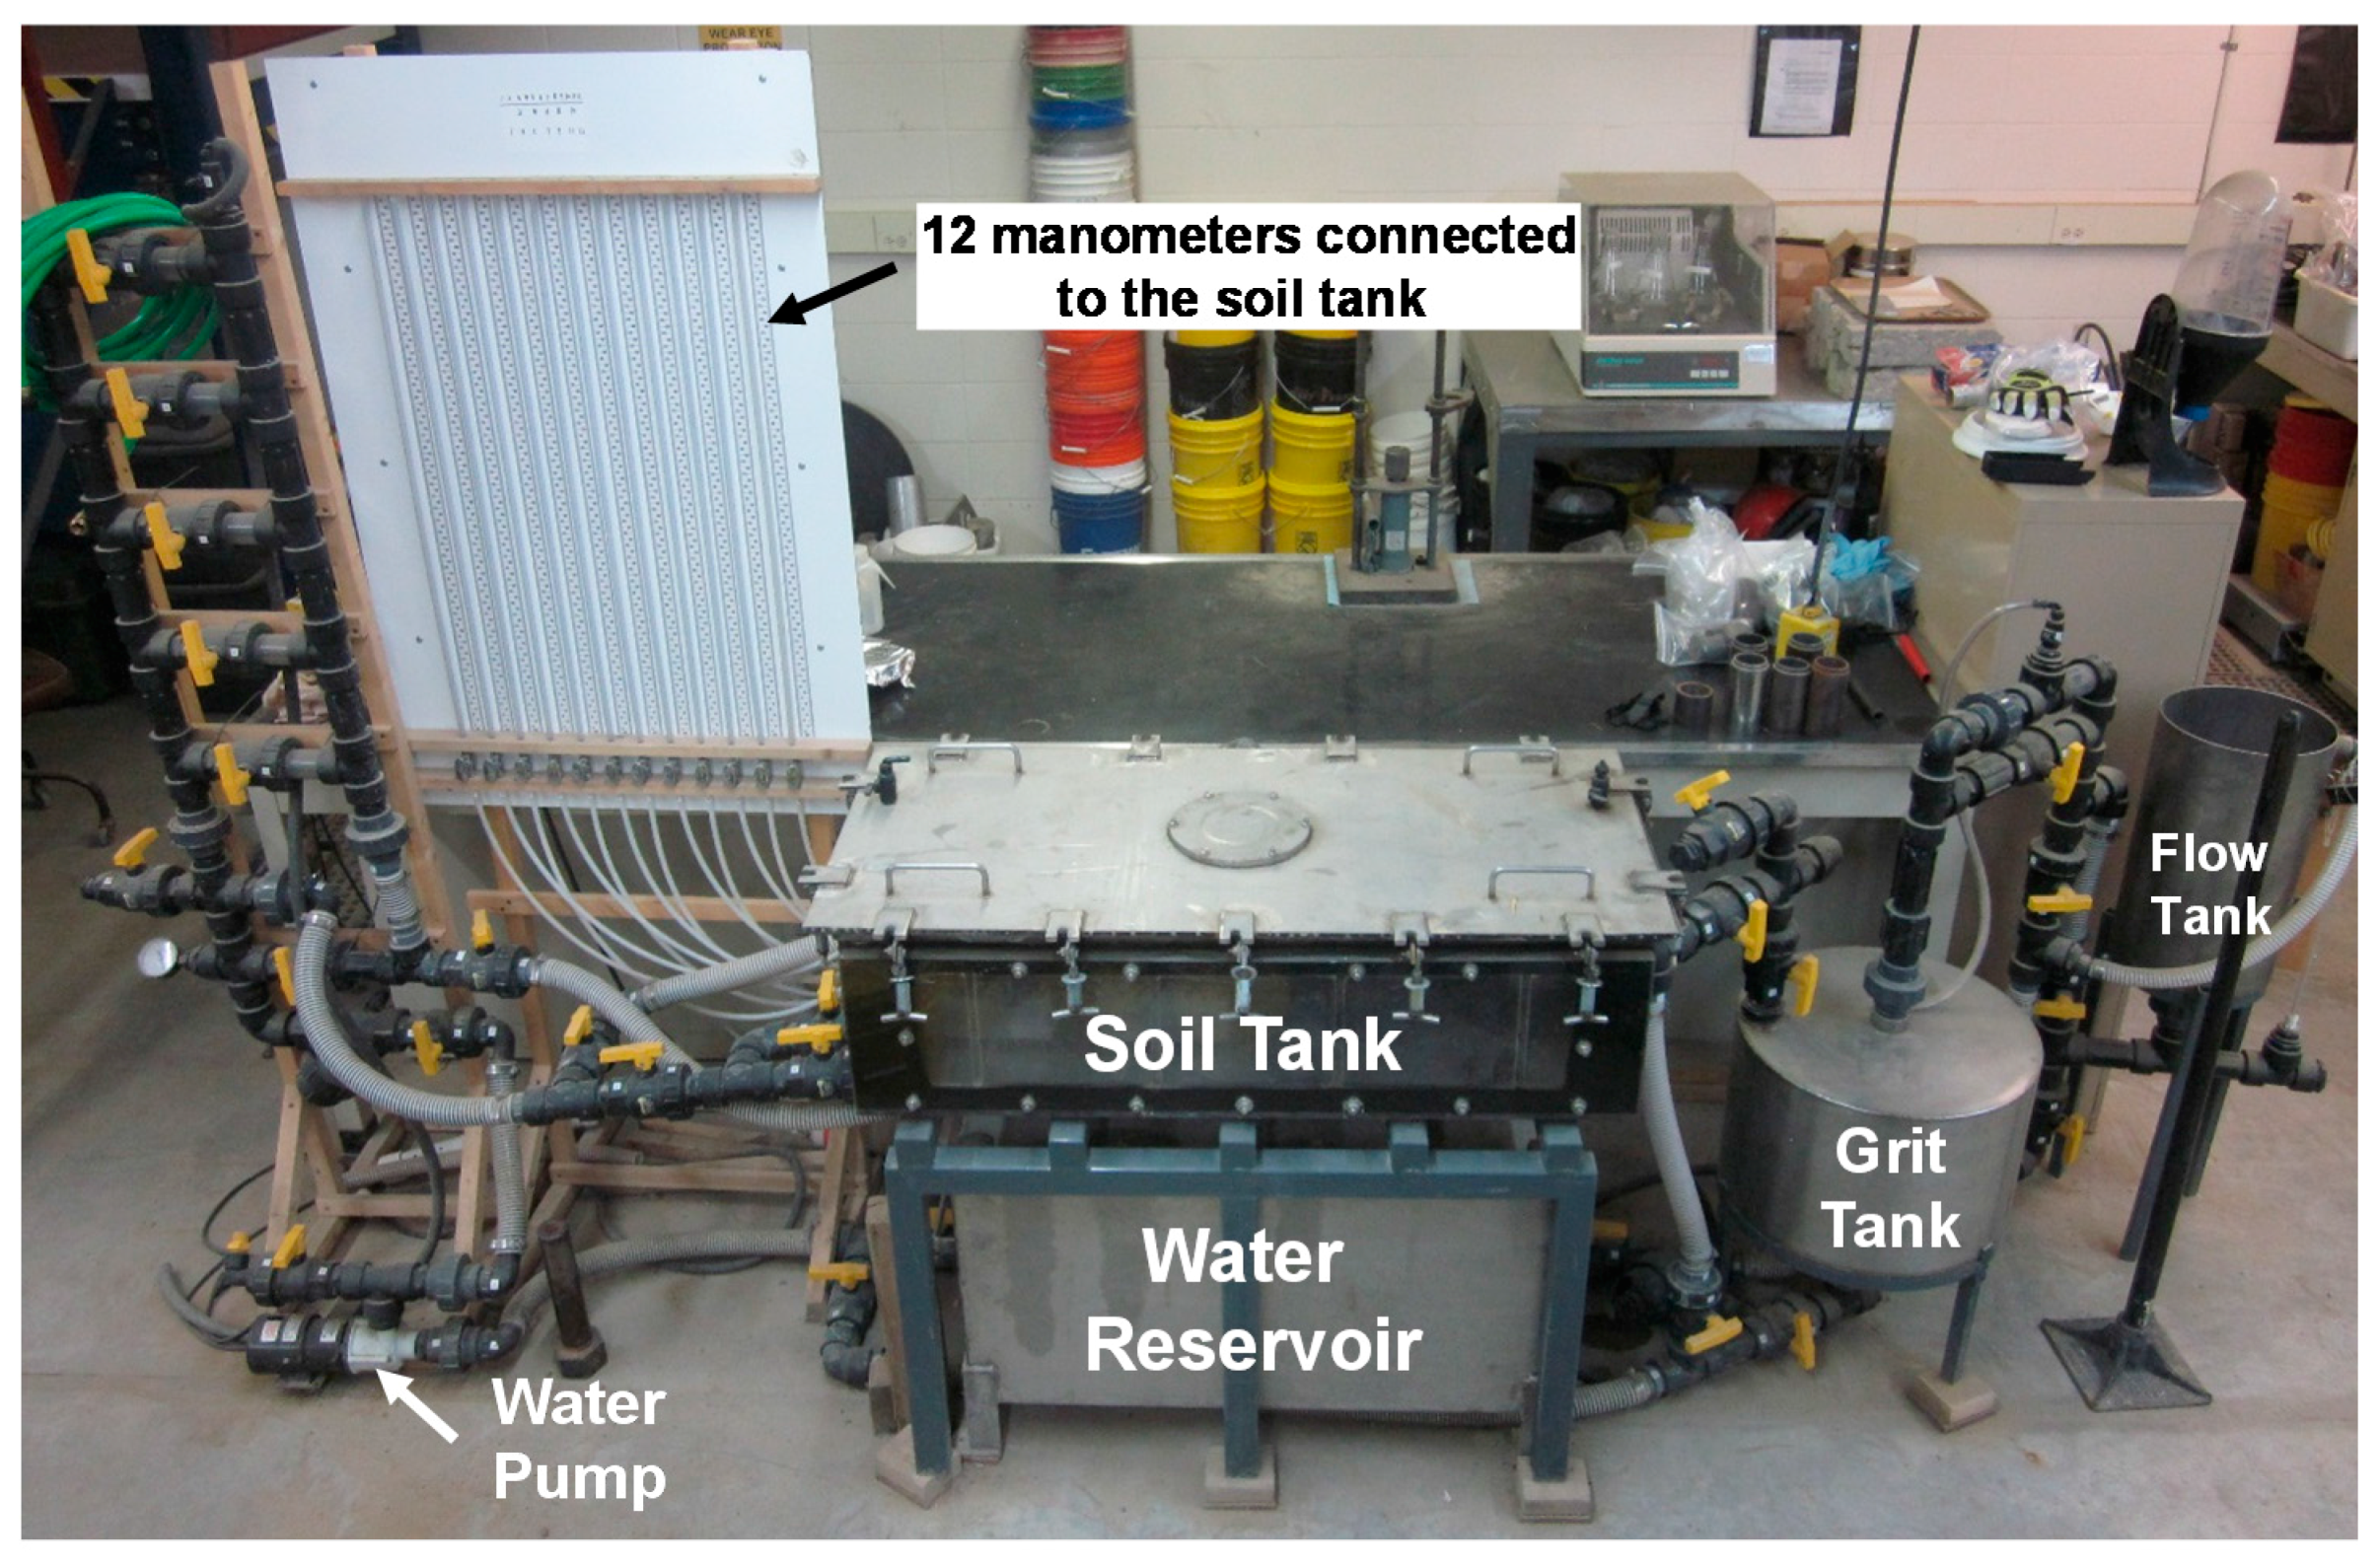
Figure 4.
Photos of (a) core-hole permeameter (CHP) device; (b) CHP test conducted on the paved test sections and (c) GC-1 material after the CHP test.
Figure 4.
Photos of (a) core-hole permeameter (CHP) device; (b) CHP test conducted on the paved test sections and (c) GC-1 material after the CHP test.
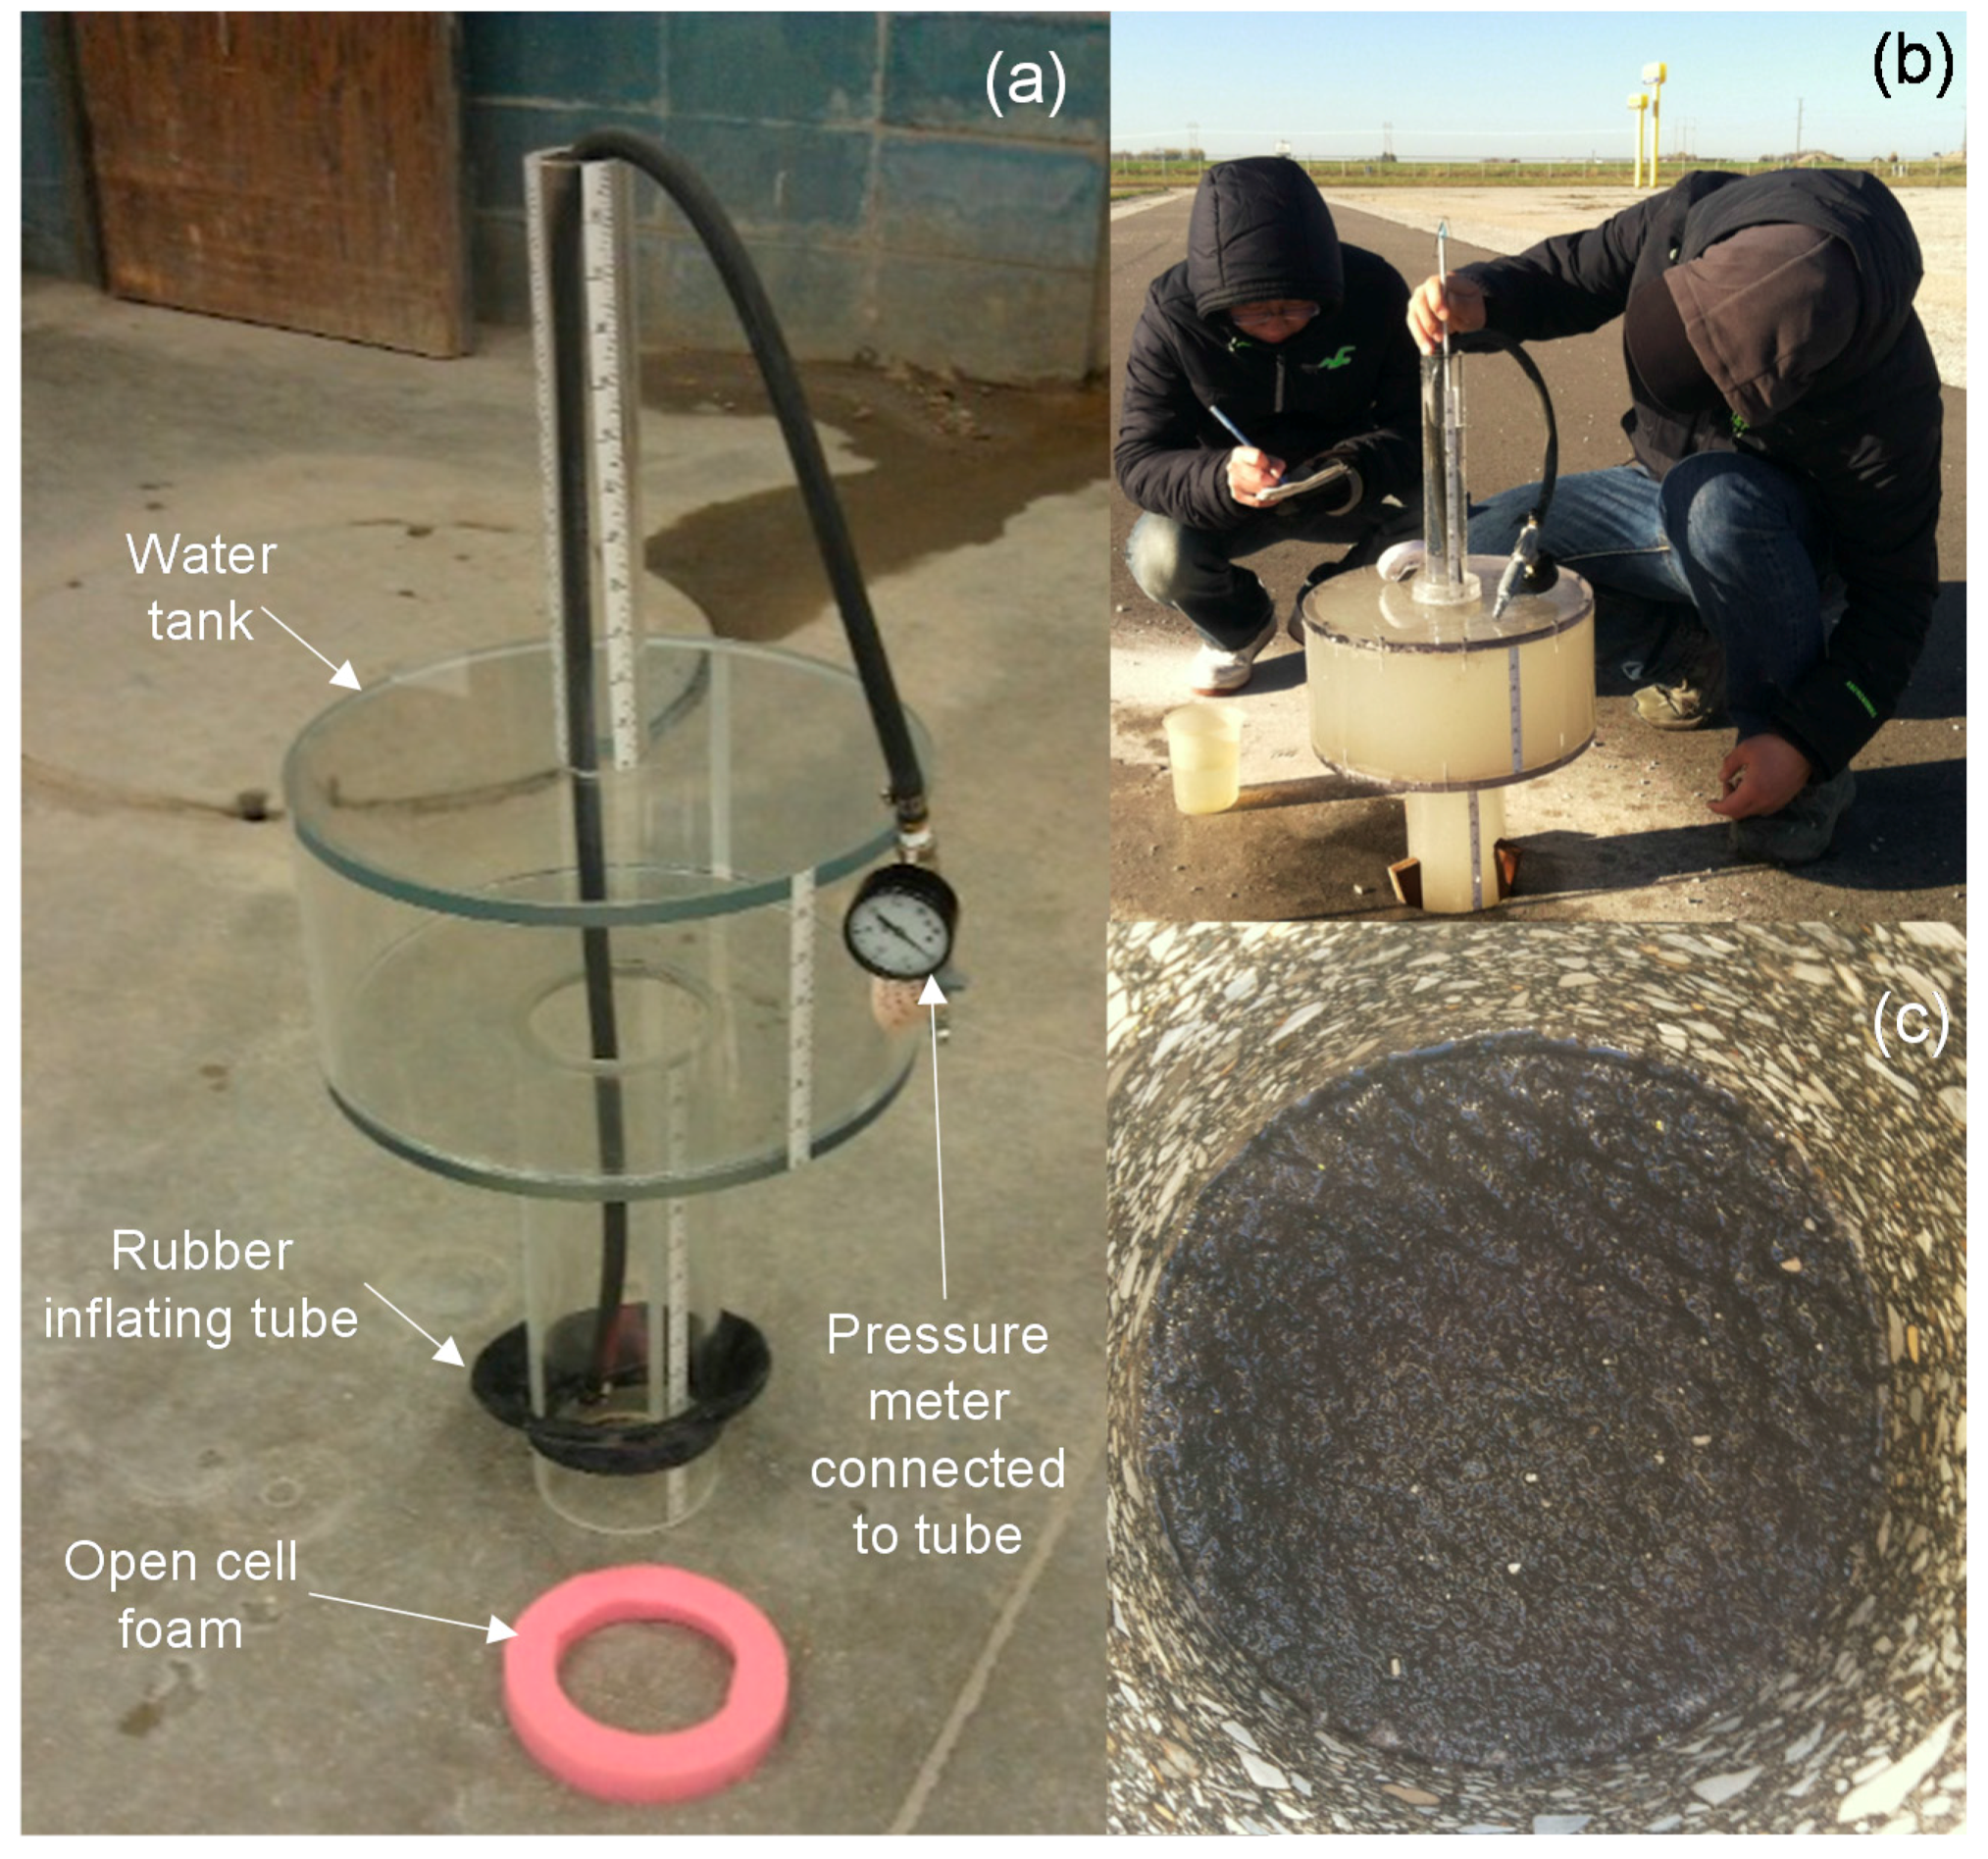
Figure 5.
(a) Air permeameter test (APT) test conducted on unpaved test section and (b) schematic showing the major components of the APT device [13].
Figure 5.
(a) Air permeameter test (APT) test conducted on unpaved test section and (b) schematic showing the major components of the APT device [13].

Figure 6.
Large-scale horizontal permeameter test (HPT) results of the specimens with and without an embedded geocomposite drainage layer.
Figure 6.
Large-scale horizontal permeameter test (HPT) results of the specimens with and without an embedded geocomposite drainage layer.
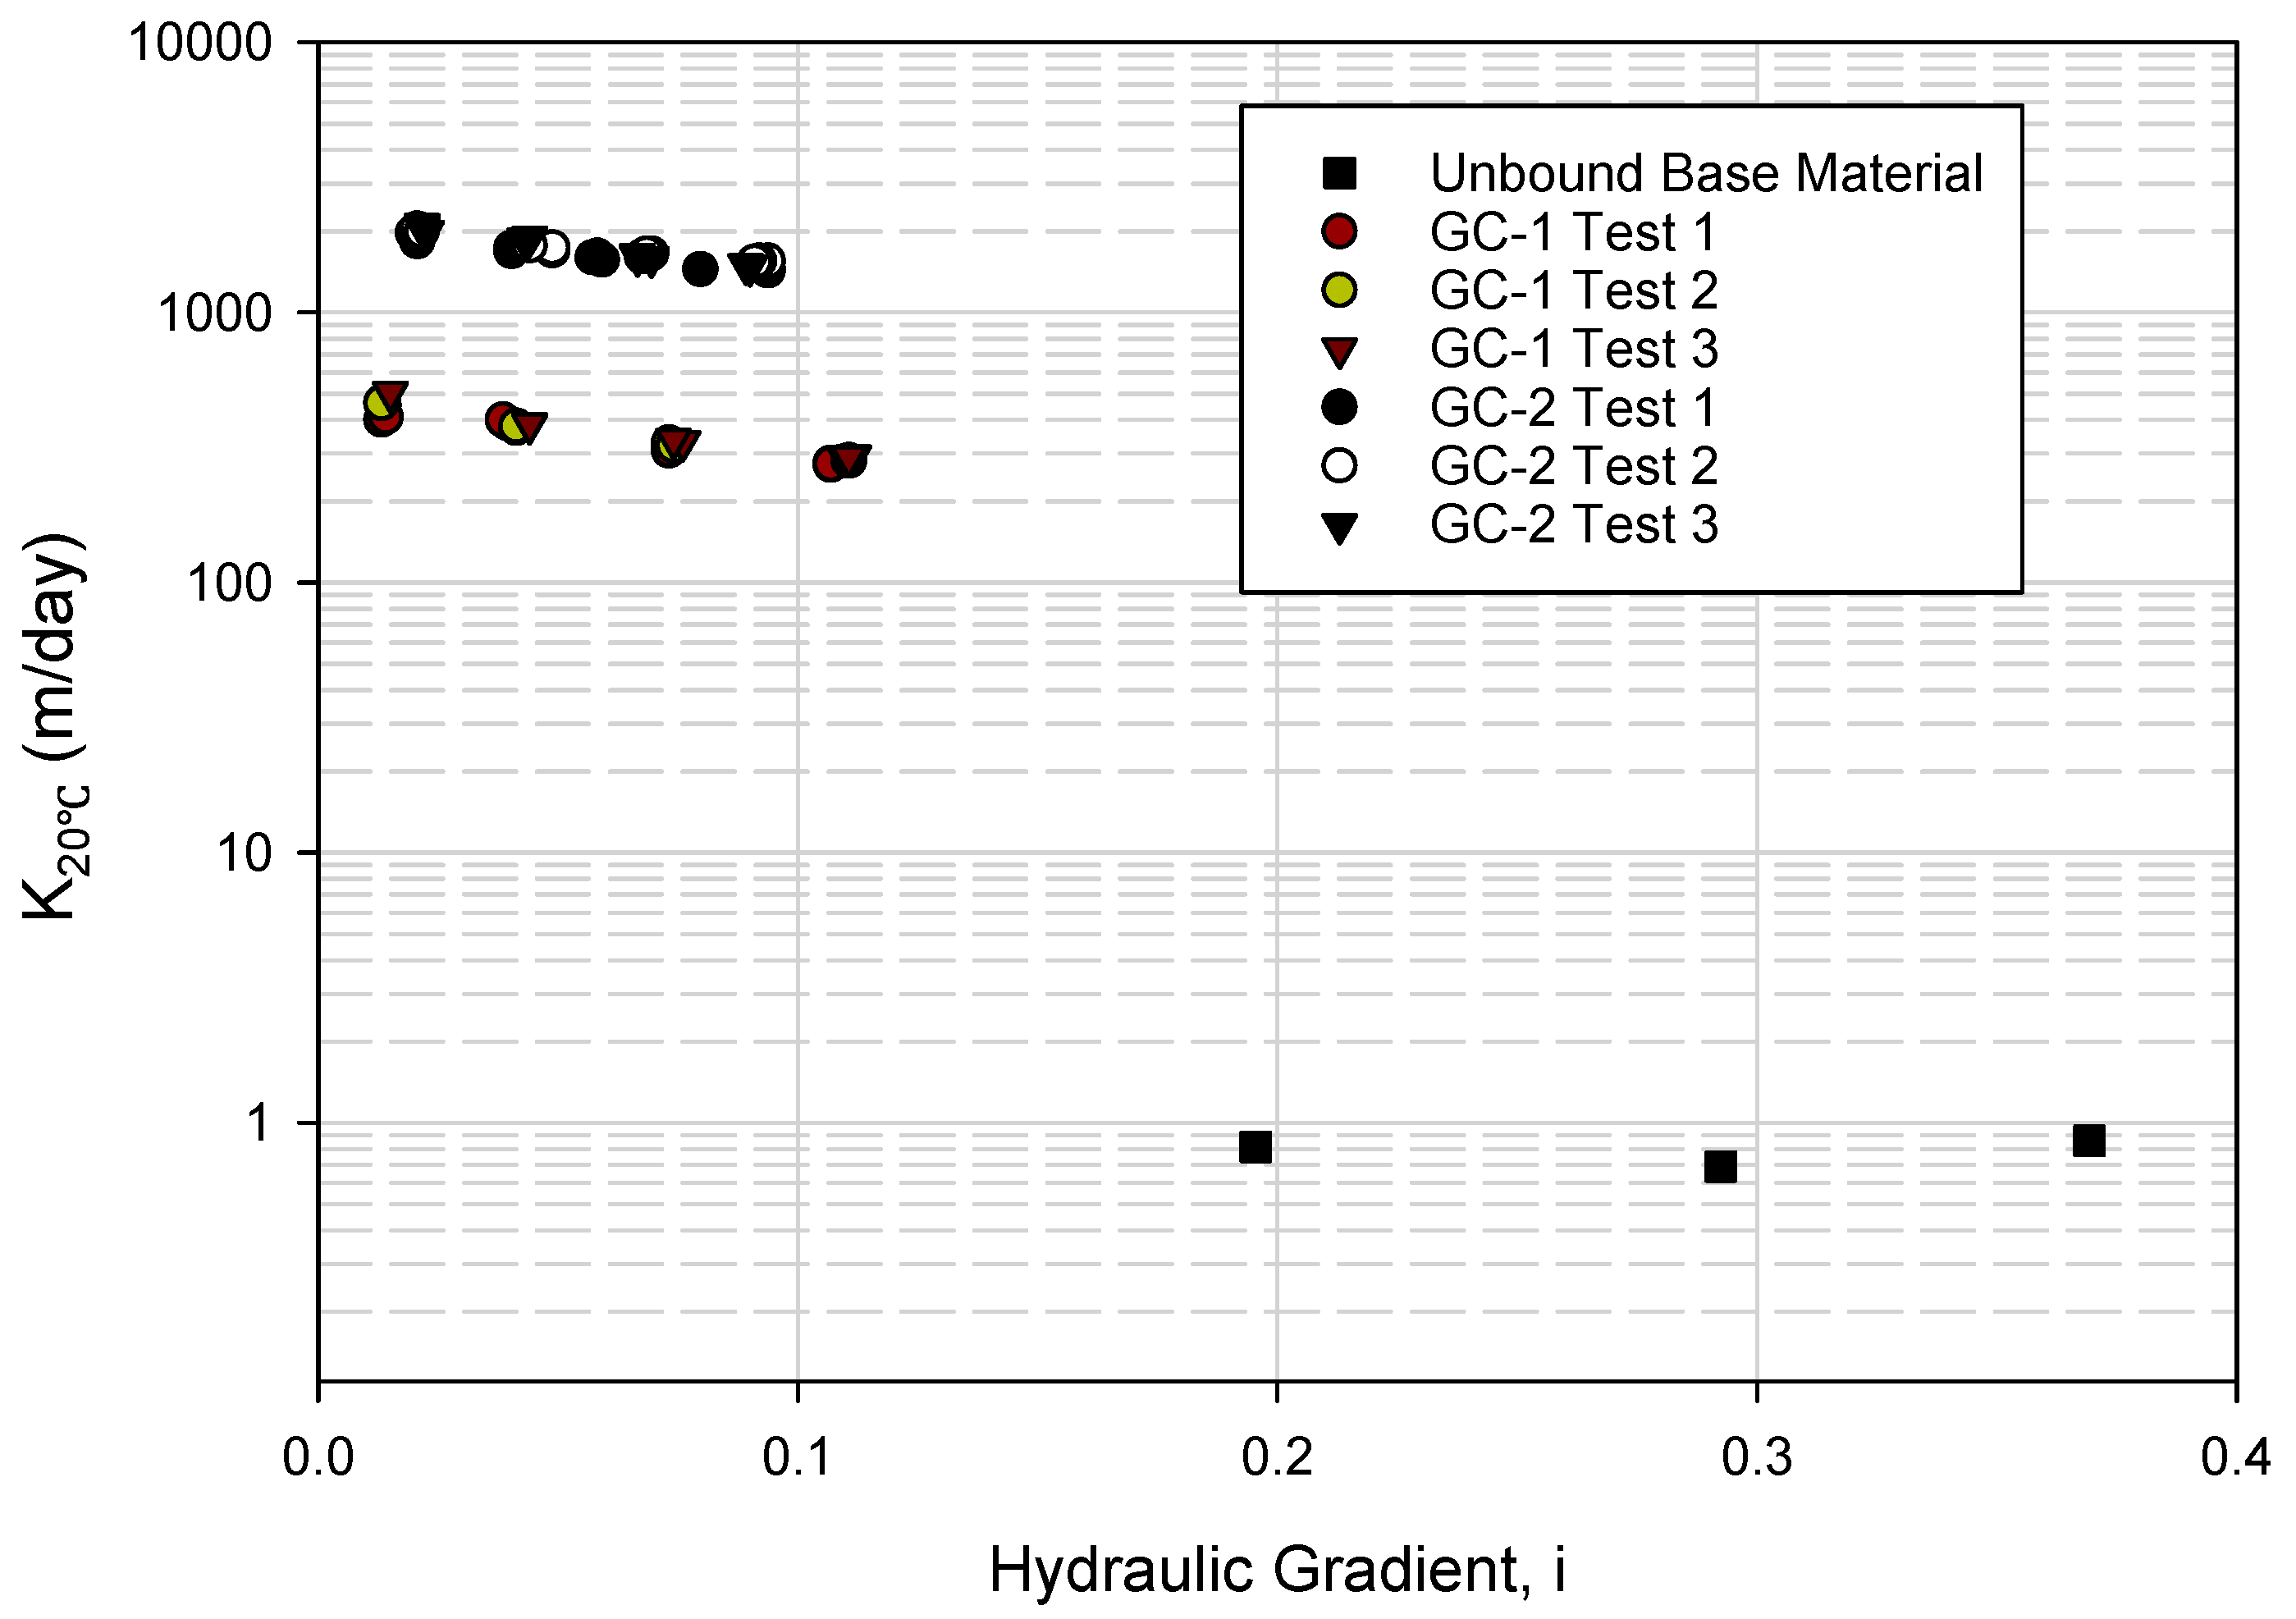
Figure 7.
APT-measured saturated hydraulic conductivity versus depth for the surface aggregate layers of the unpaved geocomposite and control sections.
Figure 7.
APT-measured saturated hydraulic conductivity versus depth for the surface aggregate layers of the unpaved geocomposite and control sections.

Figure 8.
Summary of the falling weight deflectometer (FWD) test results of the PCC-paved, WMA-paved, and unpaved sections.
Figure 8.
Summary of the falling weight deflectometer (FWD) test results of the PCC-paved, WMA-paved, and unpaved sections.

Figure 9.
Surface conditions of the unpaved road sections after a heavy rainfall (photos taken on 2 September 2015).
Figure 9.
Surface conditions of the unpaved road sections after a heavy rainfall (photos taken on 2 September 2015).
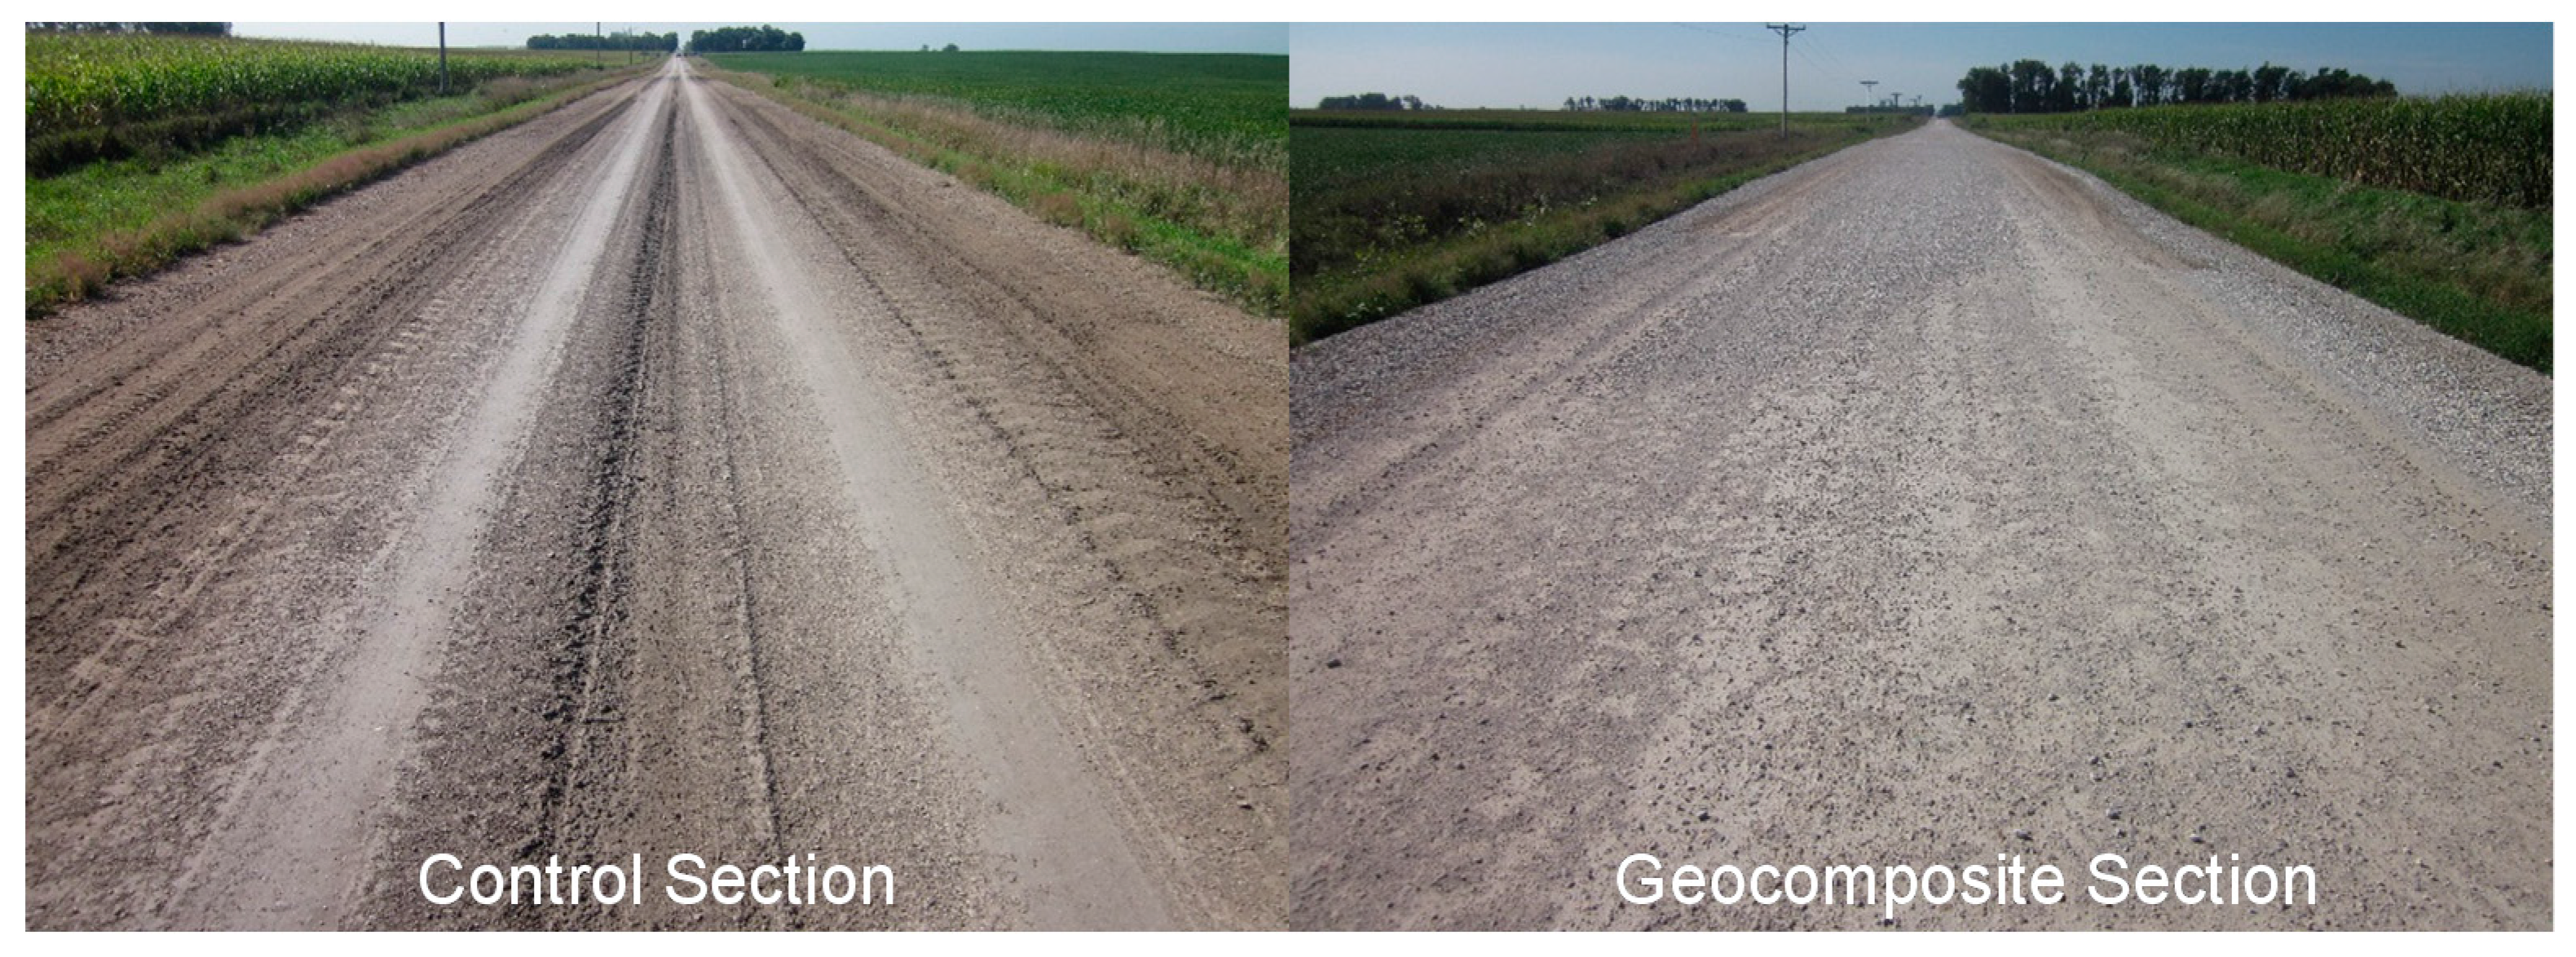
Figure 10.
Comparisons of volumetric water content distributions of unpaved road system (a,b) without and(c,d) with an embedded geocomposite drainage layer, (a,c) immediately and (b,d) one hour after the simulated rainfall event.
Figure 10.
Comparisons of volumetric water content distributions of unpaved road system (a,b) without and(c,d) with an embedded geocomposite drainage layer, (a,c) immediately and (b,d) one hour after the simulated rainfall event.

Table 1.
Properties of the GC-1 and GC-2 geocomposite materials.
| Property | GC-1 | GC-2 | Testing Method |
|---|---|---|---|
| Thickness (mm) | 11 | 9 | NA (used Calipers) |
| Strength (kN) | Exceeds Class 2 | 17 | AASHTO 2 M 288 [8] for GC-1 ASTM 3 D5035 [9] for GC-2 |
| Water Flow Rate (L/min/m2) | 4481 | 4100 | ASTM D 4491 [10] |
| AOS 1 of the Geotextile (mm) | 0.212 | 0.212 | ASTM D 4751 [11] |
1 AOS stands for apparent opening size; 2 AASHTO is the abbreviation of American Association of State Highway and Transportation Officials; 3 ASTM is the abbreviation of American Society for Testing and Materials.
Table 2.
Summary of the gradation, plasticity, and classifications of the geomaterials used in this study.
Table 2.
Summary of the gradation, plasticity, and classifications of the geomaterials used in this study.
| Parameter | Crushed Limestone Base | Subgrade of Paved Sections | Unpaved Road Surface Aggregate | Subgrade of Unpaved Sections |
|---|---|---|---|---|
| Gravel content (%) (>4.75 mm) | 65.2 | 5.3 | 57.9 | 0.9 |
| Sand content (%) (4.75–0.075 mm) | 27.7 | 39.7 | 30.3 | 39.8 |
| Silt content (%) (4.75–0.005 mm) | 3.9 | 29.3 | 9.2 | 30.6 |
| Clay content (%) (<0.005 mm) | 3.2 | 25.7 | 2.6 | 28.7 |
| D10 (mm) | 0.3 | – | 0.049 | – |
| D30 (mm) | 3.6 | 0.08 | 1.731 | 0.003 |
| D60 (mm) | 10.1 | 0.12 | 9.720 | 0.081 |
| Coefficient of uniformity, cu | 33.7 | – | 198.96 | – |
| Coefficient of curvature, cc | 4.36 | – | 6.31 | – |
| Liquid limit (%) | Non-plastic | 33 | Non-plastic | 43 |
| Plastic limit (%) | 15 | 22 | ||
| AASHTO classification | A-1-a | A-6(5) | A-1-a | A-7-6(10) |
| Unified soil classification system (USCS) group symbol | GP-GM | CL | GP-GM | CL |
| USCS group name | Poorly graded gravel with silt and sand | Sandy lean clay | Poorly graded gravel with silt and sand | Sandy lean clay |
© 2017 by the authors. Licensee MDPI, Basel, Switzerland. This article is an open access article distributed under the terms and conditions of the Creative Commons Attribution (CC BY) license (http://creativecommons.org/licenses/by/4.0/).
Share and Cite
MDPI and ACS Style
Li, C.; Ashlock, J.; White, D.; Vennapusa, P. Permeability and Stiffness Assessment of Paved and Unpaved Roads with Geocomposite Drainage Layers. Appl. Sci. 2017, 7, 718. https://doi.org/10.3390/app7070718
AMA Style
Li C, Ashlock J, White D, Vennapusa P. Permeability and Stiffness Assessment of Paved and Unpaved Roads with Geocomposite Drainage Layers. Applied Sciences. 2017; 7(7):718. https://doi.org/10.3390/app7070718
Chicago/Turabian StyleLi, Cheng, Jeramy Ashlock, David White, and Pavana Vennapusa. 2017. "Permeability and Stiffness Assessment of Paved and Unpaved Roads with Geocomposite Drainage Layers" Applied Sciences 7, no. 7: 718. https://doi.org/10.3390/app7070718
Note that from the first issue of 2016, this journal uses article numbers instead of page numbers. See further details here.