An Improved Distribution Policy with a Maintenance Aspect for an Urban Logistic Problem


1
Laboratoire de Génie Industriel, de Production et de Maintenance (LGIPM), Lorraine University, UFR MIM, 3 rue Augustin Fresnel, 57073 Metz, France
2
Laboratoire de Génie Industriel, de Production et de Maintenance (LGIPM), ICN Business School, 13 Rue Michel Ney, 54000 Nancy, France
*
Author to whom correspondence should be addressed.
Appl. Sci. 2017, 7(7), 703; https://doi.org/10.3390/app7070703
Submission received: 30 May 2017
/
Revised: 30 June 2017
/
Accepted: 5 July 2017
/
Published: 7 July 2017
Abstract
:In this paper, we present an improved distribution plan supporting an urban distribution center (UDC) to solve the last mile problem of urban freight. This is motivated by the need of UDCs to satisfy daily demand in time under a high service level in allocated urban areas. Moreover, these demands could not be satisfied in individual cases because the delivery rate can be less than daily demand and/or affected by random failure or maintenance actions of vehicles. The scope of our work is to focus on a UDC, which needs to satisfy demands in a finite horizon. To that end, we consider a distribution policy on two sequential plans, a distribution plan correlated to a maintenance plan using a subcontracting strategy with several potential urban distribution centers (UDCs) and performing preventive maintenance to ensure deliveries for their allocated urban area. The choice of subcontractor will depend on distance, environmental and availability criteria. In doing so, we define a mathematical model for searching the best distribution and maintenance plans using a subcontracting strategy. Moreover, we consider delay for the next periods with an expensive penalty. Finally, we present a numerical example illustrating the benefits of our approach.
1. Introduction
Organizations are facing considerable challenges dealing with performance, efficiency and economy. Dealing with that, they continuously improve their products and services to satisfy demands/customers, make a profit, use innovation, etc. Therefore, a collaboration becomes necessary to share activities, knowledge and services.
Moreover, cities should improve their flows in urban areas due to the growth of traffic jams. These generate congestion, noise and pollution problems. Urban logistics is defined as the management of all movements in urban areas [1]. The transport of goods in urban areas has continued to increase due to the increasing number of residents and the emergence of new types of deliveries (e.g., e-commerce, home delivery, etc.). Improving urban logistics becomes necessary to improve the life quality of residents, as well as the attractiveness of cities. For this reason, urban logistics has received growing attention in recent years in order to guarantee sustainability with collaborative models in modern cities [2].
Many attempts have been made to improve logistics flows in urban areas, particularly the urban distribution center (UDC) classified as city terminals. UDC, also known as the urban consolidation center (UCC), is a specialized logistic platform, which concerns deliveries in urban areas. Here, deliveries are consolidated before being shipped for last mile distribution. The objective is to optimize delivery itineraries, to pool resources, to reduce pollution and congestion [3,4,5]. Consequently, the work of these UDCs depends on the functioning of their components such as vehicles, software systems, etc. However, a failure of one component may reduce the delivery rate of these platforms.
UDC has been created in many European capitals and cities. The success and benefits of UDCs depend on the following factors and their features: customers (location, parking availability, etc.), transportation (means of transportation, availability, number of drivers, number of deliveries, availability of depots, etc.), UDC (location, size, capacity, type of vehicle, etc.) and urban areas (size, traffic, type of street, etc.) [6]. However, these UDCs present some of disadvantages such as high operational cost, difficulties in managing the wide range of goods being moved and the loss of a direct relationship between suppliers and customers [7].
We have used this solution in a research study conducted within a collaboration between Metz city through the Metz Metropole development agency and our research laboratory in France to make sure that Metz city will play a key role in sustainable development [8]. We ran a three years’ project in order to minimize congestion in the city; to improve the quality of life for residents; and to minimize pollution generated by the transport of goods. At the first stage, we mainly focused on optimizing goods delivery by presenting a diagnosis of the current state and, then, proposing a solution for the creation of a new urban distribution center; this solution has been analyzed by our tool simulator [9]. However, the first results and the development are constrained by the scenario context where data and variables are predefined. A second iteration of this case study will focus on this dynamic aspect in order to foster UDCs’ collaboration. Therefore, we investigate the variability of the capacity due to non-availability or the degradation of the system. This is due to a lack of staff during vacation, random failures, planned preventive maintenance actions, etc.
In this paper, we believe that a good coordination between maintenance and distribution policies will deal with this issue by defining good planning for UDC to organize distributions and maintenance actions. Furthermore, a collaboration between different UDCs located near the allocated urban area can be more efficient to satisfy customers in urban areas in time. This collaboration is necessary due to the growing urban population. For example, around 70% of the population in Europe will live in urban areas in 2050 [10]. This growth will increase the number of deliveries; which current resources will not be able to satisfy. For instance, UDCs facing problems with their delivery capacity will communicate and coordinate with other UDCs. The concerned UDC can coordinate with different UDCs in order to minimize delayed products. Delayed products are products delivered with a delay. This can happen when the demand exceeds the sum of the available capacity of the concerned UDC and the available capacity of the UDC to supply. The delivery rate can be affected by maintenance operations. This idea is inspired by the work of Hajej el al. [11] where the authors presented an integrate production/maintenance/transportation plan with the strategy of switching and collaboration between several productions sites in order to satisfy random demands with a high service level.
Regarding maintenance policy, Hajej et al. combined production and maintenance plans for the manufacturing system in order to satisfy random demand with a high service level [12]. In this case, the failure of the manufacturing system depends on the time and the production rate. Moreover, Dellagi et al. [13] integrated the possibility to use a subcontractor in the case of maintenance actions for the manufacturing system in order to satisfy demand. Furthermore, Dellagi et al. [14] have extended their work by developing a joint maintenance and production policy for a manufacturing system that can call several subcontractor machines.
In this paper, we will study the problem of an efficient distribution and maintenance policy based on two sequential plans, a distribution plan correlated to a maintenance plan, for an urban distribution center (UDC) using the subcontracting strategy. This work consists of integrating a collaborative approach to allow making a call if needed to other UDCs from different potential possibilities to satisfy customers’ demands with a high service level. We aim to find the best distribution, maintenance plan and subcontractor plan to minimize the total cost. The choice of UDC subcontractor will depend on two criteria: (1) the distance between the platform and the urban area and (2) the impact on the environment. The total cost is defined as the sum of the transportation cost, maintenance cost and subcontracting cost.
The paper is structured as follows. Section 2 introduces the problem statement. Section 3 presents the mathematical model for searching for the best production and maintenance plans using the subcontracting strategy. In Section 4 we present a numerical example illustrating the benefits of our approach. Finally, we conclude and discuss future direction in Section 5.
2. Problem Statement
The paper’s scope is about distribution scheduling and the maintenance plan for an urban distribution center (UDC) within a collaboration framework of cross delivery sites. Here, the UDC has to meet daily demand in time of each customer in an allocated urban area during a finite distribution horizon. We assume that there is one kind of product, that the customer’s demand is known in advance in each period t and that it can exceed the delivery rate of the UDC.
Collaboration takes place when the concerned UDC cannot satisfy the total or a part of the demand in period t. This may happen when the distribution rate is insufficient or during a preventive or corrective maintenance period. The UDC is subject to random failures, repairs and maintenance activities. Therefore, it will call a subcontractor. The subcontractor can be among N possibilities of UDCs. Each potential UDC is identified by two costs: transportation and environment. A penalty can be paid if the demand exceeds the sum of the capacity of the main UDC and the UDC to contract out.
2.1. Context and Motivation
We are particularly interested in the UDC problematics and its alternatives based on our experience with an urban freight scenario in a French city [9]. The city center of Metz has a pedestrian shopping zone (more than 500 stores). Stores are recipients of commercial deliveries, which require a large number of daily deliveries. To that end, we run a three years’ project to minimize traffic congestion, improve the quality of life for residents and minimize pollution generated by goods delivery. We have analyzed the deployment of these platforms as a solution for delivery problems. We then proposed a delivery solution for the Metz pedestrian area while considering economic, environmental and societal improvements. The solution has implemented UDCs supporting decision-making processes, while considering the number of UDCs, the volume and the number of vehicles. Moreover, the simulation has generated benefits for reducing CO2 emission, reducing congestion and regulating delivery traffic, which received the project partners’ approval.
Nevertheless, these results are based on pre-defined data with the assumption of constant availability of UDCs. A major concern has motivated this research. In this paper, we focus on the dynamic aspect, dealing with unavailability due to maintenance actions, personnel vacations, accidents, etc. We propose collaboration among UDCs in order to fulfil their services. Our idea is based on a mathematical model and validated by an illustrative example.
In order to formulate the mathematical model, we introduce the following notations.
2.2. Parameters
We are given a planning horizon-partitioned equally into H periods. Every period is denoted by t, t = {1, 2, ..., H}. The following parameters are used in the mathematical formulation of the model.
- : number of potential UDCs to subcontract
- : number of periods
- : cost of transportation for one product
- : cost to contract the distribution of one product out to UDCi.
- : cost of pollution generated by contracting one product out to UDCi.
- : cost of one product delayed
- : maximal number of products to be delivered by platform i in each period t
- : demand in each period
- : maximum capacity that can be delivered by the main platform
- : the sum of the demand and the delayed products.
- : the amount of decreased capacity due to a preventive maintenance action
- : the amount of decreased capacity due to a corrective maintenance action
- : preventive maintenance cost
- : corrective maintenance cost
- : the failure rate
- : the length of distribution period
- : the nominal failure rate
- mu: monetary unit
Decision variables:
- : quantity transported in each period
- : quantity of products subcontracted to platform i in each period t
- : quantity of products delayed in each period t
- : allocated platform i in each period t
- : optimal number of preventive maintenance actions
- T: the optimal period of intervention
- : the excepted number of failures
2.3. Problem Formulation
The idea is to define a distribution and maintenance plan for an urban distribution center (UDC) taking into account the possibility to call the most advantageous UDC. Therefore, the satisfaction of the demand can be made by the concerned UDC and/or by another UDC. The concerned platform has a maximal capacity for the delivery rate. It can be affected by the maintenance action and will be equal to in each period.
We identify the amount of deliveries transported from the concerned UDC and the amount of deliveries supplied by the subcontractor i in each period t. Here, cannot exceed the available capacity of UDCi. The cost to transport one product for the concerned UDC to the allocated urban area is . The cost of subcontracting one product to each UDC I is ; it depends on the distance between the subcontractor and the urban area.
A delayed delivery can be considered if the demand exceeds the capacity of the concerned UDC and the capacity of the UDC to supply. This quantity must be satisfied the next period, and the penalty will be paid for each delayed product. Therefore, the demand in each period will be updated by adding the delayed quantity and will be equal to .
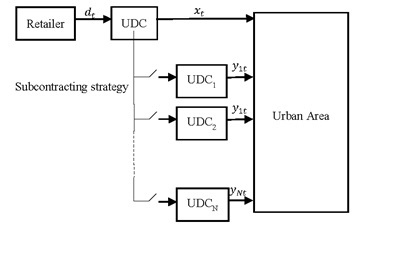
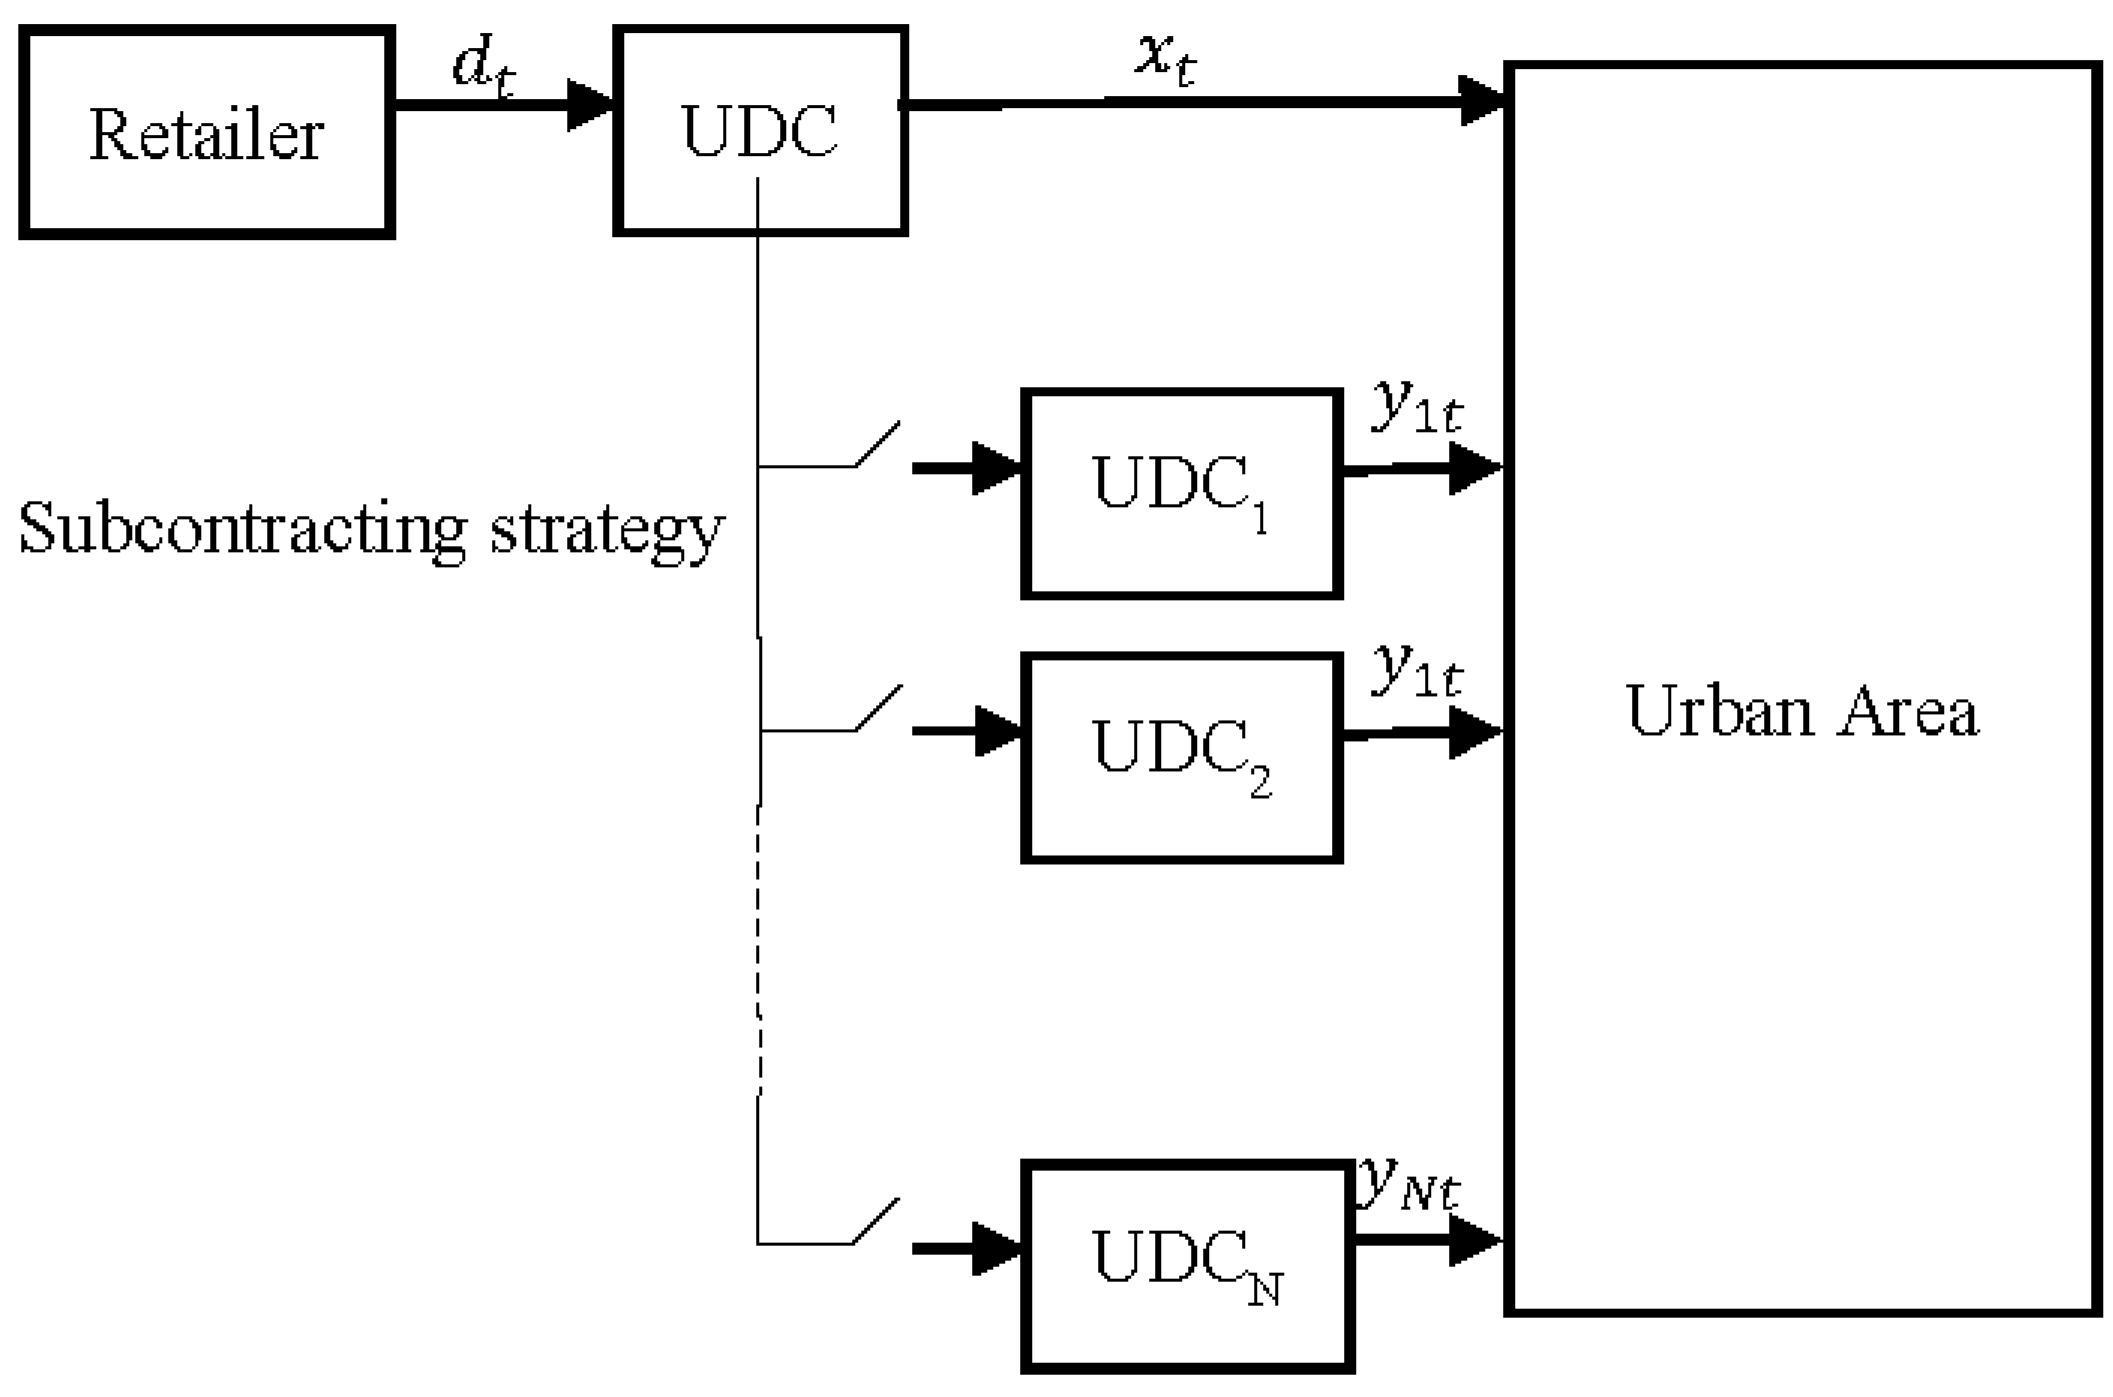
Our model takes into account that the concerned UDC has a randomly failure (the distribution system). A periodic preventive maintenance is performed, and a minimal repair is carried out for each failure. The goal here is to identify the number of preventive maintenance actions P during horizon H. The degradation is correlated with the delivery rate and time. Figure 1 illustrates the structure of the proposed approach.
3. Mathematical Model
3.1. Mathematical Model of Transportation with the Subcontracting Strategy
The idea is to minimize the cost of distribution, subcontracting and delay over a finite time horizon [0, H]. In each period, there are three scenarios. The first one stipulates that the concerned UDC can assume all deliveries. For the second scenario, the UDC cannot satisfy the total demand and will call at least one UDC to complete what is missing. The final scenario is that the available capacity of the main UDC and the subcontractor UDC cannot satisfy the total demand, and a part of the demand will be delayed. In this case, the choice of UDC depends on the available capacity; the cost of subcontracting based on the distance between two UDCs; and the environmental impact. The purpose of the subcontracting strategy is to satisfy the demands of customers in time and to avoid penalties. If a part of the demand cannot be satisfied in period t, it must be rescheduled for the next period and pay penalties. We suppose that penalties are more expensive than the subcontracting cost of each UDC (with ). We assume that the distribution system has knowledge of the nominal capacity of delivery by . This capacity will be reduced according to maintenance operations (corrective maintenance and/or preventive maintenance).
The expression of the total cost of transportation, the cost of subcontracting (transportation and environmental cost) and the cost delay is expressed as follows:
The following constraint defines that the quantity delivered by the concerned UDC to the allocated urban area in period t cannot exceed the nominal available capacity of delivery in each period t, and it must be positive.
The quantity of subcontracted quantity for UDC i in period t cannot exceed a certain availability rate given by UDC i in period t.
The following equation defines the value of delayed quantity as the difference between the updated demand and the amount of products delivered by the main UDC and the subcontractor UDC.
This equation gives the value of refreshed demand in period t + 1 as the sum between the demand in period t + 1 and the delayed product in the previous period.
The following constraint defines that the main UDC can subcontract their deliveries with many other UDC at most L UDC in each period t.
This equation defines binary variables.
This equation defines integer variables
3.2. Maintenance Cost
The concerned urban distribution center system (UDC) is subject to random failures, repair actions and maintenance activities. The strategy adopted for maintenance here is the preventive maintenance policy with minimal repair at failure. Therefore, a perfect preventive maintenance action (overhaul) is performed P times periodically at times , restores the degradation impact and makes the system as good as new (AGAN) at each j. T (j = 1, 2, …, P). When the site fails between successive perfect maintenance, a minimal repair is performed. It restores the system to the same state before failure (As Bad As Old). We assume that preventive maintenance and minimal repair durations are negligible. The correlation of the distribution plan and the system degradation is presented with an increase of the failure rate as a function of time, transportation and deliveries [15,16,17].
Each maintenance action (preventive and/or corrective actions) consumes a part of the capacity for the delivery rate of the concerned UDC. Therefore, the preventive maintenance and corrective maintenance consumes respectively Lp = a × Cmax and Lr = b × Cmax [18].
The idea is to develop an optimal maintenance strategy that considers the UDC’s degradation according to the distribution plan. It consists of determining the optimal number P* of preventive maintenance actions during the finite distribution horizon. In order to know the best time intervals when a preventive maintenance action must be carried out, it is important to minimize the total cost of maintenance.
The analytical expression of the total maintenance cost for the concerned UDC is expressed as follows:
where corresponds to the average number of failures that occur during the horizon H, considering the distribution rate in each period.
In this part, we are inspired by the work of Hajej et al. [12], where the failure rate in each interval k is formulated as follows:
with , and is the nominal failure rate corresponding to the failure of the concerned UDC with its maximal delivery rate during the distribution horizon.
The average number of failures over the horizon H× ∆t using the failure rate can be presented as follows:
Therefore, the total cost of maintenance strategy is expressed as follows:
As discussed previously, the maintenance actions (corrective and/or preventive maintenance) will affect the maximum available capacity for the delivery rate of the UDC. Let P the number of preventive maintenance actions where P is equal to H/T* with T* = k × Δt. Therefore, the following expression formulates the available capacity for the delivery rate in each period:
If the preventive maintenance takes place in period t, the capacity for the delivery rate is expressed as follows:
In an additional case, the capacity Ct is given by:
4. Numerical Example
In order to define the best distribution plan using the subcontracting strategy and the optimal maintenance plan, the following steps have to be carried out:
- Step 1.
- This consists of resolving the mathematical model of transportation using subcontracting strategy without taking into account the maintenance operations, namely the UDC delivers with the maximum capacity. To that end, we use the mixed integer solver FICO Xpress 8.0 (FICO, San Jose, CA, USA).
- Step 2.
- This consists of defining the optimal maintenance plan according to the distribution plan given by Step 1 by determining the optimal number of preventive maintenance actions and then determining the available capacities in each period. Therefore, we use the mathematical symbolic computation MATHEMATICA (11.1.1, Wolfram Research, Oxfordshire, UK).
- Step 3.
- This uses the results from Step 2 to incorporate these available capacities in our previous model in order to determine the new distribution plan. To do that, we use the same solver, FICO Xpress 8.0.
4.1. Step 1: Transportation with the Subcontracting Strategy Plan
We consider a UDC system, which has to satisfy customer demand in an urban area in time. Demands of the allocated urban area are depicted in the following Table 1. The unit deliver cost per product equals 10 mu. At this stage, we suppose that this UDC works with the maximal capacity, called Cmax = 20. The number of periods H is equal to 10 days.
Concerning the subcontracting strategy, there are three other UDCs available to complement the service if needed. The available capacity of deliveries for each of them is presented in Table 2, Table 3 and Table 4.
Table 5 presents the unit service cost and unit emission cost generated by each product delivered by UDCi.
For no delivery of the product, the penalty cost equals 50 mu. Here, you can see, as well, that the product not delivered in time costs more than the subcontractor cost.
We notice that our mathematical model contains binary and integer variables presenting quadratic terms, the so-called quadratic program (QP). These quadratic terms appear on the objective functions and constraints.
We present some modifications of our mathematical model to linearize these quadratic terms in order to make our model a particular linear programming (LP). Then, we solve our new model using the solver FICO Xpress 8.0.
We do a reformulation of the following quadratic terms by using binary integer linearization techniques. The quadratic terms in our models are the product of binary and integer variables. In our case, the integer variables are bounded.
We find in the following equations the quadratic terms, shown in blue:
is a binary variable, and is an integer and bounded.
Then, we introduce a new variable, .
Furthermore, we add other valid inequalities to our model as follows:
The new problem is applied to the model, which makes it as a linear programming that is easy to solve. The results are presented in Table 6 using the Solver FICO Xpress 8.0. The solver found a four-integer solution. The best integer solution has a total cost for the optimal distribution plan equal to 3047 mu.S
4.2. Step 2: Maintenance Strategy
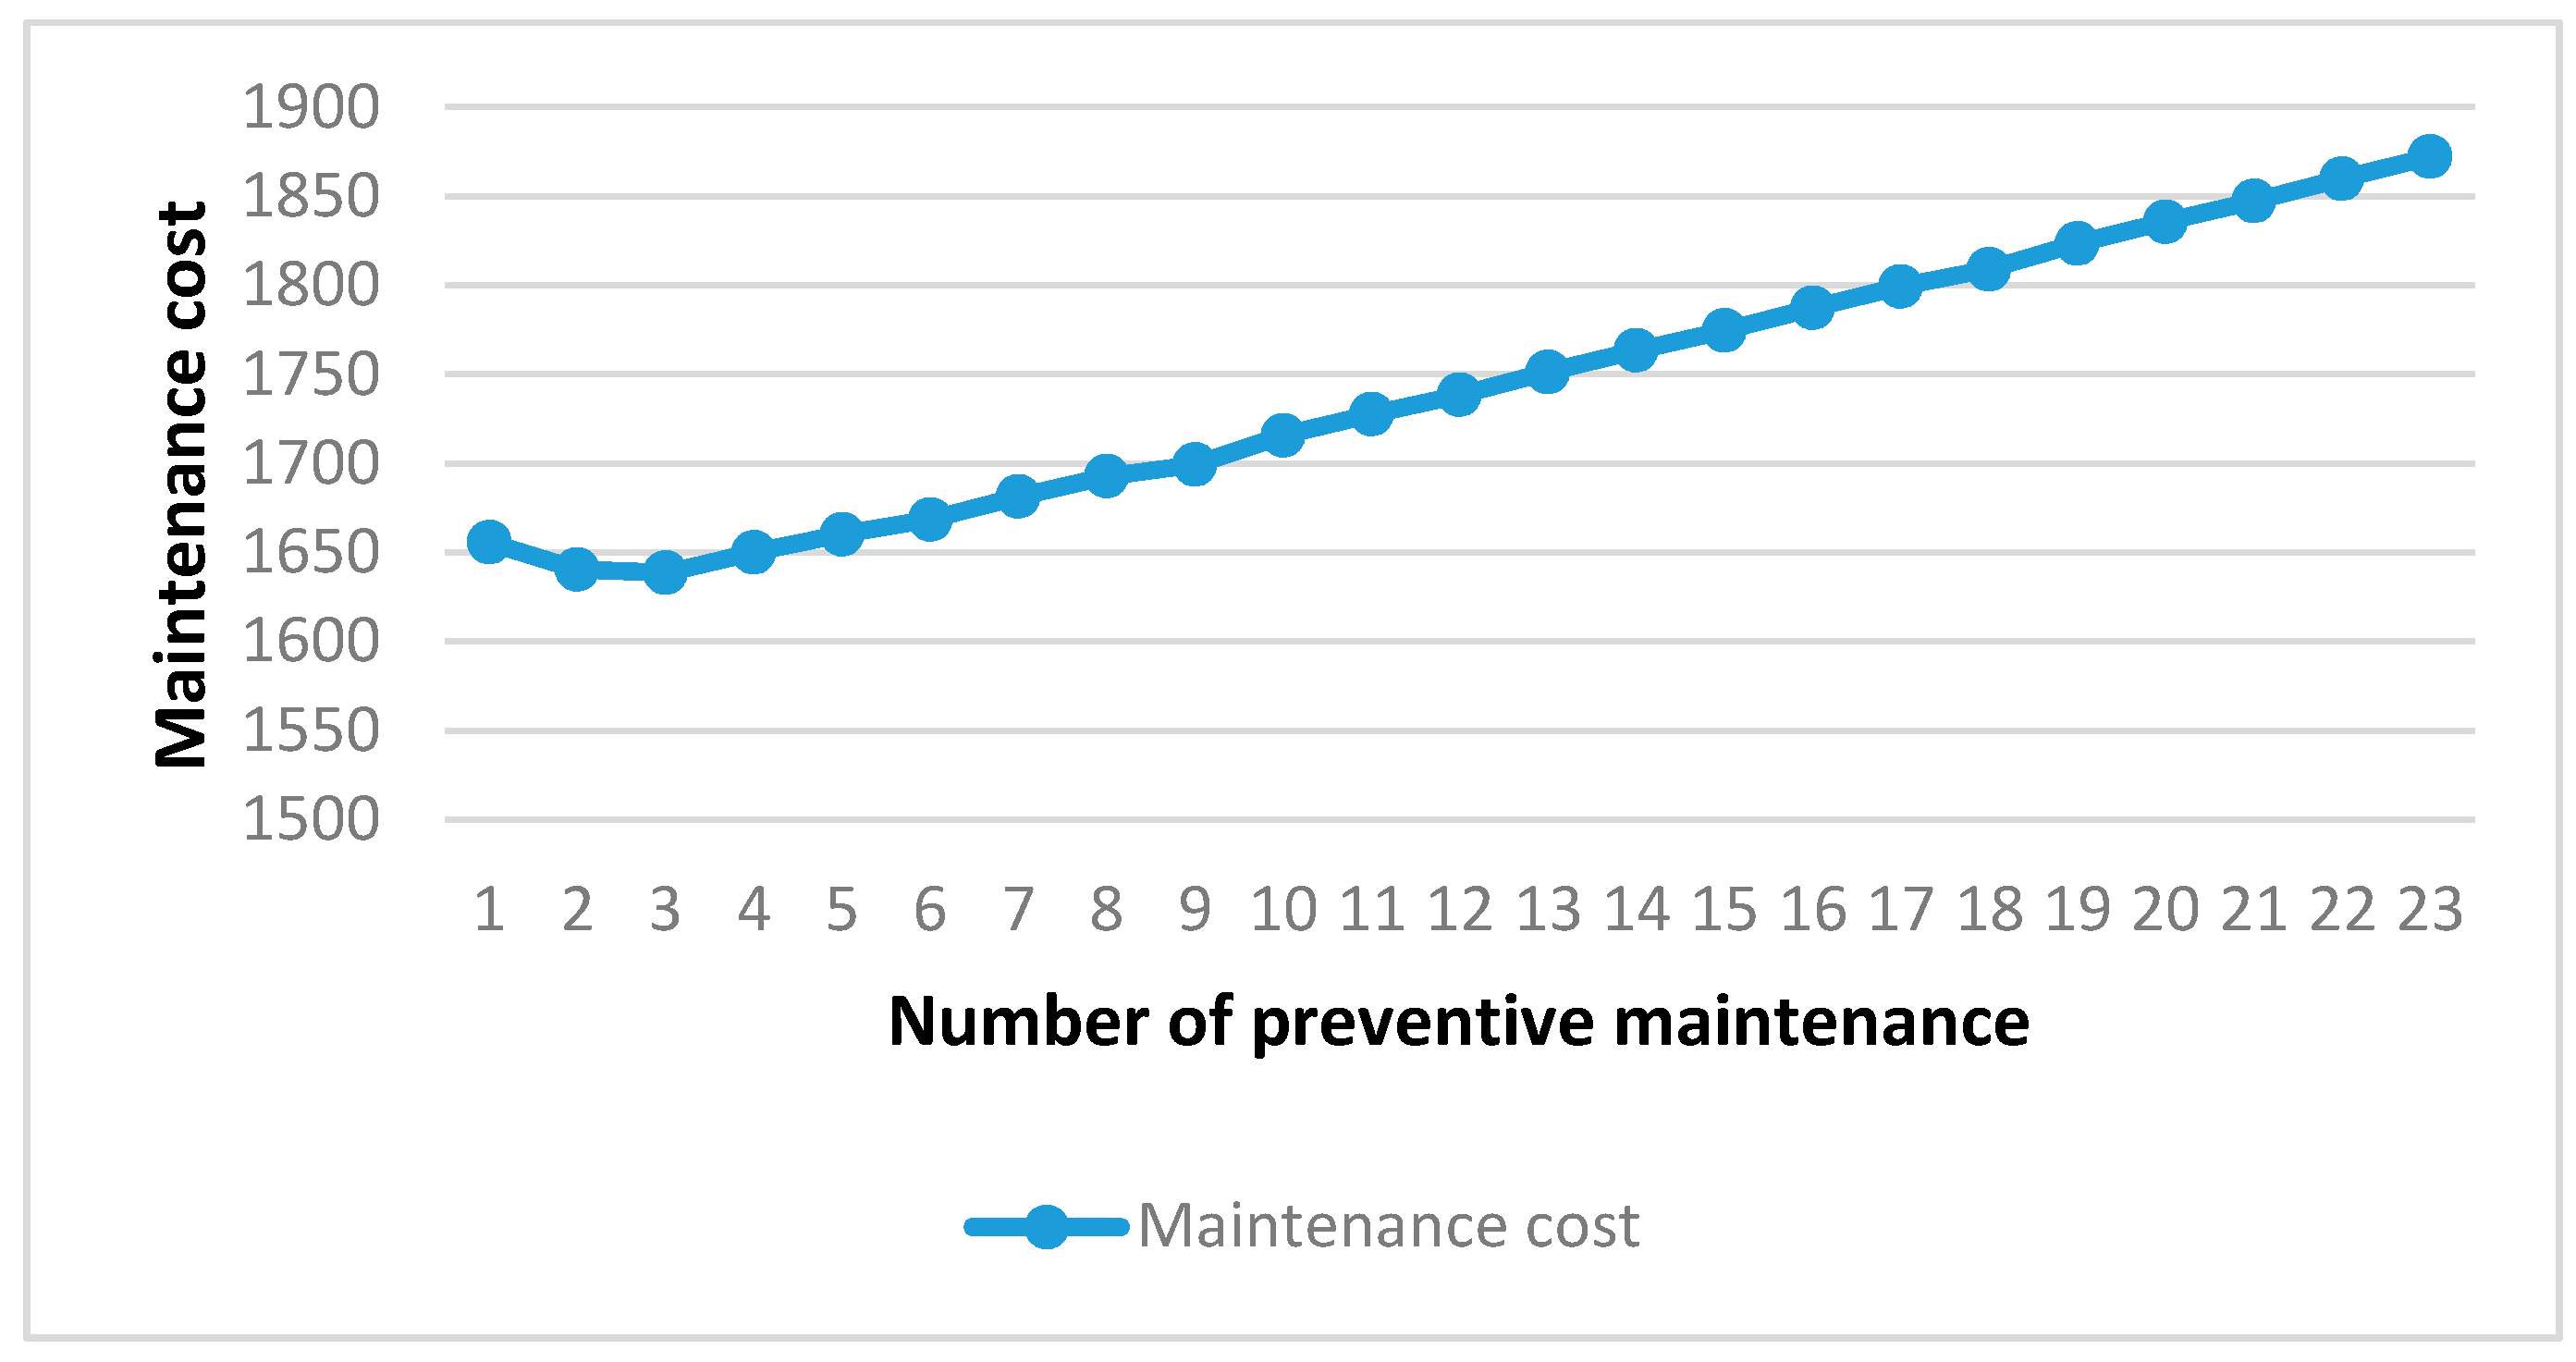
We assumed that our system has a degradation law characterized by a Weibull distribution. The Weibull scale and shape parameters are β = 50 and α = 2. The preventive and corrective maintenance costs are respectively Mp = 220 mu and Mc = 1000 mu. In order to solve the maintenance cost, we use the software MATHEMATICA (11.1.1, Wolfram Research, Oxfordshire, UK).
Figure 2 illustrates the total cost of the maintenance according to each number of preventive maintenance actions. We notice that the optimal number of preventive maintenance actions P is equal to three. Thus, the optimal period of intervention T* is equal to three. Therefore, the total cost of the maintenance policy is equal to 1638 mu.
Now, let Lp = 1 (a = 6%) and Lr = 5 (b = 35%) define capacities lost with respect to the delivery rate due respectively to the preventive maintenance actions and minimal repair actions. Table 7 shows the available delivery rate in each period taking into account the maintenance actions’ effects.
4.3. Step 3: The Final Distribution Plan Using the Subcontracting Strategy and Available Capacities
Now, we introduce the values of the available capacities obtained in Step 2 using the solver FICO Xpress 8.0, and we obtain the following results in Table 8. Thus, the optimal cost of the transportation of deliveries taking into account the subcontracting strategy and available capacities is equal to 3857 mu.
We can notice according to the results that the quantity subcontracted has increased, and we have more delayed quantity in the final period. This is due to the decrease in the value of available capacities due to failures and maintenance actions. Nevertheless, preventive maintenance actions increase the available capacities for the delivery rate. Consequently, the cost of the distribution of delivers increased by 810 mu. Without using the subcontracting strategy, the cost of transportation will be equal to 21,080 according to Table 9. Consequently, it is more beneficial in economic terms to adopt the subcontracting strategy with several UDCs.
Our approach presents efficient results when dealing with the identified variables.
However, these variables are limited in number, and the growth of the data and the requirements may complicate our mathematical model’s responsiveness and efficiency.
5. Conclusions
In this paper, we present an improved distribution policy for the urban logistics problem subject to random equipment failure. In order to satisfy the demand of one product in each period, we present a collaborative approach integrating the possibility for the urban distribution center (UDC) to adopt a subcontracting strategy with other UDCs when demands exceed its available capacity for the delivery rate.
Our approach is based on a mathematical model for a distribution plan with economic and environmental criteria. This model considers also available capacities and allocation constraints for the maintenance strategy. The choice of UDC to subcontract depends on the service cost, environmental cost and on the available capacities. For the maintenance strategy, a minimal repair and a periodic perfect preventive maintenance action are performed. These maintenance actions reduce the available capacities for the delivery rate of the concerned UDC. Moreover, the preventive maintenance makes the system as good as new. A numerical example determines the optimal distribution plan and the optimal number of preventive maintenance actions. Therefore, we determine an optimal distribution plan assuming that the concerned UDC delivers its maximum capacity using the optimization solver FICO Xpress 8.0. Then, we determine the optimal number of preventive maintenance actions using the optimal distribution plan and calculate the available capacity in each period. Finally, using these results, we obtain the optimal distribution plan taking into account the available capacities.
In future work, we will evaluate our model empirically considering the impact of our approach on logistic actors using questionnaires and satisfaction surveys. Moreover, we will introduce time complexity to our mathematical model to address size issues. Finally, we will investigate additional features by taking into account a multi-component system using a degradation formula and will assess their performance and maturity.
Author Contributions
Nadia Ndhaief, Olivier Bistorin and Nidhal Rezg designed this work; Nadia Ndhaief conceived of and designed the mathematical model and wrote the manuscript; Olivier Bistorin and Nidhal Rezg reviewed and supervised this work.
Conflicts of Interest
The authors declare no conflict of interest.
References
- Taniguchi, E. Concept and Best Practices of City Logistics. In Proceedings of the 2012 International Transport Forum, Leipzig, Germany, 3 May 2012. [Google Scholar]
- Decision No. 1386/2013/EU of the European Parliament and of the Council of 20 November 2013 on a General Union Environment Action Programme to 2020 Living Well, Within the Limits of Our Planet. Available online: http://eur-lex.europa.eu/eli/dec/2013/1386/oj (accessed on 18 April 2017).
- Food and Agriculture Organization of the United Nations (FAO): European Union, Communication Division, The State of Food and Argriculture. 2008. Available online: http://www.fao.org/3/a-i0100e.pdf (accessed on 1 April 2017).
- Panero, M.A.; Shin, H.S.; Lopez, D.P. Urban Distribution Centers—A Means to Reducing Freight Vehicle Miles Traveled; New York State Department of Transportation: Albany, NY, USA, 2011.
- Rao, C.; Goh, M.; Zhao, Y.; Zheng, J. Locationselection of city logistics centers under sustainability. Transp. Res. Part D Transp. Environ. 2015, 36, 29–44. [Google Scholar] [CrossRef]
- Crainic, T.G.; Ricciardi, N.; Storchi, G. Modelsfor evaluating and planning city logisticssystems. Transp. Sci. 2009, 43, 432–454. [Google Scholar] [CrossRef]
- Marcucci, E.; Danielis, R. The potential demand for a urban freight consolidation centre. Transportation 2008, 35, 269–284. [Google Scholar] [CrossRef]
- Browne, M.; Sweet, M.; Woodburn, A.; Allen, J. Urban Freight Consolidation Centres Final Report; Transport Studies Group, University of Westminster: London, UK, 2005. [Google Scholar]
- Ndhaief, N.; Bistorin, O.; Rezg, N. Problem analysis of logistic platform based on combined forward and reverse flows: A case study. In Proceedings of the 2015 IEEE International Conference on Industrial Engineering and Systems Management (IESM), Seville, Spain, 21–23 October 2015; pp. 568–573. [Google Scholar]
- Olivier, B.; Nadia, N.; Nidhal, R. Logistique Urbaine: Apports de la Modélisation et de la Simulation à Travers le cas du Plateau Piétonnier de la Ville de Metz; RePEc (Research Papers in Economics ): New York, NY, USA, 2015. [Google Scholar]
- European Commission. “Living Well, Within the Limits of Our Planet”. 7th EAP—The New General Union Environment Action Programme to 2020; European Commission: Brussels, Belgium, 2014. [Google Scholar]
- Zied, H.; Nidhal, R.; Cormier, G. Integrated transportation and maintenance problem. In Proceedings of the IEEE 11th International Conference on Networking, Sensing and Control (ICNSC), Miami, FL, USA, 7–9 April 2014; pp. 474–479. [Google Scholar]
- Hajej, Z.; Dellagi, S.; Rezg, N. Optimal integrated maintenance/production policy for randomly failing systems with variable failurerate. Int. J. Prod. Res. 2011, 49, 5695–5712. [Google Scholar]
- Dellagi, S.; Rezg, N.; Uie, U. Preventive maintenance of manufacturing systems under environmental constraints. Int. J. Prod. Res. 2007, 45, 1233–1254. [Google Scholar] [CrossRef]
- Dellagi, S.; Rezg, N.; Gharbi, A. Optimal maintenance/production policy for a manufacturing system subjected to random failure and calling upon several subcontractors. Int. J. Manag. Sci. Eng. Manag. 2010, 5, 261–267. [Google Scholar]
- Zied, H.; Sofiene, D.; Nidhal, R. An optimal production/maintenance planning under stochastic random demand, service level and failure rate. In Proceedings of the IEEE International Conference on Automation Science and Engineering (CASE 2009), Bangalore, India, 22–25 August 2009; pp. 292–297. [Google Scholar]
- Sadok, T.; Zied, H.; Nidhal, R. Impact of delivery time on optimal production/delivery/maintenance planning. In Proceedings of the 2012 IEEE International Conference on Automation Science and Engineering (CASE), Seoul, Korea, 20–24 August 2012; pp. 335–340. [Google Scholar]
- Aghezzaf, E.H.; Jamali, M.A.; Ait-Kadi, D. An integrated production and preventive maintenance planning model. Eur. J. Oper. Res. 2007, 181, 679–685. [Google Scholar] [CrossRef]
- Wang, L.; Wang, S.; Zheng, X. AHybrid Estimation of Distribution Algorithm for Unrelated Parallel Machine Scheduling with Sequence-Dependent Setup Times. IEEE/CAA J. Autom. Sin. 2016, 3, 235–246. [Google Scholar]
- Tian, G.; Ren, Y.; Zhou, M.C. Dual-Objective Scheduling of Rescue Vehicles to Distinguish Forest Fires via Differential Evolution and Particle Swarm Optimization Combined Algorithm. IEEE Trans. Intell. Transp. Syst. 2016, 17, 3009–3021. [Google Scholar] [CrossRef]
- Duan, H.; Li, P.; Yu, Y. A Predator-prey Particle Swarm Optimization Approach to Multiple UCAV Air Combat Modeled by Dynamic Game Theory. IEEE/CAA J. Autom. Sin. 2015, 2, 11–18. [Google Scholar]
Figure 1.
Problem description; UDC (urban distribution center).

Figure 2.
Average total cost of the maintenance according to P.


Table 1.
Mean demand of urban area.
| d1 | d2 | d3 | d4 | d5 | d6 | d7 | d8 | d9 | d10 |
|---|---|---|---|---|---|---|---|---|---|
| 25 | 17 | 35 | 35 | 22 | 25 | 16 | 20 | 17 | 25 |
Table 2.
Available capacity for UDC1, UDC: urban distribution center.
| Y1,1 | Y1,2 | Y1,3 | Y1,4 | Y1,5 | Y1,6 | Y1,7 | Y1,8 | Y1,9 | Y1,10 |
|---|---|---|---|---|---|---|---|---|---|
| 4 | 5 | 1 | 7 | 2 | 5 | 2 | 3 | 0 | 1 |
Table 3.
Available capacity for UDC2.
| Y2,1 | Y2,2 | Y2,3 | Y2,4 | Y2,5 | Y2,6 | Y2,7 | Y2,8 | Y2,9 | Y2,10 |
|---|---|---|---|---|---|---|---|---|---|
| 0 | 5 | 3 | 8 | 4 | 6 | 9 | 1 | 2 | 0 |
Table 4.
Available capacity for UDC3.
| Y3,1 | Y3,2 | Y3,3 | Y3,4 | Y3,5 | Y3,6 | Y3,7 | Y3,8 | Y3,9 | Y3,10 |
|---|---|---|---|---|---|---|---|---|---|
| 7 | 0 | 8 | 0 | 2 | 5 | 3 | 1 | 2 | 2 |
Table 5.
The unit service cost and unit emission cost for each UDC. mu, monetary unit.
| Items | UDC1 | UDC2 | UDC3 |
|---|---|---|---|
| Unit service cost | 15 mu | 20 mu | 10 mu |
| Unit emission cost | 2 mu | 1 mu | 4 mu |
Table 6.
Distribution plan with the subcontracting strategy using the maximal capacity.
| Period | 1 | 2 | 3 | 4 | 5 | 6 | 7 | 8 | 9 | 10 |
|---|---|---|---|---|---|---|---|---|---|---|
| Demand | 25 | 17 | 35 | 35 | 22 | 25 | 16 | 20 | 17 | 25 |
| Distribution plan | 20 | 17 | 20 | 20 | 20 | 20 | 16 | 20 | 17 | 20 |
| Allocation to UDC1 | 0 | 0 | 1 | 1 | 1 | 0 | 0 | 0 | 0 | 1 |
| Quantity subcontracted to UDC1 | 0 | 0 | 1 | 7 | 2 | 0 | 0 | 0 | 0 | 1 |
| Allocation to UDC2 | 0 | 0 | 1 | 1 | 1 | 0 | 0 | 0 | 0 | 0 |
| Quantity subcontracted to UDC2 | 0 | 0 | 3 | 8 | 1 | 0 | 0 | 0 | 0 | 0 |
| Allocation to UDC3 | 1 | 0 | 1 | 0 | 1 | 1 | 0 | 0 | 0 | 1 |
| Quantity subcontracted to UDC3 | 5 | 0 | 8 | 0 | 2 | 5 | 0 | 0 | 0 | 2 |
| Delayed quantity | 0 | 0 | 3 | 3 | 0 | 0 | 0 | 0 | 0 | 2 |
Table 7.
The available capacity in each period t.
| C1 | C2 | C3 | C4 | C5 | C6 | C7 | C8 | C9 | C10 |
|---|---|---|---|---|---|---|---|---|---|
| 19 | 18 | 16 | 19 | 18 | 16 | 19 | 18 | 16 | 19 |
Table 8.
Final distribution plan using the subcontracting strategy with available capacities.
| Period | 1 | 2 | 3 | 4 | 5 | 6 | 7 | 8 | 9 | 10 |
|---|---|---|---|---|---|---|---|---|---|---|
| Demand | 25 | 17 | 35 | 35 | 22 | 25 | 16 | 20 | 17 | 25 |
| Distribution plan | 19 | 17 | 15 | 19 | 18 | 16 | 19 | 18 | 16 | 19 |
| Allocation to UDC1 | 0 | 0 | 1 | 1 | 1 | 1 | 0 | 1 | 0 | 1 |
| Quantity subcontracted to UDC1 | 0 | 0 | 1 | 7 | 2 | 5 | 0 | 1 | 0 | 1 |
| Allocation to UDC2 | 0 | 0 | 1 | 1 | 1 | 1 | 0 | 0 | 0 | 0 |
| Quantity subcontracted to UDC2 | 0 | 0 | 3 | 8 | 4 | 3 | 0 | 0 | 0 | 0 |
| Allocation to UDC3 | 1 | 0 | 1 | 0 | 1 | 1 | 0 | 1 | 1 | 1 |
| Quantity subcontracted to UDC3 | 6 | 0 | 8 | 0 | 2 | 5 | 0 | 1 | 1 | 2 |
| Delayed quantity | 0 | 0 | 7 | 8 | 4 | 0 | 0 | 0 | 0 | 3 |
Table 9.
Final distribution plan without the subcontracting strategy with available capacities.
| Period | 1 | 2 | 3 | 4 | 5 | 6 | 7 | 8 | 9 | 10 |
|---|---|---|---|---|---|---|---|---|---|---|
| Demand | 25 | 17 | 35 | 35 | 22 | 25 | 16 | 20 | 17 | 25 |
| Distribution plan | 19 | 17 | 15 | 19 | 18 | 16 | 19 | 18 | 16 | 19 |
| Allocation to UDC1 | 0 | 0 | 0 | 0 | 0 | 0 | 0 | 0 | 0 | 0 |
| Allocation to UDC2 | 0 | 0 | 0 | 0 | 0 | 0 | 0 | 0 | 0 | 0 |
| Allocation to UDC3 | 0 | 0 | 0 | 0 | 0 | 0 | 0 | 0 | 0 | 0 |
| Delayed quantity | 6 | 5 | 24 | 40 | 44 | 53 | 50 | 52 | 53 | 59 |
© 2017 by the authors. Licensee MDPI, Basel, Switzerland. This article is an open access article distributed under the terms and conditions of the Creative Commons Attribution (CC BY) license (http://creativecommons.org/licenses/by/4.0/).
Share and Cite
MDPI and ACS Style
Ndhaief, N.; Bistorin, O.; Rezg, N. An Improved Distribution Policy with a Maintenance Aspect for an Urban Logistic Problem. Appl. Sci. 2017, 7, 703. https://doi.org/10.3390/app7070703
AMA Style
Ndhaief N, Bistorin O, Rezg N. An Improved Distribution Policy with a Maintenance Aspect for an Urban Logistic Problem. Applied Sciences. 2017; 7(7):703. https://doi.org/10.3390/app7070703
Chicago/Turabian StyleNdhaief, Nadia, Olivier Bistorin, and Nidhal Rezg. 2017. "An Improved Distribution Policy with a Maintenance Aspect for an Urban Logistic Problem" Applied Sciences 7, no. 7: 703. https://doi.org/10.3390/app7070703
Note that from the first issue of 2016, this journal uses article numbers instead of page numbers. See further details here.