4.1. Turning Simulation—2024-T351
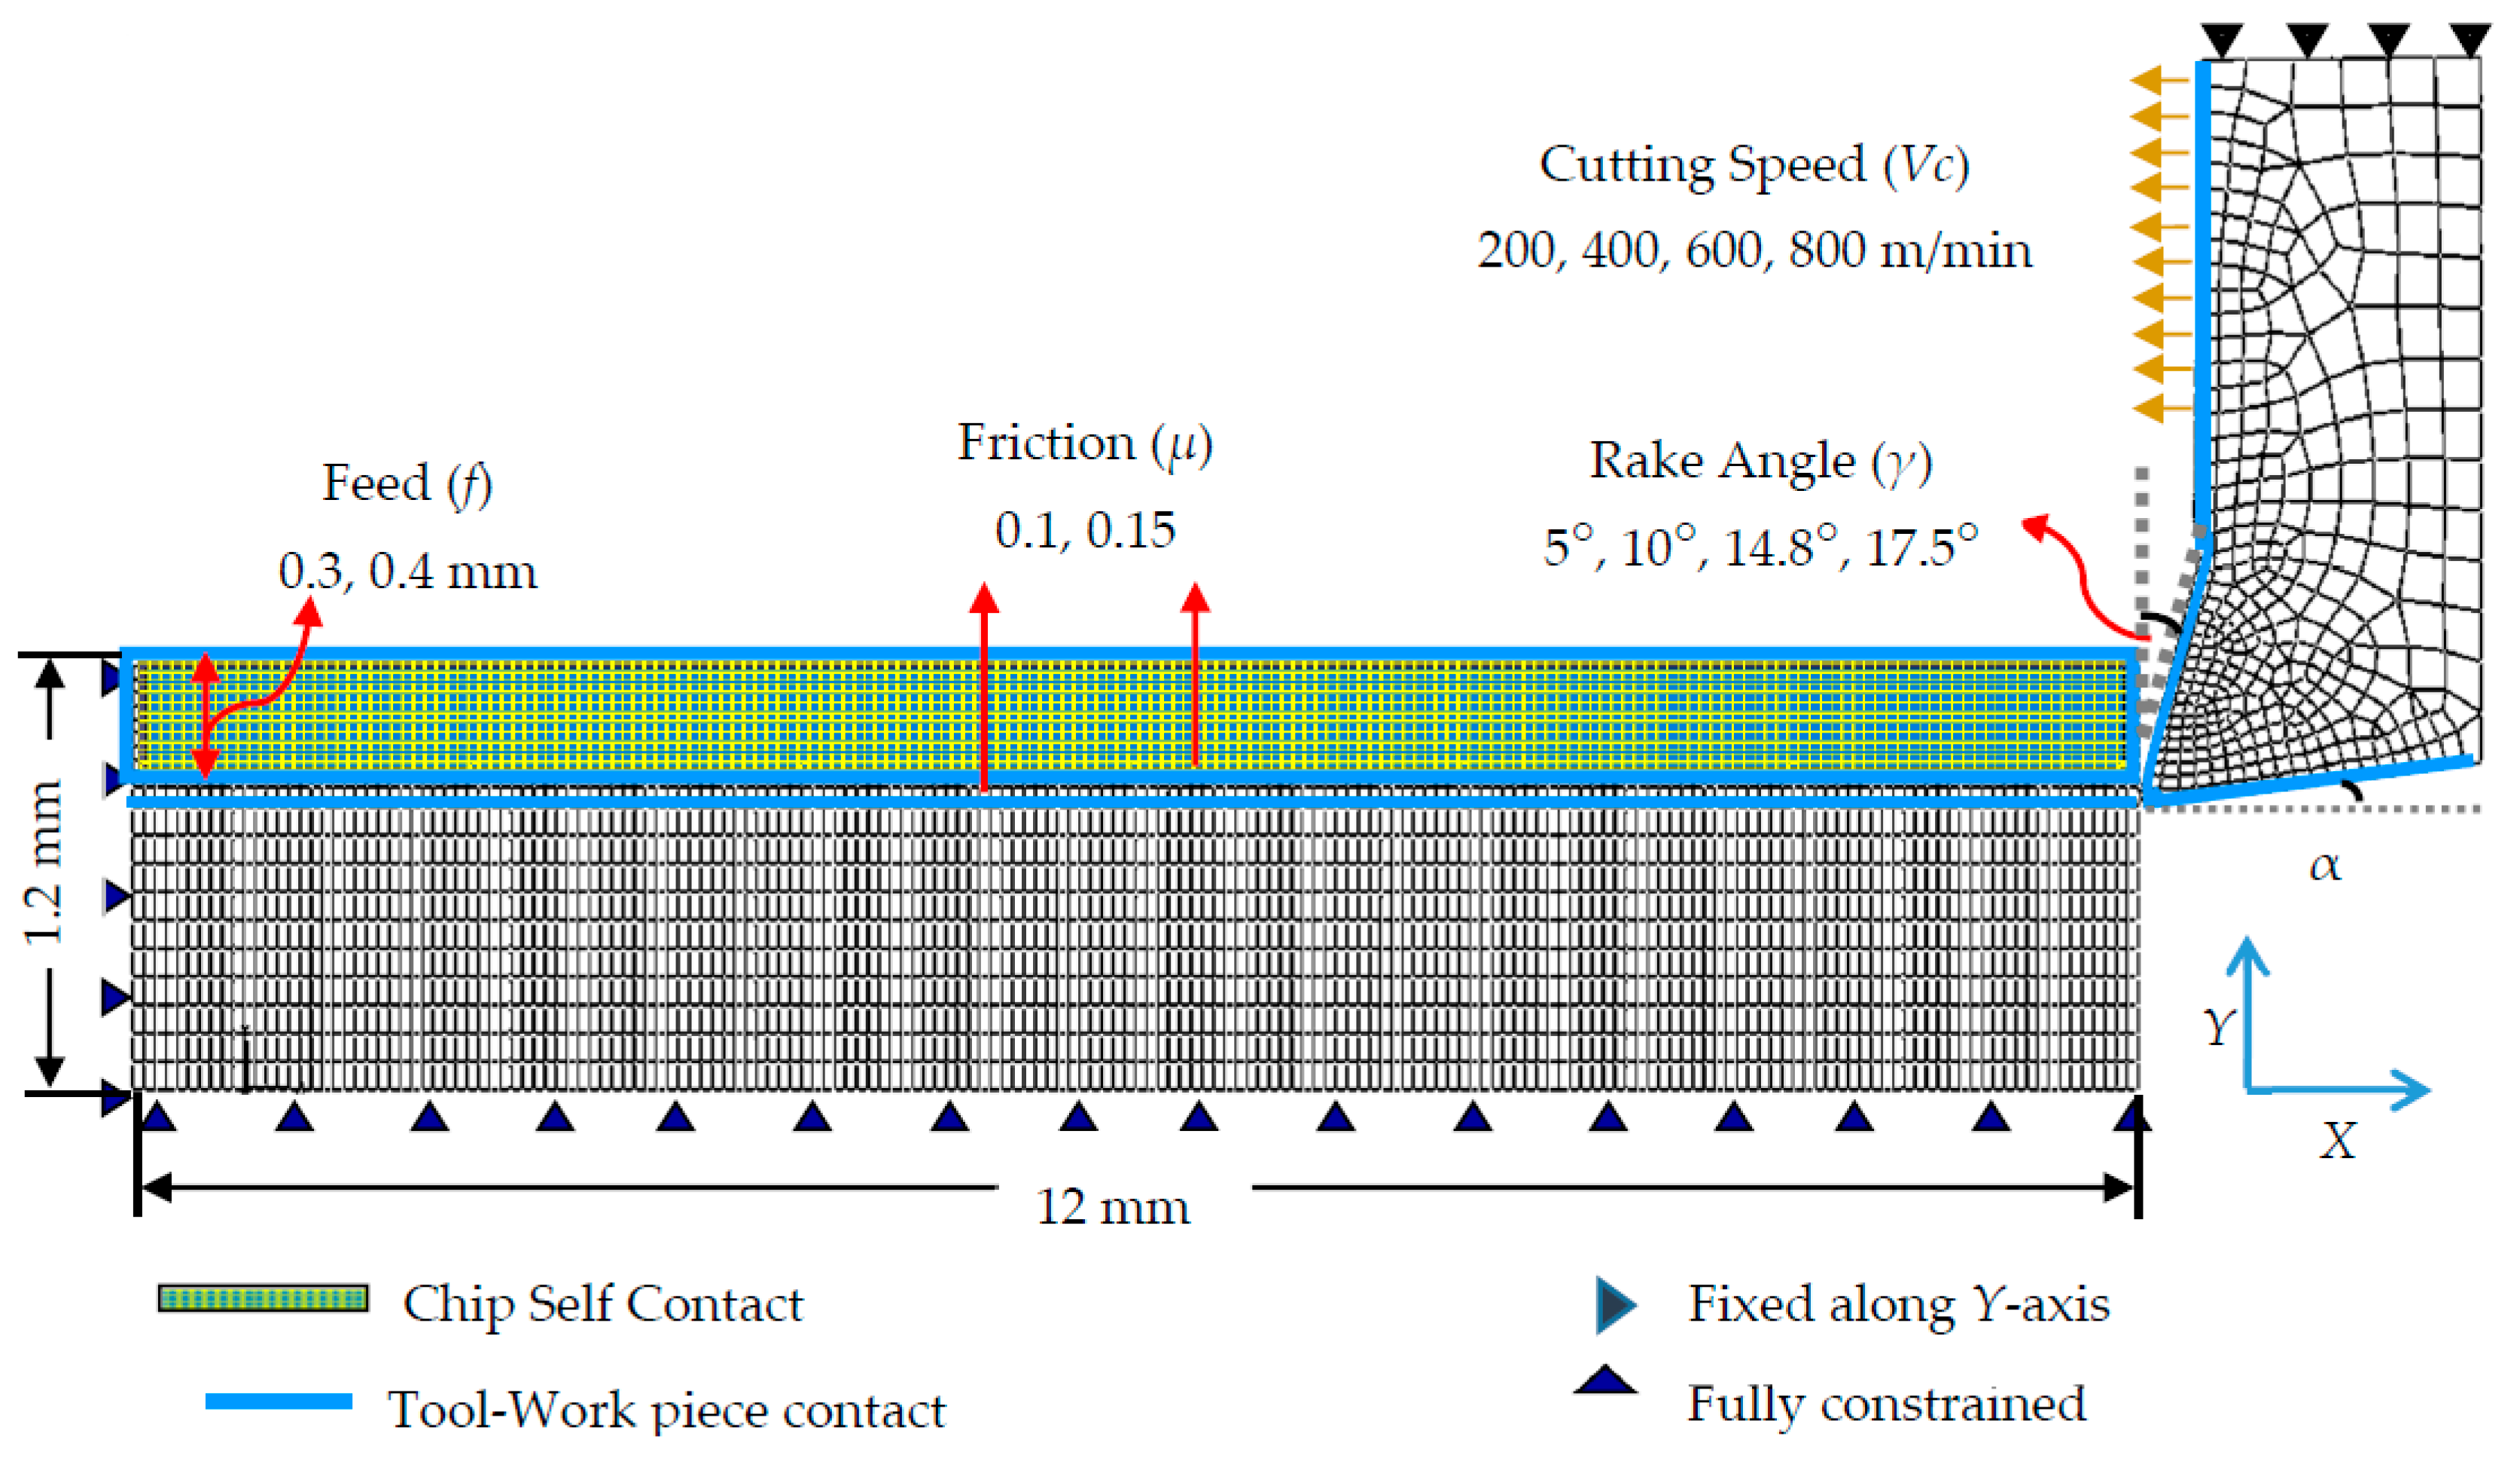
The 2D numerical model developed for the cutting simulations is shown in
Figure 2. The work piece was developed into three sections: the chipped off material, the damage zone at tool-chip interface, and the uncut material. The configuration of the work piece into three different sections was essential to define different material properties, constitutive relationships, contact conditions, and the material damage laws. For example, JC material damage model and the damage evolution law were applied in the damage zone with a specific fracture energy; JC material damage model with a different fracture energy and the contact conditions were defined in the chipped off material; and the uncut material section was defined without JC damage parameters. The assembly of three parts was done by applying the standard join constraint (tie constraint) available in Abaqus. A tie constraint fuses the model surfaces with different mesh sizes and element types. Due to tie condition, each node at the slave surface attains the same displacement, stress, temperature, pressure, etc. corresponding to its closest node at the master surface. Tie condition makes the model computationally expensive and requires a compatible mesh between the part instances. Generally, Abaqus picks the slave surface with a finer mesh. For fidelity of the results of a multi-parts model assembled with the standard tie constraint, interested readers may refer to the online Abaqus documentation (tie constraints, Section 34.3.1, Abaqus Analysis User’s Manual) [
49].
The model comprises 4134 four nodes quadrilateral continuum elements with plane strain (CPE4RT) and coupled temperature-displacement conditions. Cutting tool geometry consists of a nose radius (
Rn) of 0.02 mm and a clearance angle 7°. A parametric sensitivity analysis was performed with different rake angles, cutting speeds, chip thickness, and the contact conditions to study the effect of tool rake angle on the chip temperature, the effect of contact friction on the cutting reaction force, the effect of cutting speeds on the equivalent plastic strain, the effect of feed upon the chip temperature, and the effect of friction coefficients on chip temperature. The cutting tool was constrained in
y-direction and a self-contact was defined over the chip surface to avoid the penetration of deformed chip elements into the uncut chip and cutting tool. Contact conditions were established between the contact interfaces of the cutting tool, chip, damage zone, and the uncut material [
50]. Selection of the proper friction coefficient and governing law is a critical and sensitive task in numerical cutting simulations. The friction characteristic at the tool-chip interface is difficult to determine since it is influenced by many factors; such as, the local cutting speed, contact pressure, temperature, cutting tool, work piece material, etc. [
51]. An improper selection of the friction coefficient affects the results and findings. Extensive studies have been reported on the interaction of the tool-chip interface during the dry turning process. Several models have also been proposed to determine the contact friction. The most widely used method to determine the contact friction is Zorev’s stick-slip friction model [
52] which is also known as an extended Columb’s law. In the present numerical simulations, the interaction between AA2024 material and the tungsten carbide tool insert, two different values of the friction coefficients (0.1 and 0.15) are used considering the similar experimental conditions [
42] and also investigated by Zorev’s friction model.
Different properties and parameters used in the model are given in
Table 1 [
42]. The outcomes of turning simulations were compared with the available experimental results, given in
Table 2 [
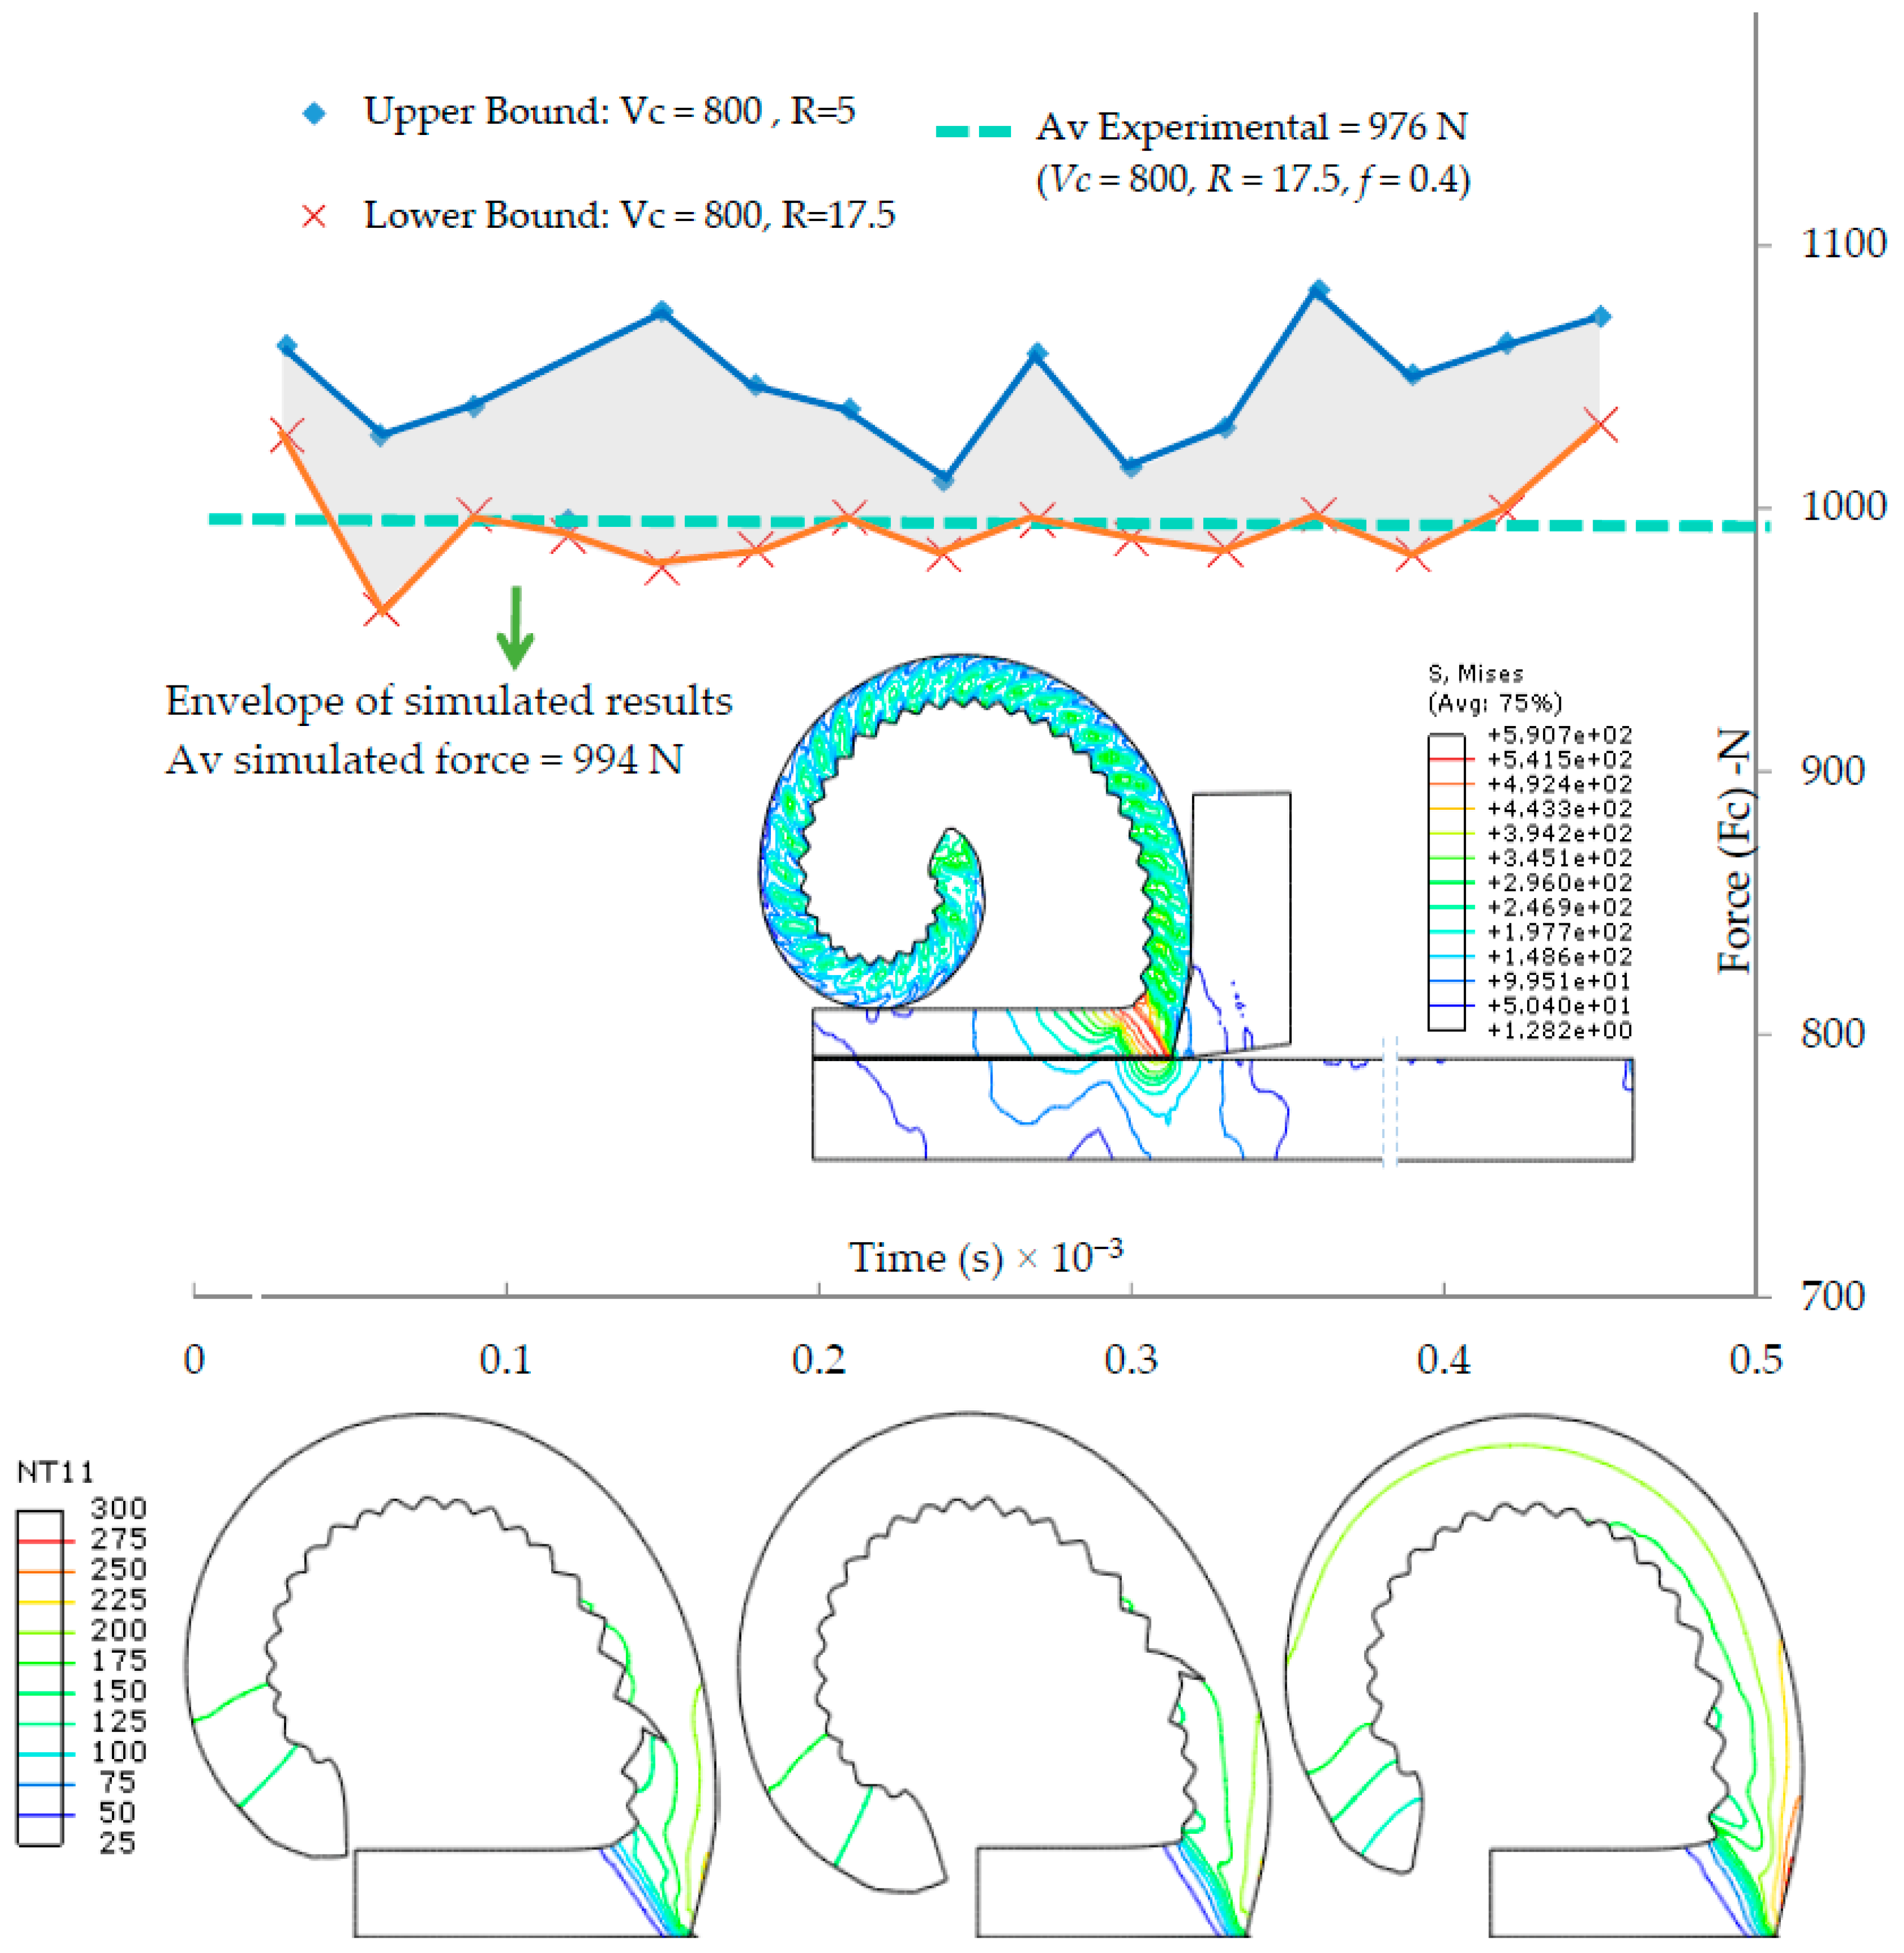
42]. Cutting force evolution and its comparison with the experimental results is shown in
Figure 3. A summary of 64 cutting simulations is given in
Table 3, where
V is the cutting force (m/min);
C is the feed (0.4 mm);
F is the contact friction;
RF (N) is the cutting reaction force;
R (degrees) is the tool rake angle; and
T is the temperature of the tool-chip interface. For further details, interested readers may consult the published work in Saleem et al. [
42].
4.2. Artificial Neural Network (Modeling and Analysis)
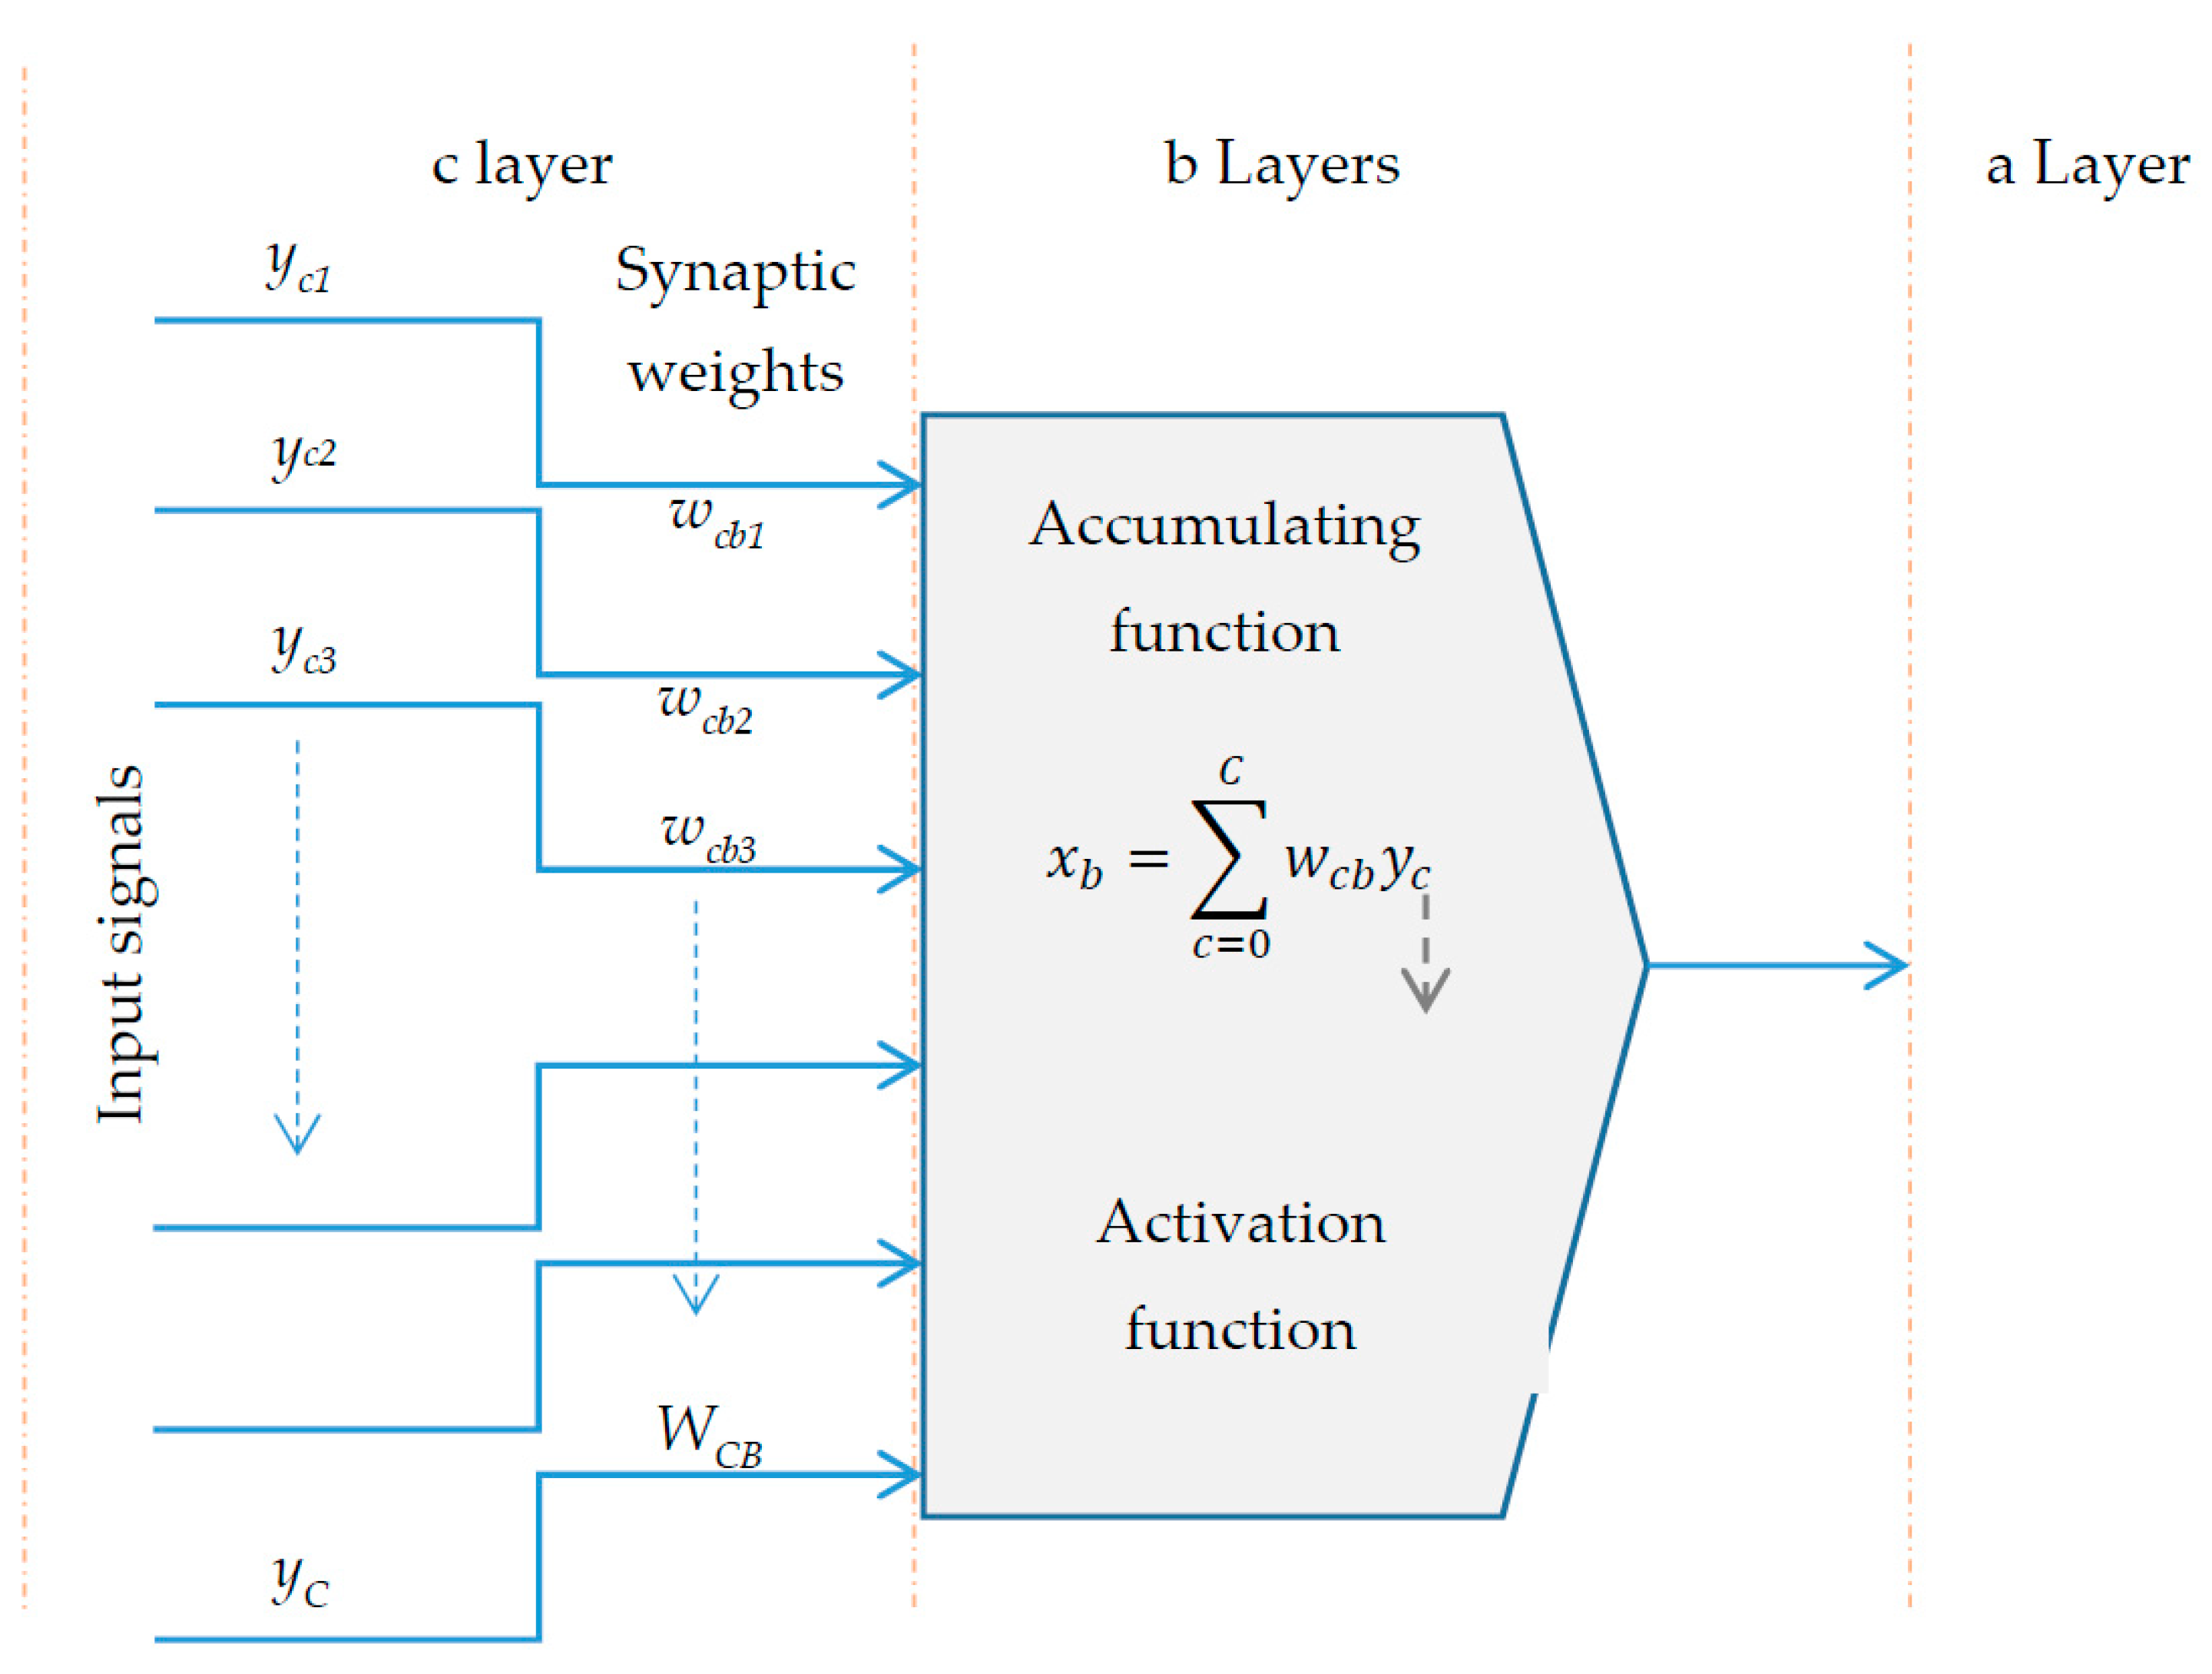
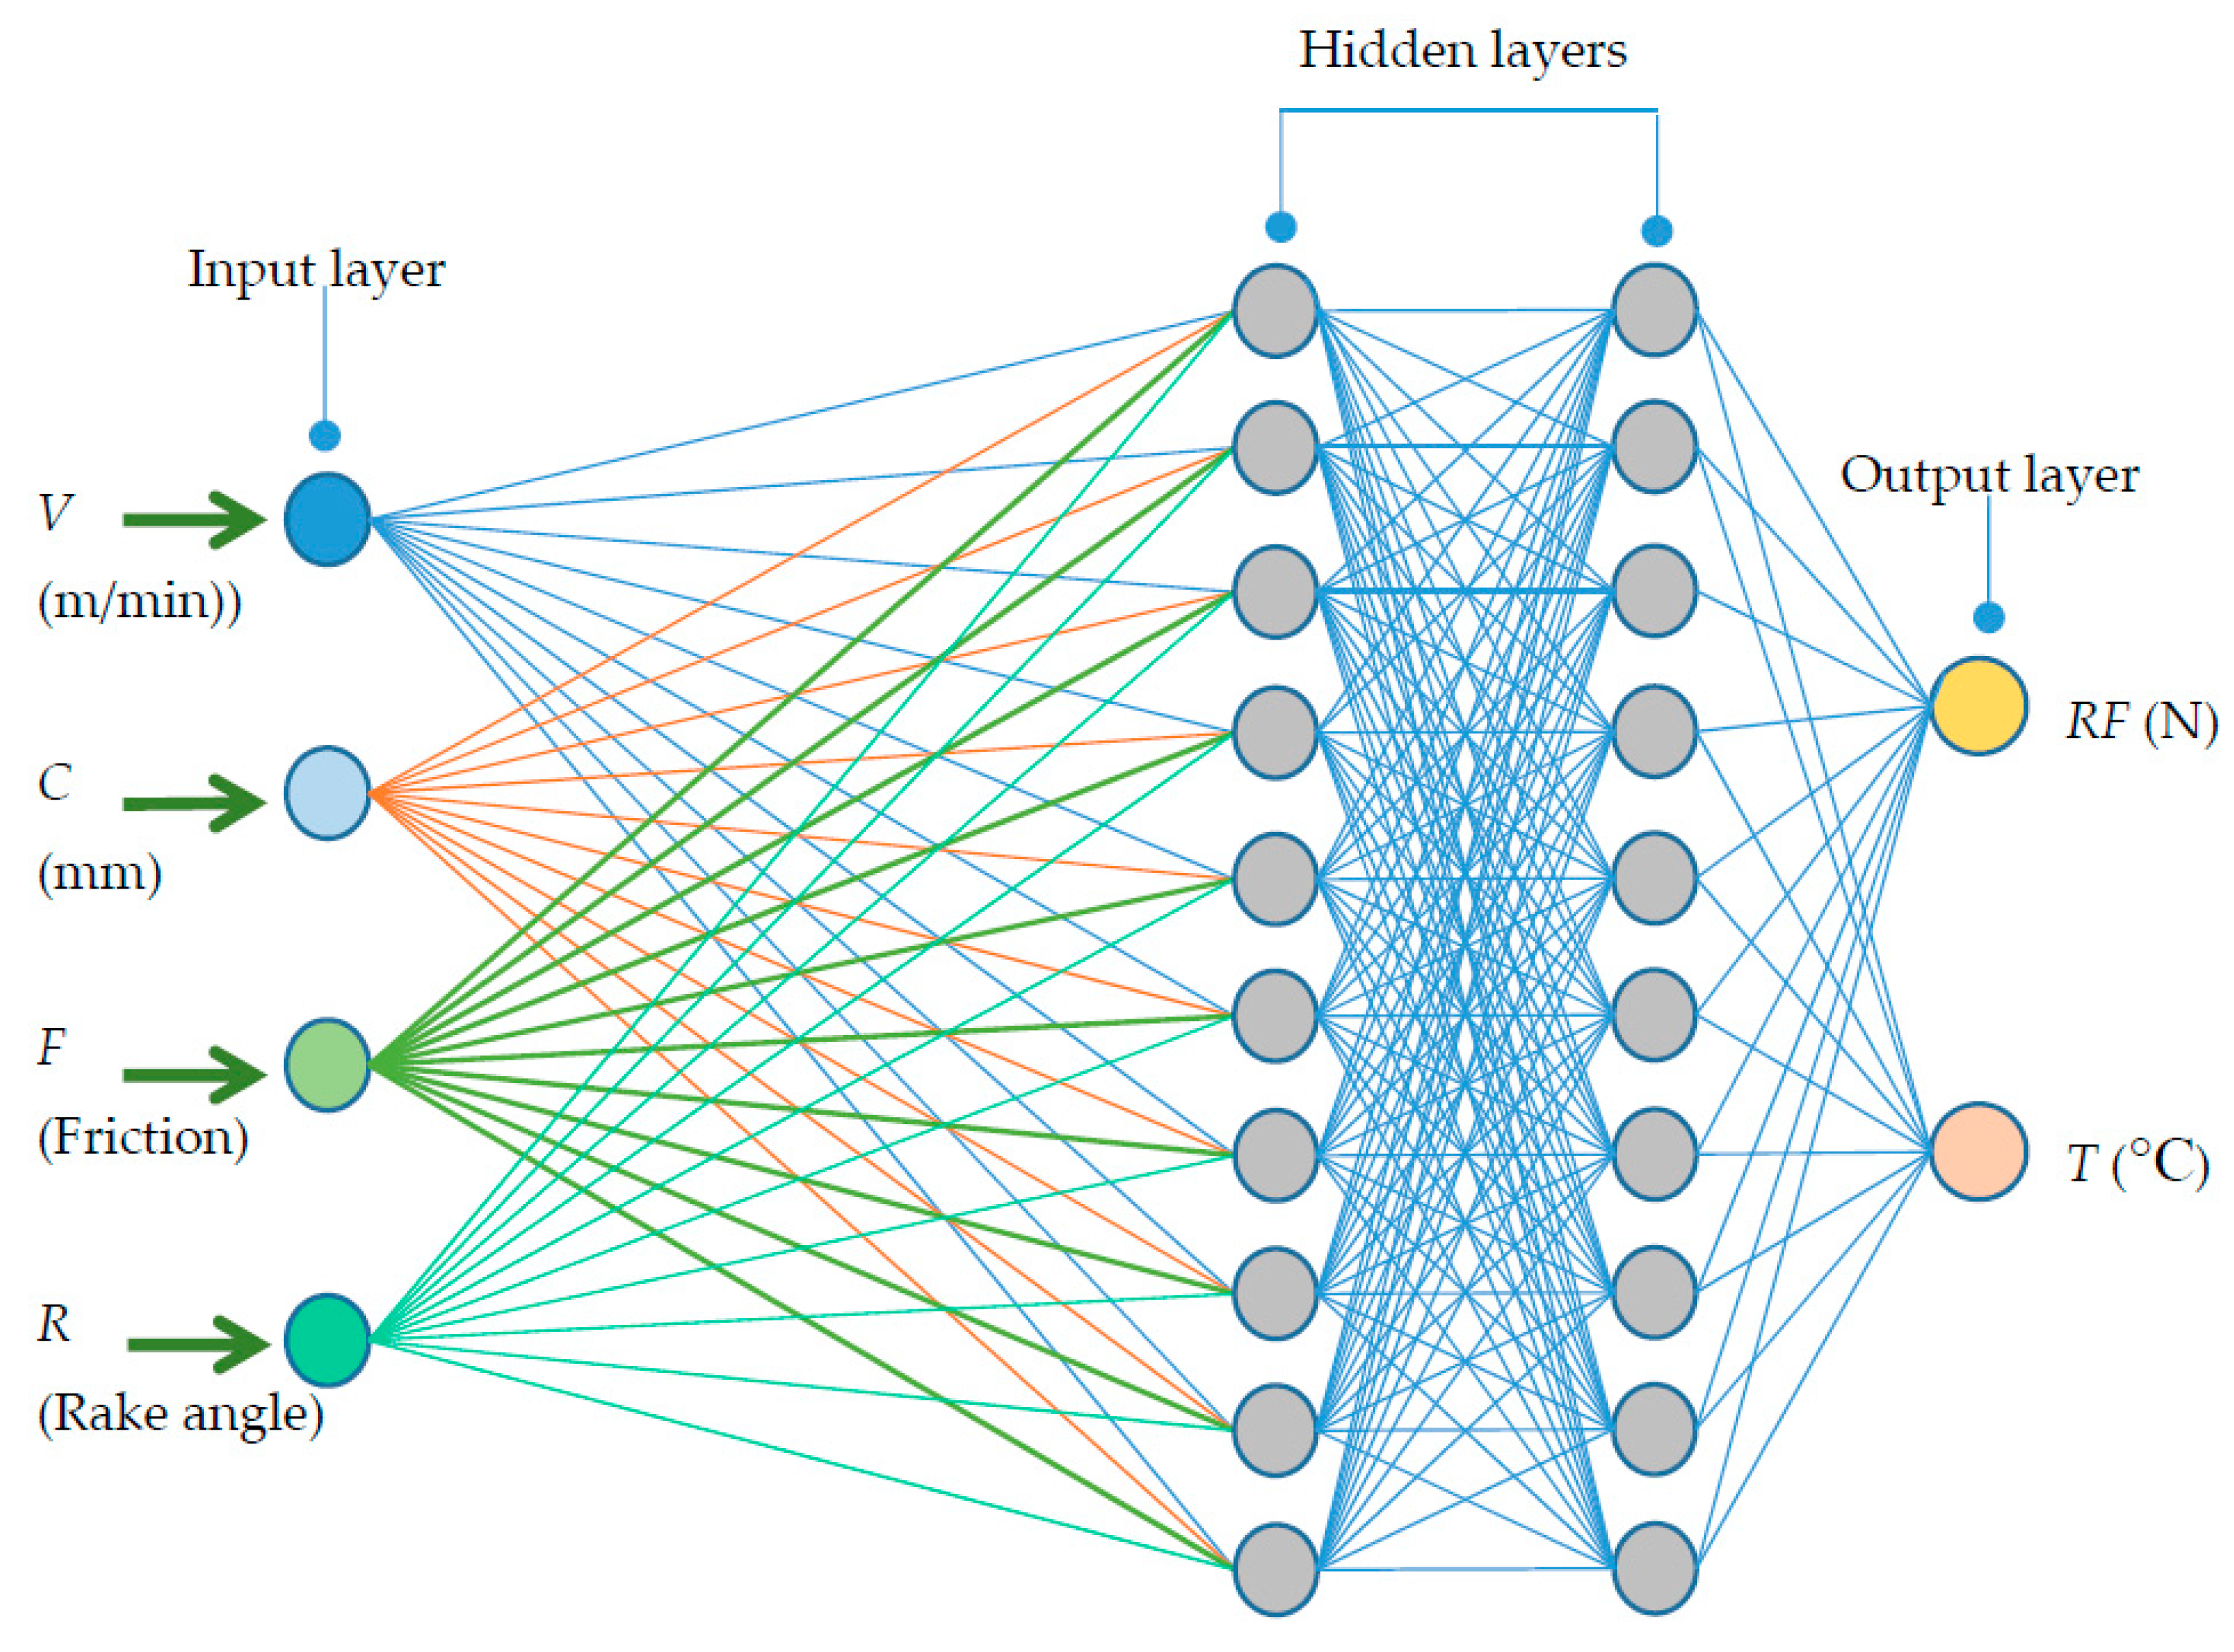
The artificial neural network model adopted for this study is shown in
Figure 4. The model consists of three layers; the input layer, the hidden layer, and the output layer. The input parameters to the ANN model consist of the cutting parameters studied during the numerical simulations, and the outputs are the corresponding cutting reaction force and tool-chip interface temperature. The four input parameters consist of cutting force (
V in m/min), cutting feed (
C in 0.4 mm), contact friction (
F), cutting reaction force (
RF in Newtons), tool rake angle (
R in degree), and the temperature at tool chip interface (
T in °C). The output layer consists of two neurons: the cutting reaction force
RF (N) and tool–chip interface temperature
T (°C).
The MATLAB (R2013, The MathWorks, Natick, MA, USA, 2013), neural network toolbox was used for training and testing of the simulations data. Training of the network was accomplished by considering the 64 numerical simulations. The output (cutting reaction force and tool-chip interface temperature) and the corresponding input parameters of these simulations are given in
Table 3. Design of the numerical experiments could also be accomplished with some standard technique (such as Taguchi’s configuration). In this research, different combinations of the input parameters were selected by considering the range of each parameter used in actual machining experiments. With four input parameters, all the possible combinations result into 4 × 4 × 2 × 2 = 64 design of numerical experiments.
Considering the available experimental data [
42], the Abaqus simulations run at serial 13, 14, 16, 57, 58, and 60 were used for validation of the ANN model. The input parameters of these simulations are similar to the corresponding cutting conditions in actual experiments. The standard feedforward backpropagation neural network was studied by considering the Log-Sigmoid transfer function (LOGSIG). The Log-sigmoid transfer function is used for training the data in multi-layer networks with back-propagation algorithm [
54,
55,
56]. The selection of optimal number of hidden layers is a difficult task. The optimal numbers of hidden layers are determined by training several networks and estimating the error. A few hidden layers may cause a high training error due to under-fitting and too many hidden layers may cause a high generalization error due to over-fitting. Selection also depends upon the numbers of input and output layers, learning function, the ANN architecture, the activation function, and the training algorithm. For the proposed ANN architecture, the numbers of neurons in the hidden layers were determined through a trial-and-error method. The best configuration was observed with two hidden layers and 10 neurons in each layer. The ANNs predicted outcomes and properties were evaluated by considering the mean-square-error and regression analysis. The predicted outcomes were validated with the published experimental results [
42]. Details of the machining experiments, testing scheme, and the measurement techniques are described in the published article. The ANN parameters for training and testing are given in
Table 4.
The default Levenberg-Marquardt algorithm was used for training the network. The maximum validation checks (max_fail) function was taken as 6. This parameter (max_fail) serves as a training function parameter and ensures the maximum number of validation checks before the training is stopped. Therefore, it must be a positive integer. The validation fails are total successive iterations that the validation performance fails to decrease or when the validation MSE (mean-square-error) increases the max_fail value. This criterion can be changed by setting the parameter net.trainParam.max_fail. A large number of trainings show the over training and Matlab tries to stop the training after 6 failed in a row. In the back-propagation, the learning rate and the momentum factor are very significant to determine the learning speed and accuracy [
57]. The learning rate controls the changes in the weights during the training process. The momentum factor manages the speed of network training. It defines the fraction of preceding weight changes to be included in the current weight changes. Termination of the training depends upon the magnitude of the gradient and the number of validation checks. In case, when the training reaches the minimum of the performance, the gradient becomes very small. For example, the training stops when the magnitude of the gradient is less than 1 × 10
−5. This limit can be adjusted by setting the parameter net.trainParam.min_grad.
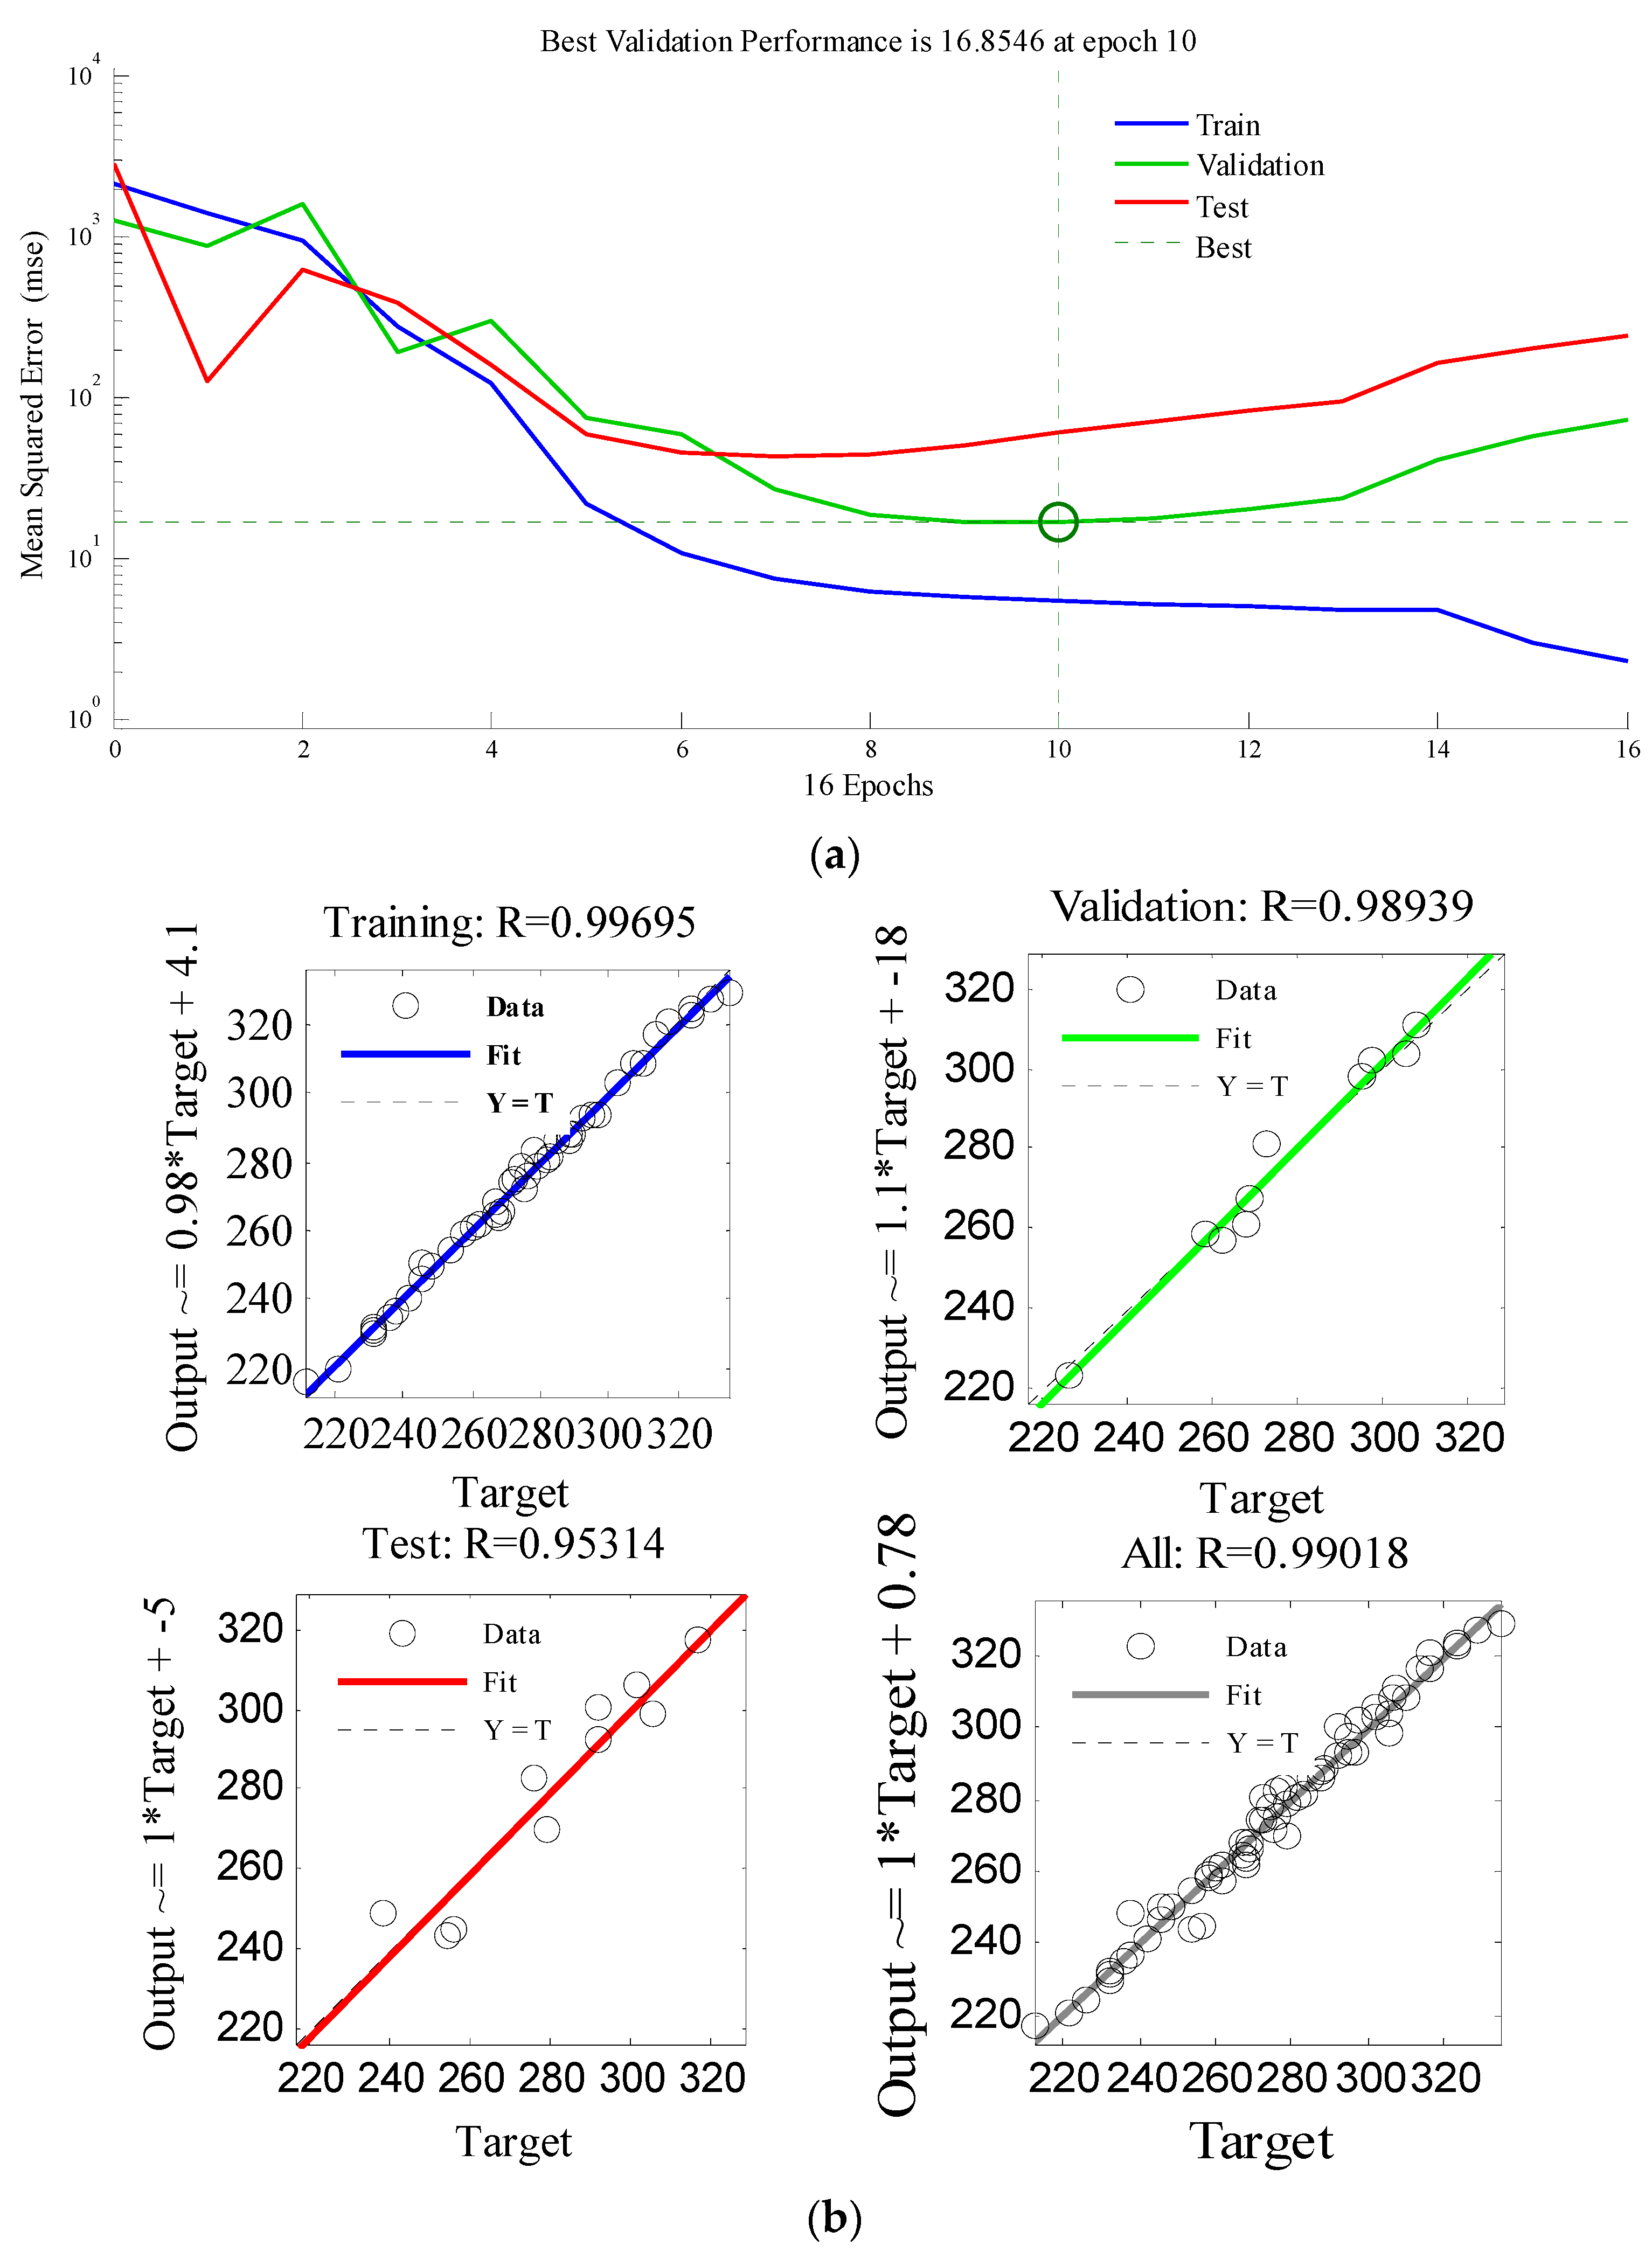
Figure 5a shows the performance, training statistics, and the convergence plots for testing and training networks of tool-chip interface temperature. The performance plot (mean square error of all data sets) is shown on a logarithmic scale. The training mean square error must show a decreasing trend. Here, the training plot shows a perfect training. The other two plots explain the network simulation results after the training. The training was terminated when the validation error increased to 16 epochs, and the best validation performance was obtained as 16.58 at 10th epoch. The test set error and the validations set error have also shown the similar characteristics.
Figure 5b shows the coefficients of regression. The R-plots explain the significance between the target (desired output) and the ANN output (actual output). The dashed line in each plot represents the targeted values (the difference between the perfect result and outputs). The best-fit linear regression line between the outputs and targets is represented by a solid line. The correlation coefficient (
R) gives the relationship between the outputs and the targets.
The maximum value of the correlation coefficient (
R2) and a minimum value of the root mean square error defines a good ANN model. For an exact linear relationship,
R must be closer or equal to one. The values of coefficients for training and testing data are founded to be 0.996 and 0.953, respectively. For a perfect fit, the distribution of data should be along a 45° line, which shows that the network outputs are equal to the targets. From
Figure 5b, it was observed that the targeted output
R for training is 0.99695, validation is 0.98939), and testing is 0.95314. The corresponding total response is 0.999018.
R = 0.999018 verifies that the ANN output perfectly matches with the target (precise linear relevance). The overall response verifies that the training has produced the optimal results, and the model can entertain the new inputs. Values of all the coefficients are very close to 1, so the training value is highly acceptable.
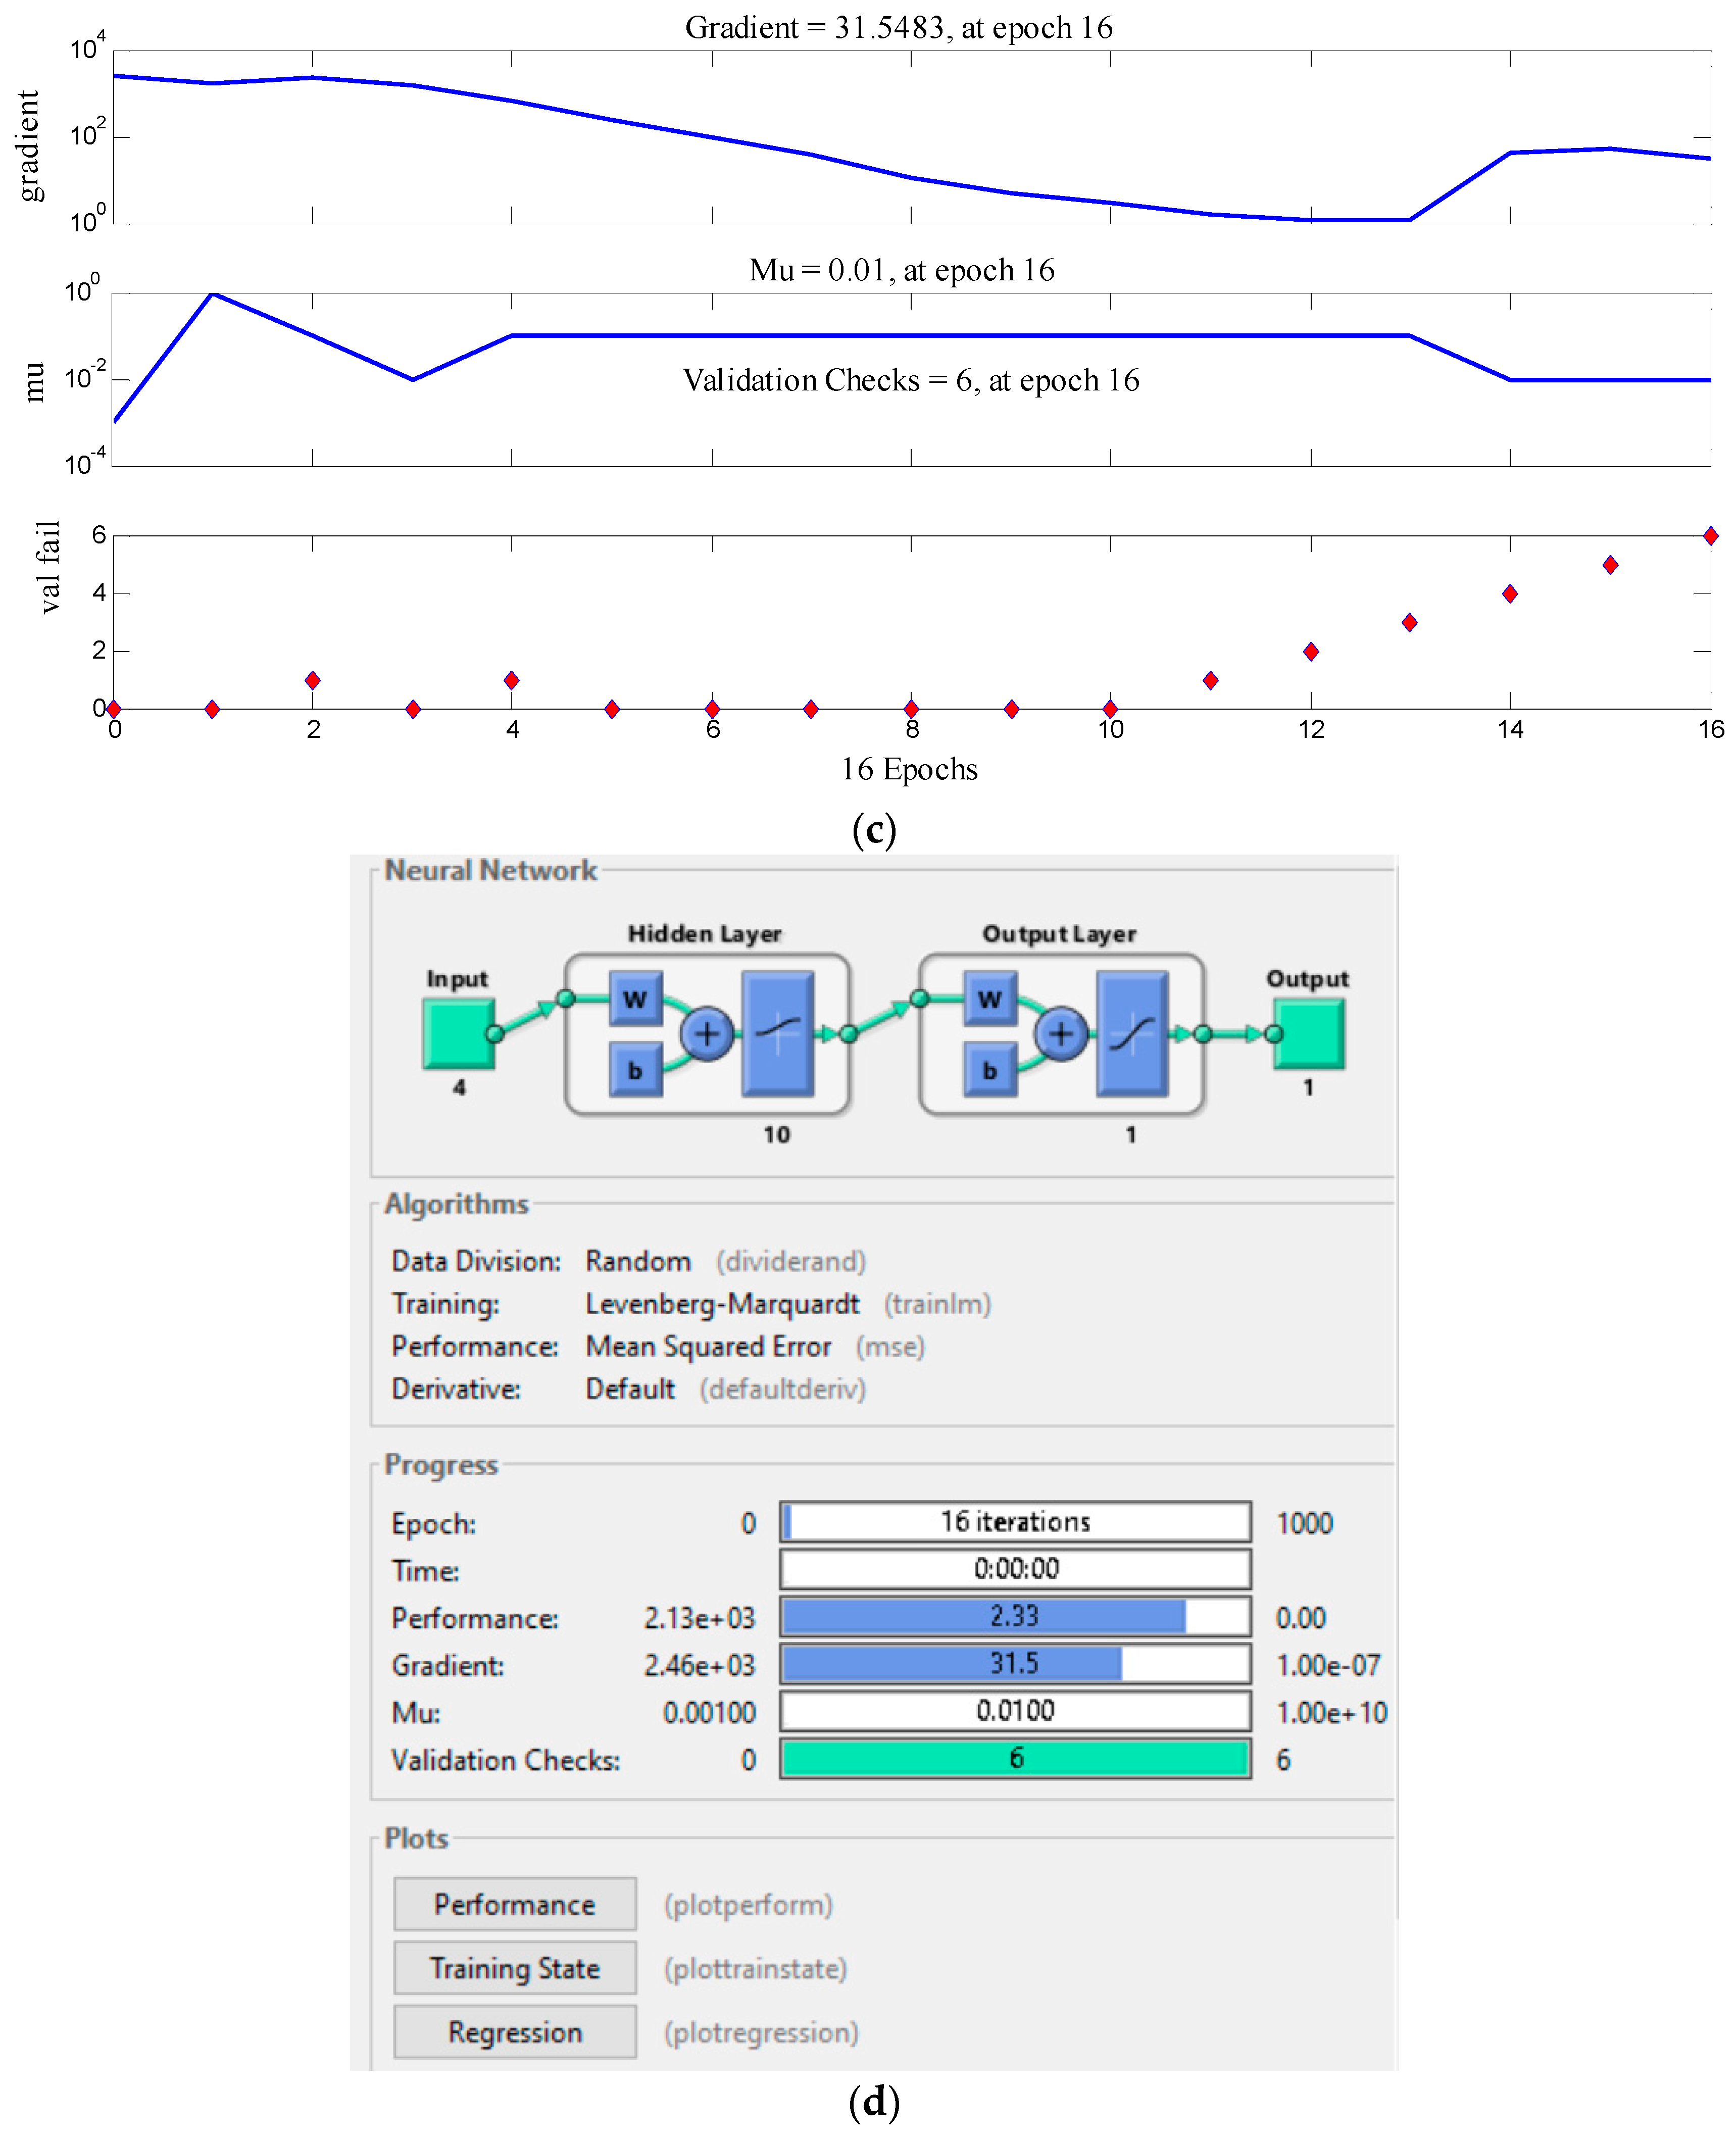
Figure 5d is a caption window that shows the validation of ANN model and also explains the output of the neural network during the training and training developments.
Figure 5c shows the model evolution, validation, and the corresponding gradient of epochs. For the temperature prediction model, the gradient of epochs was attained as 31.548.
The second ANN model for cutting reaction force was developed by keeping the same input parameters, as shown in
Figure 4. The ANN parameters for training and testing are presented in
Table 4. The training and performance evaluation of the network was accomplished with 64 data sets, given in
Table 3. The standard feedforward backpropagation neural network was considered with Log-Sigmoid transfer function (LOGSIG) and Levenberg-Marquardt algorithm. The optimized network was detected with 10 neurons in the hidden layers. The ANN predicted outcomes were evaluated by comparing with the published experimental results [
42]. The ANN predicted values and the performance curves of cutting reaction force are shown in
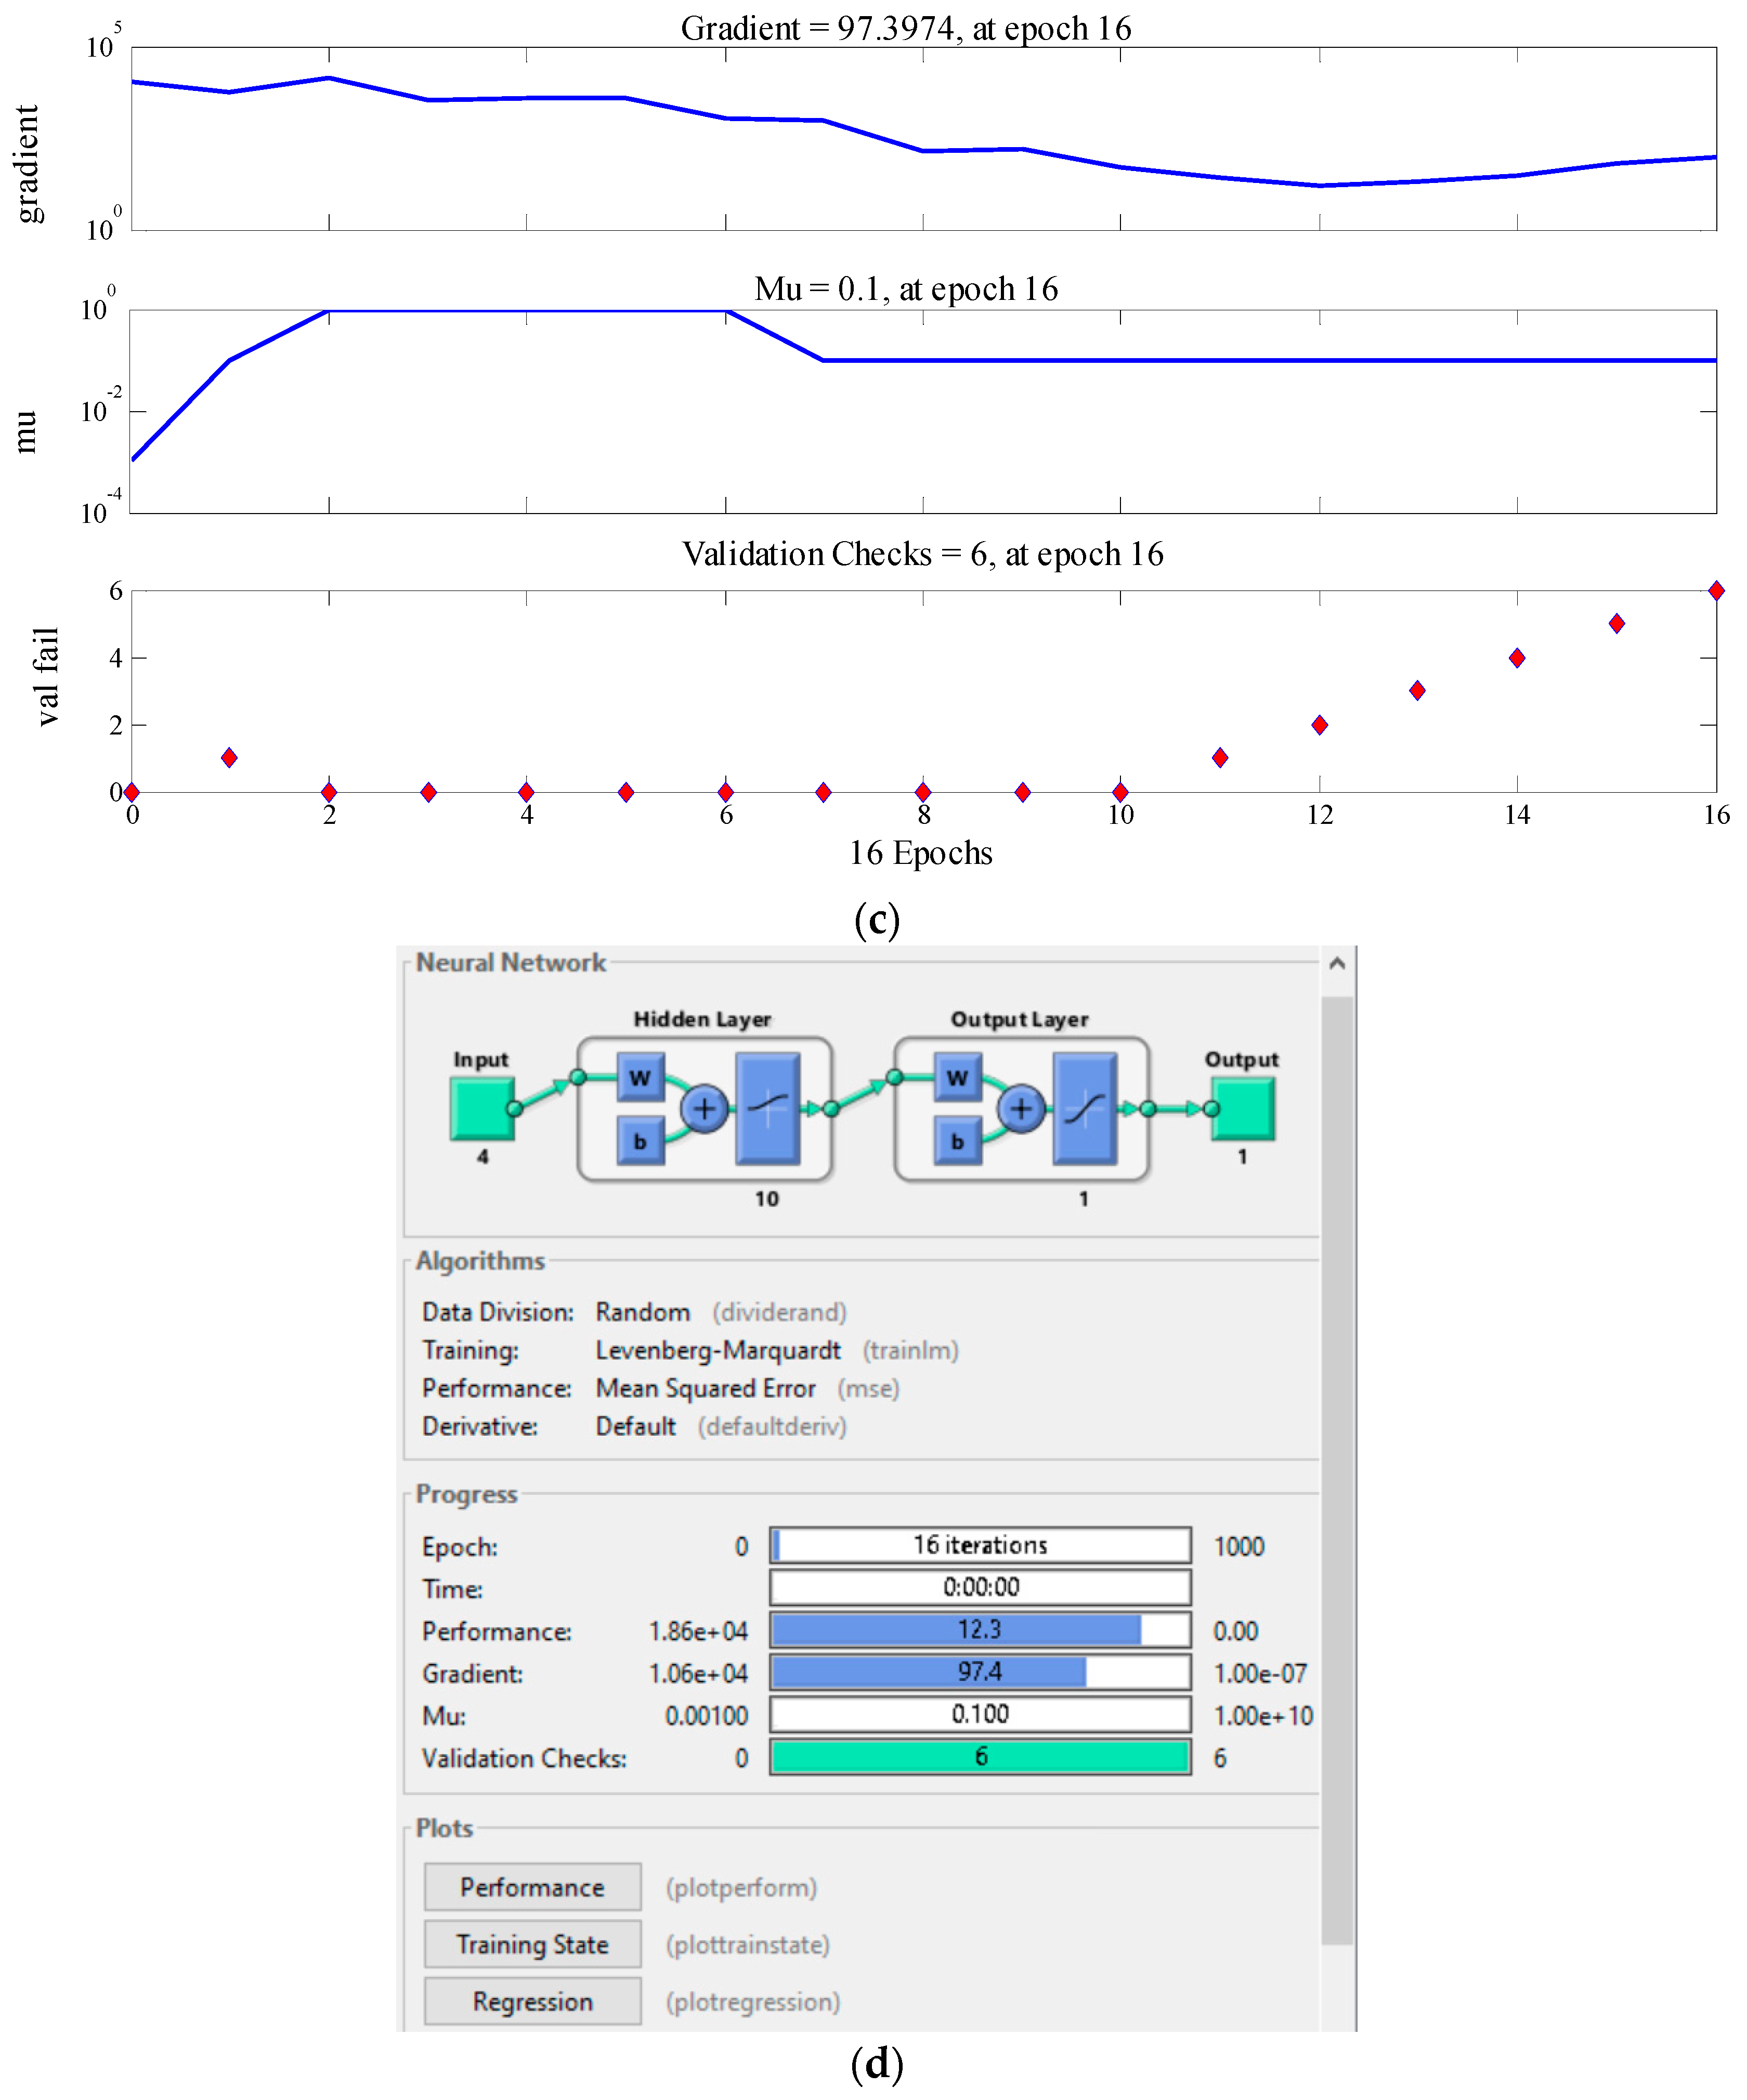
Figure 6a–d.
Figure 6a illustrates the performance, training statistics, and the convergence plots for training the network. The performance curve shown in
Figure 6a demonstrates a perfect training; the test set error, and the validation set error plots also interpret the similar characteristics. Training was completed when the validation error increased to 16 epochs, and the best validation performance was attained as 57.4402 at 10th epoch. The regression analysis is shown in
Figure 6b. The coefficients of regression value for training and testing data were attained as 0.99801 and 0.96738, respectively. The targeted output value of the validation and corresponding total response are 0.99512 and 0.98768, respectively. The overall results demonstrate a precise linear relevance and validate the model for accommodating the new inputs and simulating the final results.
Figure 5c illustrates the model validation and the corresponding gradient of epochs. The gradient of epochs was attained as 97.3974. The network configuration, the optimization scheme, and the validation of ANN model are shown as a caption window in
Figure 6d.
A comparison of the numerical simulation results with the ANN predicted values is presented in
Table 5. The term
RF_Pd gives the predicted reaction force,
Err is the error, %
Err is the percent error,
T is the chip-tool interface temperature, and
T_Pd is the chip-tool interface predicted temperature. The performance of the ANN model elaborates the deviation (error) between the actual and predicted values. In
Table 5, the maximum percentage errors of the cutting reaction force and the chip-tool interface temperature are found to be 2.55 and 3.34, respectively. The calculated errors are found reasonable and demonstrate the conformance of ANN predicted results.
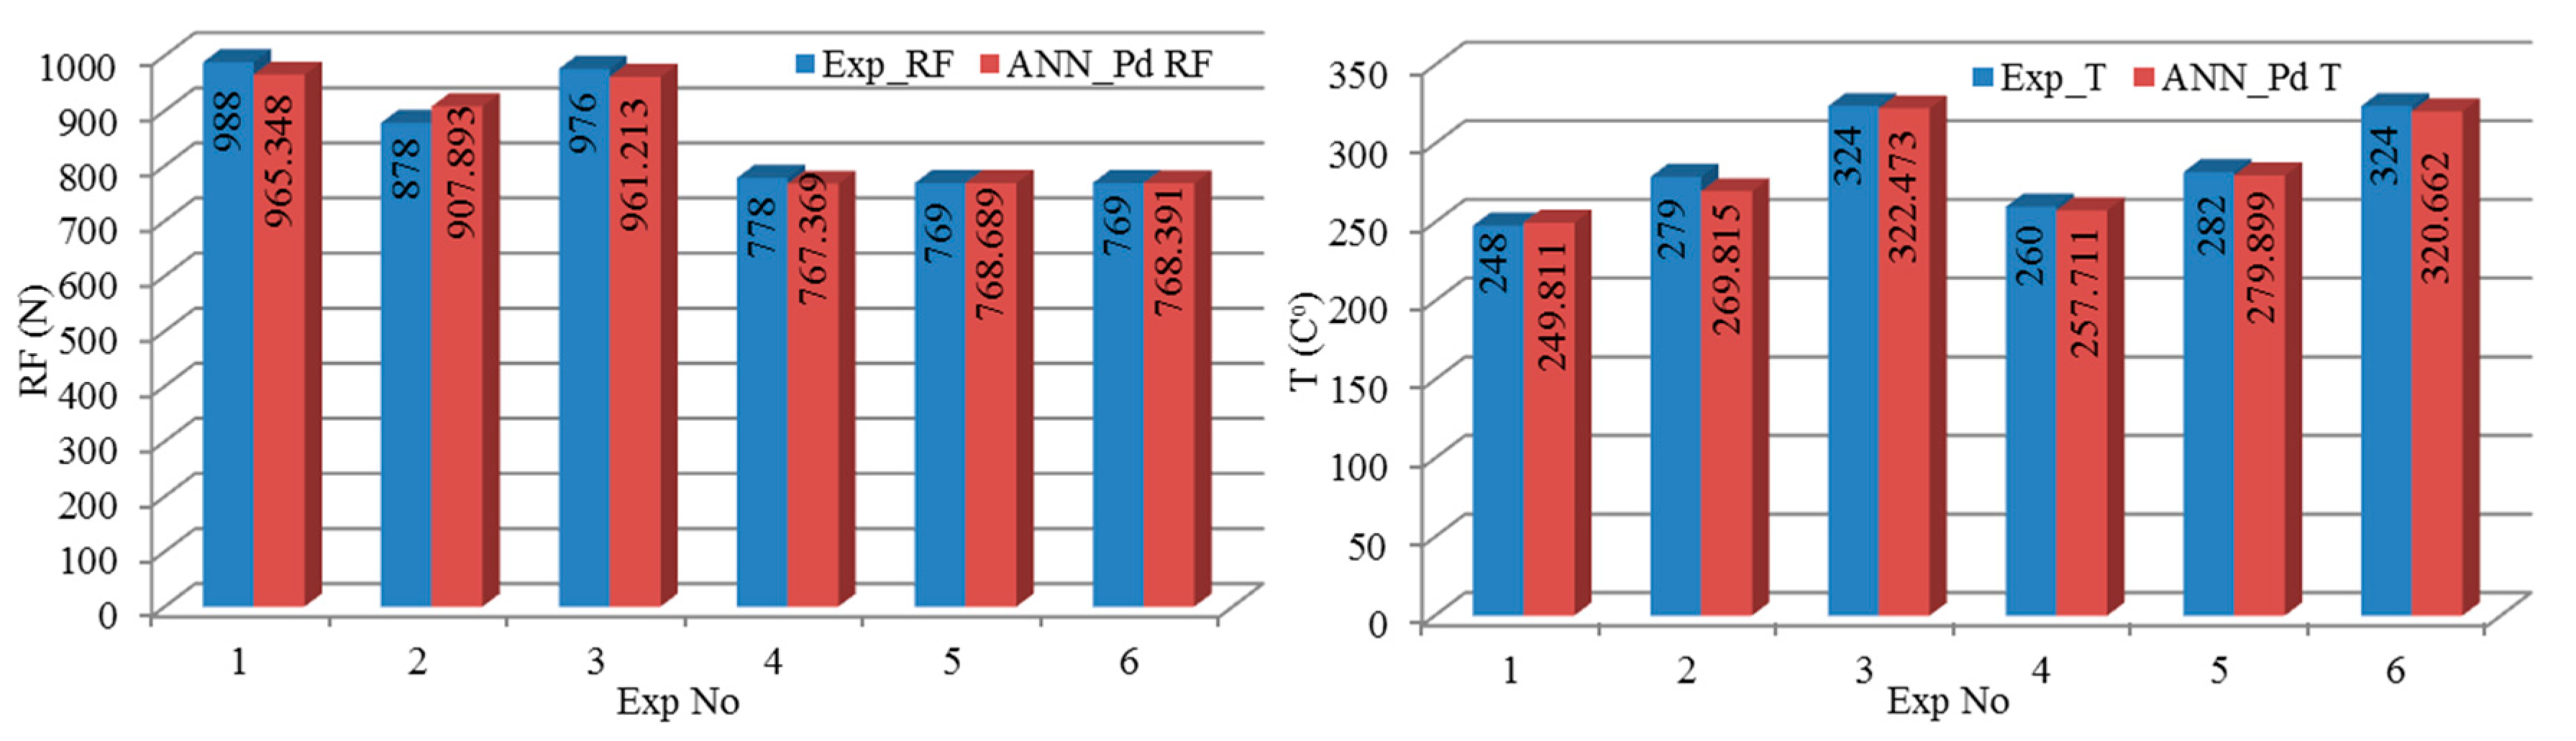
The ANN predicted values of tool-chip interface temperatures and reaction forces were compared with the experimental results [
42,
58]. Values are presented in
Table 6, where the term %
Err shows the percent error; ANN_Sim RF is the ANN simulated reaction force; Exp_
RF is the experimental value of the reaction force; ANN_Sim T is the ANN simulated temperature; and Abq Sim_
T is the Abaqus simulated chip–tool interface temperature. The ANN simulated values of cutting reaction force and tool–chip interface temperatures are found in good approximation with the experimental results [
42]. This shows that the ANN models developed for the temperature and reaction force can be used effectively for predicting the optimal parameters. The maximum percentage errors for ANN predicted reaction force and the chip–tool interface temperatures are 3.4 and 3.2, respectively.
Figure 7 implies a good agreement between experimental and ANN simulated outcomes.


 ,
, 


