Article

Researching a Fuzzy- and Performance-Based Optimization Method for the Life-Cycle Cost of SRHPC Frame Structures

1
Architectural Design Institute, Xi’an University of Architecture and Technology, Xi’an 710055, China
2
School of Civil Engineering, Xi’an University of Architecture and Technology, Xi’an 710055, China
3
School of Urban Construction, Yangtze University, Jingzhou 434023, China
*
Author to whom correspondence should be addressed.
Appl. Sci. 2017, 7(3), 269; https://doi.org/10.3390/app7030269
Submission received: 29 December 2016 / Revised: 29 January 2017 / Accepted: 7 February 2017 / Published: 8 March 2017
(This article belongs to the Special Issue Structural Health Monitoring (SHM) of Civil Structures)

Abstract

:
In order to solve two problems with the traditional optimization method of steel reinforced high strength high performance concrete (SRHPC) frame structures, a fuzzy mathematics and performance-based optimization method for the life-cycle cost of SRHPC frame structures is proposed. In the optimization program, quantitative seismic performance indicators of SRHPC frame structures are determined according to the experimental results of SRHPC columns. Furthermore, by considering the fuzzy reliability of structures under each performance level, the life-cycle optimization model of SRHPC frame structures can be established. In order to solve the problem of too many variables and constraints in the optimization process, a two-step optimization method is proposed. Finally, an optimization example is carried out through the MATLAB program to demonstrate the feasibility of this model.

Graphical Abstract

1. Introduction

In recent years, the application of cost-effectiveness criteria in the building sector has become more extensive; for example, Iannaccone and Masera [1,2] developed external insulation prefabricated panels based on cost-effectiveness criteria to reduce energy consumption in the process of building use. However, they only considered the costs and benefits of the structure from the aspect of energy; the seismic performance of the structure was not taken into account.
A structural optimization design method based on cost-effectiveness criteria with consideration of seismic performance has been widely applied in the design of steel structures [3,4,5,6,7] and reinforced concrete structures [8,9,10]. In addition, the optimal design method of steel-concrete composite elements and structures has been studied by some researchers [11,12,13,14,15]. However, there are two problems with these optimization methods: (1) they only consider the initial cost of the structures as the optimization objective, leading to poor structural performance and poor ability to resist natural disasters; and (2) there are too many optimization variables and constraints in the optimization program, leading to a complicated optimization process.
Reinforced concrete (RC) is widely applied in the building sector and, with the development of science and technology, many new concrete and structural forms have appeared (for example, fiber-reinforced concrete, high strength, high performance concrete, etc.). Steel is combined with high strength, high performance concrete to form steel reinforced high strength high performance concrete (SRHPC) composite structures [16,17]. As a kind of steel-concrete composite structure, SRHPC composite structures can make full use of the excellent mechanical properties and durability of high-performance concrete and enhance the cooperative working ability of steel and concrete [18,19,20]. Compared with RC structures, SRHPC structures have high bearing capacity, stiffness, and ductility. When the bearing capacity is equal, the section size of the SRHPC structural member is smaller, thus the overall material cost can be reduced. Although numerous SRHPC structures have been erected worldwide over the past few decades, the research and application of the optimization design of SRHSC structures is relatively scarce, which often leads to poor structural seismic performance and the waste of materials. Thus, a more efficient design optimization framework for SRHPC buildings is required.
Based on fuzzy mathematics, this paper puts forward a fuzzy theory and performance-based optimization method for the life-cycle cost of SRHPC frame structures to solve the problems discussed above. The specific research methods are as follows: (1) according to the seismic test results of the SRHPC frame columns of our research group and other researchers, the quantitative seismic performance indicators of SRHPC frame structures were determined. Based on this, the performance-based seismic design method was introduced into the structural optimization program; (2) Considering the fuzzy reliability of structures under each performance level, the fuzzy mathematics theory was introduced into the Monte Carlo method to establish the fuzzy reliability calculation method of the SRHPC frame structures; (3) Considering the fuzziness of the seismic response spectrum, a fuzzy seismic response spectrum was established, and used as the basis for the calculations of the seismic effect and reliability of the structure; (4) The reliability calculation was simplified with the explicit function of inter-story drift, and then structural fuzzy reliability calculation for different performance levels were achieved. Thereby, the fuzzy theory and performance-based life-cycle optimization model of SRHPC frame structures was established.

2. Experimental Study on Seismic Performance of SRHPC Frame Columns

Should engineers only consider the initial cost as the optimization objective, a lowest level design scheme that meets the requirements of the specification will be obtained. This scheme would not take long-term economic and social benefits into account, which decreases the ability of the structure to resist natural disasters and is likely to cause significant losses. Thus, a performance-based seismic design method was introduced into the optimization method of SRHPC frame structures to effectively solve the problem mentioned above. However, to combine the performance-based seismic design method with the optimization method of SRHPC frame structures, the following work needed to be undertaken: first, the performance objectives of the SRHPC frame needed to be set; and second, it was necessary to select and quantify appropriate performance indicators.

2.1. Determination of Performance Objectives

The determination of performance objectives was the key to the performance-based seismic design method. The seismic performance objectives referred to the maximum structural damage expected when the structure was subjected to an earthquake. In this article, the performance objectives were determined as per Chinese seismic design specifications [21], as shown in Table 1.

2.2. The Selection of a Performance Index

Once the performance objectives of the SRHPC framework were determined, a suitable performance index was chosen to describe the performance of the structure. The performance indices commonly used are a deformation index (such as inter-story drift); an energy index (such as the McCabe-Hall index); or a double index of deformation and energy (such as the Park-Ang index) [22].
The Chinese seismic design specifications [21] adopted inter-story drift to describe the three-level fortification standard, i.e., “no damage from a small earthquake, repairable after a medium earthquake, non-collapse after a severe earthquake”. Other standards, such as FEMA273, also adopted inter-story drift to define the performance level of the structure. For the above reasons, inter-story drift was selected as the performance index in the performance-based seismic optimization design of SRHPC frame structures.

2.3. Quantization of SRHPC Framework Seismic Performance Index

It was essential to quantify the seismic performance index for the optimization design of SRHPC frame structures. However, SRHPC frame structures are a new type of structure system and little research has been undertaken on its deformation ability, there is no corresponding standard or literature providing a quantization value of the inter-story drift of the SRHPC frame structures. Thus, to obtain the quantitative seismic performance indices, the test data of the SRHPC frame columns of our team and other researchers were analyzed and satisficed [23]. The results of the drift angle range under different failure patterns of the SRHPC columns are shown in Table 2.

2.3.1. The Performance Index Quantization of SRHPC Frame Structures

Based on the results shown in Table 2 and certain adjustment principles, the inter-story drift of SRHPC frame columns was adjusted to obtain the quantization value for the different seismic performance levels. The adjustment principles are as follows: (1) at the “no damage” performance level, the columns of the SRHPC frame structures should be crackless, and the allowable cracking degree of the infilled wall and the damage of non-structural components should be taken into consideration; (2) under the “repairable” performance level, the tensile reinforcement is yielded, the cover concrete of the frame columns partially spalls off, and core concrete does not crush; the shear crack width is less than 2 mm, and the residual deformation is no more than 1/400 [24]; (3) at the “serious damage” performance level, the building is on the edge of collapse. Therefore, protecting safety must be recognized as the main goal, and all factors that threaten safety should be considered.
Based on the discussion above, the seismic performance objectives of SRHPC frame structures and corresponding quantitative values were obtained and are shown in Table 3.

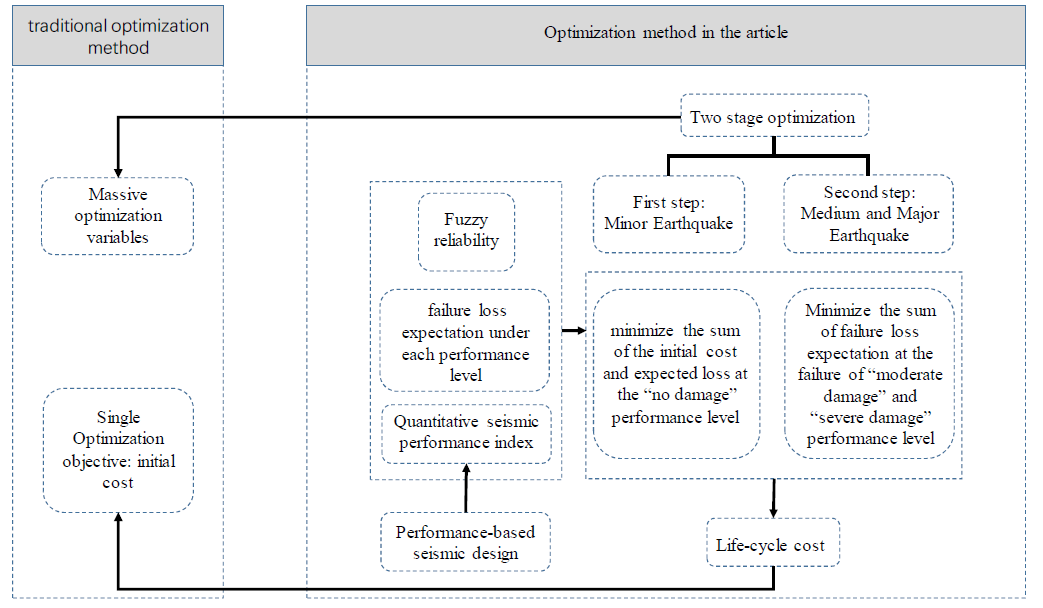
3. Performance-Based Optimization Model for the Life-Cycle Cost of SRHPC Frame Structures

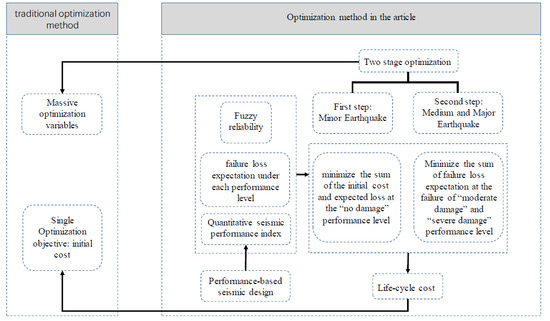
3.1. Performance-Based Life-Cycle SRHPC Frame Optimization Mathematical Model

The total cost of the structure over the life-cycle consists of three parts: (1) the initial cost of the structure; (2) the cost of structural inspection and repair; and (3) the expected loss of the structure. In general, the cost of the structural inspection and repair in the structural optimization design stage were not considered, but after the optimal design was established, we selected reasonable repair methods and maintenance time. As the cost of the structural inspection and repair is influenced by many factors such as the materials, methods, time interval of the inspection and the methods of maintenance and repair, this can make it difficult to determine cost in the design stage. Therefore, only the initial cost and the expected loss of the structure were considered in the optimization design stage.
The aim of the performance-based seismic design was an economically feasible design method pursued through optimizing the life-cycle cost. Therefore, based on the seismic optimization model that Cheng and Li [25] put forward (discussed above), and taking into consideration the fuzziness existing in seismic analysis and the structural failure of SRHPC frame structures, a fuzzy- and performance-based life-cycle cost optimization model of the SRHPC frame structures was developed. The model is shown as follows:
The design variables that needed to be solved are shown in Equation (1):
X = { x 1 , x 2 , , x n } T , X R .
The optimization object function is shown in Equation (2):
M i n W ( X ) = α 1 C 0 ( X ) + α 2 i = 1 n p C f i P ˜ f i ( X ) .
Optimization constraints are shown in Equations (3)–(5):
P ˜ f i ( X ) [ P f i ] , i = 1 , ... , n p
g j ( X ) = 0 , j = 1 , 2 , ... , p
h k ( X ) 0 , k = 1 , 2 , ... , q .
In the literature, the range of the ratio of the failure loss expectation to the initial cost of the structure under different damage levels is recommended [26]. In this paper, the mean values of the ratio ranges of each damage level were taken as the parameter to calculate the failure loss expectation and are shown in Table 4.
In Equation (2), α 1 and α 2 are weighted coefficients used to reflect the importance of different structures. With the decrease of α 1 , α 2 becomes larger, which means that the loss caused by structural failure is also larger and the structure is more important. By comparing the reliability of the SRHRC frame structure with the different weight coefficients shown in Section 5.2, it can be seen that the structure reliability index is stable when the weight coefficient α 1 is [0.4, 0.6]. Therefore, the weighting factors α 1 = 0.4, α 2 = 0.6 were recommended for the SRHPC frame structures.

3.2. The Calculation Method of SRHPC Frame Structure’s Optimization in Stages

A reasonable design result of the SRHPC frame structure was obtained by using the method proposed in the Chinese seismic design specifications before optimization. Meanwhile, by considering the fact that concrete strength grade and steel yield strength were identified before design, and the change in longitudinal bars has little effect on the seismic performance of SRHPC frame structures, the parameters mentioned above were taken as the constants, and the beam, column section size, and steel section size were taken as optimization variables of the optimization model. In summary, the optimization design variables of the life-cycle optimization model of the SRHPC frame structures are:
X = [ b i j , c h i j , c b i j , b h i j , b b i j , c a f b i j , b a f t i j , c a f t i j , b a f h i j , c w h i j , b w t i j , c w t i j , b w d i j , c s v d i j , b s v s i j , c s v s i j , b s v ] .
In order to simplify the optimization process and effectively control the number of design variables and constraints, the optimization process was divided into two stages:

3.2.1. The First Optimization Stage under a Minor Earthquake

1. Design Variables
In the first stage, in order to minimize the sum of the initial cost of the structure and the expected loss at the “no damage” performance level, the beams, column section size, section area of section steel, and stirrup’s reinforcement ratio of beam and column were optimized at this stage. Due to the influence of the height of beams and columns being greater than that of width on structural seismic behavior, this paper only takes the height of the section as one design variable, and the width of the section was determined by its aspect ratio according to standard design requirements. The design variable vector X in the first optimization stage is shown in Equation (7):
X = [ b i j , c h i j , c h i j , b A i j , c a A i j , b a A i j , c w A i j , b w ρ i j , c s v ρ i j , b s v ] .
2. Optimization Objective
The optimization objective in the first stage is shown in Equation (8):
M i n W ( X ) = α 1 C 0 ( X ) + α 2 C f s P ˜ f s .
3. Constraints
(1) Capacity Constraints
The capacity constraint of the column is shown in Equation (9):
V i j , c 1 γ R E ( 0.16 λ i j , c + 1.5 f c b i j , c h 0 i j , c + 0.8 f y v A i j , c s v s i j , c s v h 0 i j , c + 0.58 λ i j , c f a A i j , c w + 0.056 N i j , c ) .
The capacity constraint of the beam is shown in Equation (10):
V i j , b 1 γ R E ( 0.06 f c b i j , b h 0 i j , b + 0.8 f y v A i j , b s v s i j , b s v h o i j , b + 0.58 f a A i j , b w ) .
(2) Construction requirements;
(3) The performance requirement under a minor earthquake is shown in Equation (11):
Δ s i [ Δ s ] .
(4) The requirements of conceptual design are shown in Equation (12):
E c I i j , c c + E a I i j , c a 1.4 ( E b I i j , b b + E a I i j , b a ) .

3.2.2. The Second Optimization Stage under a Medium or Major Earthquake

1. Design Variables
Second stage optimization is the detailed optimization of the section size of steel after obtaining the section size of the beam column and the section area of the steel; the optimization design variable vector in this stage is shown in Equation (13):
X = [ b i j , c a f b i j , b a f t i j , c a f t i j , b a f h i j , c w h i j , b w t i j , c w t i j , b w ] .
2. Objective Function
The sum of failure loss expectation of a structure corresponding to the failure of “moderate damage” and “severe damage” performance level was the optimization objective in the second stage. The objective function is shown in Equation (14):
M i n W ( X ) = C f m P ˜ f m + C f l P ˜ f l .
3. Constraints
(1) Construction requirements;
(2) Ductility constraint of SRHPC frame column.
The frame columns should have good ductility as it gives the structure plastic internal force redistribution, which gives full play to the ability of each component and prevents brittle failure. In order to ensure the sufficient ductility of the component, the ductility coefficient of frame column should meet Equation (15):
μ i j , c = 65.45 ( f c ) 0.551 ( ρ i j , c v ) 0.36 × ( N i j , c f c A i j , c c + f a A i j , c a ) 0.665 3 .
(3) Performance requirements under a medium or major earthquake are shown in Equation (16):
Δ m i [ Δ m ] ,   Δ l i [ Δ l ] .
Comparing the number of optimization variables in Equations (6), (7), and (13), it can be seen that for each stage of optimization, the number of optimization variables was reduced. At the same time, the column ductility constraints and the performance requirements under a medium or major earthquake do not need to be considered during the first stage of the optimization process, and the bearing capacity constraint does not need to be considered during the second stage of the optimization process. Therefore, the number of constraints in each stage is also reduced, which effectively simplifies the optimization process.

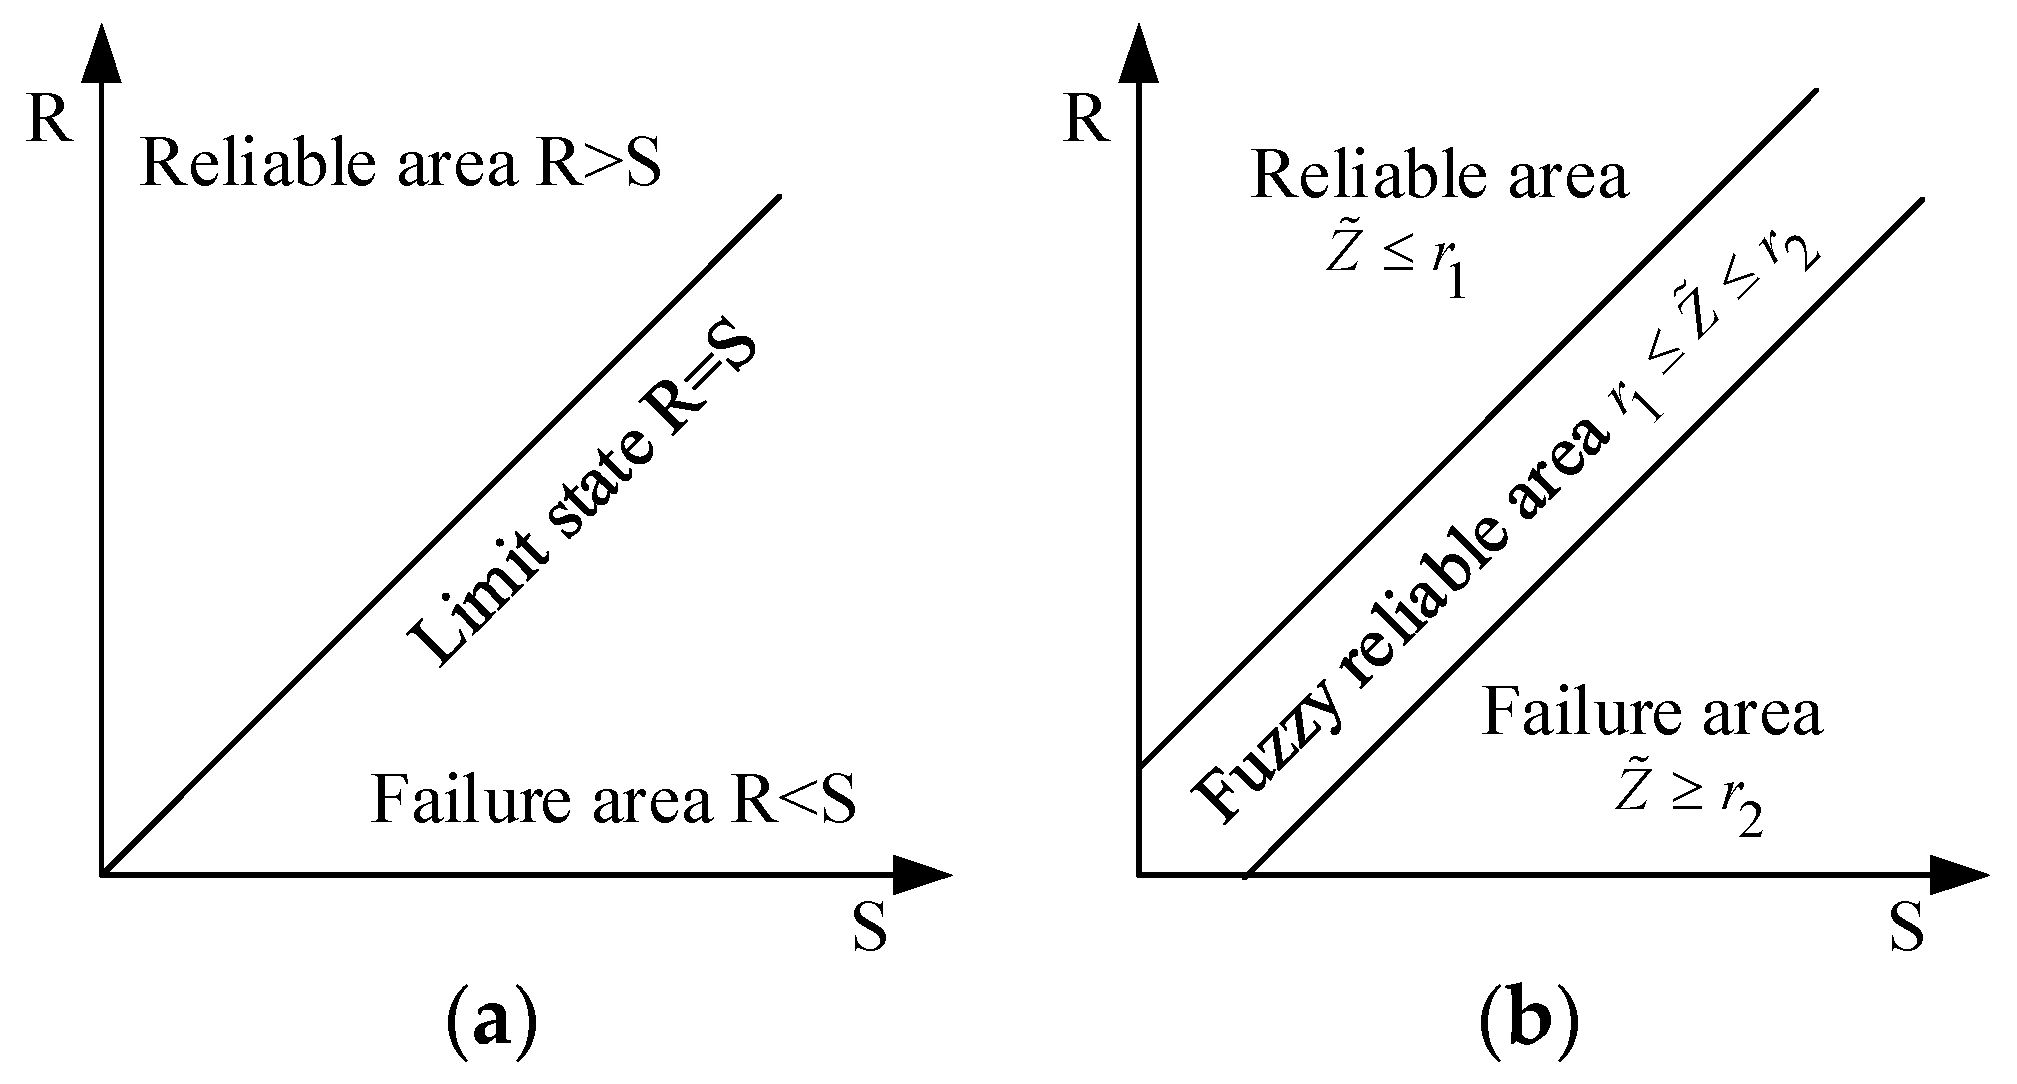
4. The Calculation of Reliability Based on Fuzzy Mathematics

In traditional reliability analysis theory, the calculation of structural failure probability is from the perspective of certainty, which is unreasonable due to the definite limit value being used to determine structural failure and the fuzziness of structure failure being ignored. Therefore, this paper introduced fuzzy mathematics to calculate fuzzy failure probability, which is needed to solve fuzzy loss expectation in terms of life-cycle cost and the multi-objective optimization model of SRHPC frame structures.
The performance function to calculate performance-based seismic reliability of SRHPC frame is shown in Equation (17):
f ( u 0 , X , P ) = u 0 u ( X , P ) ,
where u 0 is the random variable used to express the structural resistance term that represents inter-story drift, whose standard value has been shown in Table 3; u ( X , P ) is the load effect term, which also represents the story drift (only horizontal earthquake action is considered in this paper), where X is a random variable vector related to the attribute of the structure itself (e.g., component size, material characteristics, etc.) and P is a random variable vector related to loading.

4.1. The Calculation Method of Fuzzy Reliability

Among the general set U 1 = { u 1 , u 2 , ... , u m } , the membership of every element is definite, which means that whether an element belongs to set U —or not—is certain. However, due to the natural characteristics of the thing itself, many sets do not have a definite boundary to provide a clear definition and evaluation standard. This uncertainty is called fuzziness and a subset that has a fuzzy boundary is called a fuzzy subset. Zadeh (1965) proposed using a value in a closed interval [0, 1] to represent the subordinative degree of element u i to fuzzy subset A ˜ , which is called the “membership degree”, and expressed by A ˜ ( u i ) and is usually denoted by u i , A . Obviously, the greater u i , A , the higher the subordinative degree. When u i , A is equal to 1, element i belongs to subset A. In contrast, when u i , A is equal to 0, element i does not belong to subset A absolutely. The general set is a special case of fuzzy set.
When using traditional reliability theory to judge the reliability of a structure, the state of the structure jumps directly from reliability to failure, as shown in Figure 1a. However, in practical engineering, the process of a structure’s state from reliability to failure is gradual and there exists a fuzzy transition state, as shown in Figure 1b, so the deterministic failure criterion is neither scientific nor does it correspond to the actual engineering.
To solve the problem that exists in traditional reliability theory, this paper adopted the membership function of fuzzy performance function Z ˜ to express this gradual process, which considers the fuzziness existing in structural failure. A performance function that can consider the fuzziness of structural failure is shown in Equation (18):
Z ˜ = R ˜ S ˜ .
There are several methods to develop membership function, e.g., the fuzzy statistical method, the assignment method, using “objective measurement” for reference and dualistic contrast compositor, etc. Due to the necessity of a large body of fuzzy statistics and expert evaluation for the establishment of a reasonable membership function, the assignment method was adopted for the sake of simplicity and the half-ladder type distribution was assumed as the membership function. Based on this, the membership function of fuzzy performance functions is shown in Equation (19):
A ˜ ( z ) Z ˜ = { 1 z r 1 z r 2 r 2 r 1 r 1 < z < r 2 0 z r 2 .
When the membership function of fuzzy performance function was established, the value of the upper and lower bounds r1, r2 of the fuzzy transition area needed to be determined, i.e., “the tolerance”. There are many ways to determine “the tolerance”, in which the amplification coefficient method in Reference [27] is commonly used in engineering and is also adopted in this paper. Based on conventional design experience, an amplifying coefficient λ (0.05—0.4 times of general allowable values) was introduced to determine “the tolerance” of fuzzy intervals in this method. For SRHPC frame structures, using coefficient λ to multiply the value of inter-story drift limit values corresponding to different performance levels are shown in Table 3, and “the tolerance” of the fuzzy membership function corresponding to the different performance level of SRHPC frame structures can be obtained.

4.2. The Calculation Method of Structural Reliability

When calculating the reliability of the structure through a direct analytical method, the joint density function of the basic random variable must be obtained and multiple integrations must be calculated, but it is often difficult to achieve a satisfactory result. However, as a method to calculate structural reliability, the Monte Carlo method has certain advantages: the computed results will not be influenced by the function form; any distribution can be considered; and the calculation process can be conducted by a computer program with good stability. Therefore, this method was chosen to calculate the reliability of structures by programming [28].
The membership function of fuzzy performance functions Z ˜ was adopted to represent the gradual process from reliability to the failure of the structure. According to fuzzy random probabilistic theory, the fuzzy failure probability of SRHPC frame structure is shown in Equation (20):
P ˜ f = P ( Ω ˜ ) = + f ( z ) μ ( z ) d z ,
where Ω ˜ is the fuzzy failure event of frame structure; f ( z ) is the probability density function used to show the randomness of a structural failure event; and μ ( z ) is the membership function used to show the fuzzy of structural failure event.
To describe the fuzzy transition area of structural failure, the indicator function I [ g ( X i ) ] in the traditional Monte Carlo method was replaced by the membership function of fuzzy function Z ˜ , as shown in Equation (21):
I [ g ( X i ) ] = { 1 z i r 1 z i r 2 r 2 r 1 r 1 < z i < r 2 0 z i r 2 ,
where X i = ( x i 1 , x i 2   , x i n ) is the ith sample vector of the random vector X = ( x 1 , x 2   , x n ) . The moment estimation value of structural failure probability can be calculated through Equation (22):
P ^ f = 1 N i = 1 N I [ g ( X i ) ] = n f N ,
where N is the total sample number.
The sample variance of moment estimation is shown in Equation (23):
σ ^ 2 = 1 N P ^ f ( 1 P ^ f ) .

4.3. Fuzzy Seismic Spectra

In order to obtain the load effect S in the performance function—which is presented in the form of story drift—the seismic response spectra will be discussed.
The seismic response spectrum in Chinese seismic design specifications [21] contains three fuzzy factors: seismic intensity; site classification; and classification of design earthquake. Classification of design earthquake is a parameter used to reflect the epicenter distance. According to Chinese seismic design specifications [21], most areas in China only take nearby earthquakes into consideration in seismic design, and few areas need to consider distant earthquakes (approximately 5% of the county towns). Therefore, this paper does not take into consideration the fuzziness of classification of the design earthquake, but defines it according to the specifications. The method used to assess the fuzziness of seismic intensity and site classification, and components of the seismic response spectrum, is discussed below.

4.3.1. Fuzziness of Seismic Intensity

Owing to historical reasons, earthquake academics and engineers still use discrete settings of seismic intensity, such as the 12 seismic intensity grades shown in Equation (24).
U = { I 1 , I 2 , ... , I 12 } = { 1 , 2 , ... , 12 } ,
where I i and the number represent the grade of seismic intensity.
Due to the variation of damage caused by earthquakes, seismic intensity, as a comprehensive measure of earthquake intensity, should be continuous and not divided into different grades. Thus, if degree 12 is still the highest intensity, the seismic intensity should be a continuous value on the real axis, and its value range should be a closed interval (Equation (25)), not discrete points.
Z = { I | I [ 0 , 12 ] } = [ 0 , 12 ]
As discussed above, the fuzziness of seismic intensity is due to the use of a discrete set of seismic intensity indicators to represent the variation in damage caused by earthquakes. Seismic intensity can become a deterministic variable without fuzziness when it is regarded as an earthquake intensity index that changes continuously. In this way, seismic intensity is actually a representation of ground motion parameters. In the seismic response spectrum shown in the Chinese seismic design specifications [21], seismic intensity represents the maximum of horizontal seismic coefficient α m a x .
When the discrete seismic intensity is transformed into a continuous variable, the relationship between α m a x and seismic intensity is shown as Equation (26):
α max = 0.04 × 2 ( I 6 ) .

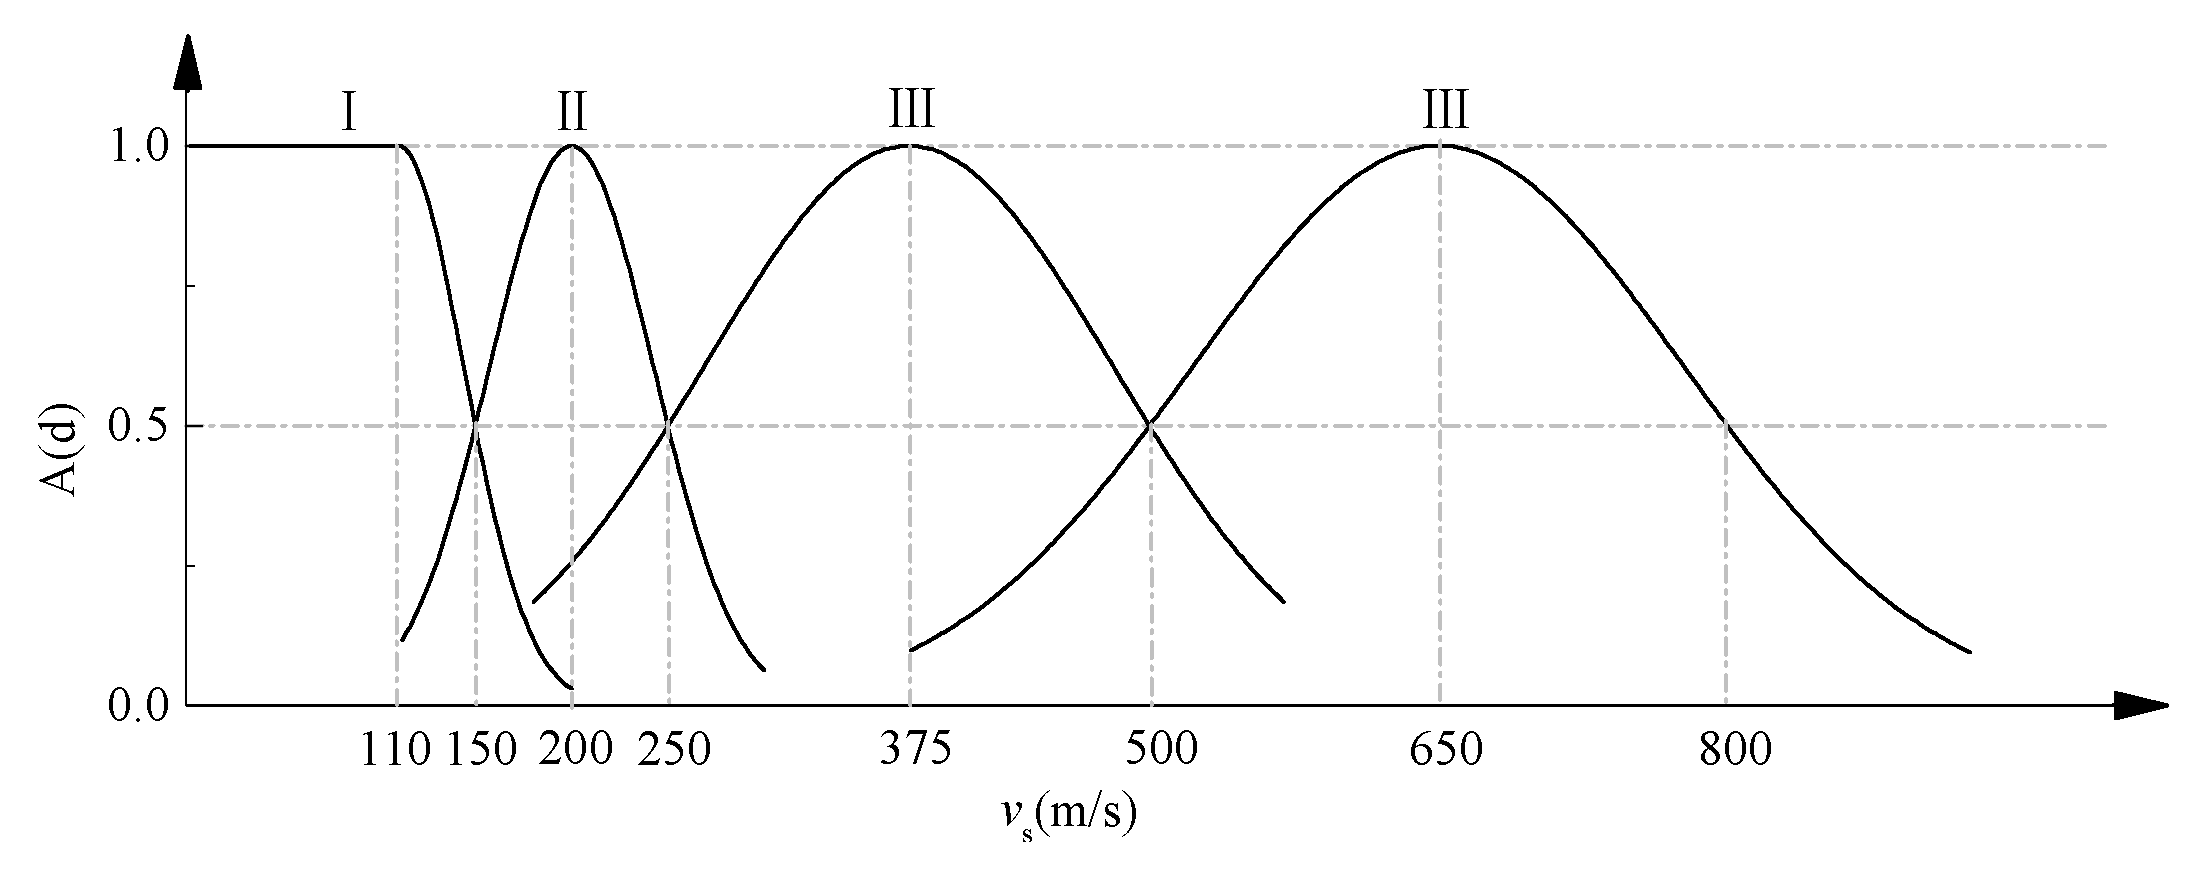
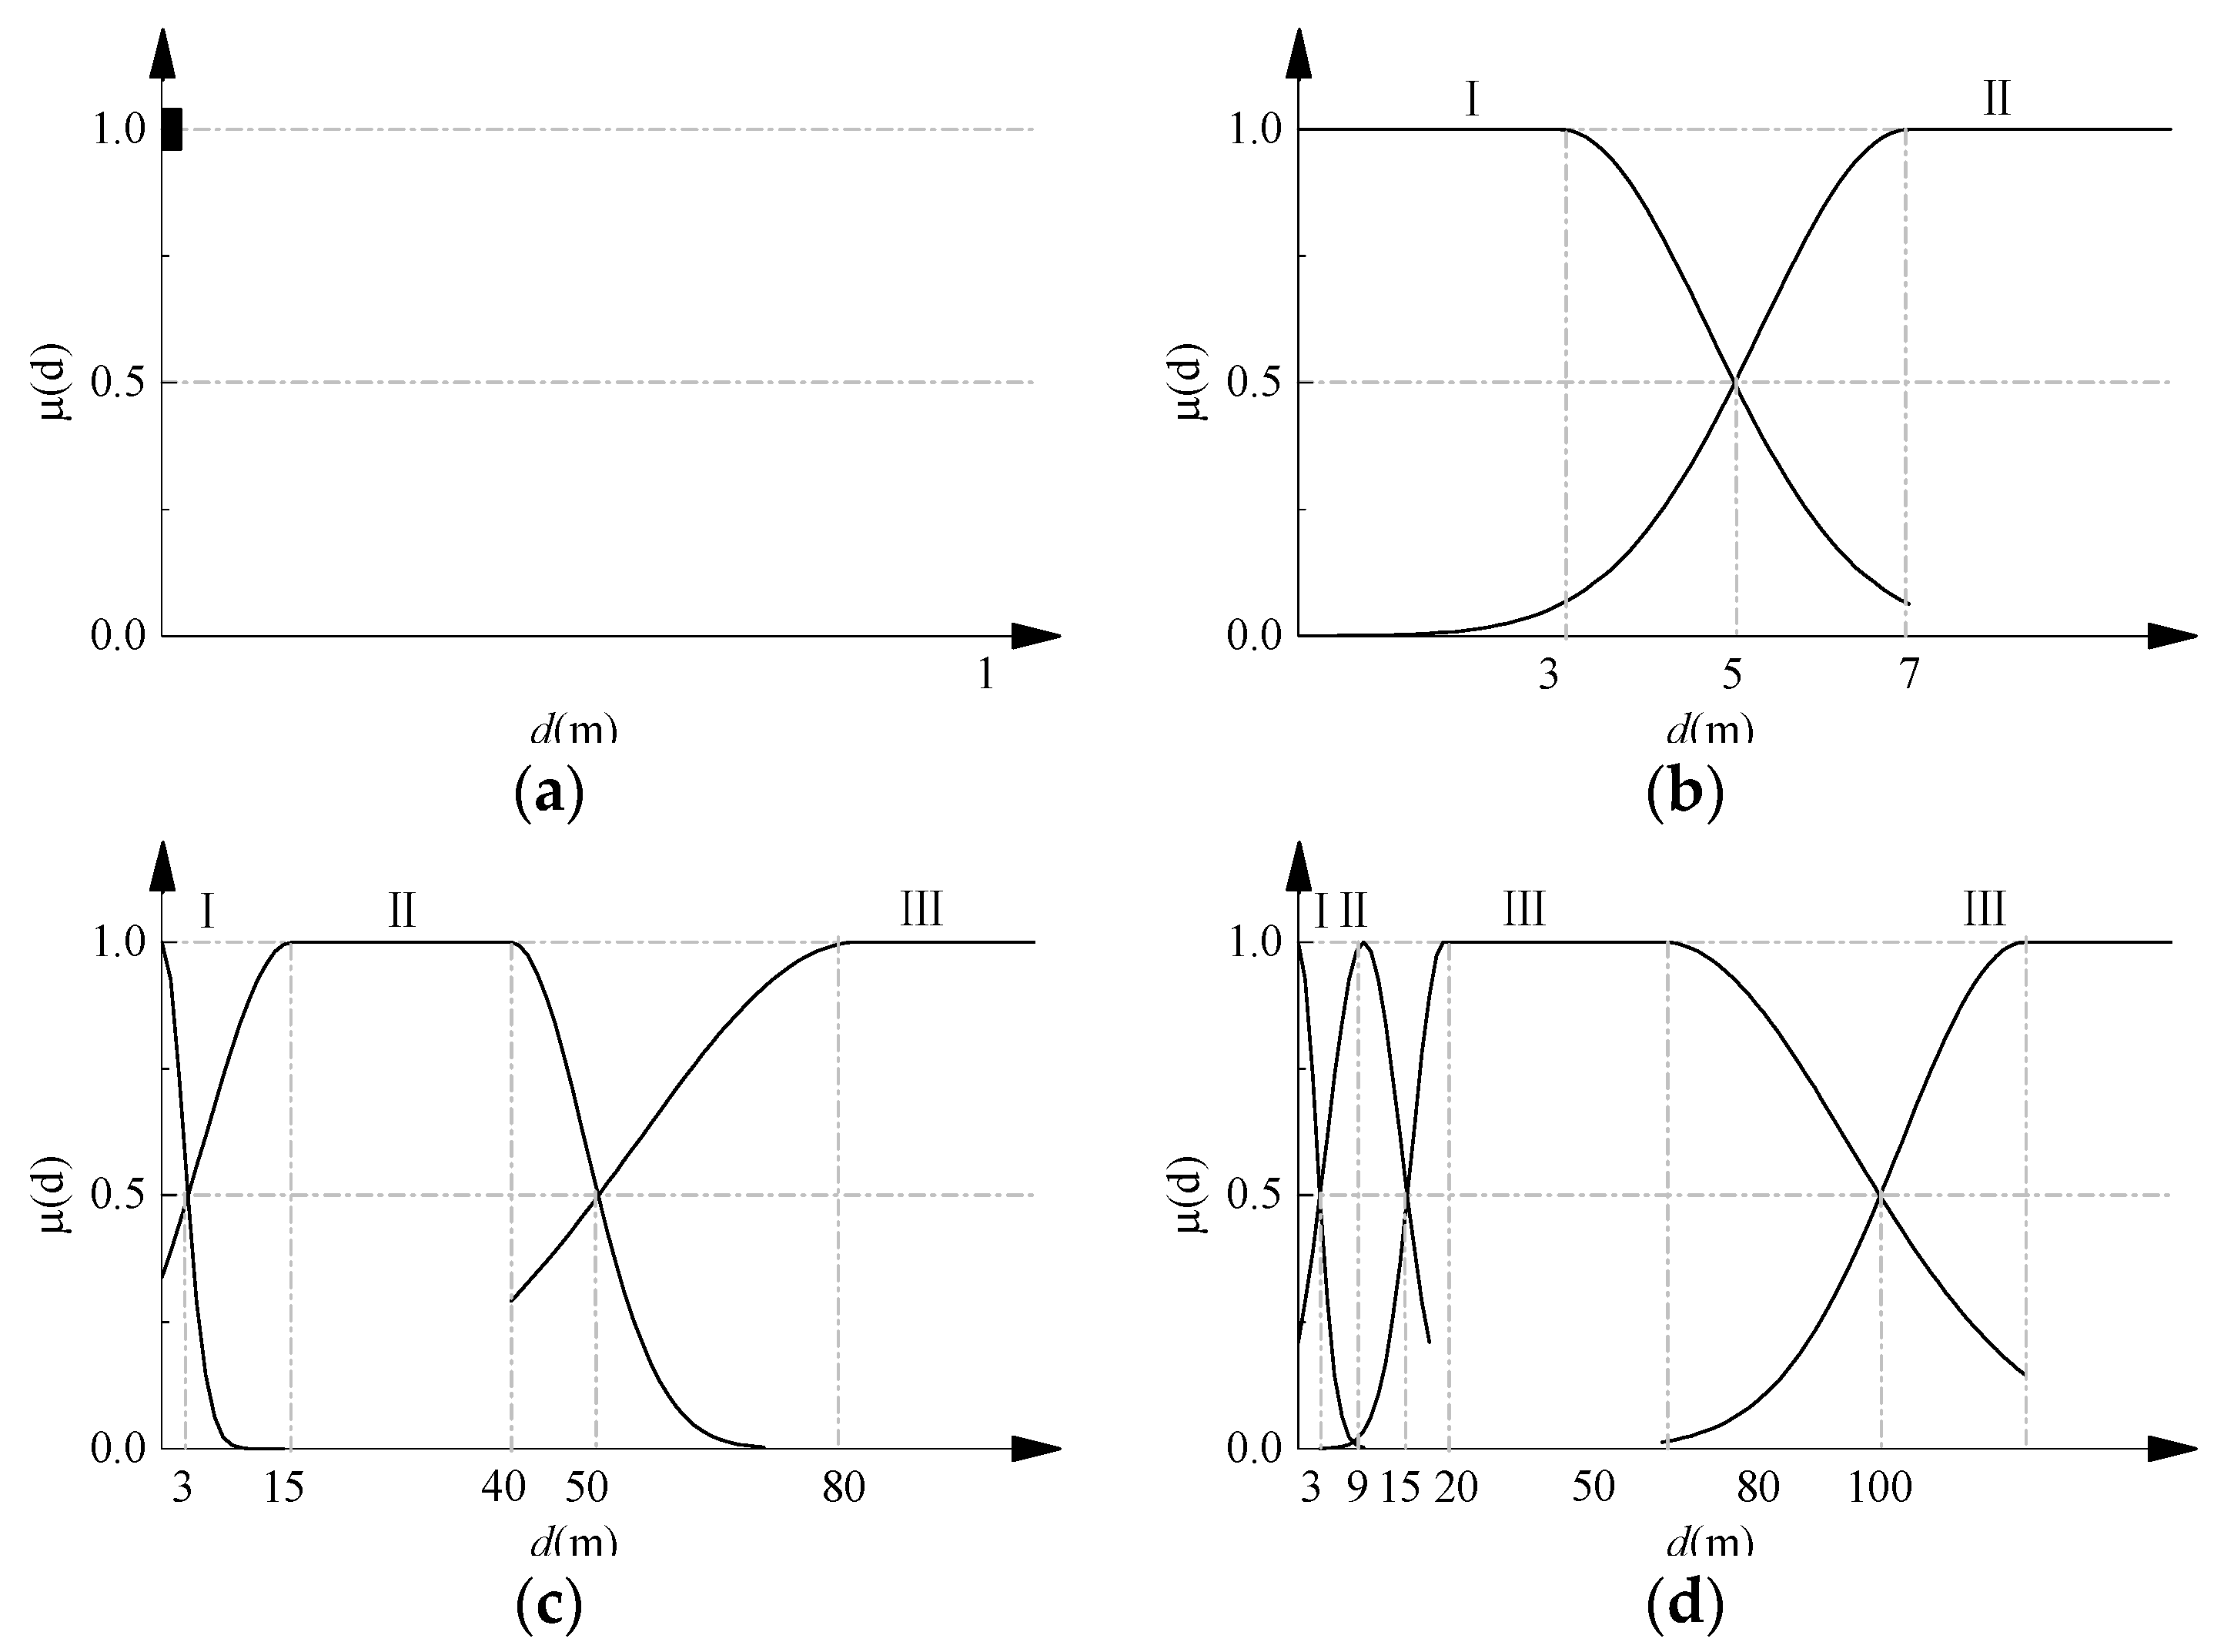
4.3.2. Fuzziness of Site Category

The construction site is divided into four classes (Class I, II, III, IV, respectively) in the Chinese seismic design specifications [21] based on the mean shear wave velocity and the thickness of the overburden. Furthermore, Class I is also divided into two sub-classes, I 0 and I 1 . The classification approach mentioned above is convenient for engineers to use, but it is quite difficult to accurately identify the class of a site based on the site definition, especially for sites with high fuzziness that are near the boundary of two adjacent classes.
The fuzziness of site classification is determined by the complexity of the site, and cannot be eliminated by mathematical methods. However, in this paper, fuzzy grade vector W was first obtained on the basis of fuzzy comprehensive evaluation, before a comprehensive evaluation value T g [21] was obtained; this is a non-fuzzy variable and is related to site classification.
Only when the mean shear wave velocity of a site is v s > 800 , and the overburden thickness is 0 does the site belong to Class I 0 , so there was no need to do a fuzzy comprehensive evaluation of site I 0 [21].

4.3.3. Fuzzy Comprehensive Evaluation of Site Classification

According to item 4.1.6 in the Chinese seismic design specifications [21], mean shear wave velocity and overburden thickness are taken as the main evaluation factors of site classification, and the normal function shown in Equation (27) was assigned as the membership function of different evaluation factors:
μ ( x ) = exp [ ( x m j b j ) 2 ] ,
where m j and b j are used to reflect that the membership function of two adjacent site classes has the same value at its demarcation point and m j = 0.5 ( x j + x j + 1 ) , b j = 0.6 ( x j + 1 x j ) , x j , and x j + 1 are threshold values of adjacent site classes.
The evaluation factor set of mean shear wave velocity U1 and overburden thickness U2 corresponded to the evaluation grade domains V and W of the site, respectively. Due to the difference in the evaluation grade domain, this paper adopted the fuzzy operator M ( , + ) and the two-step evaluation method to carry on multi-factor comprehensive evaluation of site classification.
(1) First-step Evaluation
As discussed above, U 1 = { u 1 } is a single factor set, where μ 1 is the evaluation factor for the equivalent shear wave velocity; V = { v 1 , v 2 , v 3 , v 4 } is a fuzzy vector of site classification evaluation grade domain where ν 1 , ν 2 , ν 3 , ν 4 are the membership of a site in Class I, II, III, or IV, respectively. A = { a 1 , a 2 , a 3 , a 4 } is a corresponding single factor fuzzy relation vector, where a i is the membership of the mean shear wave velocity to site classification.
During first-step evaluation, there is only one evaluation factor, i.e., equivalent shear wave velocity, so the fuzzy relationship mentioned above is the membership degree of the equivalent shear wave velocity to the site classification.
Thus, we can calculate the membership function of equivalent shear wave velocity from the Chinese seismic design specifications [21] and Equation (27). The mathematical and graphic expression of this function are shown in Equation (28) and Figure 2, respectively.
A 1 ( v s ) = { 1 0 < v s 110 e ( v s 110 48 ) 2 v s > 110
A 2 ( v s ) = e ( v s 200 60 ) 2 , v s > 0
A 3 ( v s ) = e ( v s 375 150 ) 2 , v s > 0
A 4 ( v s ) = e ( v s 650 180 ) 2 , v s > 0
(2) Second-step Evaluation
W = { w 1 , w 2 , w 3 , w 4 } is the evaluation grade fuzzy vector of site classification where w 1 , w 2 , w 3 , w 4 are the membership of a factor to four site classes. The fuzzy relation matrix of overburden thickness is shown in Equation (29):
B = [ b 11 b 12 b 13 b 14 b 21 b 22 b 23 b 24 b 31 b 32 b 33 b 34 b 41 b 42 b 43 b 44 ] ,
where brs (r = 1, 2,…4; s = 1, 2,…4) is the membership of the overburden thickness of the rth site category to the sth site category. The evaluation grade fuzzy quantity of site classification W can be obtained based on a comprehensive evaluation. W = V B = V ( , + ) B , where, V is the measurement matrix of the evaluation factors.
Based on the Chinese seismic design specifications [21] and Equation (27), the mathematical and graphic expression of the membership functions of overburden thickness are shown in Equations (30)–(33) and Figure 3a–d, respectively.
When 800 ≥ vs > 500,
μ 1 ( d ) = { 1 d = 0 0 d > 0
μ 2 ( d ) = 0 , d 0
μ 3 ( d ) = 0 , d 0
μ 4 ( d ) = 0 , d 0 .
When 500 ≥ vs > 250,
μ 1 ( d ) = { 1 0 < d 3 e ( d 3 2.4 ) 2 d > 3
μ 2 ( d ) = { e _ ( d 7 2.4 ) 2 0 < d < 7 1 d 7
μ 3 ( d ) = 0 , d 0
μ 4 ( d ) = 0 , d 0 .
When 250 ≥ vs > 150,
μ 1 ( d ) = e ( d 3.6 ) 2 , d > 0
μ 2 ( d ) = { e ( d 15 14.4 ) 2 0 < d < 15 1 15 d 40 e ( d 40 12 ) 2 d > 40
μ 3 ( d ) = { e ( d 80 36 ) 2 0 < d 80 1 d 80
μ 4 ( d ) = 0 , d > 0 .
When vs ≤ 150,
μ 1 ( d ) = e ( d 3.6 ) 2 , d > 0
μ 2 ( d ) = e ( d 9 7.2 ) 2 d > 0
μ 3 ( d ) = { e ( d 20 6 ) 2 0 < d < 20 1 20 d 50 e ( d 50 36 ) 2 d > 50
μ 4 ( d ) = { e ( d 100 24 ) 2 0 < d < 100 1 d 100 .
(3) Comprehensive evaluation of site characteristic period T g
As per the site characteristic period value given in Table 5.1.4.2 of the Chinese seismic design specifications [21], the calculation method for site characteristic period T g is shown in Equation (34):
T g = i = 1 4 w i T g i / i = 1 4 w i .
Since Class I0 is not necessary when carrying out the fuzzy comprehensive evaluation, the corresponding characteristic site period value of Class I0 can be obtained directly from Table 5.1.4.2 of the Chinese seismic design specification [21].
(4) The fuzzy seismic response spectrum
The steps for determining the fuzzy seismic response spectrum are as follows:
(1)
Obtain the maximum value of horizontal earthquake influence coefficient αmax from Equation (26).
(2)
Identify the depth of site overburden layer d based on the site drilling geological data, and calculate the equivalent shear wave velocity vs according to formula v s = d 0 / i = 1 n ( d i / v s i ) .
(3)
Calculate single factor fuzzy relation vector A = ( a 1 , a 2 , a 3 , a 4 ) in accordance with the membership function of equivalent shear wave velocity in Equation (28). During first-step evaluation, there is just one evaluation factor, which is equivalent shear wave velocity, so the fuzzy relation mentioned above is also the membership degree of the mean shear wave velocity to every site classification evaluation grade, that is V = A, v i = a i .
(4)
According to the membership functions Equations (30)–(33) of overburden thickness, calculate the evaluation factors of the fuzzy relation matrix for B. The calculation formula of the fuzzy vector of evaluation grade for site classification is W = V B = V ( , + ) B .
(5)
Calculate the comprehensive evaluation value of site characteristic period T g according to Equation (34).
(6)
After obtaining parameters αmax and T g , which are given full consideration of fuzziness, use the parameters of the earthquake response spectrum curve from the Chinese seismic design specifications [21] before the fuzzy earthquake response spectrum can be obtained.

4.4. A Simplified Method for the Calculation of Reliability

The performance function of SRHPC frame structures in the process of reliability calculation (Equation (17)) is a highly nonlinear implicit function of the design variable, so, if Equation (17) is used directly to calculate the reliability, there will be a large amount of computation and not easy to converge. Therefore, in this paper, the reliability calculation of the SRHPC frame structure was simplified and the performance function at different performance levels was changed into an explicit form. Finally, the form of the changed function is shown in Equation (35):
f ( u 0 , u p ) = u 0 u p ,
where u p is the explicit form of the random variable of seismic effect.
After such a simplification, only the standard values and probability characteristics of random variables u 0 and u p could be obtained for calculating the reliability degree of SRHPC structure; the main steps are as follows:
(1)
Obtain the probability statistic characteristics of the structural resistance term and the seismic effect term, which mainly includes the distribution pattern, the mean value, and the variable coefficient. This paper assumes the resistance term and seismic effect term expressed in the inter-story drift form and their distribution type is lognormal distribution [29,30].
(2)
Calculate the standard values of the SRHPC frame structural seismic effect according to the fuzzy seismic response spectrum, then obtain the average values of the earthquake effect according to Step (1). The standard values of the SRHPC frame structural resistance term are the quantitative values of the performance index, which were obtained in Section 2.3.1 and shown in Table 3. Next, the mean value of the resistance item can be obtained by Step (1).
(3)
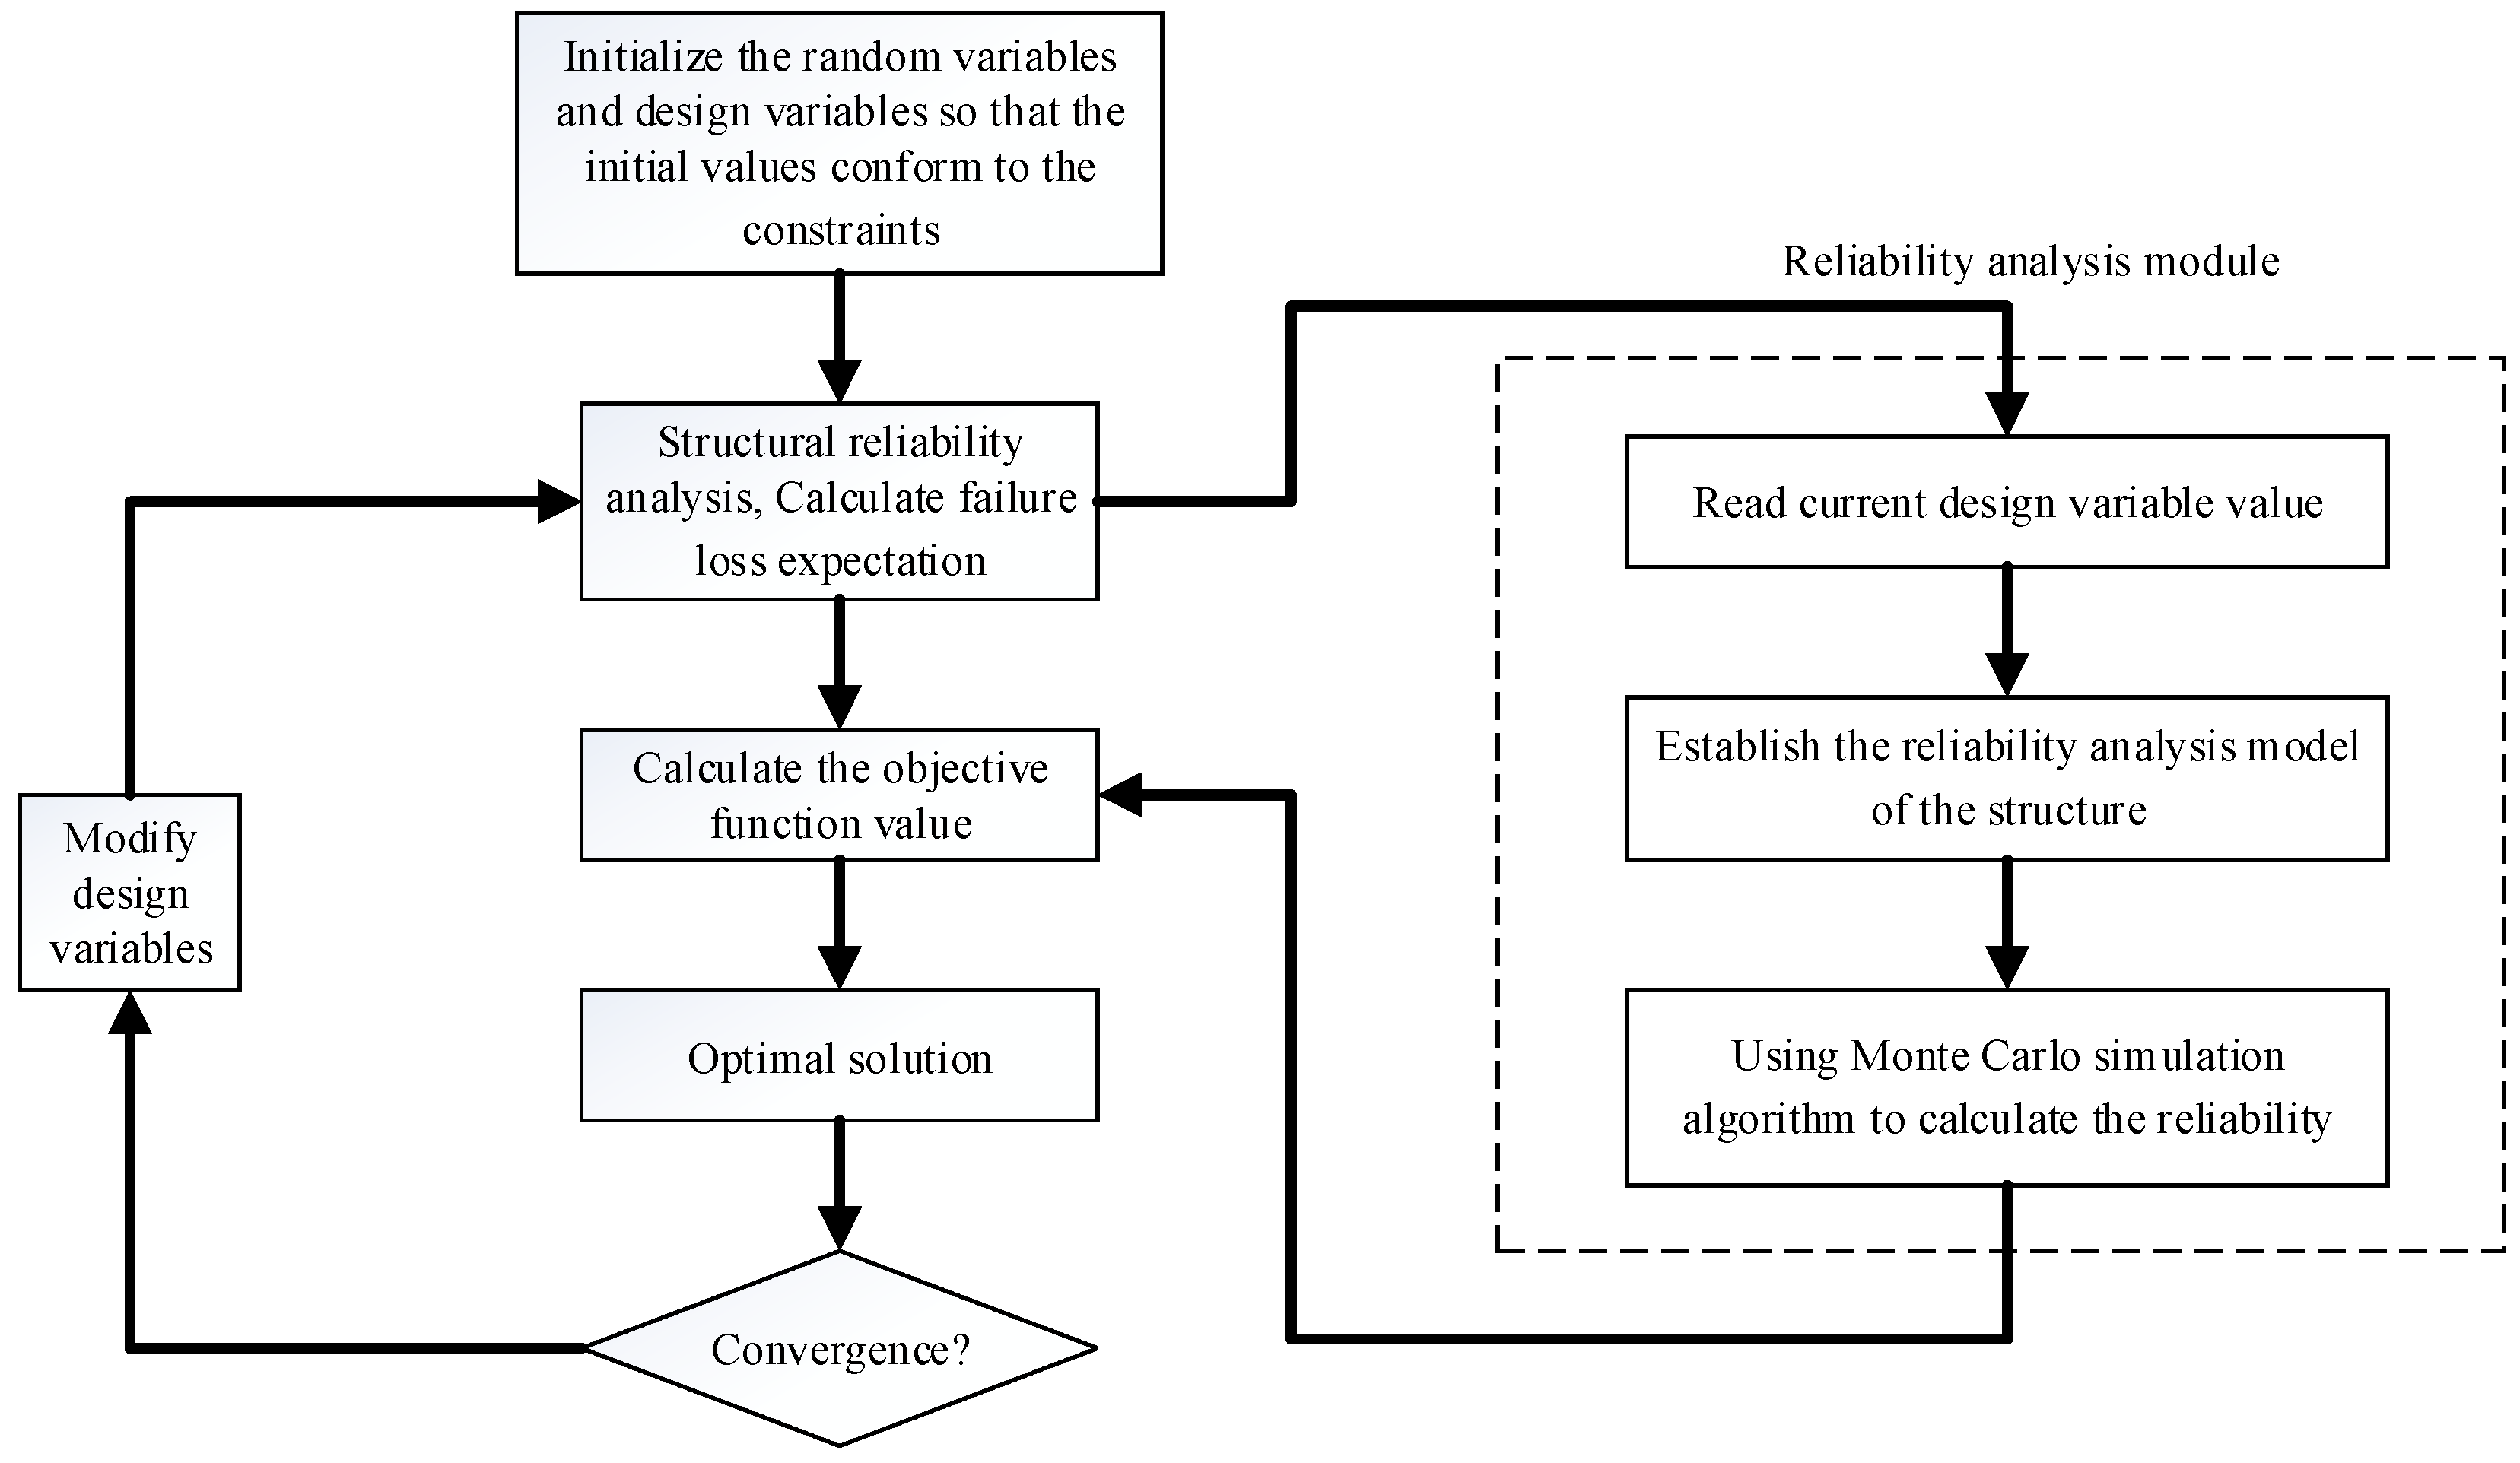
After obtaining the types of probability distribution, average and the variation coefficient of the resistance and seismic effect items, an explicit performance function was established, as shown in Equation (35). The fuzzy reliability degree of the frame structure under different performance levels can be calculated according to the improved Monte Carlo simulation method mentioned in Section 4.

5. Optimization Example
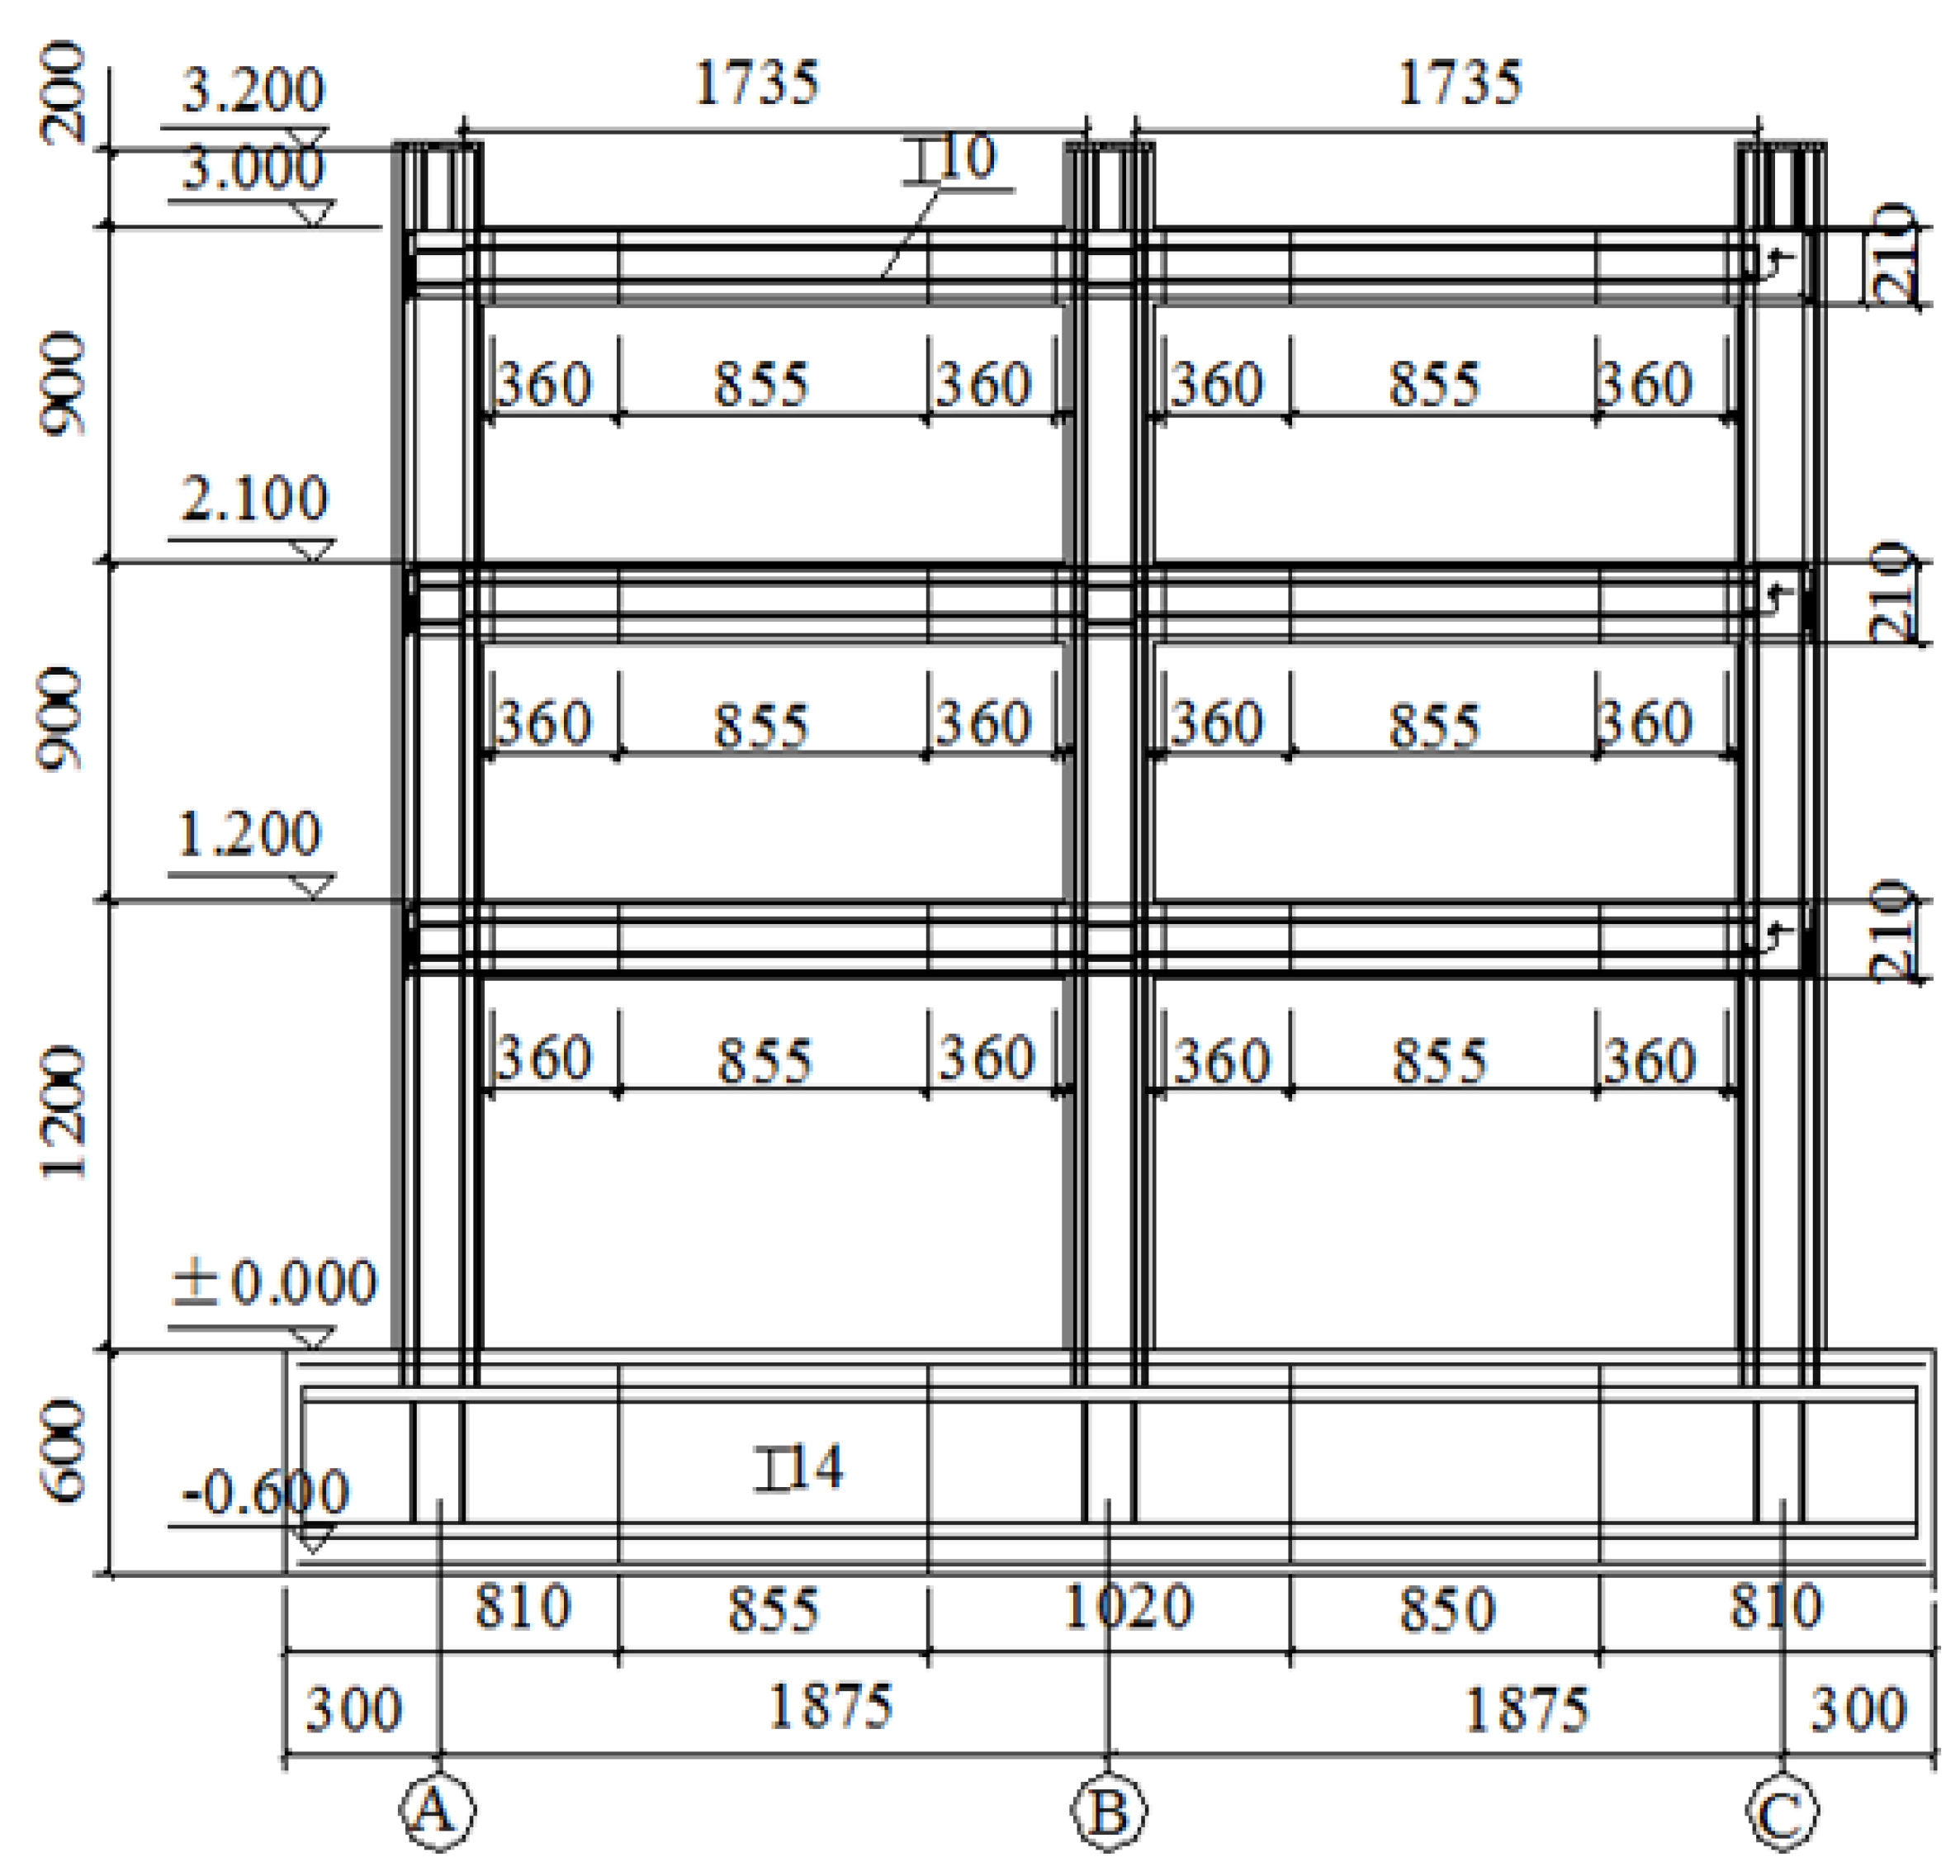
5.1. Example

In this paper, the example of optimization is a two-span and three-story SRHPC frame structure whose elevation arrangement is shown in Figure 4. In this example, seismic intensity, site classification, and the classification of design earthquake are constant, while the height of beams and columns and the area of steel in a component are used as decision variables. Predetermined design parameters remain the same based on the experiment design, and we can view the initial value of the experiment as the initial value of the design variable.
Predetermined design parameters: strength grade of concrete = C80 design value of compressive strength fc = 56.40 Mpa, design value of tensile strength ft = 3.69 Mpa; section steel with Q235, design value of tensile strength fa = 210 Mpa; longitudinal reinforcement with HRB335 steel, yield strength fy = 310 Mpa; stirrup with HPB235, yield strength fyv = 210 Mpa.
Material unit prices:
  • Concrete: 1.0 × 10⁻³ RMB/(mm2·m);
  • Section steel: 2.886 × 10² RMB/(mm2·m);
  • Longitudinal reinforcement: 2.340 × 10⁻² RMB/(mm2·m);
  • Stirrup: 2.106 × 10⁻² RMB/(mm2·m).

5.2. Optimization Program

MATLAB language was used for the optimization analysis of an SRHPC frame structure, as shown in Figure 5. The optimal iteration process based on fuzzy reliability included two layers, the outside layer and the inner layer. The outer layer was used to optimize the design variables, and the inner layer conducts the fuzzy reliability analysis of the structure. The optimization process is shown in Figure 5 and the main programs are presented in a paper by Wei [31].
The life-cycle cost of the structure is related to the selection of the weight coefficient in the optimization objective function. In this paper, the optimization of the SRHPC frame structure shown in Figure 4 with different weight coefficient combinations was carried out and the relationship between the reliability of the structure and the weight coefficient α 1 was obtained, as shown in Figure 6. By analyzing the results in Figure 6, it was found that structural reliability decreased with the increase of the weight coefficient α 1 , which means that the reliability of the structure is reduced and failure probability increases. Meanwhile, it was also found that the structural reliability was stable when the weight coefficient α 1 was [0.4, 0.6]. Therefore, the weighting factors α 1 = 0.4, α 2 = 0.6 are recommended for the SRHPC frame structures.
Using the procedures mentioned above to optimize the SRHPC frame structure shown in Figure 4, we obtained the results shown in Figure 7 and Table 5. By analyzing the results in Figure 7 and Table 5, it was found that the initial cost of the structure declined by 31.0%, while the structure failure loss expectation only increased from 31.6% of initial cost to 38.2%. The life-cycle total cost of the structure dropped by 27.31% after optimization when the optimization method described in this paper was adopted. Therefore, the purpose of this optimization method was achieved.

6. Conclusions and Future Research

In this paper, a performance-based life-cycle cost optimization method of SRHPC frame structures was studied, and the following conclusions obtained:
(1)
A fuzzy mathematics and performance-based optimization method for the life-cycle cost of SRHPC frame structures was proposed that can not only obtain good economic benefits, but also guarantee the performance of the structure so that the structure design can achieve a balance between economy and reliability.
(2)
After considering the complexity of the design optimization of SRHPC frame structures, a two-stage optimization calculation method was proposed. This method can effectively reduce the number of design variables and constraints in the optimization process as well as simplify the optimization process.
(3)
The fuzzy reliability theory was proposed to consider the fuzziness existing in the failure of the SRHPC frame. Fuzzy mathematics was adopted to develop the fuzzy seismic response spectra to consider the fuzziness existing in seismic intensity and site classification.
(4)
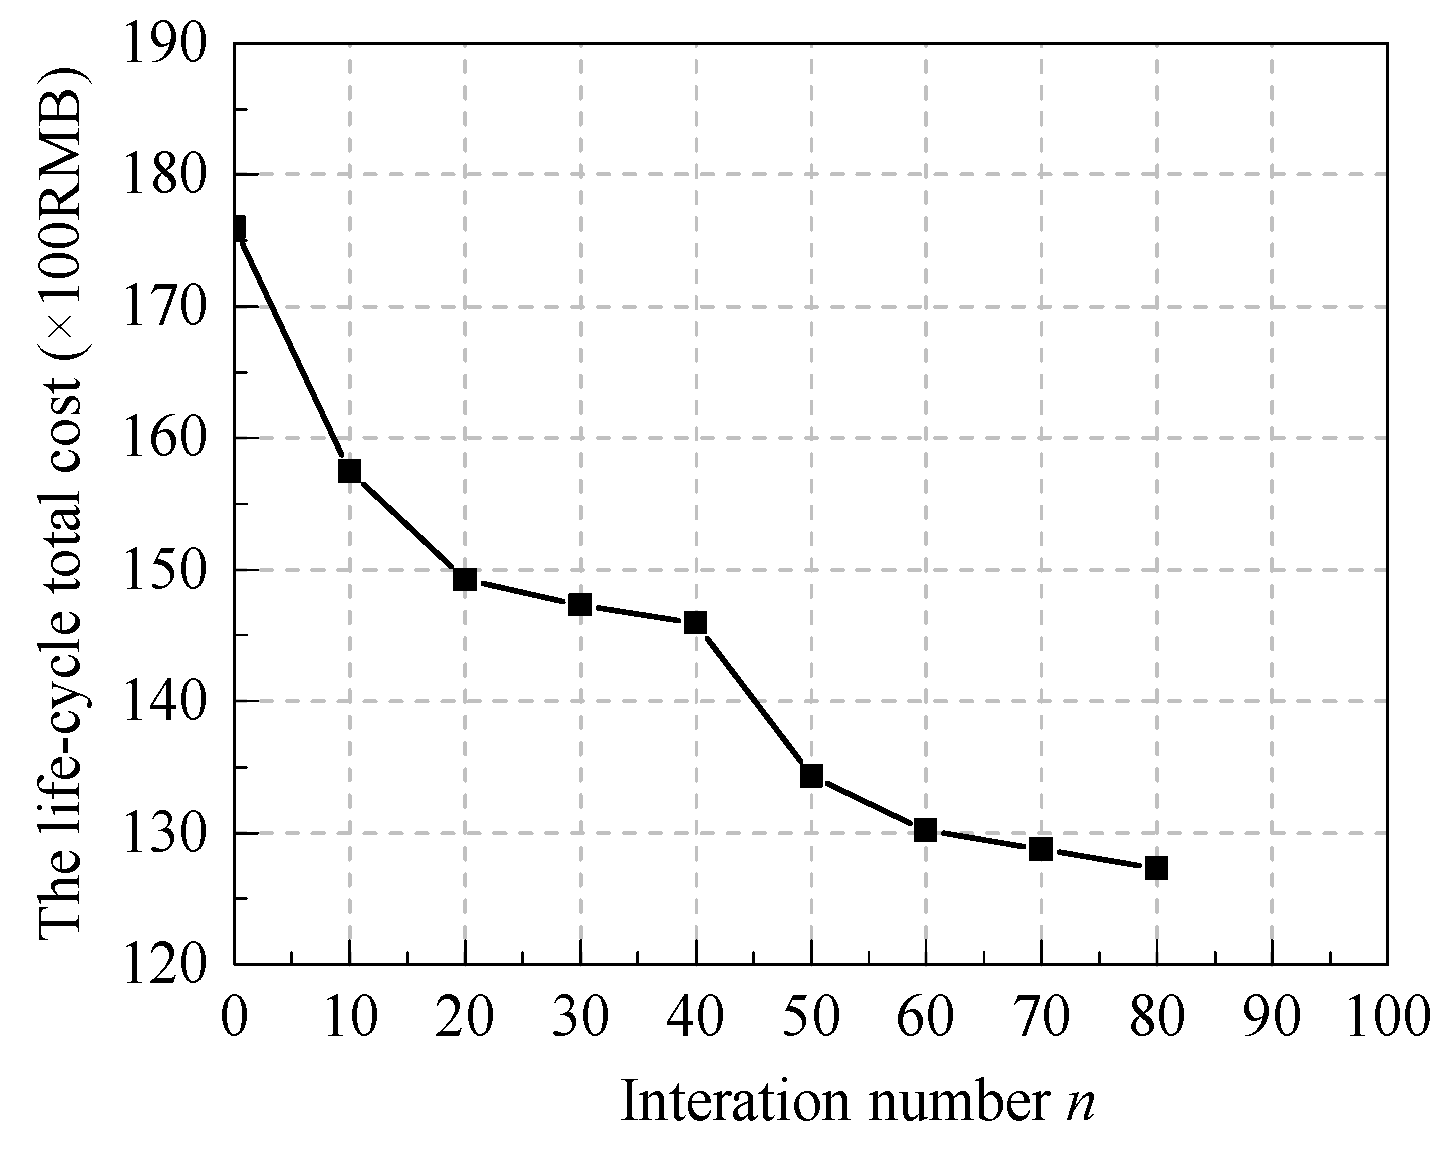
The proposed optimization was programmed by MATLAB, and an example was used to verify the optimization method where the life-cycle cost of the structure dropped by 27.31% after optimization. The results show the effectiveness and feasibility of the optimization method.
However, due to various limiting factors, relevant follow-up studies are necessary, and can be summarized as follows:
(1)
In this study, the SRHPC frame columns’ test data were considered the main object of analysis to quantify the performance index of the SRHPC frame structures; the impact of other components on the SRHPC frame structures was not considered.
(2)
The actual initial cost of a structure includes not only the cost of materials, but also the machinery costs, labor costs, and so on. This study only considered the loss of the initial material costs of a structure. The impact of the loss of the non-structural and maintenance costs of the structure were not considered.

Acknowledgments

This project is sponsored by the National Key Technology R&D Program (Grant No. 2013BAJ08B03), the National Natural Science Foundation of China (Grant No. 51678475), and the Research Fund for the Doctoral Program of Higher Education of China (Grant No. 20136120110003).

Author Contributions

Zheng Jie and Dong Li-guo wrote the paper; Zheng Shan-suo and Zeng Lei analyzed the data of the SRHPC frame columns and quantified the seismic performance indices; He Wei and Xiang Ze-hui wrote the MATLAB optimization program and analyzed the optimization results.

Conflicts of Interest

The authors declare no conflicts of interest.

Abbreviations

X=design variable vector;
i=refer to the ith layer of the SRHPC frame structure;
j=refer to the jth row column or beam of the given floor;
W ( X ) =life-cycle total cost;
C 0 ( X ) =initial cost of structure;
C f i =loss value of structure corresponding to each performance level;
P ˜ f i ( X ) =fuzzy failure probability of structure corresponding to each performance level;
P f i ( X ˜ ) C f i =loss expectation of structure corresponding to each performance level;
[ P f i ] =reliability target value corresponding to each performance level;
p , q =the number of constraints in equality and inequality;
α 1 , α 2 =weighted coefficient, used to reflect the importance of different structures;
bij,c, hij,c=the width and height of the SRHPC frame column;
hij,b=the height of the SRHPC frame beam;
A i j , c a , A i j , b a =the area of section steel in SRHPC frame column and beam;
A i j , b w , A i j , c w =the web’s area of section steel in SRHPC frame beam and column;
ρ i j , b s v , ρ i j , c s v =stirrup’s reinforcement ratio of beam and column;
C f s , C f m , C f l =the loss value of structure corresponding to “no damage”, “moderate damage”, and “severe damage” performance levels;
P ˜ f s , P ˜ f m , P ˜ f l =the fuzzy failure probability corresponding to “no damage”, “moderate damage”, and “severe damage” performance levels;
λ i j , c λ i j , b =the shear span ratio of column and beam;
f c =the strength grade of concrete;
h 0 i j , c , h 0 i j , b =the calculated height of frame column;
f y v , f a =the yield strength of the stirrup and section steel;
N i j , c =the design value of axial pressure of frame column considering seismic action combination;
γ R E =the seismic adjustment coefficient of bearing capacity;
V i j , c , V i j , b =shearing force design value of column and beam;
d i j , c s v , d i j , b s v , s i j , c s v , s i j , b s v =diameter and spacing of stirrups in column and beam;
Δ s i , Δ m i , Δ l i =story drift of structures corresponding to “no damage”, “moderate damage”, and “severe damage” performance levels;
[ Δ s ] , [ Δ m ] , [ Δ l ] =threshold for story drift corresponding to “no damage”, “moderate damage”, and “severe damage” performance levels;
E c I i j , c c , E b I i j , b b =the flexural stiffness of the column and beam;
E a I i j , c a , E a I i j , b a =the shear stiffness of the section steel of column and beam;
b i j , c a f , t i j , c a f , b i j , b a f , t i j , b a f =the section steel flange’s width and thickness of column and beam;
h i j , c w , t i j , c w , h i j , b w , t i j , b w =the section steel web’s height and thickness of column and beam;
ρ i j , c v =the volume radio of reinforcement;
μ 0 =the random variable used to express the structural resistance term, which represents inter-story drift, whose standard value can be seen in Table 3;
μ ( X , P ) =the load effect term, which represents in-story drift.

References

  1. Iannaccone, G.; Salvalai, G.; Sesana, M.M.; Paolini, R. Integrated approaches for large scale energy retrofitting of existing residential building through innovative external insulation prefabricated panels. In Proceedings of the Sustainable Built Environment (SBE) Regional Conference, Zurich, Switzerland, 13–17 June 2016.
  2. Masera, G.; Iannaccone, G.; Salvalai, G. Retrofitting the existing envelope of residential buildings: Innovative technologies, performance assessment and design methods. In Proceedings of the Advanced Building Skins—9th Energy Forum 2014, Bressanone, Italy, 28–29 October 2014.
  3. Fragiadakis, M.; Lagaros, N.D.; Papadrakakis, M. Performance-based multiobjective optimum design of steel structures considering life-cycle cost. Struct. Multidiscip. Optim. 2006, 32, 1–11. [Google Scholar] [CrossRef]
  4. Kaveh, A.; Azar, B.F.; Hadidi, A.; Sorochi, F.R.; Talatahari, S. Performance-based seismic design of steel frames using ant colony optimization. Steel Constr. 2010, 66, 566–574. [Google Scholar] [CrossRef]
  5. Kaveh, A.; Shojaei, I.; Gholipour, Y.; Rahami, H. Seismic design of steel frames using multi-objective optimization. Struct. Eng. Mech. 2013, 45, 211–232. [Google Scholar] [CrossRef]
  6. Gong, Y.; Xue, Y.; Xu, L. Optimal capacity design of eccentrically braced steel frameworks using nonlinear response history analysis. Eng. Struct. 2013, 48, 28–36. [Google Scholar] [CrossRef]
  7. Kaveh, A.; Bakhshpoori, T.; Azimi, M. Seismic optimal design of 3D steel frames using cuckoo search algorithm. Struct. Des. Tall Spec. Build. 2014, 24, 210–227. [Google Scholar] [CrossRef]
  8. Lu, H. Genetic Algorithm and Optimality Criteria Method Based Optimum Design for Tall Buildings. Ph.D. Thesis, Dalian University of Technology, Dalian, China, 21 September 2009. [Google Scholar]
  9. Gencturk, B.; Hossain, K.A. Optimal Design of RC Frames Using Nonlinear Inelastic Analysis. In Computational Methods in Earthquake Engineering; Springer: Heidelberg, Germany, 2013; pp. 545–568. [Google Scholar]
  10. Zou, X.K.; Chan, C.M.; Li, G.; Wang, Q. Multiobjective optimization for performance-based design of reinforced concrete frames. J. Struct. Eng. 2007, 133, 1462–1474. [Google Scholar] [CrossRef]
  11. Senouci, A.B.; Al-Ansari, M.S. Cost optimization of composite beams using genetic algorithms. Adv. Eng. Softw. 2009, 40, 1112–1118. [Google Scholar] [CrossRef]
  12. Luo, Y.; Li, A.; Kang, Z. Reliability-based design optimization of adhesive bonded steel-concrete composite beams with probabilistic and non-probabilistic uncertainties. Eng. Struct. 2011, 33, 2110–2119. [Google Scholar] [CrossRef]
  13. Papavasileiou, G.S.; Charmpis, D.C. Seismic design optimization of multi–storey steel–concrete composite buildings. Comput. Struct. 2016, 170, 49–61. [Google Scholar] [CrossRef]
  14. Chan, C.M. Optimal lateral stiffness design of tall buildings of mixed steel and concrete construction. Struct. Des. Tall Build. 2001, 10, 155–177. [Google Scholar] [CrossRef]
  15. Papavasileiou, G.S.; Charmpis, D.C. Design optimization of steel-concrete composite structures with requirements on progressive collapse resistance. In Proceedings of the 15th World Conference on Earthquake Engineering, Lisbon, Portugal, 24–28 September 2012; pp. 48–49.
  16. Shan, S.P. High performance concrete: Past, present and future. In Proceedings of the International Symposium of High Performance Concrete-Workability, Strength and Durability, Hong Kong/Shenzhen, China, 10–15 December 2000; Volume I, pp. 3–30.
  17. Deng, G. Mechanical Behaviors and Seismic Design of Steel Reinforced High Strength High Performance Concrete Composite Structures. Ph.D. Thesis, Xi’an University of Architecture and Technology, Xi’an, China, 2008. [Google Scholar]
  18. Zeng, L.; Parvasi, S.M.; Kong, Q.; Huo, L.; Lim, I.; Li, M.; Song, G. Bond slip detection of concrete-encased composite structure using shear wave based active sensing approach. Smart Mater. Struct. 2015, 24, 125026. [Google Scholar] [CrossRef]
  19. Xu, C.H.; Zeng, L.; Zhou, Q.; Wu, Y.; Tu, X. Cyclic performance of concrete-encased composite columns with T-shaped steel sections. Int. J. Civ. Eng. 2015, 13, 456–467. [Google Scholar]
  20. Zeng, L.; Cui, Z.; Xiao, Y.; Jin, S.; Wu, Y. Cyclical behavior of concrete-encased composite frame joints with high strength concrete. Adv. Mater. Sci. Eng. 2015, 2015, 1–13. [Google Scholar] [CrossRef]
  21. National Standard of the People’s Republic of China: Code for Seismic Design of Buildings. GB 50011–2010, 2010.
  22. Vision, S. Performance based seismic engineering of building. Struct. Eng. Assoc. Calif. (SEAOC) 1995. [Google Scholar]
  23. Zheng, S.S. Experimental Study Report on Seismic Behaviors of Steel Reinforced High Strength and High Performance Concrete Frame’s Beams, Columns, and Joints; Research Data of College of Civil Engineering Xi’an University of Architecture and Technology: Xi’an, China, 2007. (In Chinese) [Google Scholar]
  24. Vatn, J. A discussion of the acceptable risk problem. Reliab. Eng. Syst. Saf. 1998, 61, 11–19. [Google Scholar] [CrossRef]
  25. Cheng, G.D. Introduction to Optimum Design of Engineering Structures; China Water & Power Press: Beijing, China, 1993. [Google Scholar]
  26. Gao, X. Anti-Seismic Levels for Buildings of Various Importance; Building Science: Westford, MA, USA, 1999. [Google Scholar]
  27. Unified Standard for Reliability Design of Building Structures. GB50068, 2001.
  28. Wang, G.Y. Exploration of Structural Soft Design; Harbin Civil Engineering Institute Press: Harbin, China, 1987. [Google Scholar]
  29. Wu, B.; Li, Y.H. Determination of representative value of target displacement in displacement reliability-based seismic design method. Earthq. Eng. Eng. Vib. 2002, 22, 44–51. [Google Scholar]
  30. Wei, C.J.; Gao, L.; Gao, X.W.; Li, W.Z. Seismic reliability analysis of structure based upon limit elasto-plastic story drift. Eng. Mech. 1986, 3, 60–70. [Google Scholar]
  31. He, W. Research of Performance-Based Optimization Method for the Life-Cycle Cost of SRHPC Frame Structures. Master’s Thesis, Xi’an University of Architecture and Technology, Xi’an, China, 2013. [Google Scholar]
Figure 1. The working state of the structure in the theory of reliability. (a) Structural working state in traditional reliability theory; and (b) structural working state in fuzzy reliability theory.
Applsci 07 00269 g001
Figure 2. Membership function of mean shear wave velocity.
Applsci 07 00269 g002
Figure 3. Membership function of thickness of covering layer. (a) 800 ≥ vs > 500; (b) 500 ≥ vs > 250; (c) 250 ≥ vs > 150; and (d) vs ≤ 150.
Applsci 07 00269 g003
Figure 4. Elevation of SRHPC frame and cross-sectional drawing of beams and columns (unit of length: mm; unit of elevation: m).
Applsci 07 00269 g004
Figure 5. The flow chart of the optimization design of an SRHPC frame structure.
Applsci 07 00269 g005
Figure 6. The relationship between reliability and weight coefficient α 1 .
Applsci 07 00269 g006
Figure 7. The optimization result of life-cycle cost.
Applsci 07 00269 g007
Table 1. Structural seismic objective performance in China’s seismic code.
Performance LevelsNo DamageRepairableNo Collapse
Seismic risk levelFrequent earthquake1
Occasional earthquake21
Rare earthquake321
1: First level of seismic fortification target; 2: Second level of seismic fortification target; 3: Third level of seismic fortification target; —: unacceptable seismic fortification target.
Table 2. The distribution value of inter-story drift of steel reinforced high strength high performance concrete (SRHPC) frame columns under different failure patterns.
Failure StageFailure Patterns
Bending FailureShear Bond FailureShear Diagonal Compression Failure
ImImIm
component cracking[1/300, 1/190]1/242[1/205, 1/101]1/151[1/135, 1/110]1/123
component yielded[1/160, 1/115]1/141[1/115, 1/78]1/110[1/90, 1/60]1/71
ultimate load[1/108, 1/60]1/78[1/83, 1/51]1/63[1/59, 1/31]1/35
component failure[1/55, 1/32]1/39[1/38, 1/21]1/30[1/25, 1/18]1/21
I: The distribution value of story drift angle; m: The mean value of story drift angle.
Table 3. The quantitative value for seismic performance objectives of SRHPC frame structures.
Earthquake IntensityMinor EarthquakeMedium EarthquakeMajor Earthquake
performance levelno damagerepairableno collapse
economic acceptability for renovation of buildingcomplete acceptanceacceptableunacceptable
safetysafesafelife safe
threshold for story drift angle1/4501/1351/50
Table 4. The ratio of the failure loss expectation to the initial cost of the structure at different damage levels.
Damage DegreeIntactSlightModerateExtensiveCollapse
Ratio0.020.1050.30.71.0
Table 5. A comparison of the costs before and after optimization.
CostInitial Cost/RMBFailure Loss Expectation/RMBLife-Cycle Cost/RMB
Before optimization13,377422717,604
After optimization9261353512,796

