Article

Development of Probabilistic Reliability Models of Photovoltaic System Topologies for System Adequacy Evaluation

The Department of Electrical and Computer Engineering, University of Saskatchewan, Saskatoon, SK S7N 5A9, Canada
*
Author to whom correspondence should be addressed.
Appl. Sci. 2017, 7(2), 176; https://doi.org/10.3390/app7020176
Submission received: 21 December 2016 / Revised: 6 February 2017 / Accepted: 7 February 2017 / Published: 14 February 2017
(This article belongs to the Special Issue Advancing Grid-Connected Renewable Generation Systems)

Abstract

:
The contribution of solar power in electric power systems has been increasing rapidly due to its environmentally friendly nature. Photovoltaic (PV) systems contain solar cell panels, power electronic converters, high power switching and often transformers. These components collectively play an important role in shaping the reliability of PV systems. Moreover, the power output of PV systems is variable, so it cannot be controlled as easily as conventional generation due to the unpredictable nature of weather conditions. Therefore, solar power has a different influence on generating system reliability compared to conventional power sources. Recently, different PV system designs have been constructed to maximize the output power of PV systems. These different designs are commonly adopted based on the scale of a PV system. Large-scale grid-connected PV systems are generally connected in a centralized or a string structure. Central and string PV schemes are different in terms of connecting the inverter to PV arrays. Micro-inverter systems are recognized as a third PV system topology. It is therefore important to evaluate the reliability contribution of PV systems under these topologies. This work utilizes a probabilistic technique to develop a power output model for a PV generation system. A reliability model is then developed for a PV integrated power system in order to assess the reliability and energy contribution of the solar system to meet overall system demand. The developed model is applied to a small isolated power unit to evaluate system adequacy and capacity level of a PV system considering the three topologies.

1. Introduction

Climate change is a major concern facing humanity due to the significantly negative impact of carbon emissions generated by conventional power sources in electric energy production. There is evidence of global support by many governments and organizations around the world to finance the implementation of renewable energy sources such as wind and solar power. Solar power is recognized as a friendly electric energy generation system with respect to the environment, as it has zero greenhouse carbon emissions and requires no fossil fuel consumption. Currently, PV technology is growing rapidly around the world due to increasing solar cell efficiency and decreasing prices. According to a report by the European Photovoltaic Industry Association (EPIA), the total PV capacity has been increasing exponentially, from 102.2 GW in 2012 to 138.9 GW in 2013 [1].
The output power of PV systems differs from the power generated by conventional sources due to the high uncertainty of PV power output, and the availability associated with PV system components [2,3,4] and their relative configurations. Electric power utilities and customers are therefore concerned about the reliability of PV-integrated power systems. Previous studies have discussed the system reliability of adding PV systems to electric power system grids using both analytical [5,6] and simulation techniques [7,8]. Billinton and Karki [9,10] discuss the adequacy benefit associated with installing renewable energy sources in electric power systems. A system well-being model is used in these works with combining deterministic and probabilistic technique to provide useful reliability indices for test system containing renewable energy. The reliability contribution of photovoltaic and wind energy sources is presented evaluated in these studies. Most reliability studies however consider PV systems as a whole component, and do not incorporate the sub-components and the design configurations of the PV topology in the evaluation.
PV power systems are composed of components that are vulnerable to failures with different probabilities. The structure of power electronic converters in PV systems can be broadly classified into centralized-inverters, string-inverters, and micro-inverters. The structures of central and string PV systems often have similar electric components, but are differently configured in terms of connecting the solar array to the inverter. A central PV system topology is composed of multi-strings topologies that are connected to only one inverter. However, one inverter is connected to each string in a string PV system topology. Micro-inverter topology, on the other hand, requires one inverter per solar panel. Previous published works do not consider all the aforementioned topologies. The quantitative assessment of reliability for an entire PV system is essential in determining the overall reliability contribution of adding solar power to electric power systems, and this has not been sufficiently addressed in the available literature.
This paper presents a comprehensive overview of the reliability models of PV systems, and presents the reliability quantification process of central, string, and micro-inverter PV systems. The developed models are embedded in the reliability evaluation methodology to obtain a discrete probability distribution in the form of a capacity outage probability table (COPT) [4] for each component group using individual component failure rates assuming exponential distribution of times to failure. The loss of load expectation (LOLE) [7] and the loss of energy expectation (LOEE) [7] indices are used in this paper to quantify the reliability of the PV-integrated systems. The capacity credit (CC) and the effective load carrying capability (ELCC) are calculated to estimate the capacity contribution by the different PV system topologies. The application of system reliability risk indices provides valuable quantitative risk measures, and is illustrated using a small isolated power system (SIPS). The main contribution of this work is the development of a detailed analytical reliability model of a PV system that accounts for PV system components and PV topologies. The benefit from the addition of a PV system using the three topologies is quantified in terms of LOLE, LOEE, ELCC, and CC.

2. Basic Reliability Evaluation Concepts and Indices

The reliability system indices can be defined as the ability of its power generation to satisfy the total load demand within acceptable risk levels. Firstly, developing a generation model of the conventional generation system is required. Secondly, this model is then combined with a load model only without PV to evaluate the basic system adequacy as shown in Figure 1. The generation model is generally formatted as a series of states, each of which has a capacity level and probability. This formation is called a capacity outage probability table (COPT) [4] which are utilized in this project to calculate the system risk indices of LOLE and loss of energy exception (LOEE). These two indices are considered the most widely used reliability evaluation indices [7].
The LOLE can be defined as the expected period of time during which the system load exceeds the available generating capacity. The LOEE can be defined as the amount of energy that will not be supplied in a given year. The LOLE and LOEE are determined using Equations (1) and (2), respectively, as shown in Figure 2.
LOLE = k = 1 n p k × t k = k = 1 n P k × ( t k t k 1 )
LOEE = k = 1 n p k × E k
where n is the number of capacity outage states; Ok is the kth outage of COPT; pk is the probability of the capacity outage Ok; tk is the time for which load loss will occur due to Ok; Pk is cumulative outage probability for capacity state Ok; and Ek is energy not supplied.
The capacity value contribution with the added renewable energy system is expressed in terms of physical capacity (W). The ELCC and CC factors are used in this paper to evaluate the capacity value contribution of the solar system installed. The rationale for calculating ELCC is described in [11,12]. Figure 3 shows the mathematical method for the estimation of ELCC. The physical meaning of ELCC from this figure is the additional load that can be carried with addition of new generation while maintaining the LOLE constant. The ELCC is a useful index for estimating the solar capacity value as it depends on many factors such as the size of the existing and added generating units, the unit FOR, the system peak load variation and the system risk criterion. The CC is another important parameter in capacity value evaluation and has been applied extensively to assess the contribution of a power generating source to meet the load carrying capability of the system at an acceptable risk level. The CC of the PV system is obtained using Equation (3).
CC = ELCC C A × 100
where CA is the rated capacity of the added generating unit.
The PV system is commonly used in SIPS [13]. The application of PV in large systems has also received considerable attention. This study considers a SIPS to evaluate the reliability contribution of the PV system generation; however, the modeling and proposed reliability assessment approach can be applied to larger systems. A SIPS is located in a remote area. This system may or may not have a transmission line. The SIPS used in this paper has one 70 kW and two 40 kW [13] generation units with a total system capacity of 150 kW. The system peak load is 80 kW. The data on the failure rate (λ) and repair rate (μ) are important to evaluate the FOR or unavailability and availability. The reciprocals of λ and μ are known as the mean time to failure (MTTF) and mean time to repair (MTTR) respectively. The unavailability (U) and availability (A) can be defined using Equations (4) and (5), respectively [7].
The load model including the variation in system load level with time periods is required in this work. The annual chronological hourly load profile of the IEEE-RTS [14] is utilized in this work.
A = μ μ + λ = m m + r = U p T i m e U p T i m e + D o w n T i m e
U = λ μ + λ = r m + r = D o w n T i m e U p T i m e + D o w n T i m e

3. Reliability Modeling of PV Systems

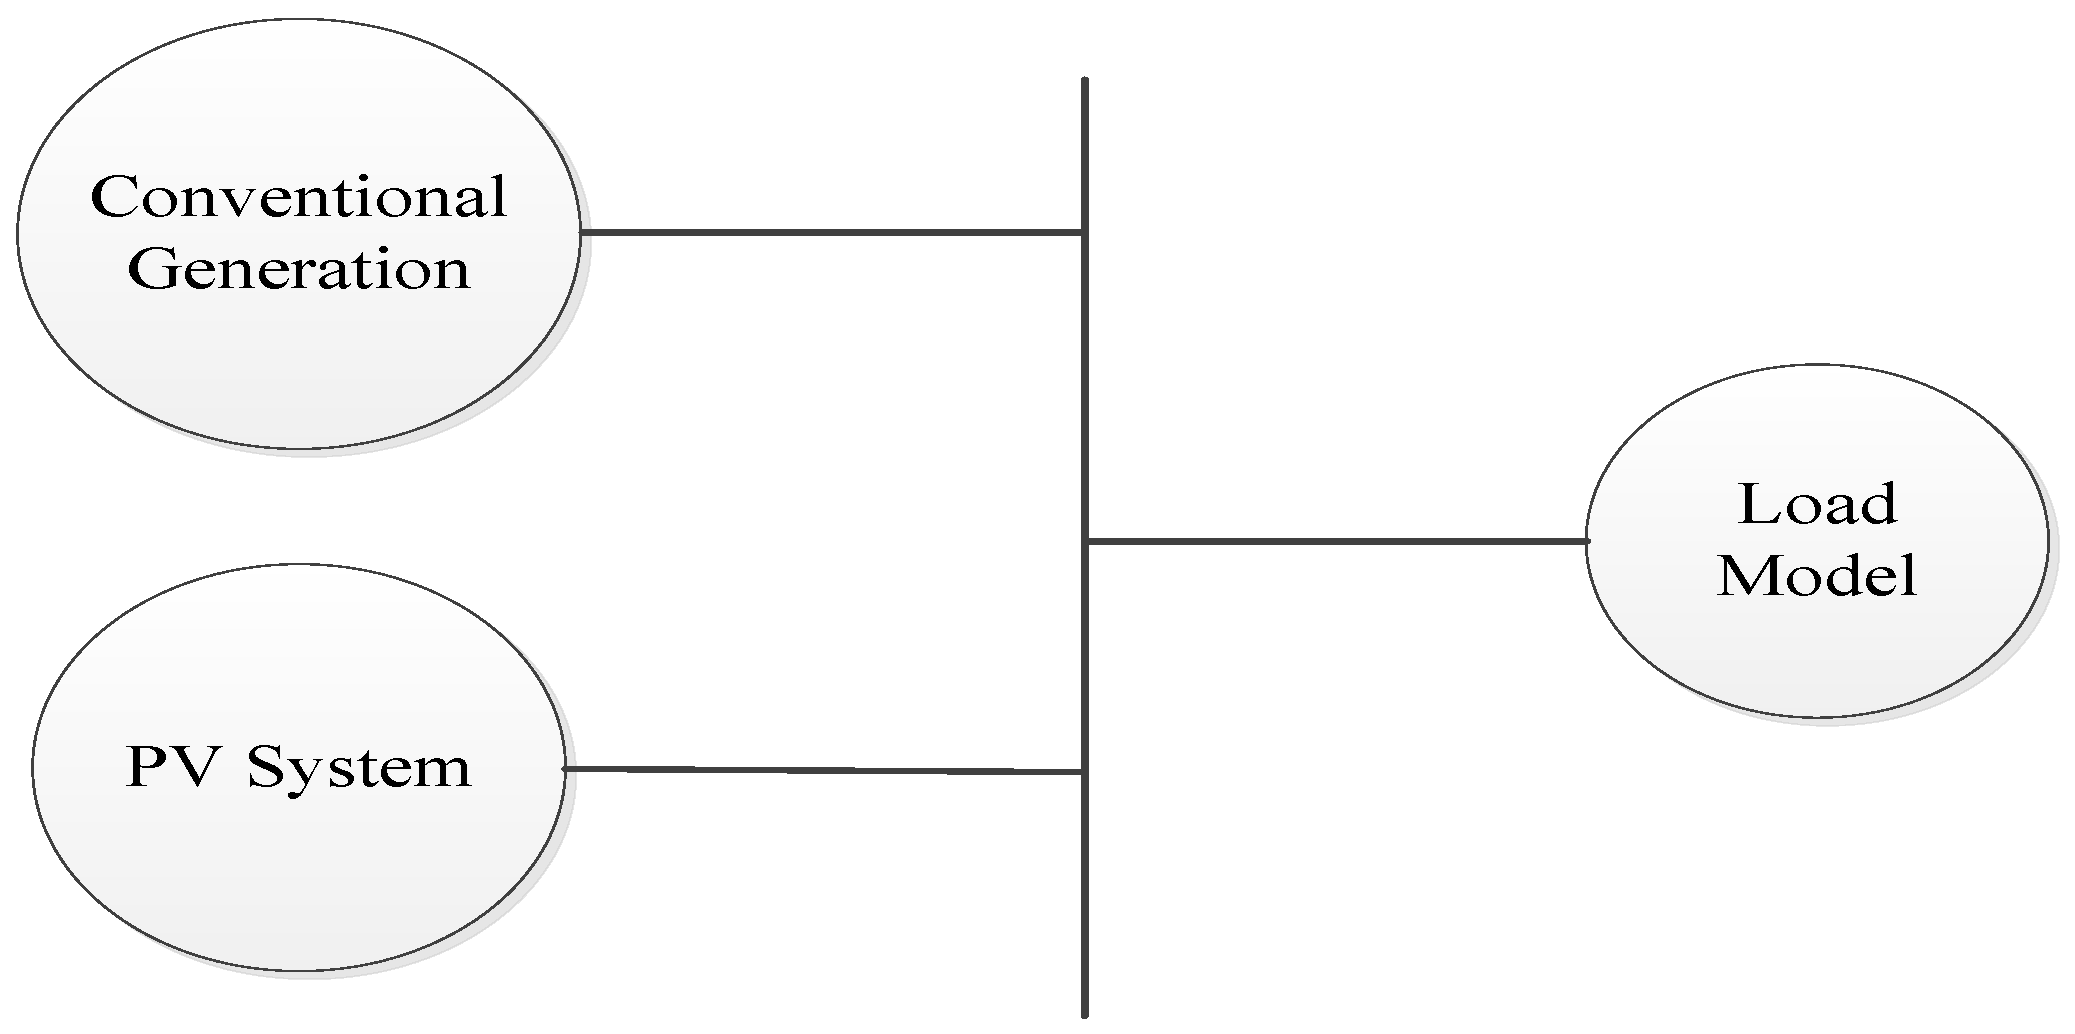
Developing a generation model of the overall system generation including the output power of the PV system and conventional generation is required. In this step, the failure rates of critical components in the PV system, such as capacitance and switching, are taken into consideration. Secondly, the developed generation model is then combined with an hourly load model to evaluate system adequacy as shown in Figure 1. In this work, the central, string and micro PV inverter system topologies and the output power of solar cell are taken into consideration in reliability modeling of overall PV system.
Section three presents a clear framework for developing an overall reliability model of PV system. There are three types of system-level reliability models: part-count, combination and state-space models. Part-count is utilized in this project since this model can provide adequate reliability estimation. Three assumptions are taken into account to apply this model.
  • The overall system will fail if any component or subsystem fails.
  • The failure rate of each component remains constant during lifetime.
  • The overall system is modelled as a series reliability block network, as shown in Figure 4.
The probability of an up (Pup) and down (PDown) state system model can be evaluated using Equations (6) and (7), respectively. This section is divided into three subsections.
P u p = μ 1 μ 1 + λ 1 * μ 2 μ 2 + λ 2 * μ 3 μ 3 + λ 3 × ........... × μ n μ n + λ n
P D w o n = 1 P u p

3.1. Modeling Solar Cell

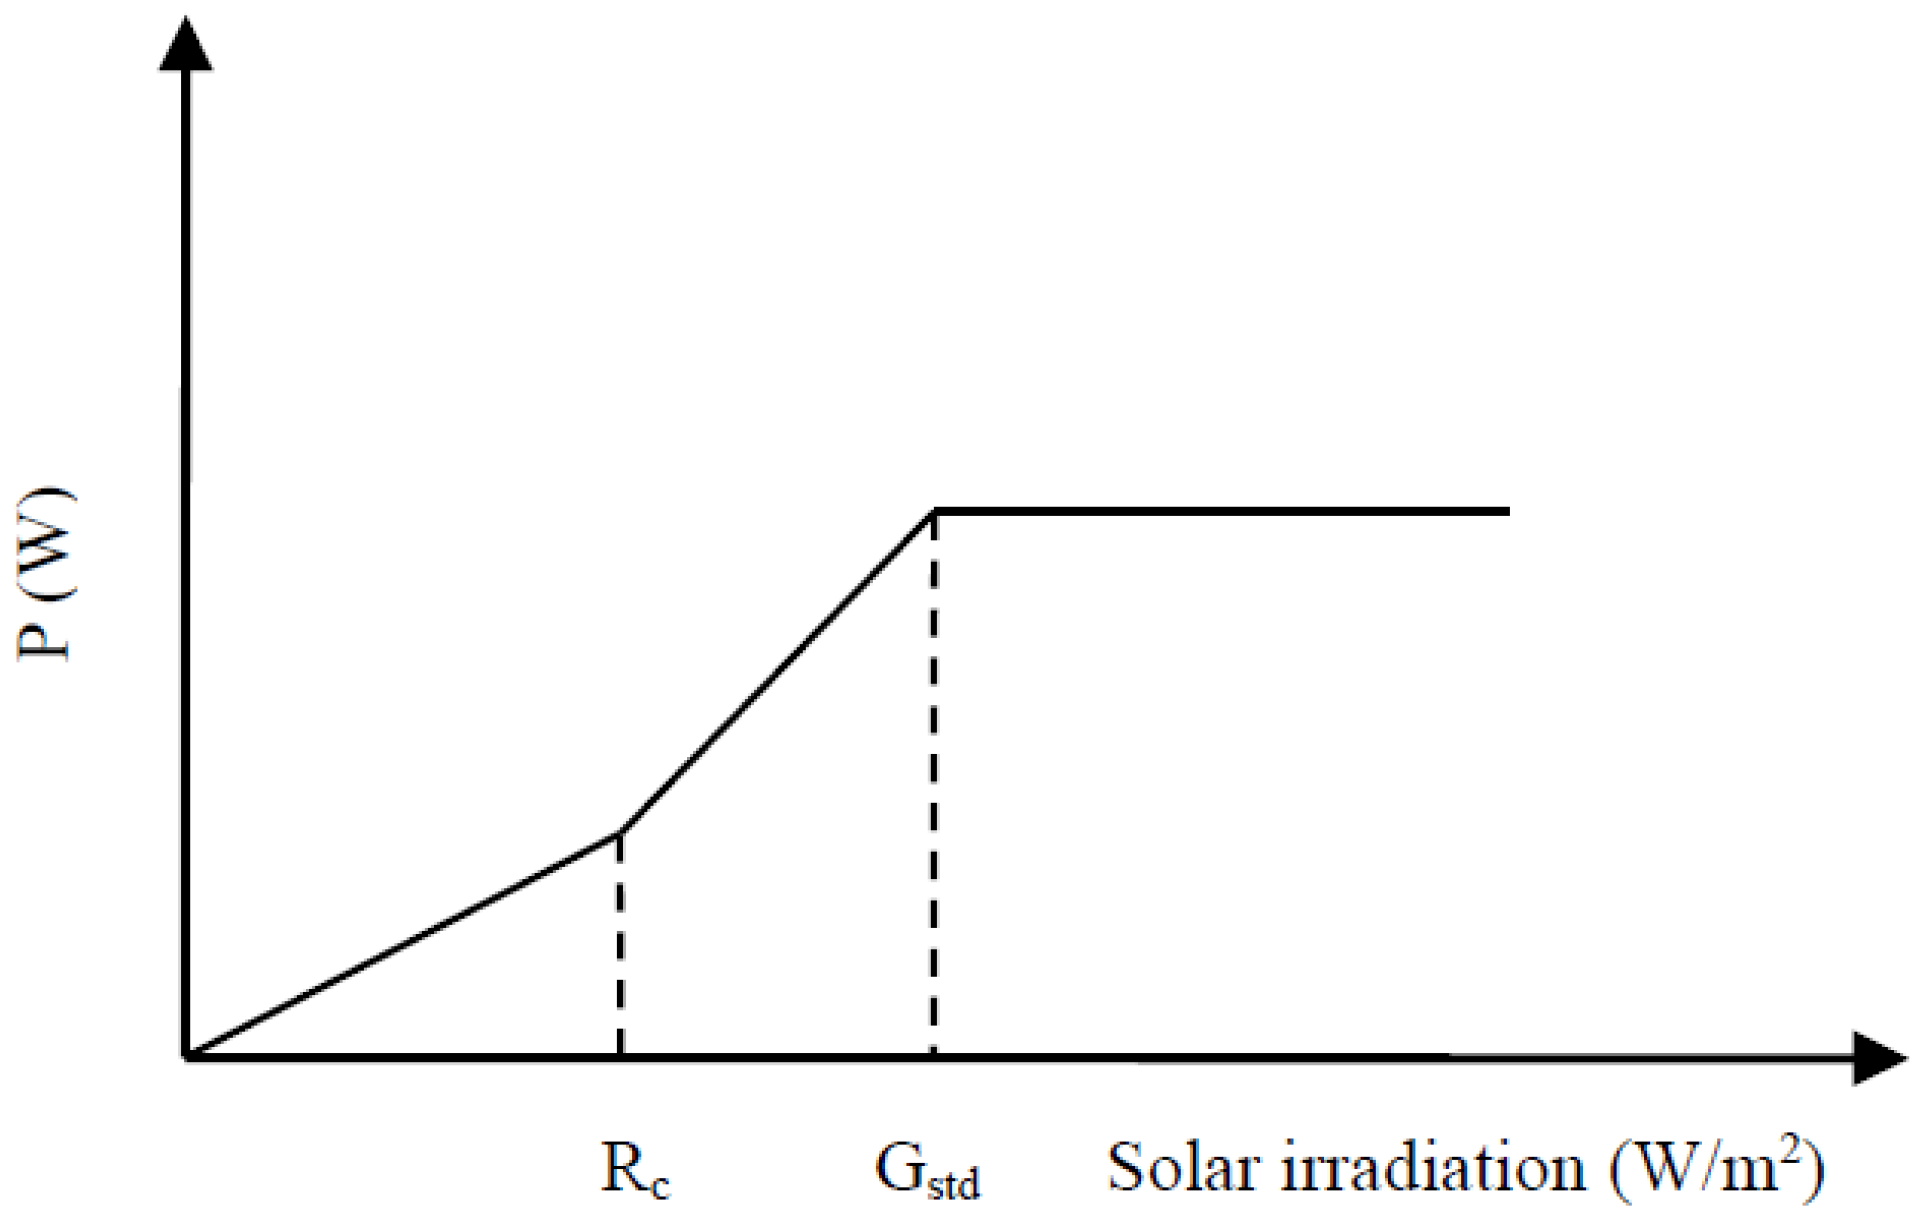
The analytical model used in evaluating the power output of solar cells depends on two main factors: solar cell efficiency and solar cell irradiation. The efficiency of a solar cell varies with the amount of solar irradiation, and it can be evaluated using Equations (8) and (9) [15]. The power output from a solar cell can be calculated using Equations (10)–(12), as shown in Figure 5 [15].
E f f = η c R c × G b i   0 G b i < R c
E f f = η c   R c G b i
P = P s n × G b i 2 G s t d × R c   0 G b i < R c
P = P s n × G b i G s t d   R c G b i < G s t d
P = P s n   G b i > G s t d
where P is the power output of the solar cell (W); Gbi is global solar irradiation (W/m2); Gstd is solar irradiation in a standard environment set as 1000 (W/m2); Rc is a certain irradiation point set as 150 (W/m2); and Psn is the equivalent rated capacity of PV (W). The approach described in Figure 5 is used to create the multi-state model of the power output of the solar cell. The multi-state model is obtained by dividing the solar irradiation into segments. A step size of 50 W/m2 is used to create these segments. The number of obtained states from these segments is 22 states. Zero solar irradiation is used as an individual state. To calculate the probability for given states, Equation (13) is created, where Ni is the number of occurrences of each state of i:
Probability i = N i Total   Samples
The model is applied to an example system considering historical solar irradiation data of Al-Madinah located in Saudi Arabia [16]. The data include solar irradiation at five-minute intervals from 2000 to 2005 for different sites [16]. The total collected data of solar irradiation at five-minute intervals for five years is 525,600 samples. The power output of the solar cell device depicted in Table 1 is in per unit (pu) and was created using Equations (10)–(13). The probability of zero output is 0.4774. In this work, different PV capacities are considered to assess the reliability contribution of the PV system.

3.2. Reliability Modeling of a Central PV System

The multi-state model shown in 
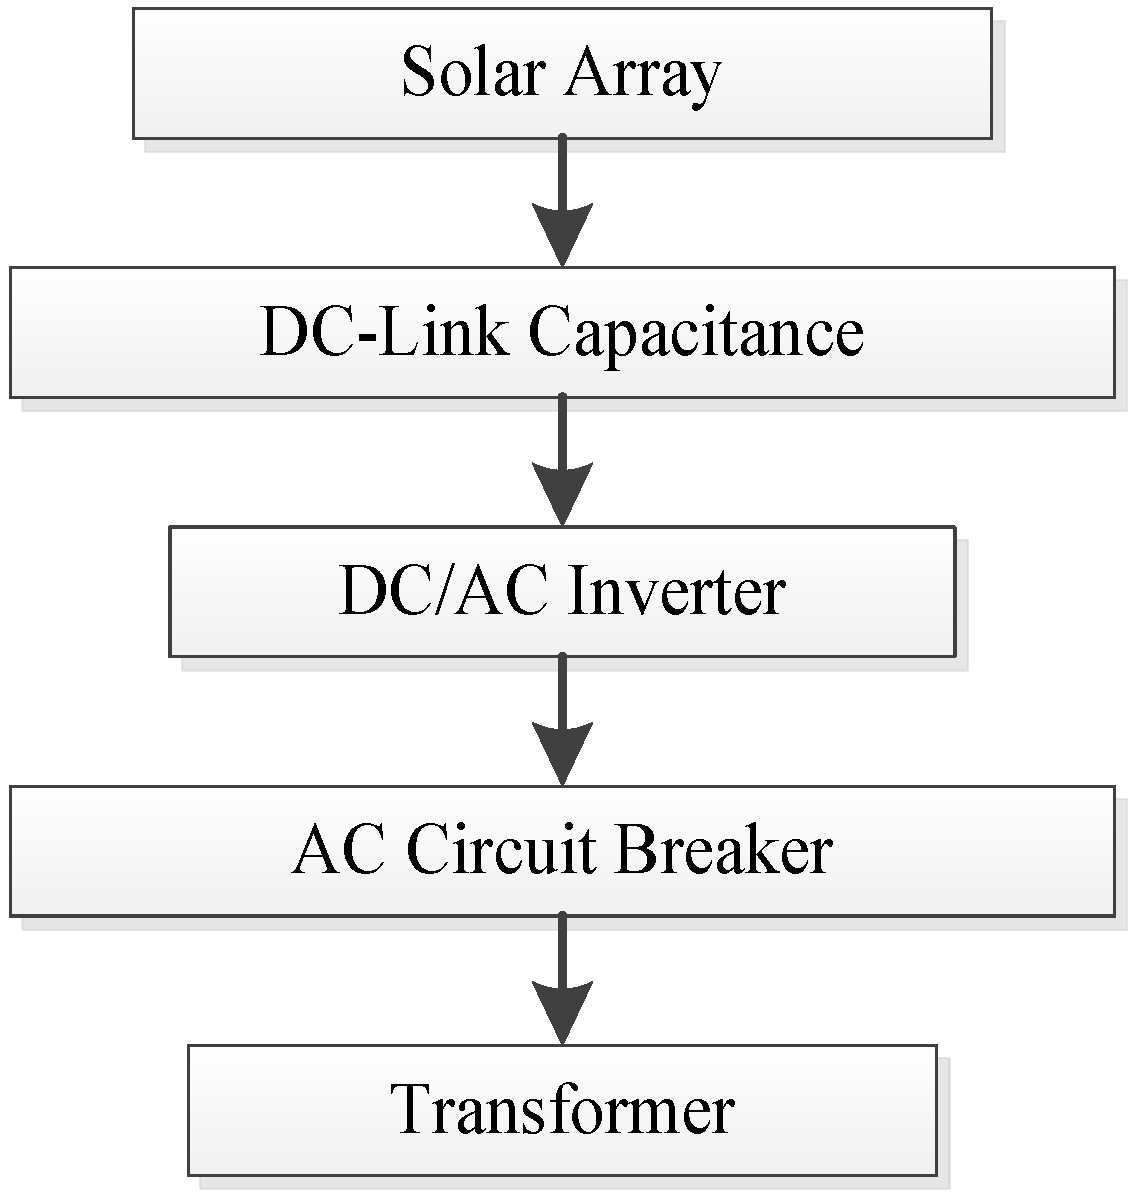
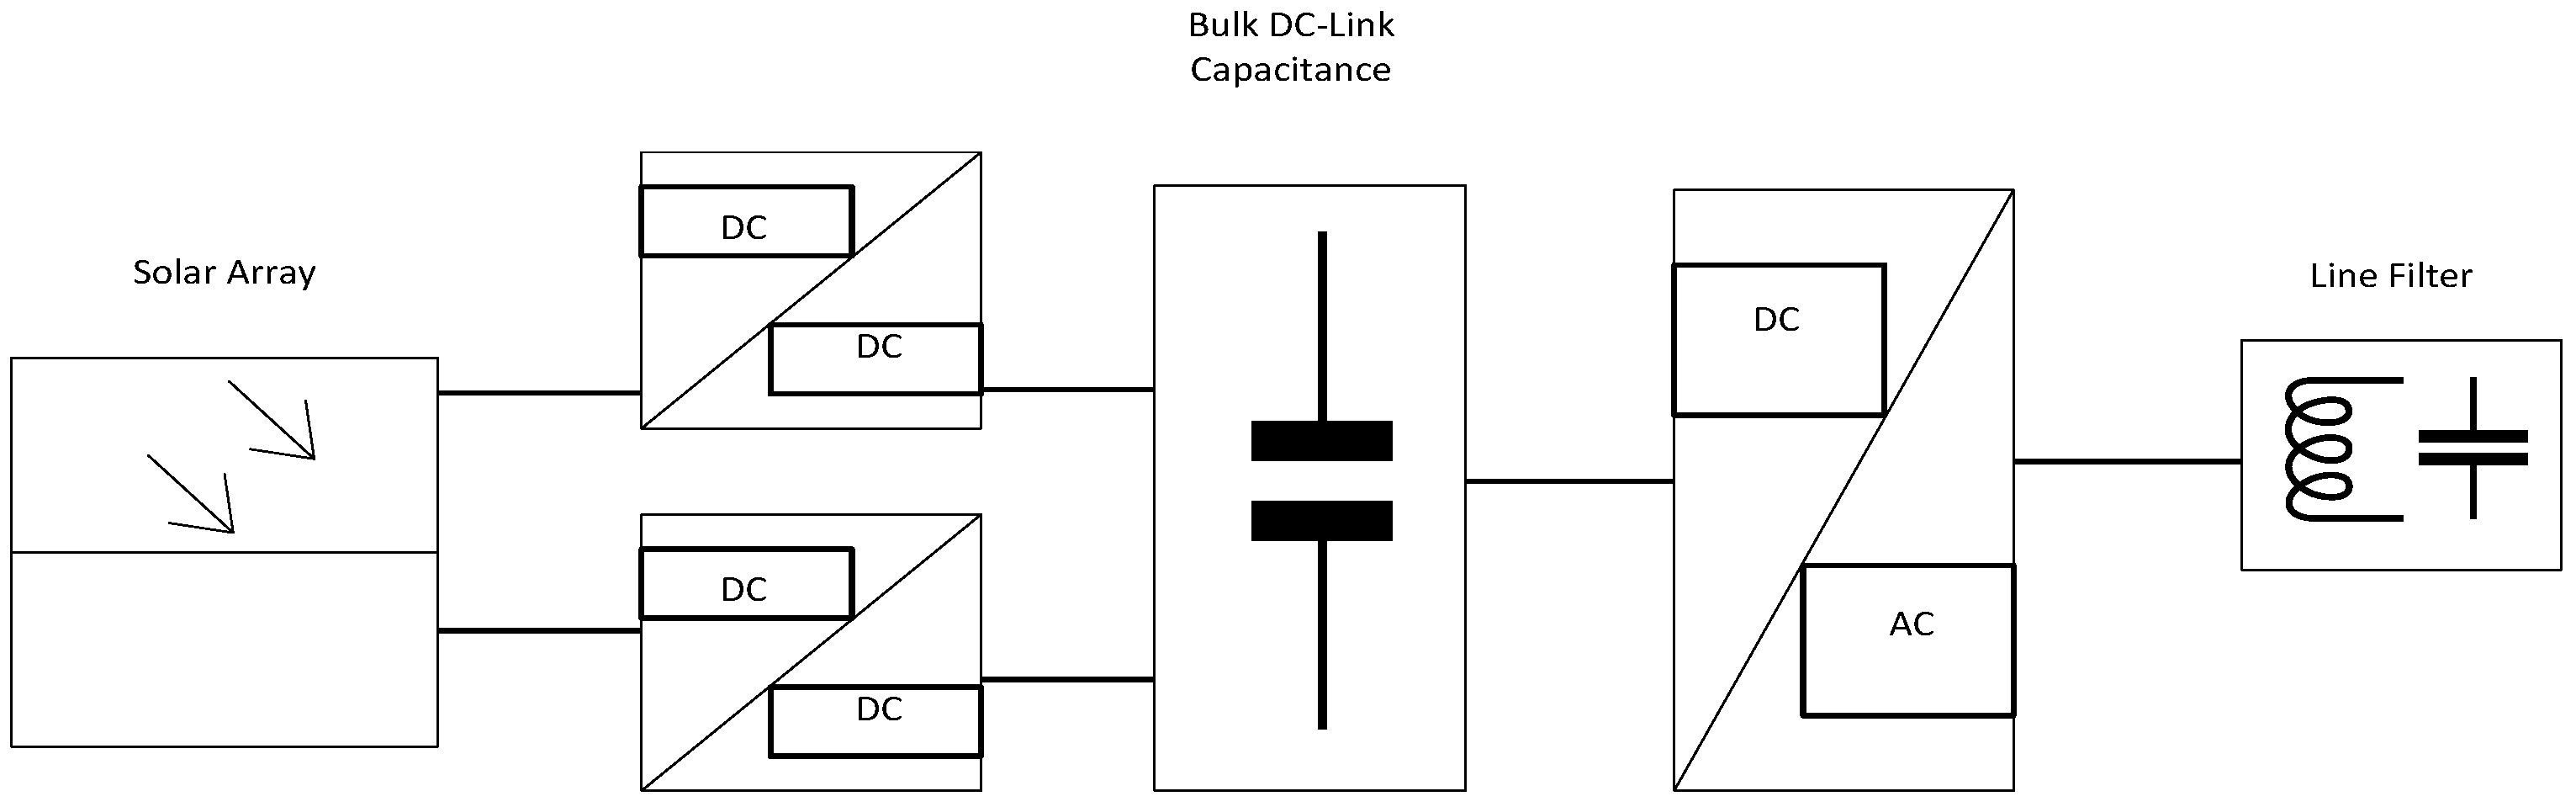
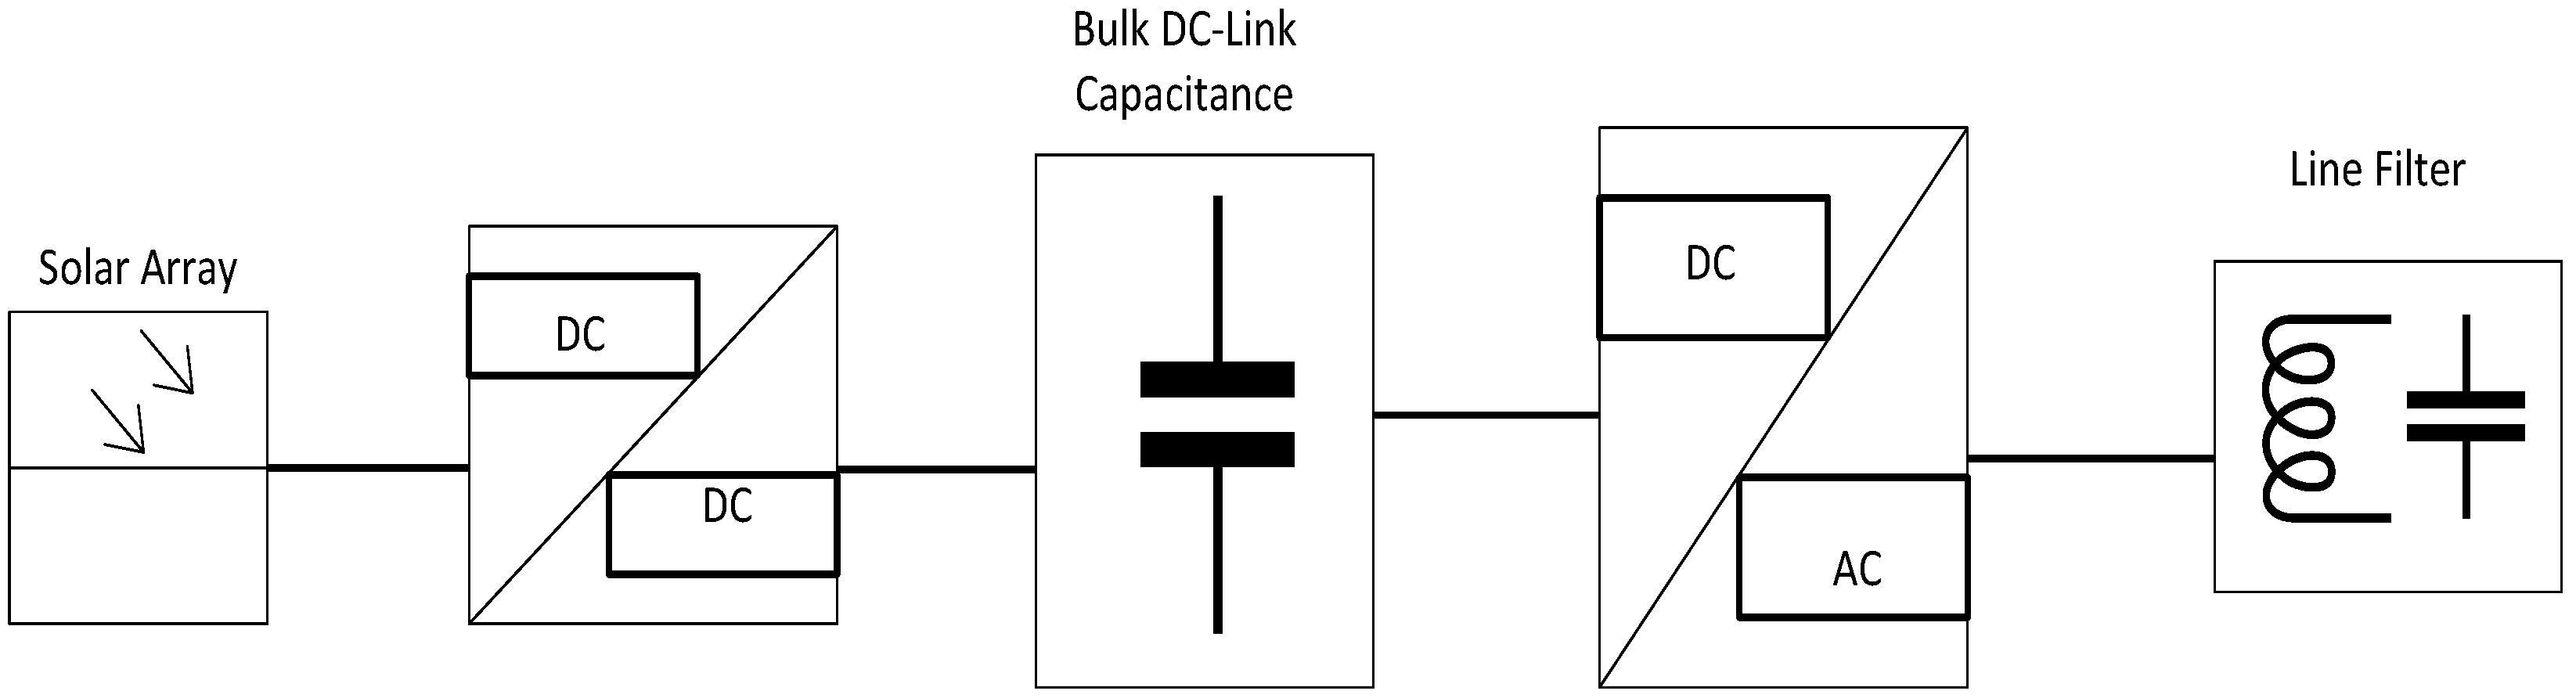
Table 1 is combined with a two-state model of central PV system components described in this section. The main components of a typical central PV system are illustrated in Figure 6. This central PV system consists of a solar array, bulk DC-link capacitance, inverter, line filter, AC switch, AC circuit breaker and transformer. The reliability analysis can be performed at the component level or system level. The functional block diagram of this PV system is shown in Figure 7.
The reliability research of power electronic components has focused on failure rate models of conductors, capacitors and magnetic devices [17,18]. However, field experience has demonstrated that electrolytic capacitors and switch devices are the most vulnerable components [19]. There are several reliability models available for power electronic and high power voltage. MIL-HDBK-271F second edition is the military handbook for reliability component prediction for power electronic components [20]. This handbook provides an extensive reliability database for power electronic components. This database is used in this work to evaluate the failure rate of power electronic components. Then, the results of this step are used in the reliability analysis at the system level.
➢ Solar panel
Solar panels consist of solar cells. These solar cells have a very low failure rate. Most manufactures offer a warranty from 20 to 25 years on their solar module [21] and have demonstrated very high reliability in the field with mean time between failure (MTBF) of 522 and 6666 years for residential and utility systems, respectively [22]. The effect of PV architecture on the overall system reliability is therefore not considered on this work.
➢ DC-link Capacitor
The failure rate of capacitors is considered one of the major factors leading to the failure of PV systems. Capacitances can be made of different materials such as an electrolytic capacitor, paper, plastic film, tantalum and ceramic [23]. Each material has a different failure rate [23]. The electrolytic capacitor is used in this work. The inductance is not considered since it has a low failure rate [24]. Equations (14)–(16) are used to evaluate the failure rate of capacitance (λcap) [25,26,27], where n is the total number of components in the system; λbase is the base failure rate of capacitance and equal to 0.0314 occur/year; πE is the effect of environmental stress and is equal to 1; πQ is the quality factor and is equal to 1; C is the capacitance value in microfarad (µF); and Tj is the junction temperature, which is 50 °C. The total failure rate of DC-link capacitor is 0.4449 occur/year.
λ c a p = n * λ b a s e * π c v * π Q * π E * π T
π c v = 0.34 * C 0.18
π T = exp 4061.74 * ( 1 T j + 273 1 198 )
➢ Inverter
The MTBF of PV-inverter is between 1 to 16 years [22]. Inverter is considered as another major factor leading the failure of PV systems. A three-phase two-level voltage-source inverter is used in this work. This inverter has six switches and diodes. This work does not treat the inverter as one black-box. Each component inside the inverter is considered a major factor in failure. The Reliability Block Diagram (RBD) [28,29] is used in this project. This technique involves the use of switches and diodes connected in series, and this is known as series RBD as shown in Figure 4. The failure rate of the inverter (λinv) can be evaluated using Equation (17). Equations (18)–(21) are used to evaluate the failure rates of diodes (λdiode) [25,26,27].
λ i n v e r t e r = 6 * λ d i o d e + 6 * λ s w i t c h
λ d i o d e = n * λ b a s e * π s * π Q * π E * π T * π c
π T = exp 3091 * ( 1 T j + 273 1 198 )
π s = { 0.054 V S 0.3 V s 2.43 0.3 V s 1 }
V s = o p e r a t e d   v o l a t g e r a t e d   v o l t a g e
where n is the total number of components in the system; λbase is the base failure rate of diodes and is equal to 0.025 occur/year; πE is equal to 6; πS is the electric stress factor; the operating voltage and rated voltages are 607 V and 690 V, respectively; πQ is equal to 5.5; πj is the temperature stress factor; Tj is equal to 50 °C; and πc is the contact construction factor, which is 1. Equations (22) and (21) are used to evaluate the failure rates of the switches (λswitch) [25,26,27].
λ s w i t c h = n * λ b a s e * π Q * π E * π T
π T = exp 1925 * ( 1 T j + 273 1 198 )
where λbase is the base failure rate of the switches, which is 0.012 occur/year; πE is equal to 1; πQ is equal to 5.5; and Tj is equal to 50 °C. The total failure rate of inverter is 0.095 occur/year.
➢ AC Circuit Breaker and Transformer
The reliability database provided by [30] is used to calculate the probability of success and failure of these components.
The reliability data of common PV system components are shown in Table 2. The probability of up and Down states of a central PV system is shown in Table 3. Then, Table 3 is combined with Table 1 to build the overall central PV system model. This model represents the multi-state model of the power output of a central PV system including the component failure factors.

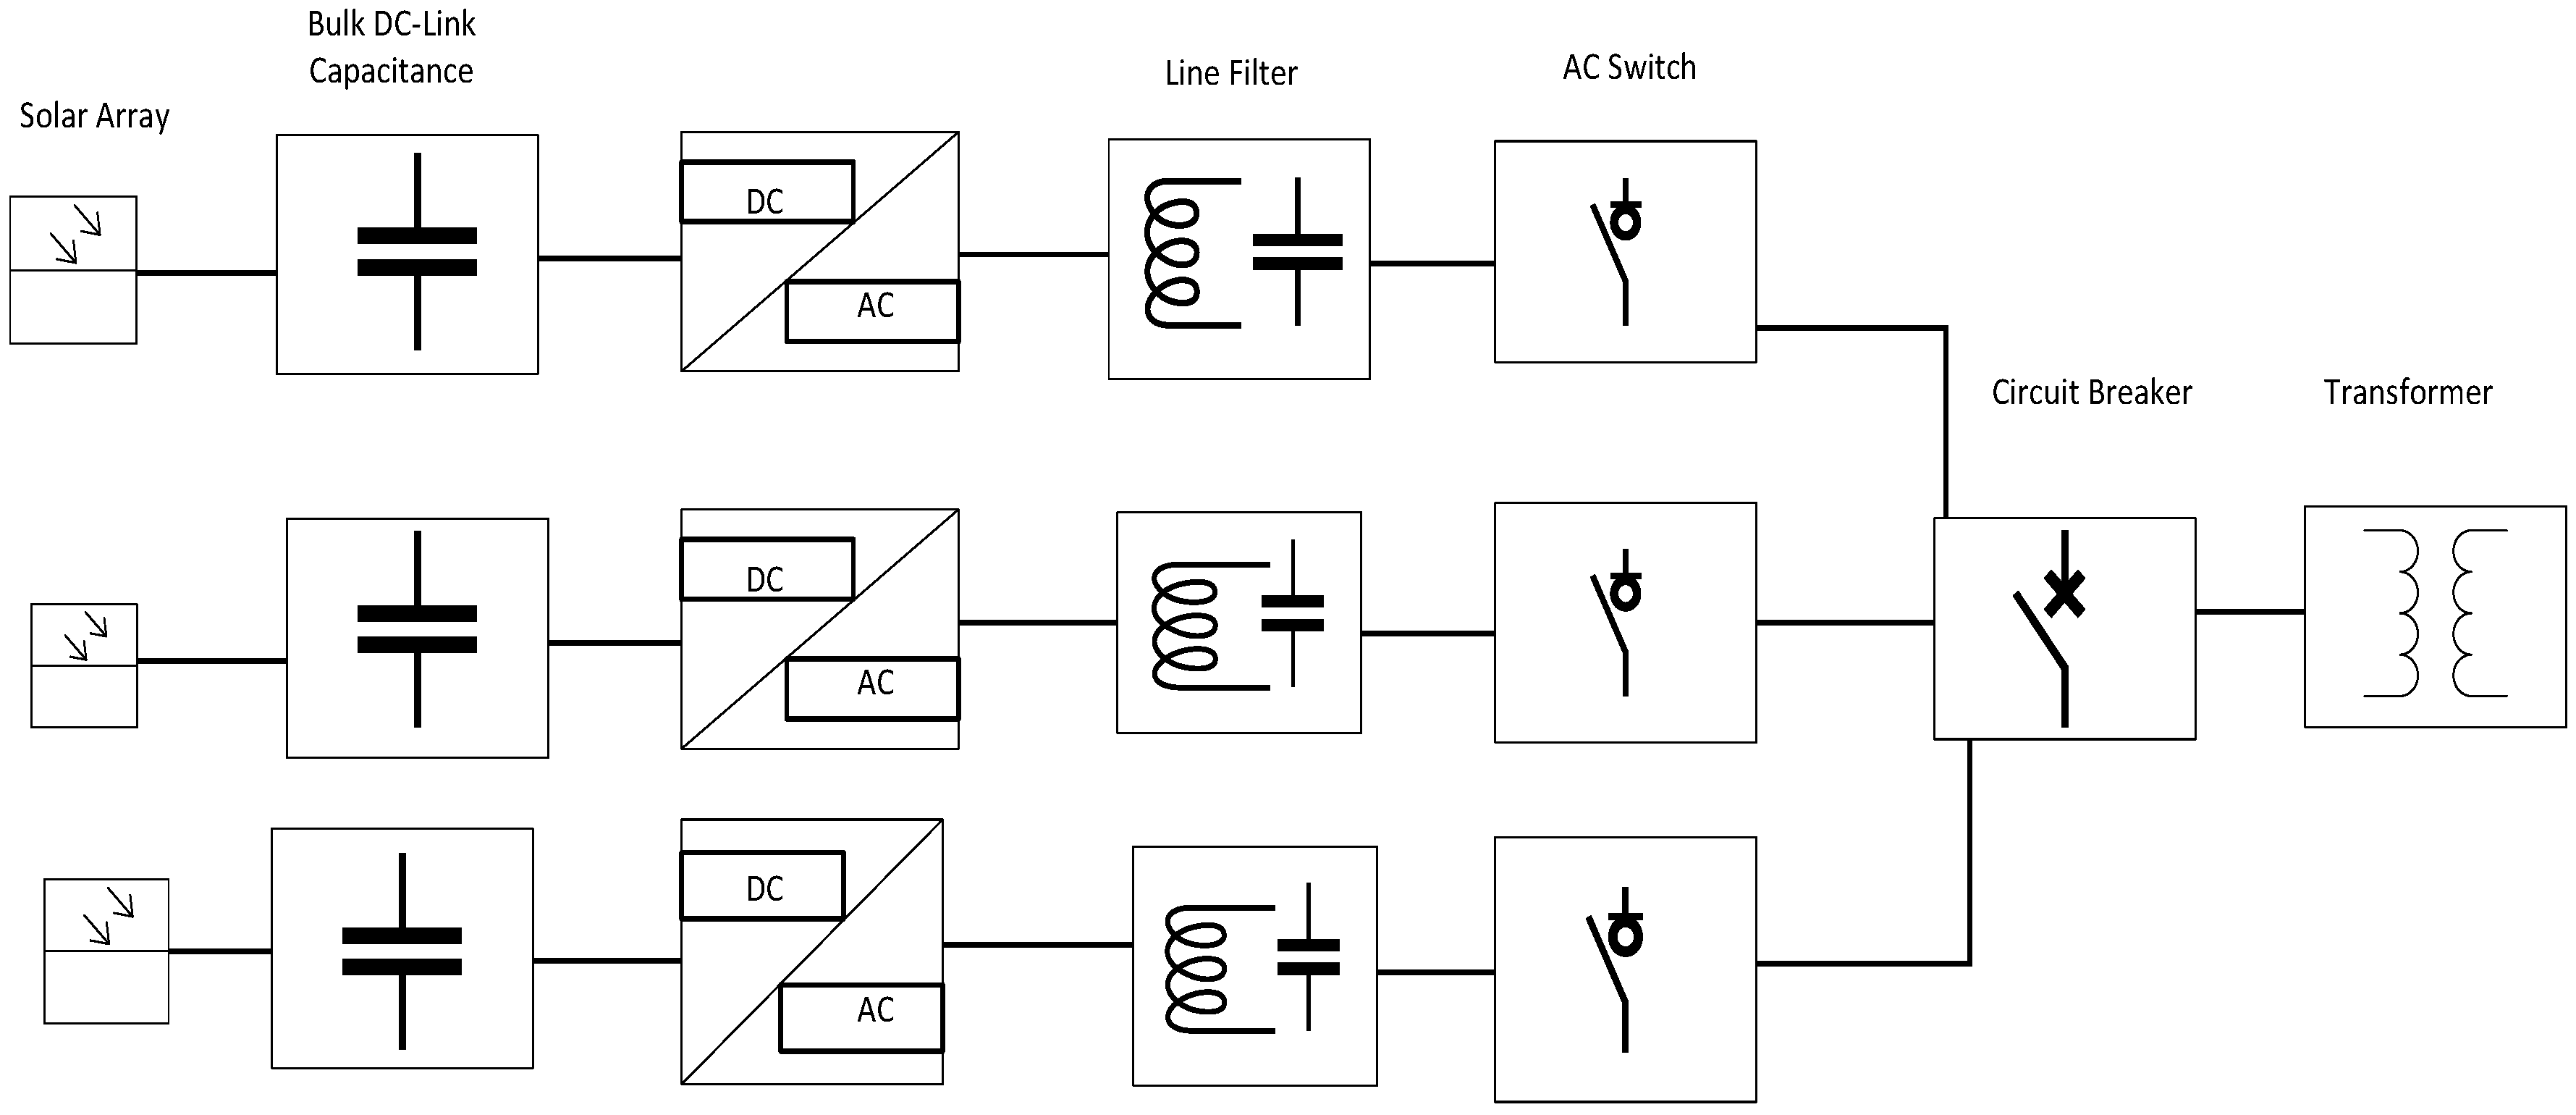
3.3. Reliability Modeling of a String Inverter PV System

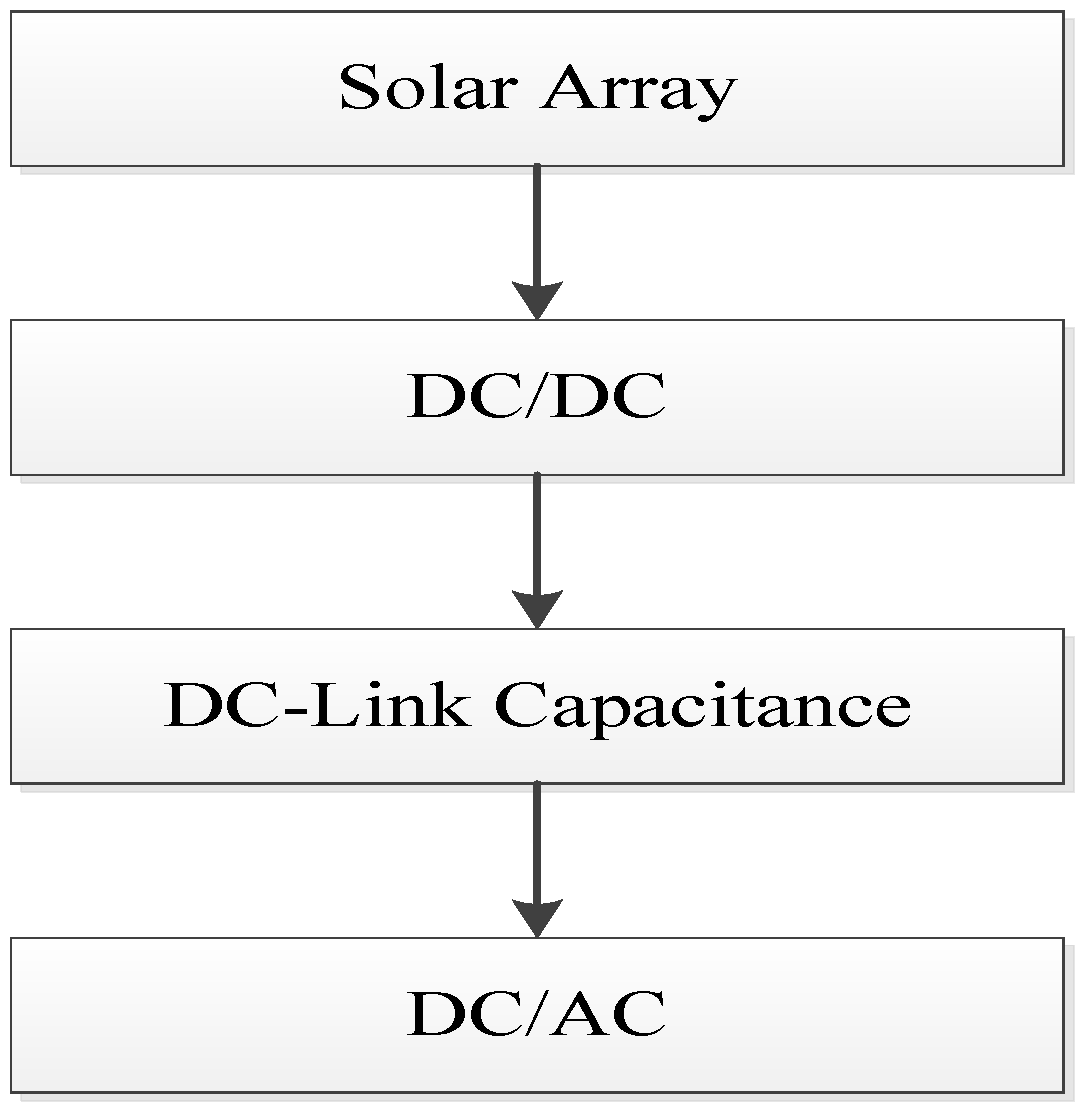
As noted earlier, the schematic construction of a PV inverter plays an important role in the power output of a PV system. A typical PV inverter system as illustrated in 
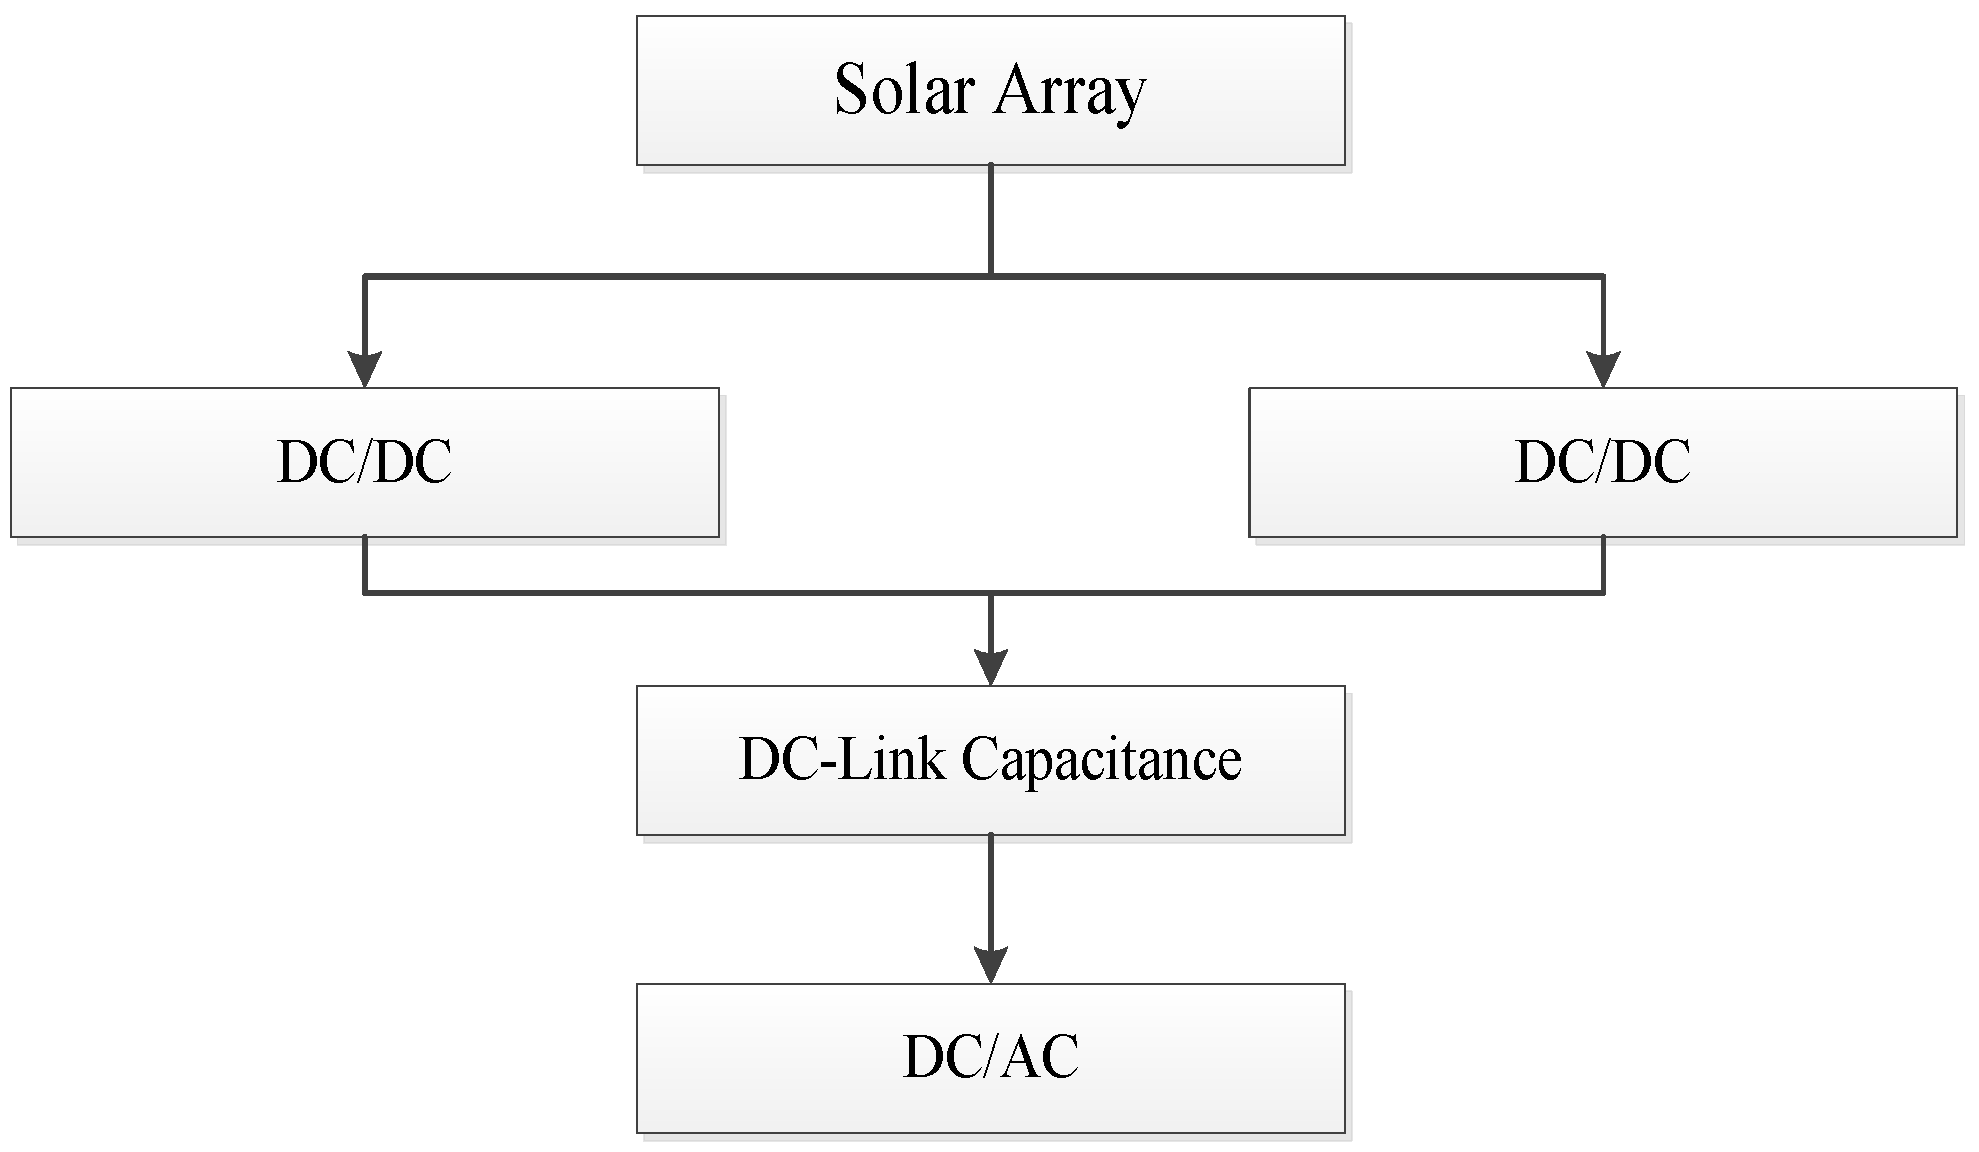
Figure 8 is used in this work. In this design, each string inverter will produce 10 kW, so five string inverters are required to produce 30% of the total installed capacity. The functional block diagram of this PV system is shown in Figure 9.
➢ DC/DC Converter
The boost converter used in this work has one switch, two diodes and one capacitance. The two DC/DC converters are considered in redundancy. This work does not treat the converter as one black-box. Each component inside the converter is considered as a major factor in failure. RBD [28,29] is used in this section. The failure rate of the converter (λDC/DC) can be defined using Equation (24). The prediction methodology used to evaluate the failure rate of each component can be found in MIL-HDBK-217F second edition [20]. Equations (18)–(23) are used to evaluate the failure rates of λdiode and λswitch [25,26,27], where Tj is 60 °C.
λ D C / D C = λ d i o d e + λ s w i t c h
➢ DC-Link Capacitor
As mentioned, the capacitor is recognized as a major contributor to the failure of PV systems. Equations (12)–(14) are utilized to estimate the failure rate of capacitance (λcap) [25,26,27]. The probability of Up states and Down states of a string PV inverter system is shown in Table 4. This table is then combined with Table 1 to build the multi-states model for one string PV system. This model represents the multi-state model of the power output of a string PV system including the component failure factors. Multiple string PV system is used in this work; therefore, the multi-states model obtained are aggregated to obtain the desire PV capacity.

3.4. Reliability Modeling of a Micro-Inverter PV System

The main components of a micro-inverter PV system are illustrated in Figure 10. The steps described in Section 1 and Section 2 are utilized in this section to build the power output model of a PV system. The probability of Up and Down states of micro-inverter PV system components is presented in Table 5. Then, this model is combined with the overall PV system model shown in Table 1. The result of this combination is the multi-state model of one micro-inverter PV system the power output of a PV system. Multiple Micro-inverter PV system is used in this work; therefore the multi-states model obtained are aggregated to obtain the desire PV capacity. The functional block diagram of this PV system is shown in Figure 11.

4. Application of the Developed PV System Models

The reliability impact of the different PV technologies is illustrated on the 150 kW SIPS explained previously. Many SIPS use the deterministic N-1 criterion, also known as the “loss of the largest unit” criterion, to determine the capacity reserve required in their system. This criterion ensures that the peak load can be satisfied in the event of the failure of the largest generating unit. The example SIPS with 80 kW peak load just meets the N-1 criterion. The LOLE and LOEE of the example system are 32.26 h/year and 483.46 kWh/year, respectively. This LOLE value is therefore chosen as the risk criterion in the following studies.
Two case studies are carried out to investigate the reliability impacts of the different PV technologies. The first study examines the reliability contribution of adding PV generation to SIPS. The second study analyzes the capacity value of an installed PV systems. The three different PV topologies are taken into consideration for both studies. Table 6 presents all studies investigated in this work. Installed PV capacity levels of 15, 30 and 45 kW, corresponding to approximately 10%, 20% and 30%, respectively, of the SIPS capacity, are considered.

4.1. Case 1

This studies the reliability contribution of the three different PV technologies as a function of the system peak load. The system LOLE and LOEE are evaluated for different PV topologies. Figure 12 and Figure 13, respectively, show the LOLE and LOEE of the SIPS when 30% of PV is added to the system. The historical solar irradiation data of Al-Madinah in Saudi Arabia located at 24.91° N, 46.41° E, is used to evaluate the power generation from the PV system [16]. It can be noticed in Figure 12 and Figure 13 that the LOLE and LOEE increase as the peak load increases with all PV topologies. These two figures additionally show that using the micro-inverter topology can provide more incremental reliability benefits compared to other PV topologies. However, this increment decreases at certain percentages of the PV system installed where no further benefit can be obtained by further increasing installed PV capacity as discussed in the next section.
Figure 14 represents the system adequacy for different PV topologies for the addition of 30% of the PV capacity to the SIPS at a peak load of 80 kW. Clearly, the results obtained from this analysis show that there is reliability improvement from adding solar power to SIPS using different PV topologies, but not to the same level. The analysis indicates that there is significant impact on system reliability in using different PV topologies. This shows that micro-inverter PV topology provides the largest reliability benefit among other topologies.
This work evaluates the optimum conventional generation capacity that can be replaced by PV generation. This study compares replacing diesel generation with a PV system, considering different PV topologies. The analysis involves adding a proper PV unit to provide an acceptable system reliability level. The 40 kW of conventional generation capacity is removed from SIPS. Table 7 represents the capacity of the PV unit required to replace the 40 kW in order to maintain the acceptable criteria of 32.26 h/year. The LOLE increases when the 40 kW conventional unit is removed for system. When the central PV capacity is used, the LOLE is restored to 32.26 h/year if 270 kW of PV is added. This indicates that 270 kW of PV capacity using central PV system is able to replace a 40 kW conventional generation unit. However, 180 and 98 kW of string and micro-inverter PV capacity is required in order to meet the system risk level of 32.26 h/year.
The equivalence between replaced conventional generation unit and added PV systems can be expressed by the ratio of PV capacity to conventional generation unit and this ratio is known as the risk-based equivalent capacity ratio (RBECR) [31]. Equation (25) is used to determine the RBECR. The results indicates that one unit of conventional capacity is approximately equivalent to 7, 5 and 3 units of central, string and micro-inverter PV capacity, respectively, as shown in Table 7.
RBECR   = Total   amount   of   installed   PV   capacity Total   amount   of   replaced   conventional   generation   capacity

4.2. Case 2

The ELCC and capacity credit of a PV system for different PV topologies are investigated in this work. The LOLE was used in this study in order to evaluate the ELCC for each PV topology. The maximum allowable peak load at adequacy risk of system generation is 32.26 h/year. The amount of load that can be carried by a PV system is estimated by calculating the difference between the two risk indices of LOLE before and after adding PV systems. Figure 15 show the ELCC associated with the addition of 10%–30% of PV systems to SIPS at the three different PV topologies.
Equation (3) is utilized in this case to evaluate the capacity value of PV systems for different PV topologies. Figure 16 demonstrates the PV capacity credit for the three different topologies.
Several important observations can be obtained from this analysis:
  • There is evidence of improvement in overall system adequacy when installing more PV systems at all different PV topologies. The relative reliability benefits estimated by capacity value, however, decrease with the addition of PV capacity. Previous studies have also found that the capacity value of PV declines when installing more PV in the electric power system [32,33]. This is not always the case since the PV topology plays an important role in the contribution of PV capacity value. To illustrate this, when 20% of the PV system is added to SIPS, the solar capacity value increases using both string and a micro-inverter and decreases using a central-inverter as shown in Figure 16.
  • The result clarifies that the micro-inverter PV system provides the largest PV capacity contribution. The capacity credit of the PV system increases from 19% to almost 35.5% when the central PV inverter topology is replaced by a micro-inverter.

5. Conclusions

The power output of PV systems varies according to the availability of solar irradiation and PV system electric components. The existing reference reliability model does not consider all vulnerable PV systems components. This paper introduces a detailed reliability model of a PV system. All critical electric components of PV systems are involved in the model. This model is then applied to a test system to quantify the reliability contribution of adding PV generation considering all three PV topologies. Different factors, such as the effect of system peak load and the installed PV capacity for different PV topologies, are discussed in this paper.
The reliability contribution of solar power is expressed in terms of LOLE, LOEE, ELCC and CC. The results indicate that the inverter can have a significant impact on the reliability contribution compared to other electric and electronic devices in a PV system. The analysis also points out that the reliability contribution of PV capacity is highly dependent on PV system configuration. This observation can be noticed when 20% of PV capacity is installed to SIPS, the capacity credit of PV system increase with utilizing string and micro-inverter and decrease with using central inverter. Additionally, the result demonstrates that using micro-inverter PV system provided the largest reliability contribution from the installed PV generation. The system adequacy indices utilized in this project provide a practical approach to evaluate the reliability of the generation system.

Acknowledgments

The authors would like to thank the Taibah University for the funding support.

Author Contributions

All authors contributed equally to the work. Prof. Rajesh Karki contributed to the research idea and framework of this project and helped in writing manuscript. Ahmad Alferidi designed the models, performed the system studies and wrote the manuscript.

Conflicts of Interest

The authors declare no conflict of interest.

Abbreviations

PVPhotovoltaic
EPIAEuropean Photovoltaic Industry Association
COPTCapacity Outage Probability Table
FORForced Outage Rate
LOEELoss of Energy Expectation
LOLELoss of Load Expectation
LOLPLoss of Load Probability
ELCCEffective Load Carrying Capability
CCCapacity credit
SIPSSmall Isolated Power System
RBDReliability Block Diagram
λFailure Rate
μRepair Rate
MTTFMean Time to Failure
MTTRMean Time to Repair
UUnavailability
AAvailability
GbiGlobal Solar Irradiation
GstdSolar Irradiation in a Standard Environment
RcCertain Irradiation Point
PsnEquivalent Rated Capacity of PV
πEEffect of Environmental Stress
πQQuality Factor
TjJunction Temperature
πSElectric stress factor
πcContact Construction Factor
CCapacitance
LLULoss of the Largest Unit
RBECRRisk-based Equivalent Capacity Ratio

References

  1. Masson, G.; Latour, M.; Rekinger, M.; Theologitis, I.; Papoutsi, M. Global Market Outlook for Photovoltaics 2014–2018; European Photovoltaic Industry Association (EPIA): Brussels, Belgium, 2014. [Google Scholar]
  2. Zhang, P.; Li, W.; Li, S.; Wang, Y.; Xiao, W. Reliability assessment of photovoltaic power systems: Review of current status and future perspectives. Appl. Energy 2013, 104, 822–833. [Google Scholar] [CrossRef]
  3. Roy, A.; Kedare, S.B.; Bandyopadhyay, S. Optimum sizing of wind-battery systems incorporating resource uncertainty. Appl. Energy 2010, 87, 2712–2727. [Google Scholar] [CrossRef]
  4. Moradi-Shahrbabak, Z.; Tabesh, A.; Yousefi, G.R. Economical design of utility-scale photovoltaic power plants with optimum availability. IEEE Trans. Ind. Electron. 2014, 61, 3399–3406. [Google Scholar] [CrossRef]
  5. Billinton, R.; Fotuhi-Firuzabad, M.; Bertling, L. Bibliography on the application of probability methods in power system reliability evaluation 1996–1999. IEEE Trans. Power Syst. 2001, 16, 595–602. [Google Scholar] [CrossRef]
  6. Allan, R.; Billinton, R.; Breipohl, A.; Grigg, C. Bibliography on the application of probability methods in power system reliability evaluation: 1987–1991. IEEE Trans. Power Syst. 1994, 9, 41–49. [Google Scholar] [CrossRef]
  7. Billinton, R.; Allan, R.N. Reliability Evaluation of Power Systems; Plenum Publishing: New York, NY, USA; London, UK, 1996. [Google Scholar]
  8. Li, W. Reliability Assessment of Electrical Power Systems Using Monte Carlo Methods; Springer: New York, NY, USA, 1994. [Google Scholar]
  9. Karki, R.; Billinton, R. Reliability/cost implications of PV and wind energy utilization in small isolated power systems. IEEE Trans. Energy Convers. 2001, 16, 368–373. [Google Scholar] [CrossRef]
  10. Billinton, R.; Karki, R. Maintaining supply reliability of small isolated power systems using renewable energy. IEE Proc. Gener. Transm. Distrib. 2001, 148, 530–534. [Google Scholar] [CrossRef]
  11. Garver, L. Effective load carrying capability of generating units. IEEE Trans. Power Appar. Syst. 1966, 85, 910–919. [Google Scholar] [CrossRef]
  12. Duignan, R.; Dent, C.J.; Mills, A.; Samaan, N.; Milligan, M.; Keane, A.; O’Malley, M. Capacity value of solar power. In Proceedings of the 2012 IEEE Power and Energy Society General Meeting, San Diego, CA, USA, 22–26 July 2012.
  13. Isolated Systems Generating Planning Practices, A Survey of Canadian Utilites; Newfoundland and Labrador Hydro: Newfoundland, NL, Canada, 1995.
  14. Subcommittee, P. IEEE reliability test system. IEEE Trans. Power Appar. Syst. 1979, 6, 2047–2054. [Google Scholar] [CrossRef]
  15. Choi, J.; Park, J.; Shahidehpour, M.; Billinton, R. Assessment of CO2 reduction by renewable energy generators. In Proceedings of the Innovative Smart Grid Technologies (ISGT), Gaithersburg, MD, USA, 19–21 January 2010.
  16. Alabbadi, N.; Alshehiween, A. Saudi Arabian Solar Radiation Network Operation Data Collection and Quality Assessment; King Abdulaziz City for Science and Technology: Riyadh, Saudi Arabia, 2005. [Google Scholar]
  17. Hirschmann, D.; Tissen, D.; Schroder, S.; de Doncker, R.W. Reliability prediction for inverters in hybrid electrical vehicles. IEEE Trans. Power Electron. 2007, 22, 2511–2517. [Google Scholar] [CrossRef]
  18. Wikstrom, P.; Terens, L.A.; Kobi, H. Reliability, availability, and maintainability of high-power variable-speed drive systems. IEEE Trans. Ind. Appl. 2000, 36, 231–241. [Google Scholar] [CrossRef]
  19. Song, Y.; Wang, B. Survey on reliability of power electronic systems. IEEE Trans. Power Electron. 2013, 28, 591–604. [Google Scholar] [CrossRef]
  20. Handbook, M. Reliability Prediction of Electronic Equipment; 217 F Notice 2; Department of the United States Defense: Washington, DC, USA, 1995. [Google Scholar]
  21. Anand, S.; Gundlapalli, S.K.; Fernandes, B.G. Transformer-less grid feeding current source inverter for solar photovoltaic system. IEEE Trans. Ind. Electron. 2014, 61, 5334–5344. [Google Scholar] [CrossRef]
  22. Ristow, A.; Begovic, M.; Pregelj, A.; Rohatgi, A. Development of a methodology for improving photovoltaic inverter reliability. IEEE Trans. Ind. Electron. 2008, 55, 2581–2592. [Google Scholar] [CrossRef]
  23. Liu, J.; Henze, N. Reliability consideration of low-power grid-tied inverter for photovoltaic application. In Proceedings of the 24th European Photovoltaic Solar Energy Conference and Exhibition, Hamburg, Germany, 21–25 September 2009.
  24. Ghaedi, A.; Abbaspour, A.; Fotuhi-Firuzabad, M.; Moeini-Aghtaie, M.; Othman, M. Reliability evaluation of a composite power system containing wind and solar generation. In Proceedings of the IEEE 7th International Power Engineering and Optimization Conference (PEOCO), Langkawi, Malaysia, 3–4 June 2013.
  25. Chan, F.; Calleja, H. Reliability estimation of three single-phase topologies in grid-connected PV systems. IEEE Trans. Ind. Electron. 2011, 58, 2683–2689. [Google Scholar] [CrossRef]
  26. Harb, S.; Balog, R.S. Reliability of candidate photovoltaic module-integrated-inverter topologies. In Proceedings of the 2012 Twenty-Seventh Annual IEEE Applied Power Electronics Conference and Exposition (APEC), Orlando, FL, USA, 5–9 February 2012.
  27. Abdi, B.; Ranjbar, A.H.; Gharehpetian, G.B.; Milimonfared, J. Reliability considerations for parallel performance of semiconductor switches in high-power switching power supplies. IEEE Trans. Ind. Electron. 2009, 56, 2133–2139. [Google Scholar] [CrossRef]
  28. Kuo, W.; Zuo, M.J. Optimal Reliability Modeling: Principles and Applications; John Wiley & Sons/Wiley: Hoboken, NJ, USA, 2003. [Google Scholar]
  29. Lisnianski, A. Extended block diagram method for a multi-state system reliability assessment. Reliab. Eng. Syst. Saf. 2007, 92, 1601–1607. [Google Scholar] [CrossRef]
  30. Bollen, M. Literature Search for Reliability Data of Components in Electric Distribution Networks; Eindhoven University of Technology: Eindhoven, The Netherlands, 1993. [Google Scholar]
  31. Gen, B. Reliability and Cost/Worth Evaluation of Generating Systems Utilizing Wind and Solar Energy. Ph.D. Thesis, University of Saskatchewan, Saskatoon, Saskatchewan, 2005. [Google Scholar]
  32. Perez, R.; Seals, R.; Stewart, R. Assessing the load matching capability of photovoltaics for US utilities based upon satellite-derived insolation data. In Proceedings of the Twenty Third IEEE Photovoltaic Specialists Conference, Louisville, KY, USA, 10–14 May 1993.
  33. Perez, R.; Margolis, R.; Kmiecik, M.; Schwab, M.; Perez, M. Update: Effective load carrying capability of photovoltaics in the United States. In Proceedings of the ASES Annual Conference, Denver, CO, USA, 9–13 July 2006.
Figure 1. Basic Reliability Evaluation Model for a photovoltaic (PV)-integrated Power System.
Applsci 07 00176 g001
Figure 2. Evaluation of loss of load expectation (LOLE) and loss of energy expectation (LOEE) using an hourly load curve.
Applsci 07 00176 g002
Figure 3. Evaluation of effective load carrying capability (ELCC).
Applsci 07 00176 g003
Figure 4. Series reliability block network with n subsystems.
Applsci 07 00176 g004
Figure 5. The power output of solar cell.
Applsci 07 00176 g005
Figure 6. Schematic of a typical central PV system.
Applsci 07 00176 g006
Figure 7. Functional block diagram of a central PV system.
Applsci 07 00176 g007
Figure 8. Schematic of one string PV system inverter.
Applsci 07 00176 g008
Figure 9. Functional block diagram of one string PV inverter.
Applsci 07 00176 g009
Figure 10. Schematic of one micro-inverter PV System.
Applsci 07 00176 g010
Figure 11. Functional block diagram of a micro-inverter PV System.
Applsci 07 00176 g011
Figure 12. Variation in risk level (LOLE) with system demand load for different PV topologies.
Applsci 07 00176 g012
Figure 13. Variation in risk level (LOEE) with system demand load for different PV topologies.
Applsci 07 00176 g013
Figure 14. System Adequacy for Different PV Topologies.
Applsci 07 00176 g014
Figure 15. Effective load carrying capability for different PV topologies.
Applsci 07 00176 g015
Figure 16. Capacity credit for three different topologies.
Applsci 07 00176 g016
Table 1. Multi-state Model of PV capacity without considering PV system topology.
StatesCapacity (pu)ProbabilityStatesCapacity (pu)Probability
100.4774120.5250.023
20.004170.0763130.5750.0223
30.03750.0313140.6250.0255
40.10420.0217150.6750.0300
50.1750.0195160.7250.0274
60.2250.0252170.7750.0239
70.2750.0212180.8250.0223
80.3250.0201190.8750.0244
90.3750.0172200.9250.0193
100.4250.0219210.9750.0182
110.4750.02352210.0081
Table 2. Failure and Repair Data.
ComponentFailure Rate (occur/year) Repair Time (hour)
Capacitance0.0314100
Diode0.02596
IGBT0.012513
Circuit Breaker0.00354
Transformer0.006168
Table 3. Two-state model of a central PV system.
StatesProbability
Up0.984649773
Down0.015350227
Table 4. Two States model of string PV system components.
StatesProbability
Up0.988074411
Down0.011925589
Table 5. Two states model of micro-inverter PV system components.
StatesProbability
Up0.986877683
Down0.013122317
Table 6. Cases study results.
CasesEvaluationFactors
1System Adequacy (LOLE, LOEE)
Using the “loss of the largest unit or N-1 to define the deterministic criterion
Using different PV Topologies
Increasing load demand for the example test system by approximately 10% every year ranging from 80 to 118 kW
Using different system PV capacity ranging from 10% to 30%
2Capacity Value (ELCC, C.C)
Table 7. Replacing a conventional generation unit by a PV System.
PV TopologyPV Capacity (kW)RBECR
Central2706.75
String1804.50
Micro-inverter982.45

