1. Introduction
In this technological era, information technology is effectively being used in numerous aspects of our lives. The communication problems between humans and information have gradually made machines more important.
One of speech recognition systems’ most significant purposes is to provide human–computer communication through speech communication from users in a widespread manner and enable a more extensive use of computer systems that facilitate the work of people in many fields.
Speech is the primary form of communication among people. People have the ability to understand the meaning and to recognize the speaker, gender of speaker, age and emotional situation of the speaker [
1]. Voice communication among people starts with a thought and intent activating neural actions generating speech sounds in the brain. The listener receives the speech through the auditory system converting the speech to neural signals that the brain can comprehend [
2,
3].
Many important computer and internet technology based studies intended to facilitate the lives of hearing impaired individuals are being performed. Through these studies, attempts are being made to improve the living quality of hearing impaired individuals.
The most important problem of hearing impaired individuals is their inability to perceive the point where the sound is coming from. In this study, our primary objective was to enable hearing impaired individuals to perceive the direction of sound and to turn towards that direction. Another objective was to ensure hearing impaired individuals can disambiguate their attention by perceiving whether the speaker is speaking softly or loudly.
Basically, the work performed by a voice recognition application is to receive the speech data and to estimate what is being said. For this purpose, the sound received from the mic, in other words the analogue signal is first converted to digital and the attributes of the acoustic signal is obtained for the determination of required properties.
The sound wave forming the sound includes two significant properties. These properties are amplitude and frequency. While frequency determines the treble and gravity properties of sound, the amplitude determines the severity of sound and its energy. Sound recognition systems benefit from analysis and sorting of acoustic signals.
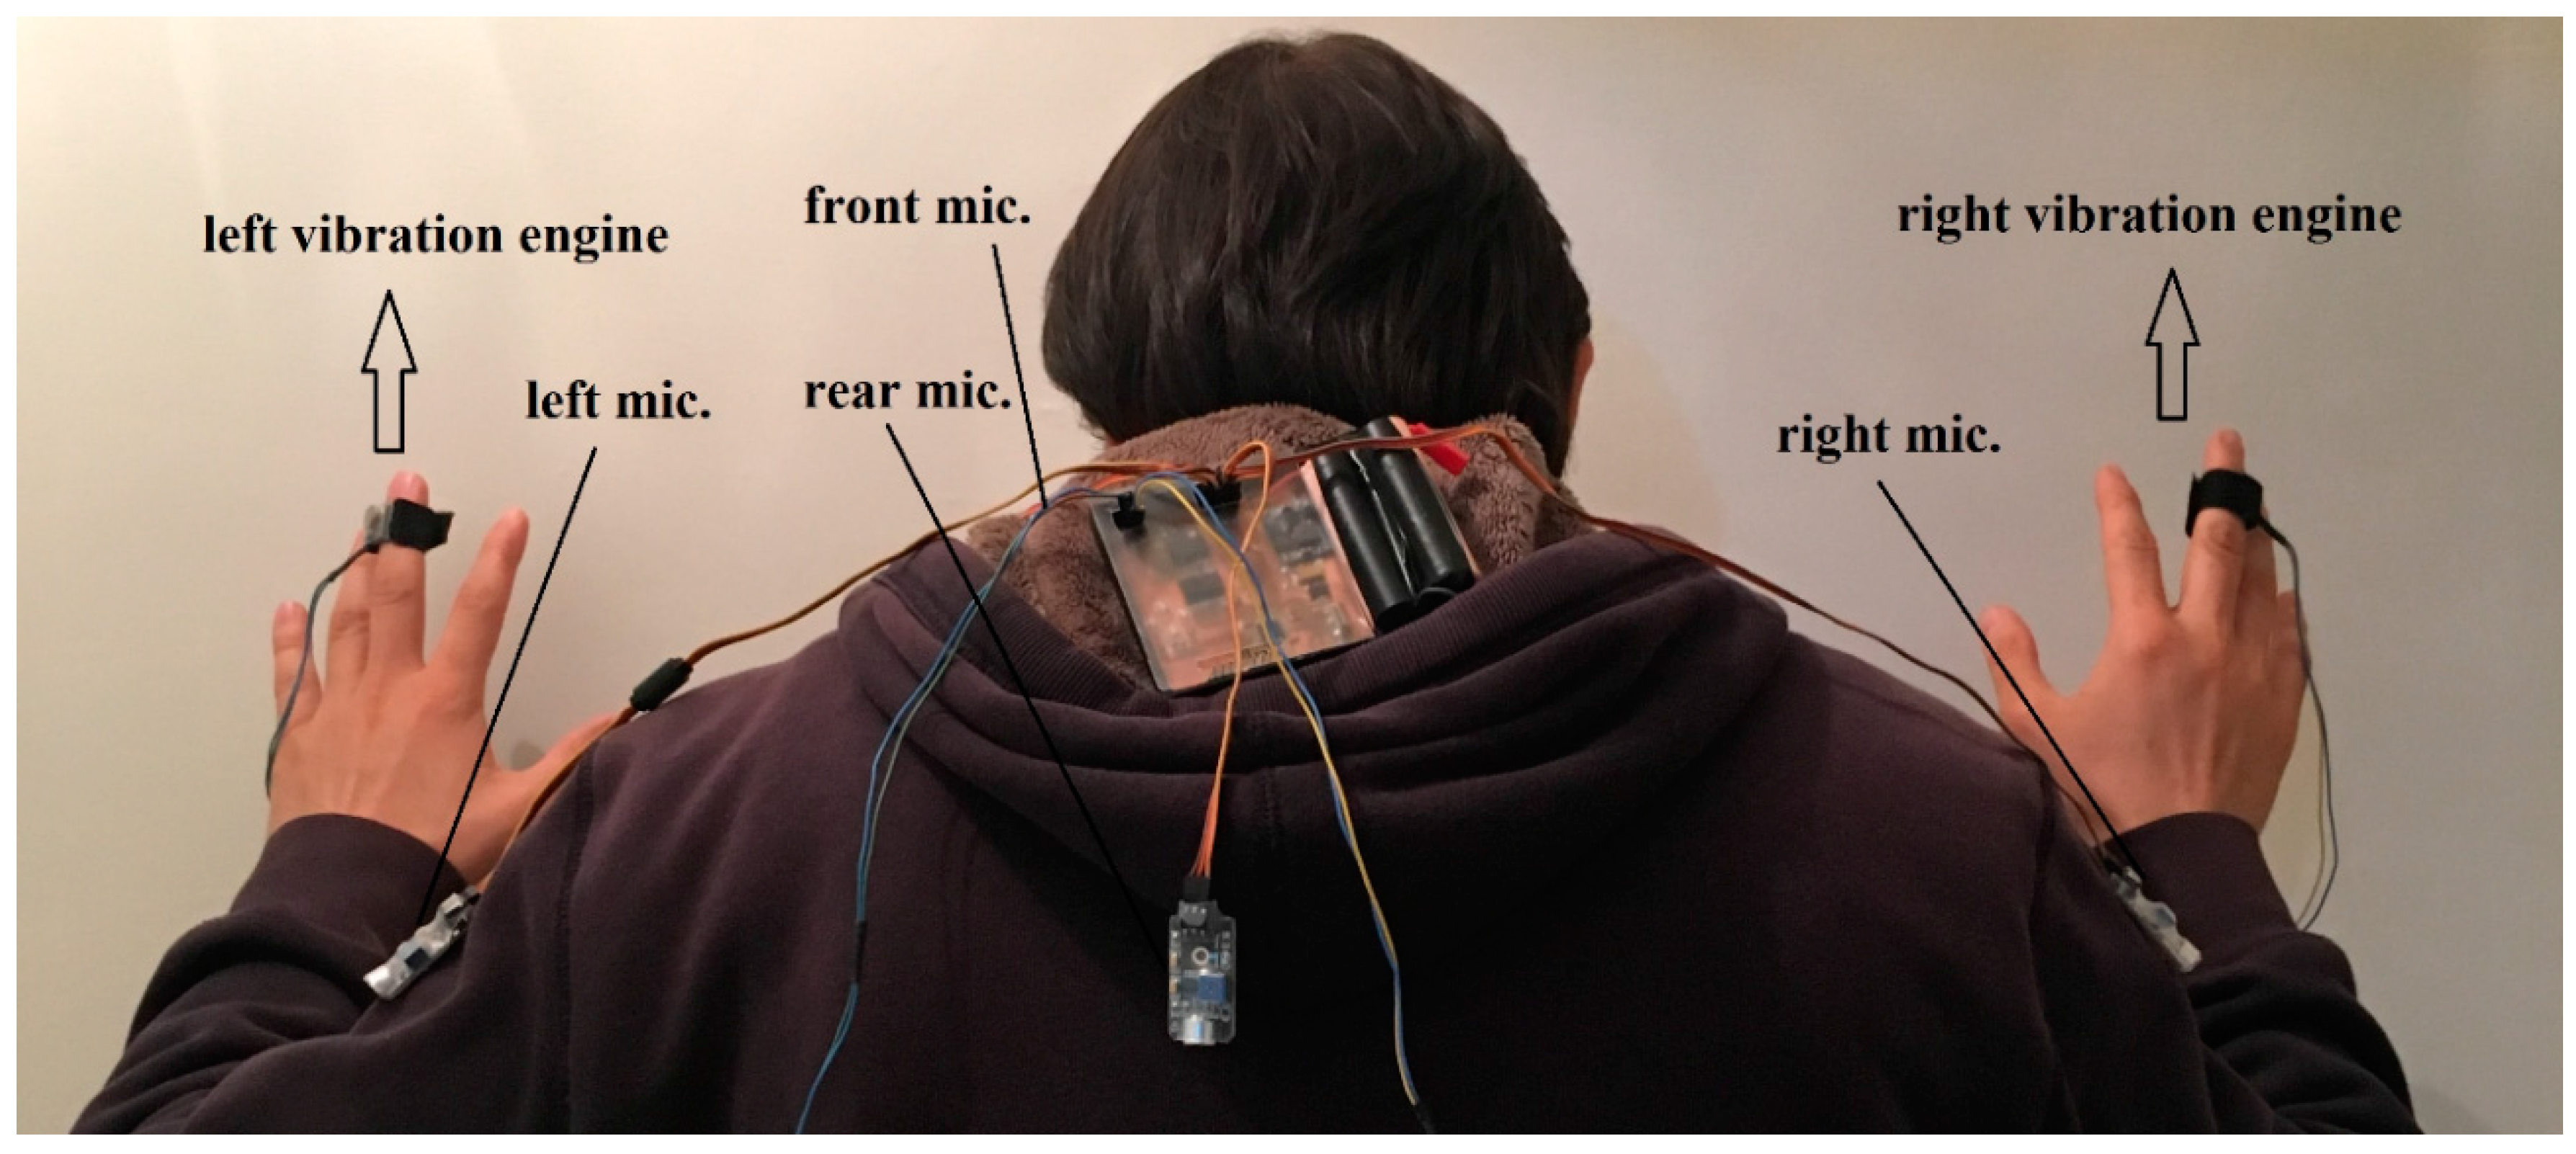
As shown in
Figure 1, our wearable device has also been tested in real time and the results have been compared. In
Figure 1, the device is mounted on the clothes of deaf users and it responds instantaneously to vibrations in real time and detects the deaf person.
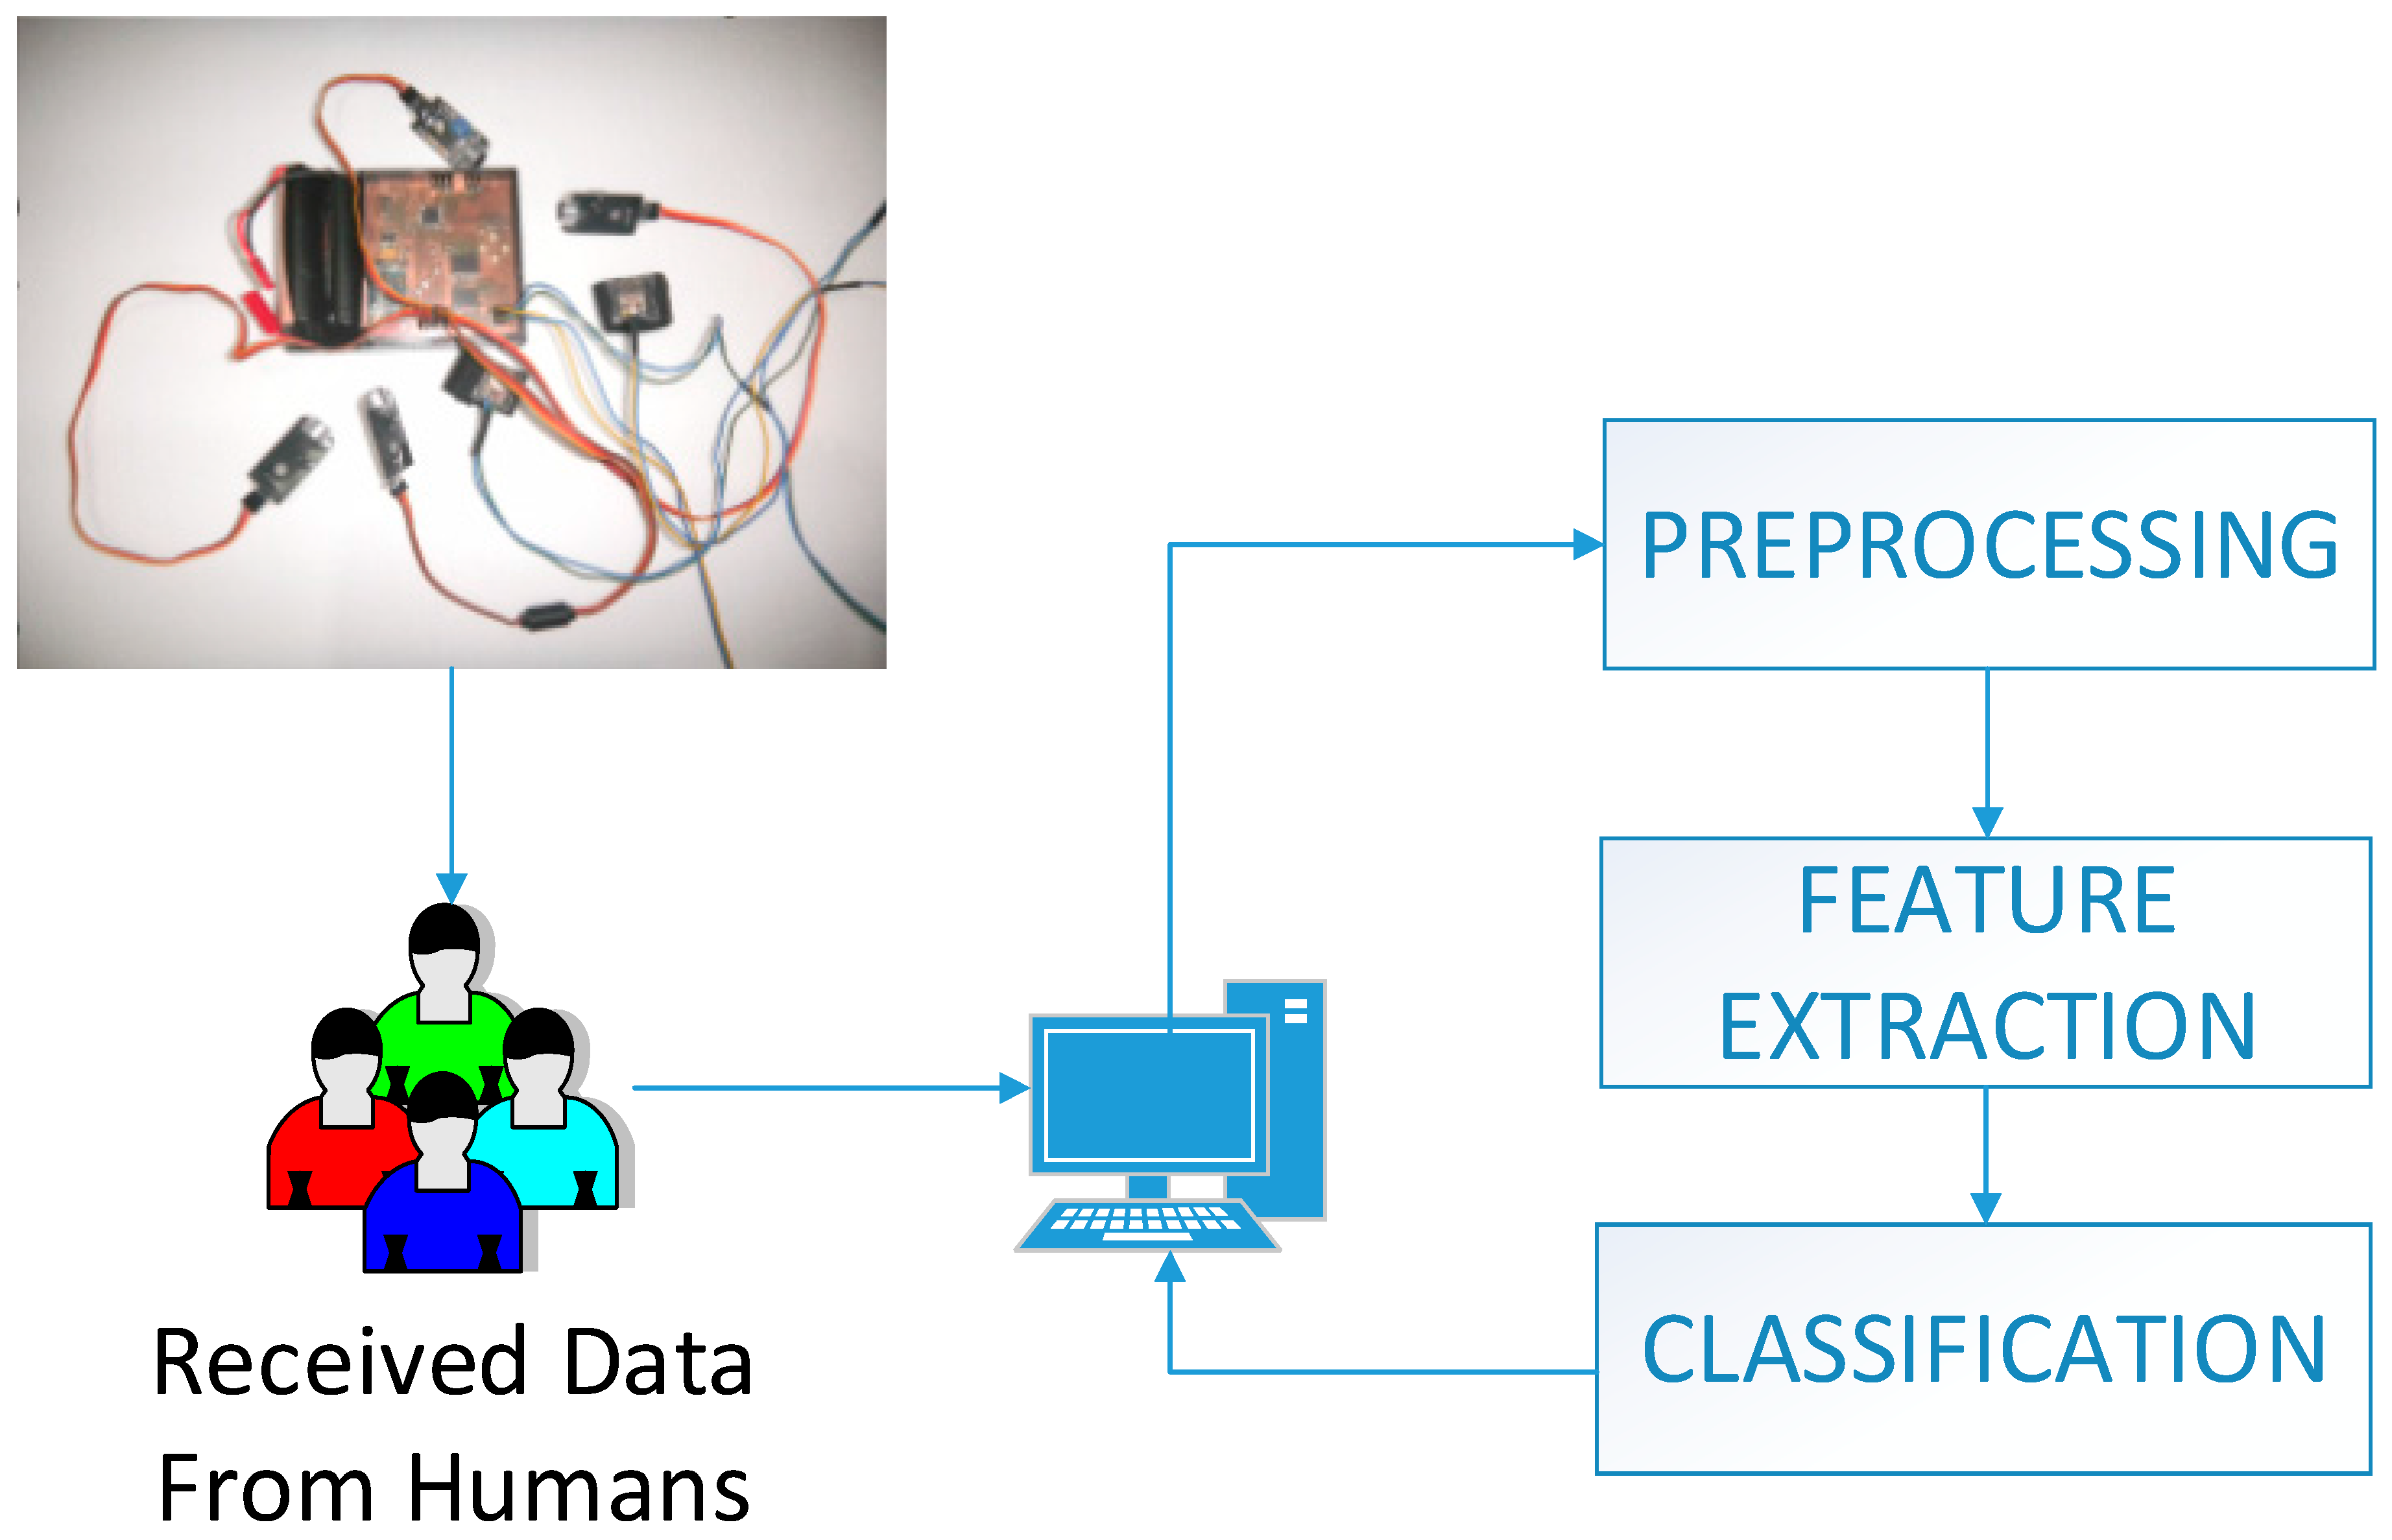
As can be seen in the system in
Figure 2, data obtained from individuals are transferred to the computer via the system we developed. Through this process, the obtained data passes the stages of pre-processing, feature extraction and classification, then the direction of voices is detected; this has also been tested in real time in this study. Subjects were given real time voices and whether they could understand where the voices were coming from was observed.
The main purpose of this study was to let people with hearing disabilities hear sounds that were coming from behind such as brake sounds and horn sounds. Sounds coming from behind are a significant source of anxiety for people with hearing disabilities. In addition, hearing the sounds of brakes and horns is important and allows people with hearing disabilities to have safer journeys. It will provide immediate extra perception and decision capabilities in real time to people with hearing disabilities; the aim is to make a product that can be used in daily life by people with hearing disabilities and to make their lives more prosperous.
2. Related Works
Some of the most common problems are the determinations of the age, gender, sensual situation and feasible changing situations of the speaker like being sleepy or drunk. Defining some aspects of the speech signal in a period of more than a few seconds or a few syllables is necessary to create a high number appropriate high-level attribute and to conduct the general machinery learning methods for high-dimensional attributes data. In the study of Pohjalainen et al., researchers have focused on the automatic selection of usable signal attributes in order to understand the assigned paralinguistic analysis duties better and with the aim to improve the classification performance from within the big and non-elective basic attributes cluster [
4].
In a period when the interaction between individuals and machines has increased, the definition-detection of feelings might allow the creation of intelligent machinery and make emotions, just like individuals. In voice recognition and speaker definition applications, emotions are at the forefront. Because of this, the definition of emotions and its effect on speech signals might improve the speech performance and speaker recognition systems. Fear type emotion definition can be used in the voice-based control system to control a critical situation [
5].
In the study of Vassis et al., a wireless system on the basis of standard wireless techniques was suggested in order to protect the mobile assessment procedure. Furthermore, personalization techniques were implemented in order to adapt the screen display and test results according to the needs of the students [
6].
In their study, Shivakumar and Rajasenathipathi connected deaf and blind people to a computer using these equipment hardware control procedures and a screen input program in order to be able to help them benefit from the latest computer technology through vibrating gloves for communication purposes [
7].
The window of deaf and blind people opening up to the world is very small. The new technology can be helpful in this, but it is expensive. In their study, Arato et al. developed a very cost-effective method in order to write and read SMS using a smart phone with an internal vibrating motor and tested this. Words and characters were turned into vibrating Braille codes and Morse words. Morse was taught in order to perceive the characters as codes and words as a language [
8].
In the study of Nanayakkara et al., the answer to the question whether the tactual and visual knowledge combination can be used in order to increase the music experimentation in terms of the deaf was asked, and if yes, how to use it was explored. The concepts provided in this article can be beneficial in turning other peripheral voice types into visual demonstration and/or tactile input tools and thus, for example, they will allow a deaf person to hear the sound of the doorbell, footsteps approaching from behind, the voice of somebody calling for him, to understand speech and to watch television with less stress. This research shows the important potential of deaf people in using the existing technology to significantly change the way of experiencing music [
9].
The study of Gollner et al. introduces a new communication system to support the communication of deaf and blind people, thus consolidating their freedom [
10].
In their study, Schmitz and Ertl developed a system that shows maps in a tactile manner using a standard noisy gamepad in order to ensure that blind and deaf people use and discover electronic maps. This system was aimed for both indoor and outdoor use, and thus it contains mechanisms in order to take a broad outline of larger areas in addition to the discovery of small areas. It was thus aimed to make digital maps accessible using vibrations [
11].
In their study, Ketabdar and Polzehl developed an application for mobile phones that can analyze the audio content, tactile subject and visual warnings in case a noisy event takes place. This application is especially useful for deaf people or those with hearing disorder in that they are warned by noisy events happening around them. The voice content analysis algorithm catches the data using the microphone of the mobile phone and checks the change in the noisy activities happening around the user. If any change happens and other conditions are encountered, the application gives visual or vibratory-tactile warnings in proportion to the change of the voice content. This informs the user about the incident. The functionality of this algorithm can be further developed with the analysis of user movements [
12].
In their study, Caetano and Jousmaki recorded the signals from 11 normal-hearing adults up to 200 Hz vibration and transmitted them to the fingertips of the right hand. All of the subjects reported that they perceived a noise upon touching the vibrating tube and did not sense anything when they did not touch the tube [
13].
Cochlear implant (CI) users can also benefit from additional tactile help, such as those performed by normal hearing people. Zhong et al. used two bone-anchored hearing aids (BAHA) as a tactile vibration source. The two bone-anchored hearing aids connected to each other by a special device to maintain a certain distance and angle have both directional microphones, one of which is programmed to the front left and the other to the front right [
14].
There are a large number of CI users who will not benefit from permanent hearing but will benefit from the tips available in low frequency information. Wang and colleagues have studied the skill of tactile helpers to convey low frequency cues in the study because the frequency sensitivity of human haptic sense is similar to the frequency sensitivity of human acoustic hearing at low frequencies. A total of 5 CI users and 10 normal hearing participants provide adaptations that are designed for low predictability of words and rate the proportion of correct and incorrect words in word segmentation using empirical expressions balanced against syllable frequency. The results of using the BAHA show that there is a small but significant improvement on the ratio of the tactile helper and correct words, and the word segmentation errors are decreasing. These findings support the use of tactile information in the perceptual task of word segmentation [
15].
In the study of Mesaros et al., various metrics recommended for assessment of polyphonic sound event perception systems used in realist cases, where multiple sound sources are simultaneously active, are presented and discussed [
16].
In the study of Wang et al., the subjective assessment over six deaf individuals with V-form audiogram suggests that there is approximately 10% recovery in the score of talk separation for monosyllabic Word lists tested in a silent acoustic environment [
17].
In the study of Gao et al., a system designed to help deaf people communicate with others was presented. Some useful new ideas in design and practice are proposed. An algorithm based on geometric analysis has been introduced in order to extract the unchanging feature to the signer position. Experiments show that the techniques proposed in the Gao et al. study are effective on recognition rate or recognition performance [
18].
In the study of Lin et al., an audio classification and segmentation method based on Gabor wavelet properties is proposed [
19].
Tervo et al. recommends the approach of spatial sound analysis and synthesis for automobile sound systems in their study. An objective analysis of sound area in terms of direction and energy provides the synthesis of the emergence of multi-channel speakers. Because of an automobile cabin’s excessive acoustics, the authors recommend a few steps to make both objective and perception performance better [
20].
3. Materials and Methods
In the first phase, our wearable system was tested and applied in real-time. Our system estimates new incoming data in real time and gives information to the user immediately via vibrations. Our wearable device predicts the direction again as the system responds and redirects the user. Using this method helped find the best of the methods described in the previous section and that method was implemented. Different voices were provided from different directions to subjects and they were asked to guess the direction of each. These results were compared with real results and the level of success was determined for our wearable system.
In the second phase, the system is connected to the computer and the voices and their directions were transferred to a digital environment. Data collected from four different microphones were kept in matrixes each time and thus a data pool was created. The created data passed the stages of preprocessing, feature extraction and classification, and was successful. A comparison was made with the real time application and the results were interpreted.
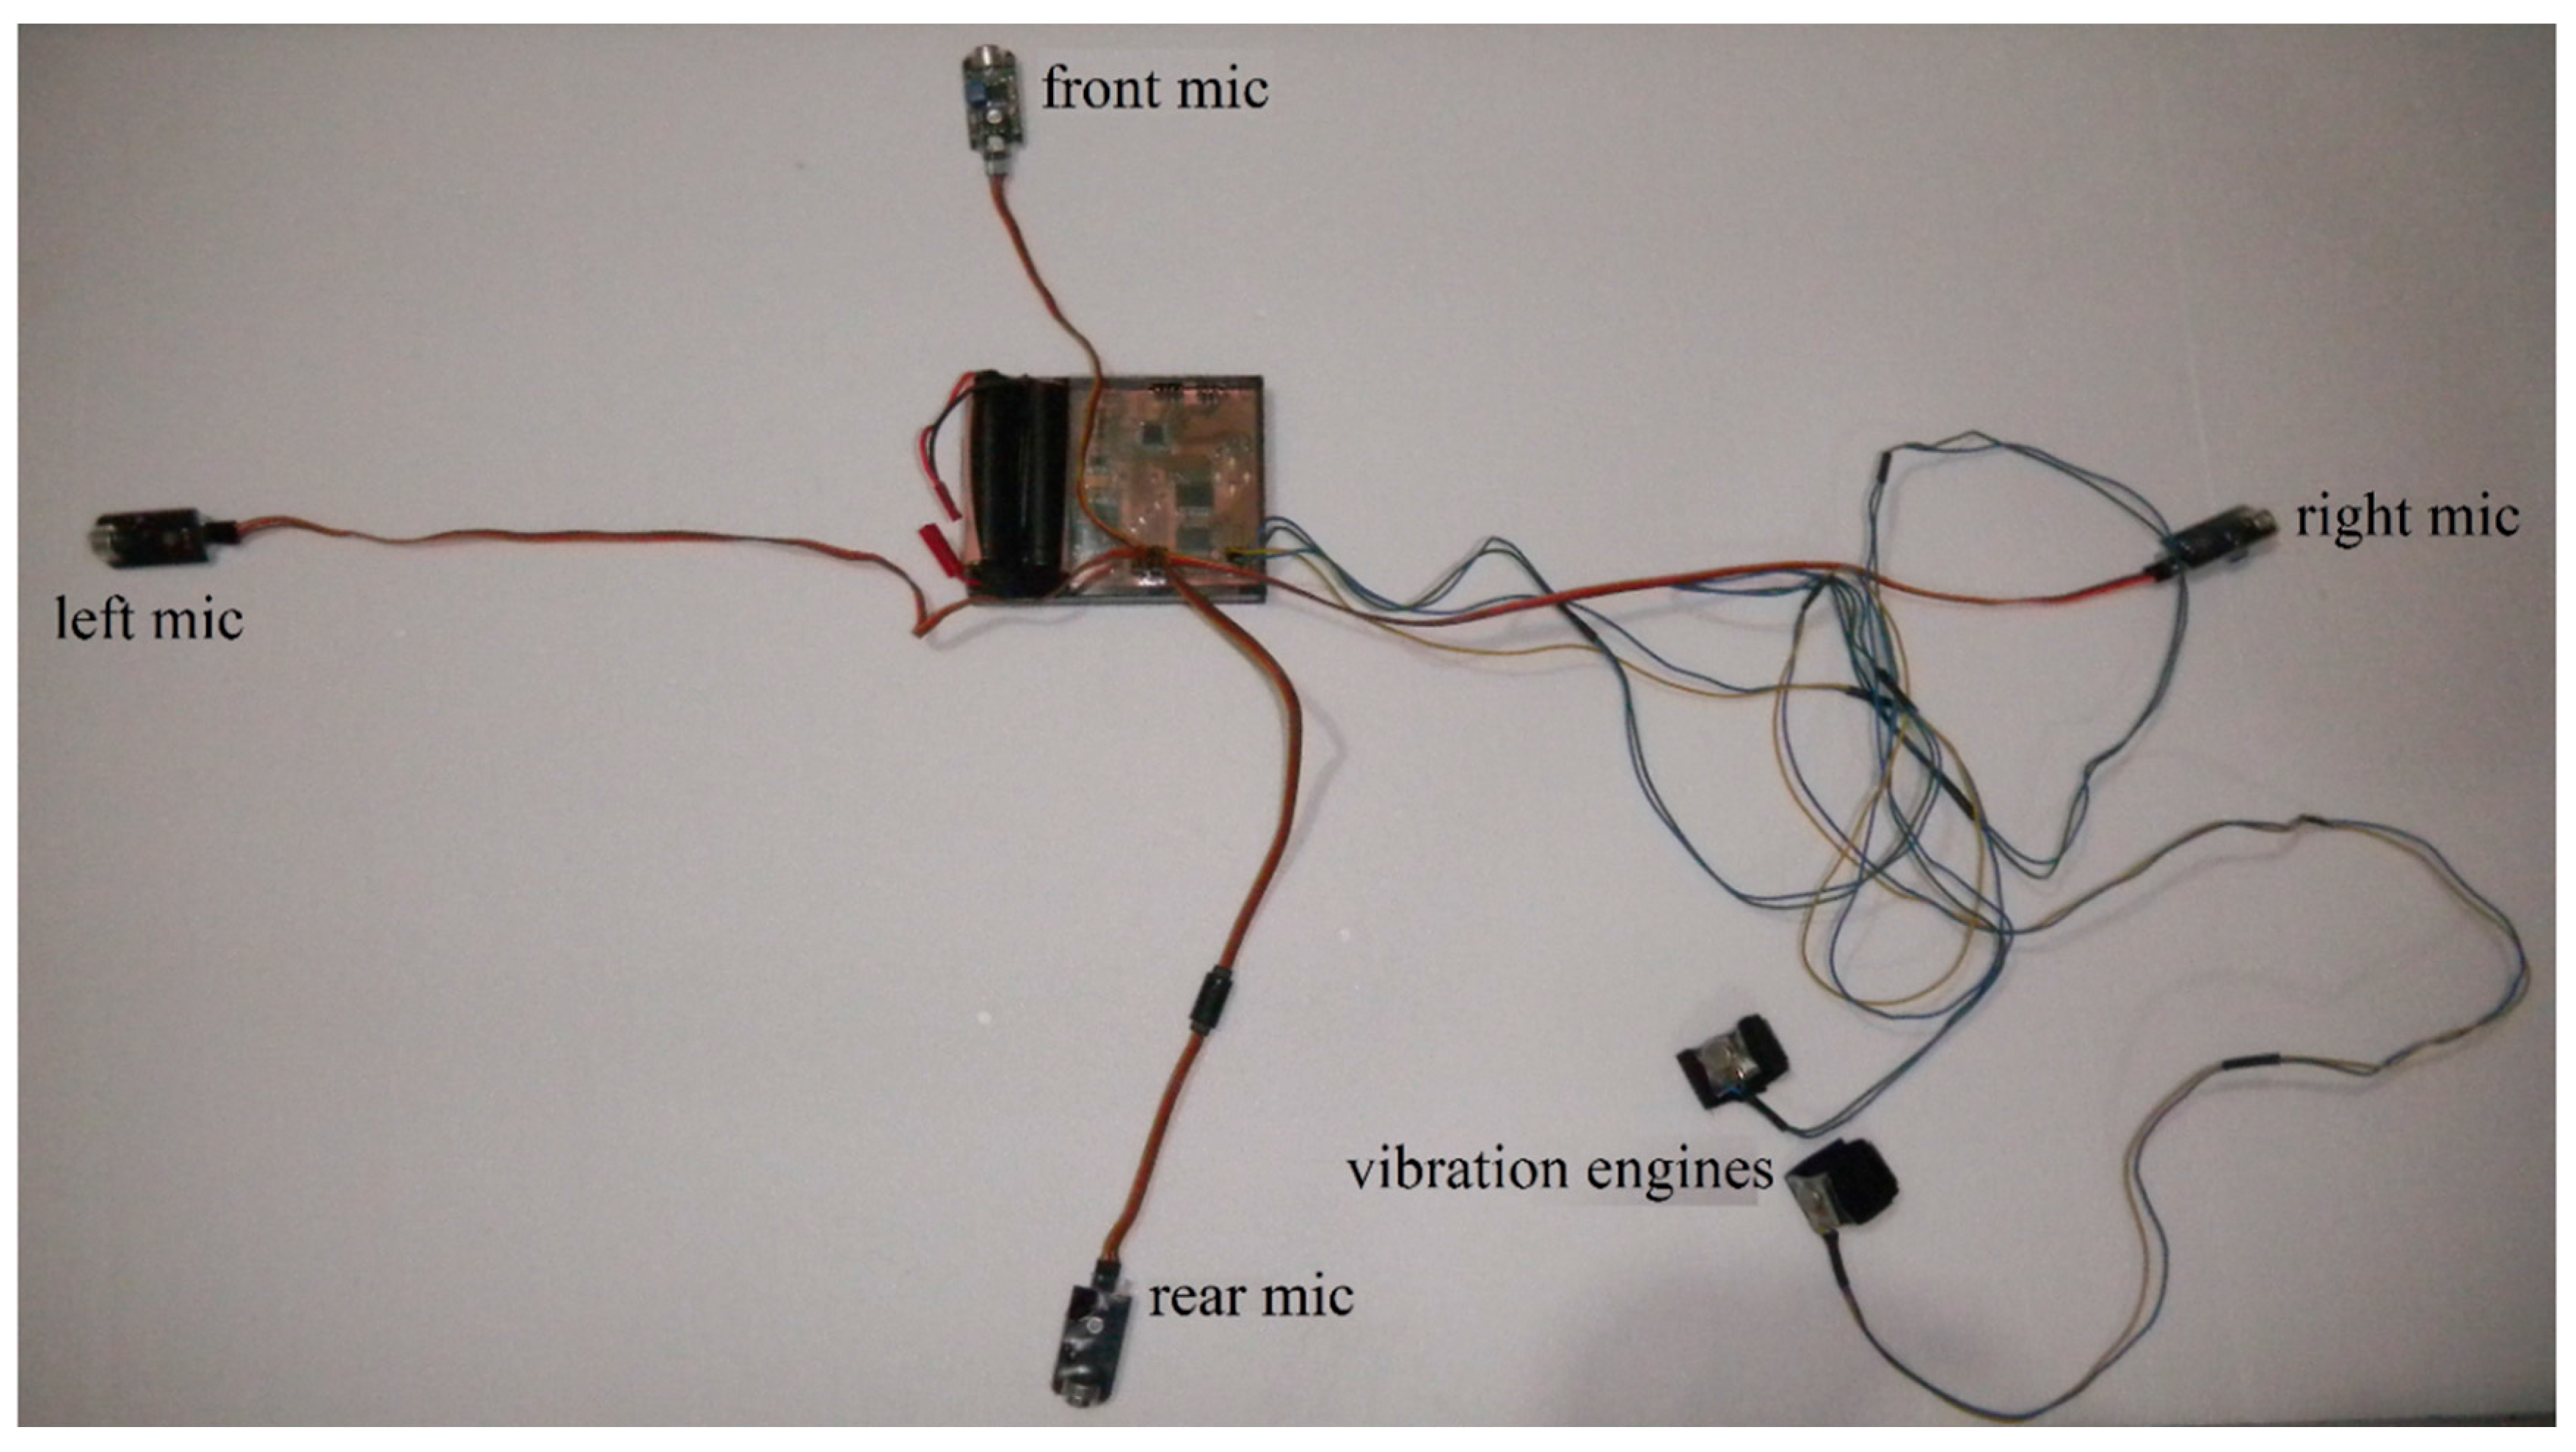
The developed wearable system (see
Figure 3) had four microphone inlets. Four microphones were required to ensure distinguishable differentiation in the four basic directions. The system was first tested using three microphones, but four were deemed necessary due to three obtaining low success rates and due to there being four main directions. They were placed to the right, left, front, and rear of the individual through the developed human–computer interface system. The experimental results showed accuracy improved if four microphones were used instead of three. Two vibration motor outlet units were used in the developed system; placing the vibration motors on the right and left fingertips permitted the indication of the direction of sound by specific vibration frequencies. The most important reason in the preference of fingertips is the high number of nerves present in the fingertips. Moreover, vibration motors placed on the fingertips are easier to use and do not disturb the individual.
The developed system has four Light Emitting Diode (LED) outlets; when sound is perceived, the LED of the outlet in the perceived direction of vibration is lit. The use of both vibration and LED ensures that the user can more clearly perceive the relevant direction is perceived. We use LEDs to give a visual warning. Meanwhile, the use of four different LED lights is considered for the four different directions. If the user cannot interpret the vibrations, they can gain clarity by looking at the LEDs. The role of vibration in this study is to activate the sense of touch for hearing-impaired individuals. Through touch, hearing-impaired individuals will be able to gain understanding more easily and will have more comfort.
The features of the device we have developed are; ARM-based 32-bit MCU with Flash memory. 3.6 V application supply, 72 MHz maximum frequency, 7 timers, 2 ADCs, 9 com. Interfaces. Rechargeable batteries were used for our wearable device. The batteries can work for about 10 h.
In vibration, individuals are able to perceive the coming sound with a difference of 20 ms, and the direction of coming sound can be determined at 20 ms after giving the vibration. In other words, the individual is able to distinguish the coming sound after 20 ms.
Vibration severities of 3 different levels were applied on the finger:
0.5 V–1 V at 1st level for perception of silent sounds
1 V–2 V at 2nd level for perception of medium sounds
2 V–3 V at 3rd level for the perception of loud sounds
Here, 0.5, 1, 2 and 3 V indicate the intensity of the vibration. This means that if our system detects a loud person, it gives a stronger vibration to the perception of the user. For 50 people with normal hearing, the sound of sea or wind was provided via headphones. The reason for the choice of such sounds is that they are used in deafness tests and were recommended by the attending physician. Those sounds were set to a level (16–60 dB) that would not disturb users; through this, it does not have a distract users.
After the vibration, it was applied in two different stages:
Thus, we will be able to perceive whether an individual is speaking loudly or quietly by adjusting the vibration severity. For instance, if there is an individual nearby speaking loudly, the user will be able to perceive it and respond quicker. Through this levelling, a distinction can be made in whether a speaker is yelling. The main purpose of this is to reduce the response time for hearing impaired individuals. It is possible that someone shouting nearby is referring to a problem and the listener should pay more attention.
In the performed study, 50 individuals without hearing impairment, four deaf people and two people with moderate hearing loss were subjected to a wearable system and tested, and significant success was obtained. Normal users could only hear the sea or wind music; the wearable technology we developed was placed on the user’s back and tested. The user was aware of where sound was coming from despite the high level of noise in their ear and they were able to head in the appropriate direction. The ears of 50 individuals without hearing impairment were closed to prevent their hearing ability, and the system was started in such a manner that they were unable to perceive where sounds originated. These individuals were tested for five days at different locations and their classification successes were calculated.
Four deaf people and two people with moderate hearing lose were tested for five days in different locations and their results were compared with those of normal subjects based on eight directions during individuals’ tests. Sound originated from the left, right, front, rear, and the intersection points between these directions, and the success rate was tested. Four and eight direction results were interpreted in this study and experiments were progressed in both indoor and outdoor environments.
People were used as sound sources in real-time experiments. While walking outside, someone would come from behind and call out, and whether the person using the device could detect them was evaluated. A loudspeaker was used as the sound source in the computer environment.
In this study, there were microphones on the right, left, behind, and front of the user and vibration motors were attached to the left and right fingertips. For example, if a sound came from the left, the vibration motor on the left fingertip would start working. Both the right and left vibration motors would operate for the front and behind directions. For the front direction the right–left vibration motors would briefly vibrate three times. For behind, right, and left directions, the vibration motors vibrate would three times for extended periods. The person who uses the product would determine the direction in approximately 70 ms on average. Through this study, loud or soft low sounding people were recognizable and people with hearing problems could pay attention according to this classification. For example, if someone making a loud sound was nearby, people with hearing problems were able to understand this and react faster according to this understanding.
3.1. Definitions and Preliminaries
There are four microphone inputs, two vibration engine outputs and four LED outputs in the developed system. With the help of vibration engines that we placed on the right and left fingertips, the direction of the voice was shown by certain vibration intervals. When the voice is perceived, if the vibration perceives its direction, the LED that belongs to that output is on. In this study, the system is tested both in real time and after the data are transferred to the computer.
3.1.1. Description of Data Set
There is a problem including four classes:
Class: Data received from left mic
Class: Data received from right mic
Class: Data received from front mic
Class: Data received from rear mic
Four microphones were used in this study. Using 4 microphones represents 4 basic directions. The data from each direction is added to the 4 direction tables. A new incoming voice data is estimated by using 4 data tables. In real time, our system predicts a new incoming data and immediately informs the user with the vibration.
3.1.2. Training Data
Training data of the four classes were received and transmitted to matrices. Attributes are derived from training data of each class, and they were estimated for the data allocated to the test.
3.2. Preprocessing
Various preprocessing methods are used in the preprocessing phase. These are: filtration, normalization, noise reduction methods and analysis of basic components. In this study, normalization from among preprocessing methods was used.
Statistical normalization or Z-Score normalization was used in the preprocessing phase. Some values on the same data set having values smaller than 0 and some having higher values indicate that these distances among data and especially the data at the beginning or end points of data will be more effective on the results. By the normalization of data, it is ensured that each parameter in the training entrance set contributes equally to the model’s estimation operation. The arithmetic average and standard deviation of columns corresponding to each variable are found. Then the data is normalized by the formula specified in the following equation, and the distances among data are removed and the end points in data are reduced [
21].
It states; = input value; = average of input data set; = standard deviation of input data set.
3.3. Method of Feature Extraction
Feature extraction is the most significant method for some problems such as speech recognition. There are various methods of feature extraction. These can be listed as independent components analysis, wavelet transform, Fourier analysis, common spatial pattern, skewness, kurtosis, total, average, variance, standard deviation, polynomial matching [
22].
Learning a wider-total attribute indicates utility below: [
4,
23,
24]
Classification performance stems from the rustication of voice or untrustworthy attributes.
Basic classifiers that reveal a better generalization skill with less input values in terms of new samplings.
Understanding the classification problem through application by discovering the relevant and irrelevant attributes.
The main goal of the attributes is collecting as much data as possible without changing the acoustic specialty of speakers sound.
3.3.1. Skewness
Skewness is an asymmetrical measure of distribution. It is also the deterioration degree of symmetry in normal distribution. If the distribution has a long tail towards right, it is called positive skew or skew to right, and if the distribution has a long tail towards left, it is called negative skew or skew to left.
3.3.2. Kurtosis
Kurtosis is the measure of how an adverse inclined distribution is. The distribution of kurtosis can be stated as follows:
3.3.3. Zero Crossing Rate (ZCR)
Zero Crossing is a term that is used widely in electronic, mathematics and image processing. ZCR gives the ratio of the signal changes from positive to negative or the other way round. ZCR calculates this by counting the sound waves that cut the zero axis [
25].
3.3.4. Local Maximum (Lmax) and Local Minimum (Lmin)
Lmax and Lmin points are called as local extremum points. The biggest local maximum point is called absolute maximum point and the smallest of the Lmin point is called absolute minimum point. Lmax starts with a signal changing transformation in time impact area in two dimensional map. Lmax perception correction is made by the comparison of the results of different lower signals. If the Lmax average number is higher, the point of those samplings in much important [
26].
3.3.5. Root Mean Square (RMS)
RMS is the square root of the average sum of the signal.
RMS is a value of 3D photogrammetry and in time the changes in the volume and the shape are considered. The mathematical method for calculating the
RMS is as follows: [
27]
X is the vertical distance between two points and N is the sum of the reference points on the two compared surfaces. RMS, is a statistical value which is used for calculating the increasing number of the changes. It is especially useful for the waves that changes positively and negatively.
3.3.6. Variance
Variance is measure of the distribution. It shows the distribution of the data set according to the average. It shows the changing between that moment’s value and the average value according to the deviation.
3.4. Classification
3.4.1. K Nearest Neighborhood (Knn)
In Knn, the similarities of the data to be classified with the normal behavior data in the learning cluster are calculated and the assignments are done according to the closest k data average and the threshold value determined. An important point is the pre-determination of the characteristics of each class.
Knn’s goal is to classify new data by using their characteristics and with the help of previously classified samples. Knn depends on a simple discriminating assumption known as intensity assumption. This classification has been successfully adopted in other non-parametric applications until speech definition [
28].
In the Knn algorithm, first the k value should be determined. After determination of the k value, the calculation of its distance with all the learning samples should be performed and then ordering is performed as per minimum distance. After the ordering operation, which class value it belongs to is found. In this algorithm, when a sample is received from outside the training cluster, we try to find out to which class it belongs. Leave-one-out cross validation (LOOCV) was used in order to select the most suitable k value. We tried to find the k value by using the LOOCV.
LOOCV consists of dividing the data cluster to n pieces randomly. In each n repetition, n − 1 will be used as the training set and the excluded sampling will be used as the test set. In each of the n repetitions, a full data cluster is used for training except a sampling and as test cluster.
LOOCV is normally limited to applications where existing education data is restricted. For instance; any little deviation from tiny education data causes a large scale change in the appropriate model. In such a case, this reduces the deviation of the data in each trial to the lowest level, so adopting a LOOCV strategy makes sense. LOOCV is rarely used for large scale applications, because it is numerically expensive [
29].
1000 units of training data were used. 250 data for each of the four classes were derived from among 1000 units of training data. One of 1000 units of training data forms the 1000-1 sub training cluster for validation cluster. Here, the part being specified as the sub training cluster was derived from the training cluster. Training cluster is divided into two being the sub training cluster and the validation cluster. In the validation cluster, the data to be considered for the test are available.
The change of k arising from randomness is not at issue. The values of k are selected as 1, 3, 5, 7, 9, 11 and they are compared with the responses in the training cluster. After these operations, the best k value becomes determined. k = 5 value, having the best rate, is selected. Here, the determination of k value states how many nearest values should be considered.
3.4.2. Support Vector Machine (SVM)
SVM was developed by Cortes and Vapnik for the solution of pattern recognition and classification problems [
30]. The most important advantage of SVM is that it solves the classification problems by transforming them to quadratic optimization problems. Thus, the number of transactions related to solving the problem in the learning phase decreases and other techniques or algorithm based solutions can be reached more quickly. Due to this technical feature, there is a great advantage on large scale data sets. Additionally, it is based on optimization, classification performance, computational complexity and usability is much more successful [
31,
32].
SVM is a machine learning algorithm that works by the principle of non-structural risk minimization that is based on convex optimization. This algorithm is an independent learning algorithm that does not need any knowledge of the combined distribution function as data [
33].
The aim of SVM is to achieve an optimal separation hyper-plane apart that will separate the classes. In other words, maximizing the distance between the support vectors that belong to different classes. SVM is a machine learning algorithm that was developed to solve multi-class classification problems.
Data sets that can or can’t be distinguished as linear can be classified by SVM. The n dimensioned nonlinear data set can be transformed to a new data set as m dimensioned by m > n. In high dimensions linear classifications can be made. With an appropriate conversion, data can always be separated into two classes with a hyper plane.
3.5. Feature Selection
ReliefF is the developed version of the Relief statistical model. ReliefF is a widely-used feature selection algorithm [
34] that carries out the process of feature selection by handling a sample from a dataset and creating a model based on its nearness to other samples in its own class and distance from other classes [
35]. This study applies the ReliefF feature selection method to evaluate every feature in comparison to other features and determine which features are more effective in the classification phase.
3.6. Localization Algorithm Based on the Microphone Array
Position estimation methods in the literature are generally time of arrival (TOA), arrival time difference (TDOA) and received signal strength (RSS) based methods [
36]. TDOA-based methods are highly advantageous because they can make highly accurate predictions. TDOA-based methods that use the maximum likelihood approach require a starting value and attempt to achieve the optimal result in an iterative manner [
37]. If the initial values are not properly selected, there is a risk of not reaching the optimum result. In order to remove this disadvantage, closed form solutions have been developed.
Closed-loop algorithms utilize the least squares technique widely used for TDOA-based position estimation [
38]. In TDOA-based position estimation methods, time delay estimates of the signal between sensor pairs are used. Major difficulties in TDOA estimation are the need for high data sharing and synchronization between sensors. This affects the speed and cost of the system negatively. The traditional TDOA estimation method in the literature uses the cross-correlation technique [
39].
3.7. Echo Elimination
The reflection and return of sound wave after striking an obstacle is called echo. The echo causes the decrease of quality and clarity of the audio signal. Finite Impulse Response (FIR) filters are also referred as non-recursive filters. These filters are linear phase filters and are designed easily. In FIR filters, the same input is multiplied by more than one constant. This process is commonly known as Multiple Constant Multiplications. These operations are often used in digital signal processing applications and hardware based architects are the best choice for maximum performance and minimum power consumption.
4. Experimental Results
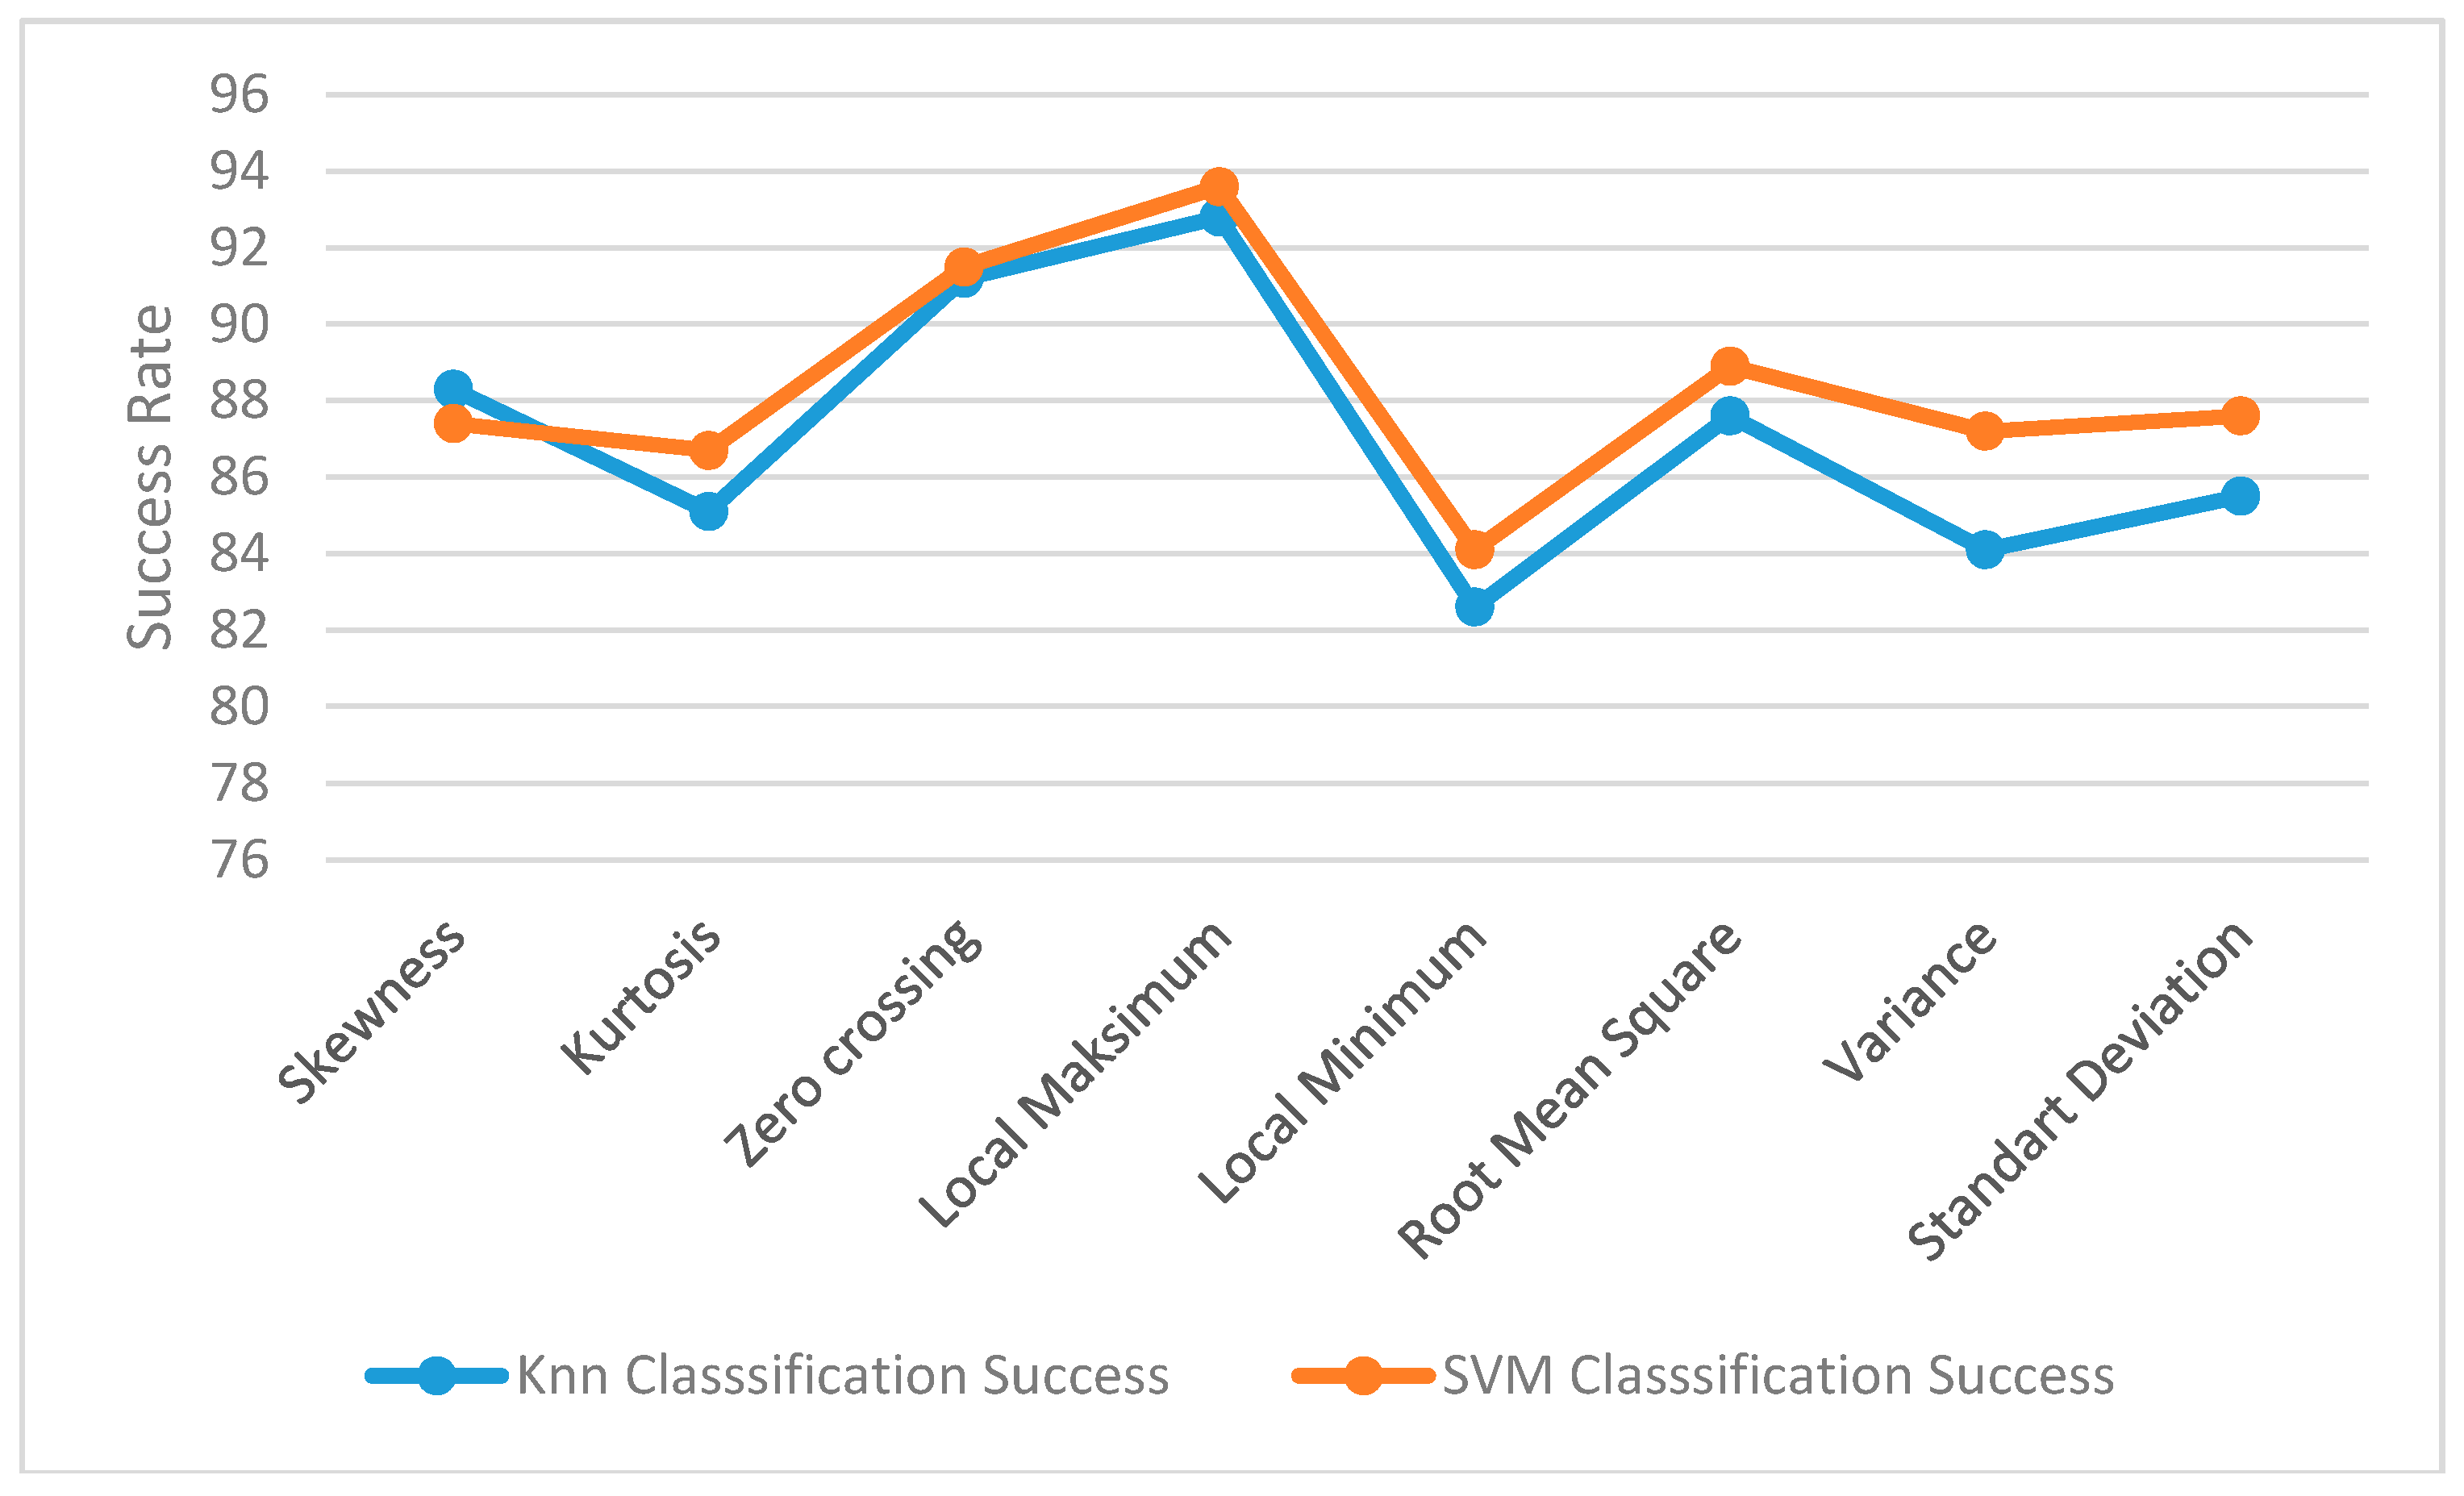
This study primarily selects the best feature methods and classification methods. Then, the prototype device has been tested using these selected methods on themselves. Meanwhile, tests have also been done on a computer environment and shown comparatively. The ReliefF method aims to find features’ values and whether dependencies exist by trying to reveal them. This study selects the two best features using the ReliefF method. The two best feature methods turned out to be the Lmax and ZCR.
The results of the feature extraction method described above are shown in
Figure 4 according to the data we took from the data set. As can be seen, the best categorizing method is the Lmax with ZCR using SVM. The results in
Figure 4 show the mean values between 1 and 4 m.
As seen in
Table 1, the results obtained in real time and data were transferred to the digital environment and compared with the results obtained after the stages of preprocessing, feature extraction and classification. The results in
Table 1 show the mean values between 1 and 4 m.
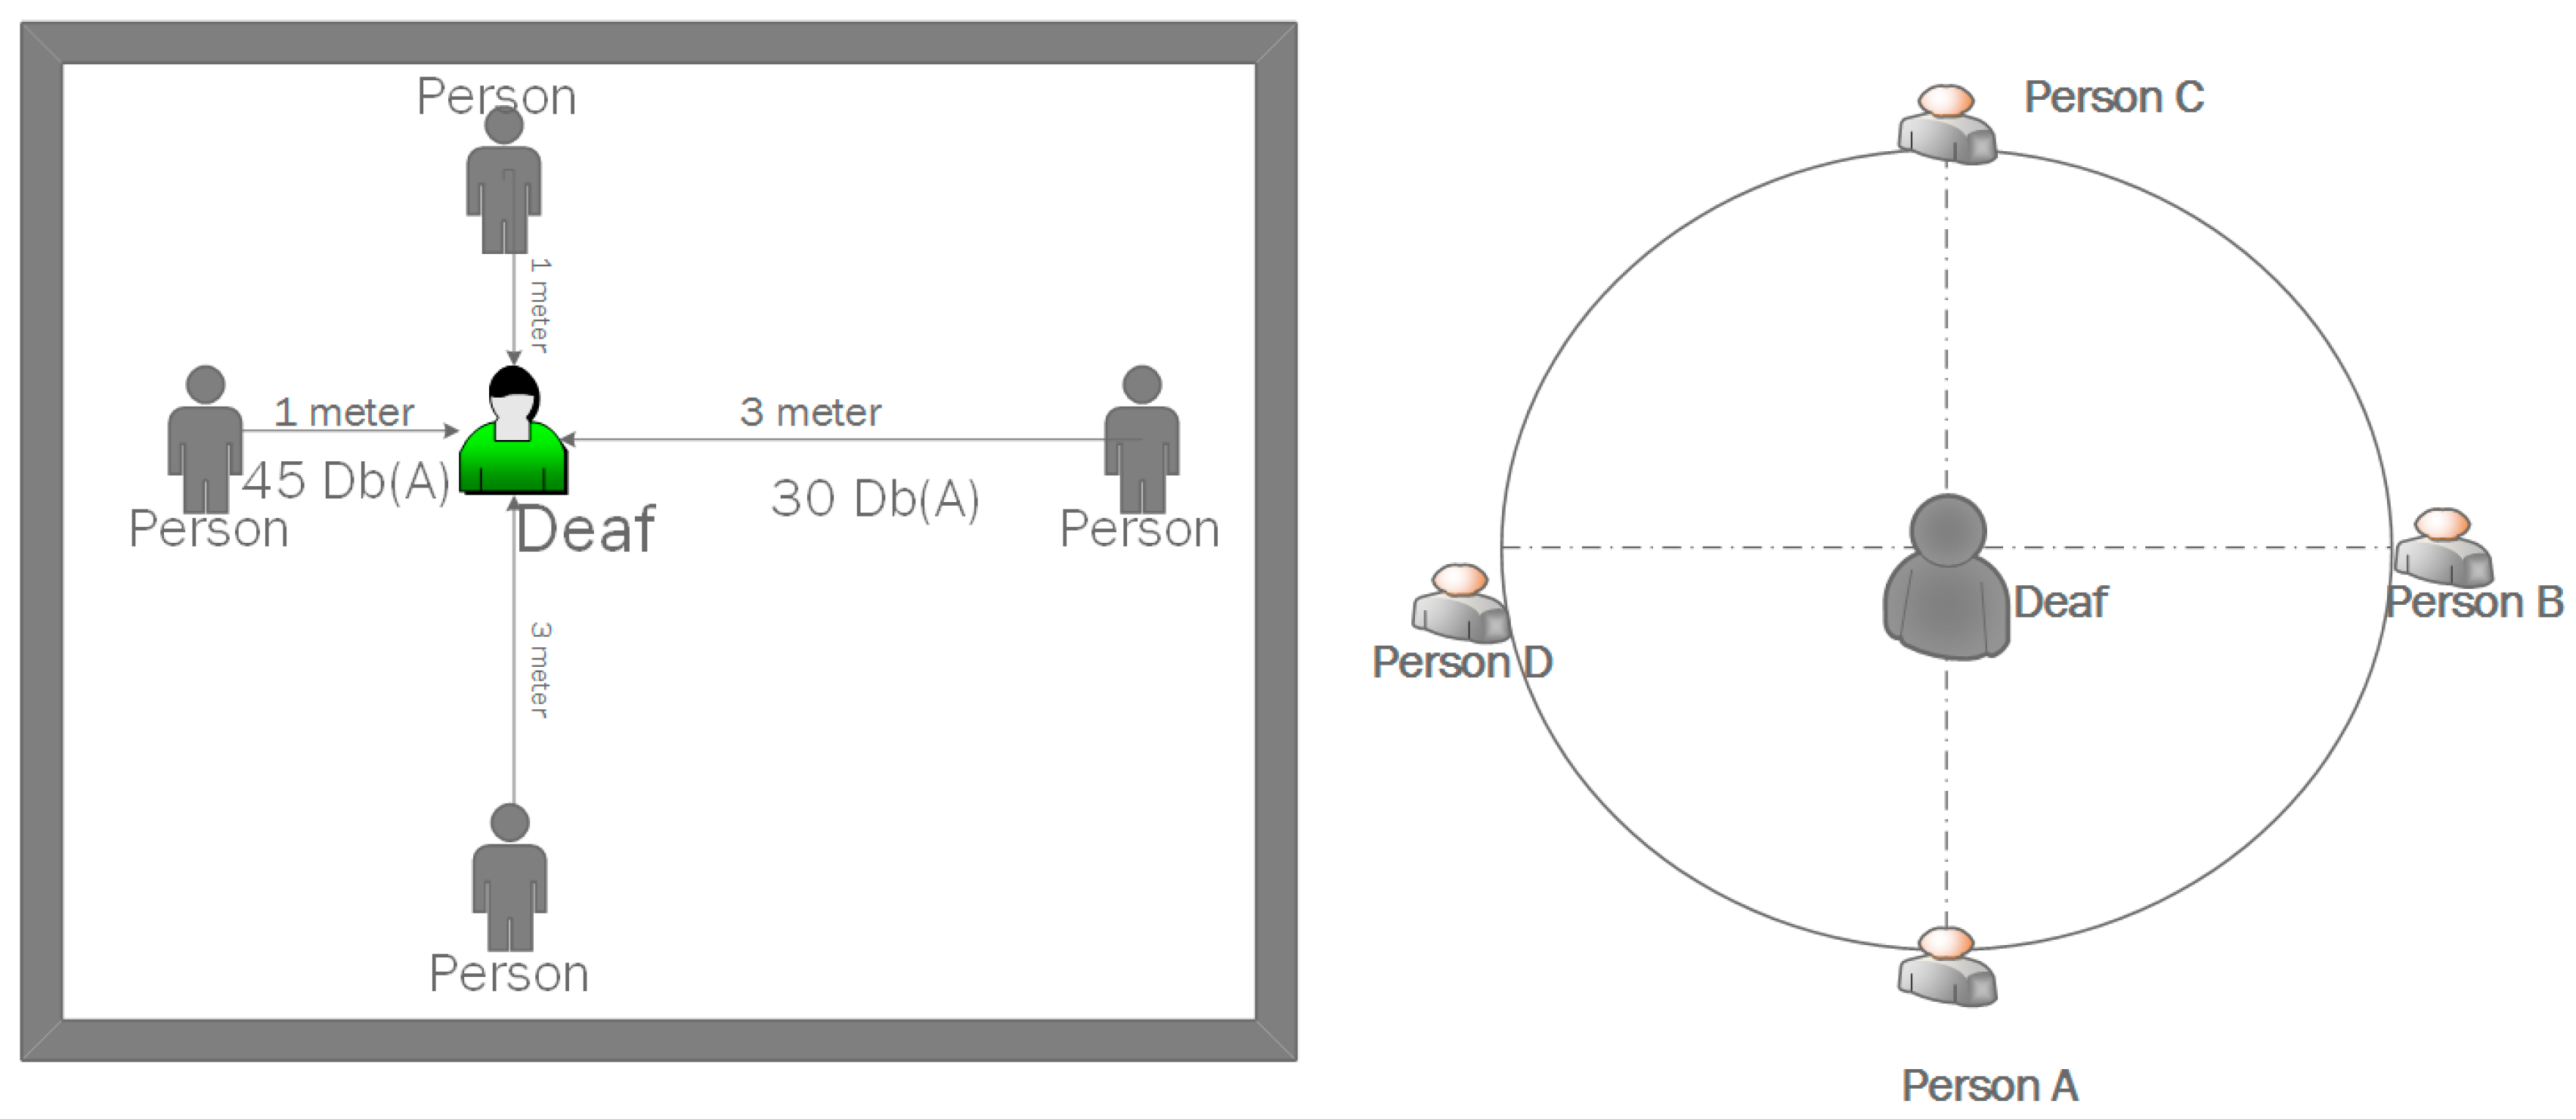
Our wearable device produces results when there are more than 1 person. As can be seen in the
Figure 5, people from 1-m and 3-m distances called the hearing-impaired individual. Our wearable device has noticed the individual who is close to him and he has directed that direction. As shown in
Figure 5, the person with hearing impairment perceives this when the Person C behind the hearing impaired person calls to himself. 98% success was achieved in the results made in the room environment. It gives visual warning according to the proximity and distance.
As shown in
Table 2, measurements were taken in the room environment, corridor and outside environment. As shown in
Table 2, our wearable device was tested in room, the hallway and the exterior with a distance of 1 and 4 m. The success rate is shown by taking the average of the measured values with the sound meter. Each experiment was tested and the results were compared. In
Table 2, the average level increase is caused by the increase of noise level in noisy environment and outdoor environment, but the success did not decrease much.
As seen in
Table 3, perception of the direction of sound at a distance of ne meter was obtained as 97%. The best success rate was obtained by the sounds received from left and right directions. The success rate decreased with the increase of distance. As the direction increased, two directions were considered in the perception of sound, and the success rate decreased. And the direction where the success rate was the lowest was the front. The main reason for that is the placement of the developed human-computer interface system on the back of the individual. The sound coming from the front is being mixed up with the sounds coming from left or right.
As seen in
Table 4, when perception of where the sound is coming from is considered, high success was obtained. As can be seen in
Table 4, voice perception without checking the direction had great success. Voice was provided at low, normal and high levels and whether our system has perceived correctly or not was tested. Recognition success of the sound without looking at the direction of the source was 100%. It means our system recognized the sounds successfully.
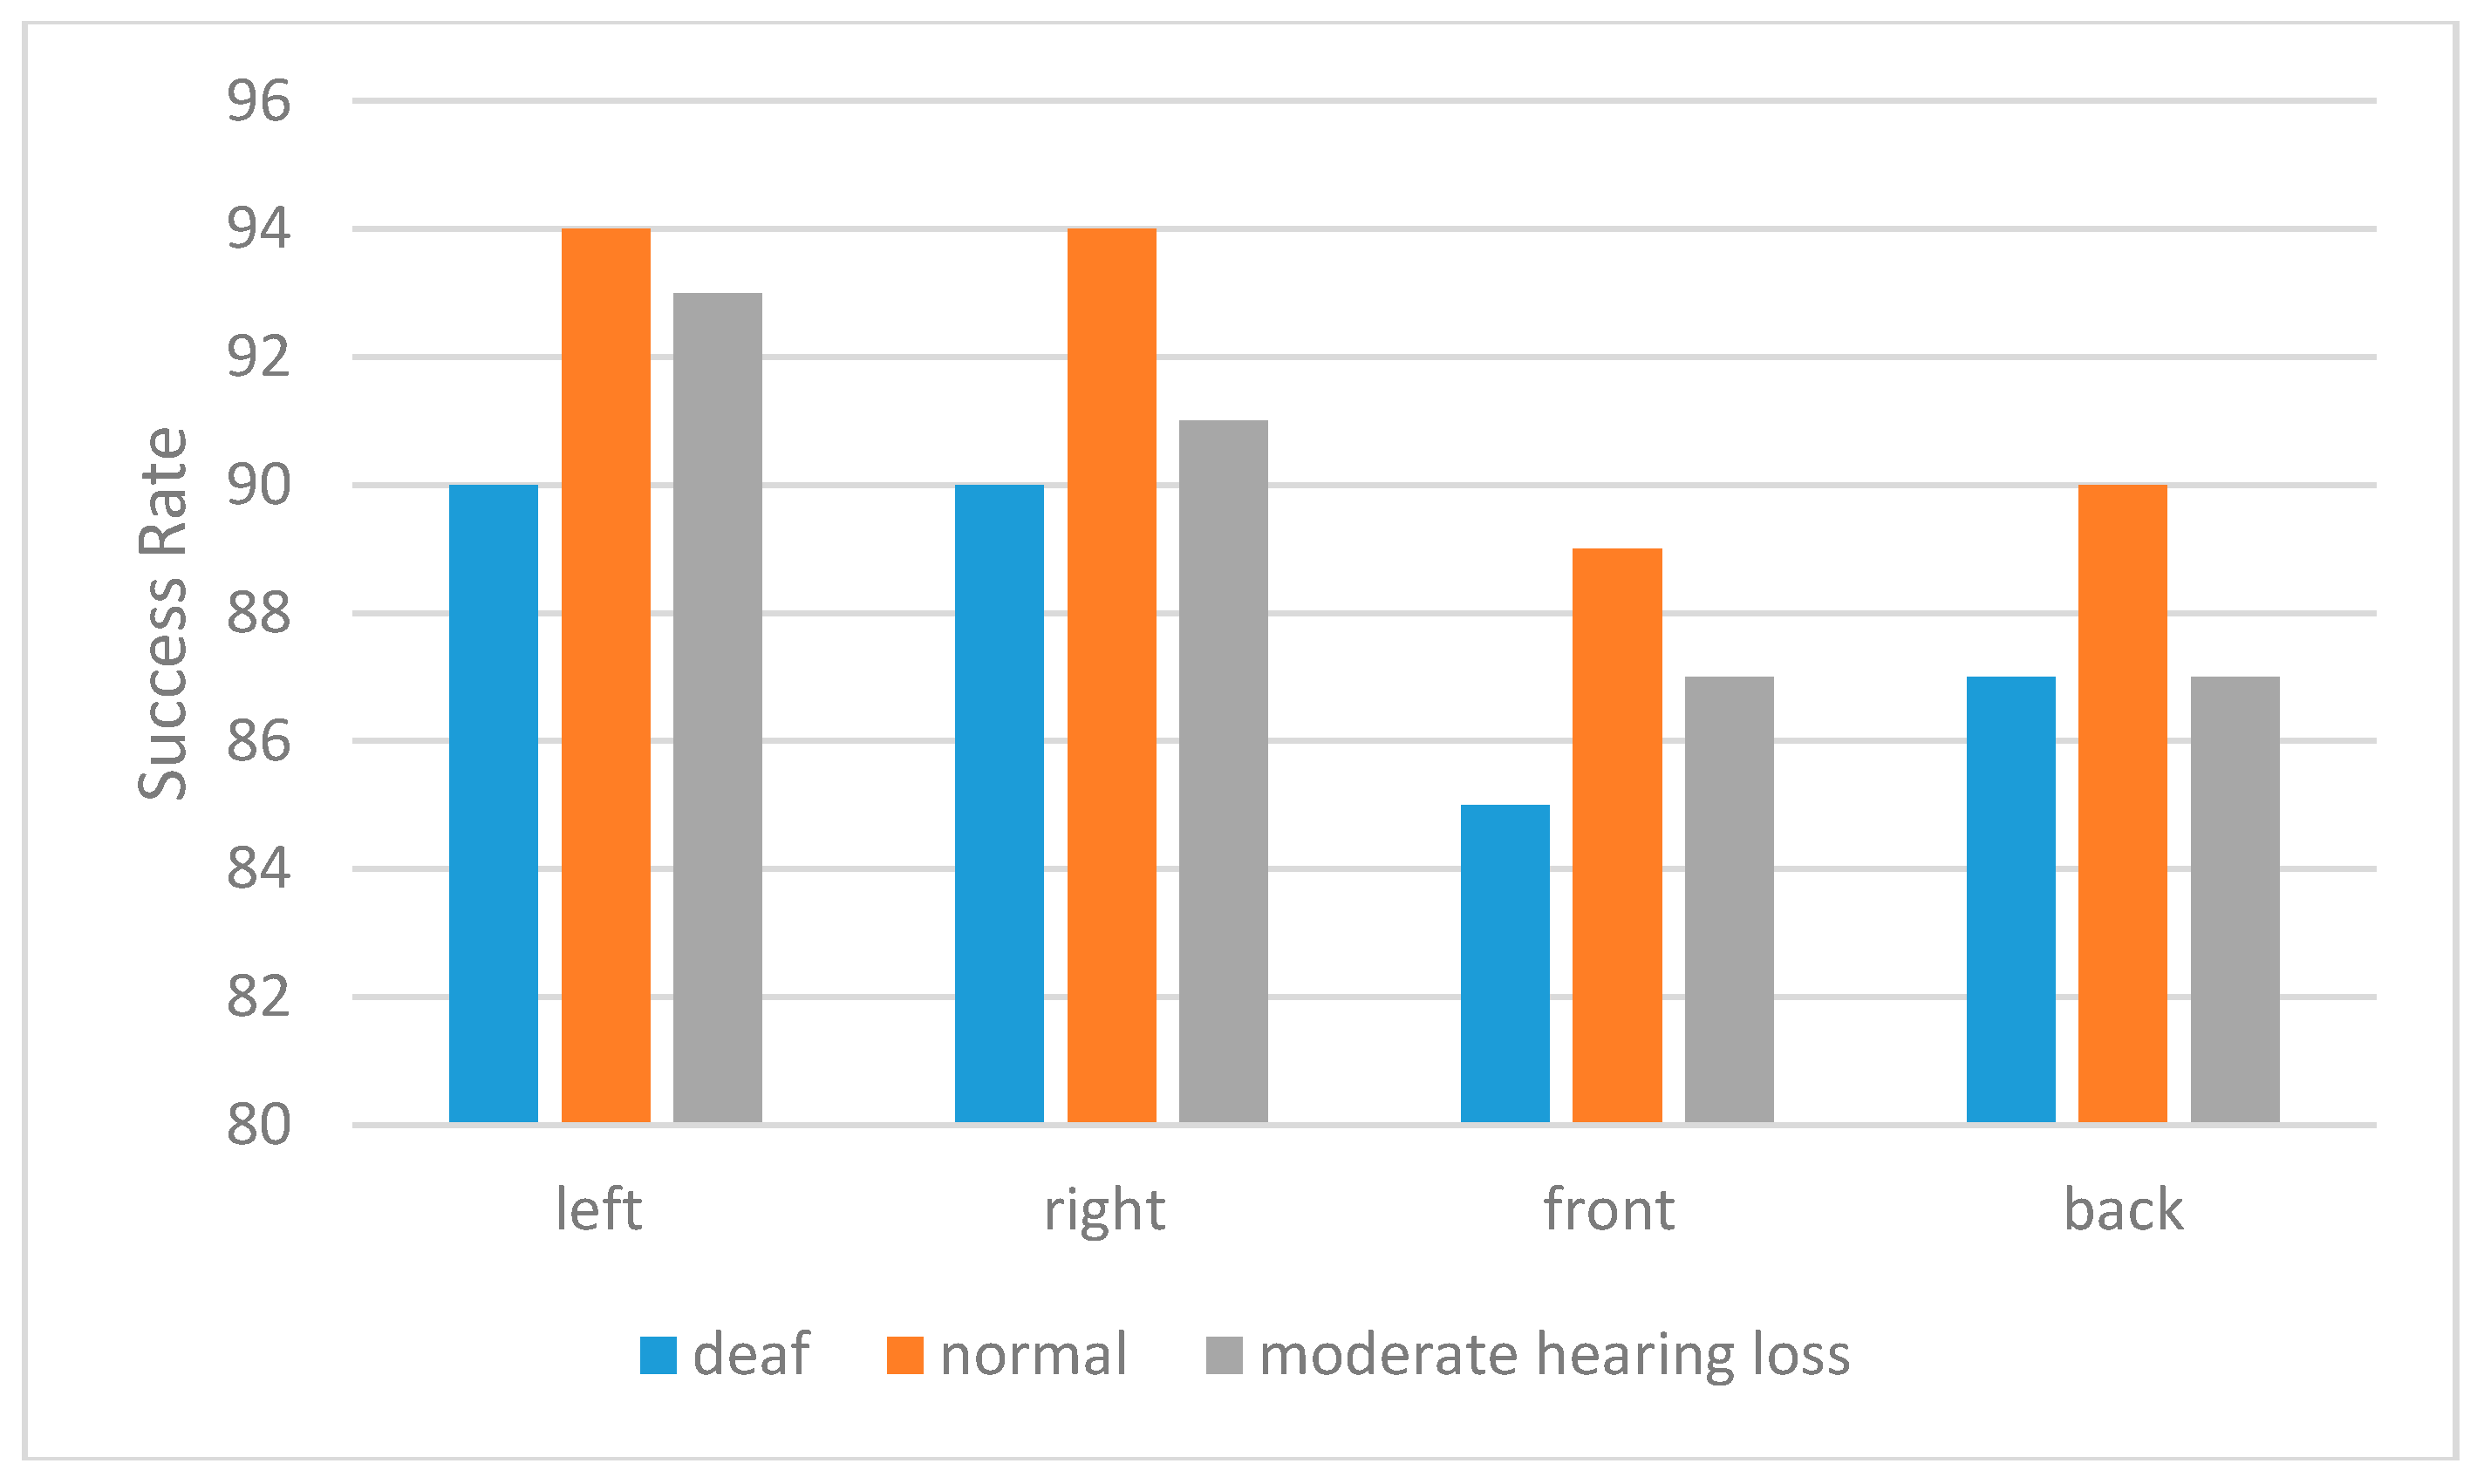
When individuals without hearing impairment and hearing impaired individuals were compared,
Figure 6 compares deaf individuals with normal individuals and moderate hearing lose individuals. As a result of the application in real-time detection of deaf individuals’ direction detection has a success rate of 88%. In
Figure 6, the recognition of the sound source’s direction for normal people, deaf and moderate hearing lose people is shown. As the number of people with hearing problems is low and the ability to teach them is limited, the normal people’s number is higher. However, with proper training the number of people with hearing problems can be increased.
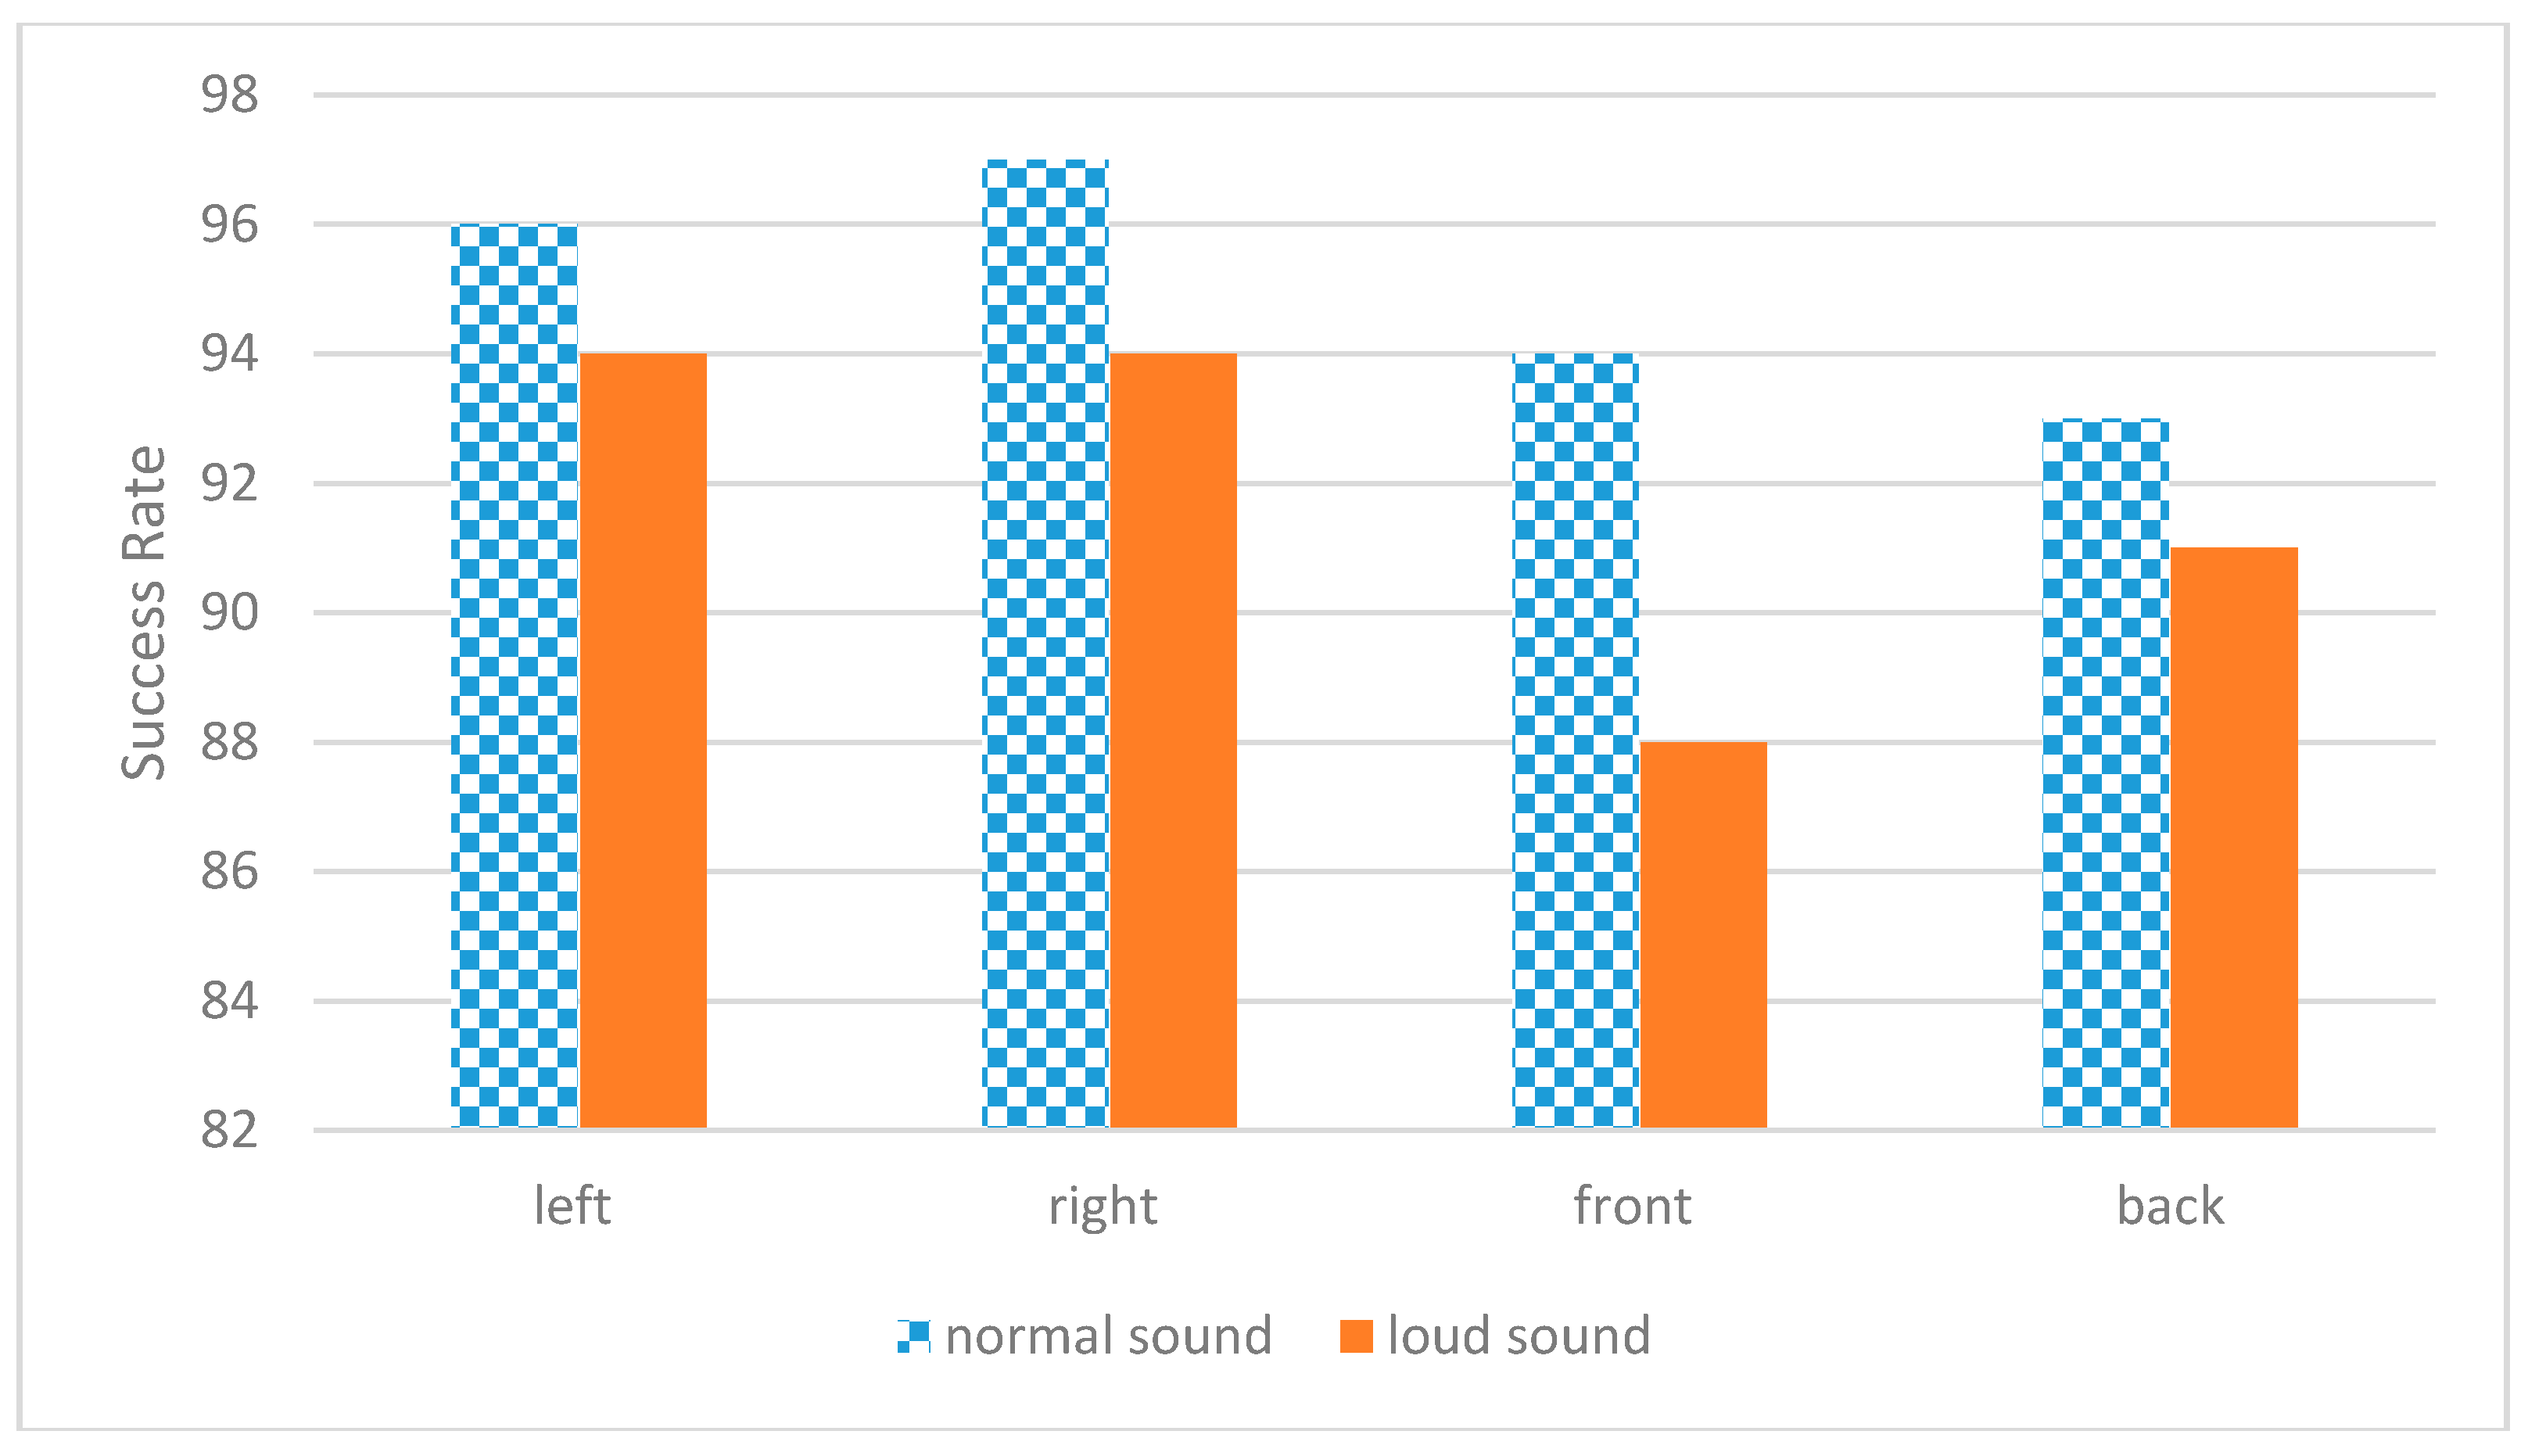
As shown in
Figure 7 in our system the individual speakers talk in real time and it can be determined if it is a shouting voice or a normal voice. Also, the direction of the shouting person or normal talking person can be determined and the classification succeeded. With this application, the normal voice detection is calculated as 95% and shouting voice detection is 91.8%. The results in
Figure 7 show the mean values between 1 and 4 m.
It has been conducted by looking at eight directions; therefore a good distinction cannot be made when it is spoken in the middle of two directions. When only four directions are looked, a better success rate is seen. As it can be seen in
Table 5, the results based on 4 and 8 directions are compared. The reason of lower rate of success in eight directions is that the direction of the voice could not be determined in intercardinal points. The results in
Table 5 show the mean values between 1 and 4 m.
As shown in
Table 6, the device we developed is faster than the TDOA algorithm. At the same time, it costs less because it uses less microphones. The device we have developed has been tested in real-time as well as the TDOA algorithm has been tested as a simulation.
The wearable device we developed also provides power management. If there is an echo in the environment, the echo is removed and the success rate is increased by 1.3%. In environments without echo, the echo canceller is disabled.
5. Discussion
We want the people with hearing problems to have a proper life at home or in the workplace by understanding the nature of sounds and their source. In this study, a vibration based system was suggested for hearing impaired individuals to perceive the direction of sound.
This study was tested real time. With the help of program we have written, our wearable system on the individual had 94% Success. In close range, SVM and two of the best feature methods are used and 98% successes are accomplished. By decreasing the noise in the area, the success can be increased. One of the most important problems in deaf is that they could not understand where the voice is coming from. This study helped the hearing impaired people to understand where the voice is coming from real time. It will be very useful for the deaf to be able to locate the direction of the stimulating sounds. Sometimes it can be very dangerous for them not to hear the horn of a car which is coming from their backs. No factors affect the test environment. In real-time tests, deaf individuals can determine direction thanks to our wearable devices. In outdoor tests, a decline in the classification success has been observed due to noise.
The vibration-based wearable device we have developed solves the problem of determining the direction from which a voice is coming, which is an important problem for deaf people. A deaf person should be able to sense noise and know its direction in a spontaneous instance. The direction of the voice has been determined in this study and thus it has been ensured that he can senses the direction from which the voice is coming. In particular, voices coming from behind or that a deaf individual cannot see will bother them; however, the device we have developed means that deaf individuals can sense a voice coming from behind them and travel more safely. This study has determined by whether a person is speaking loudly next to a deaf individual. Somebody might increase their tone of voice while speaking to the deaf individual in a panic and therefore this circumstance has been targeted so that the deaf person can notice such panic sooner. The deaf individual will be able to sense whether someone is shouting and if there is an important situation, his perception delay will be reduced thanks to the system we have developed. For instance, the deaf individual will be able to distinguish between a bell, the sound of a dog coming closer, or somebody calling to them; therefore, this can help them live more comfortably and safely with less public stress. In the feedback from deaf individuals using our device, they highlighted that they found the device very beneficial. The fact that they can particularly sense if there is an important voice coming from someone they cannot see makes it feel more reliable. Meanwhile, the fact that they can sense the voices of their parents calling them in real time while they are sleeping at home in particular has ensured that they feel more comfortable.
This study presents a new idea based on vibrating floor to the people with hearing problems who prefer to work with wearable computer related fields. We believe that the information which are present here will be useful for people with hearing problems who are working for system development on wearable processing and human-computer interaction fields. First, the best feature and classification method has been selected in the experimental studies. Using ReliefF from the feature selection algorithms allowed selecting the two best feature methods. Then, both real-time and computer tests were performed. Our tests have been done at a distance of 1–4 m in a (30–40 dB (A)) noisy environment. In the room, corridor, and outside environments, tests were done at a distance of 1–4 m. Whether one speaks with normal voice or screams has also been tested in our studies. The wearable device we have developed as a prototype has provided deaf people with more comfortable lives.
In the study performed, the derivation of training and test data, validation phase and selection of the best attribute derivation method takes time. Especially while determining the attribute, it is required to find the most distinguishing method by using the other methods. While performing operation with multiple data, which data is more significant for us is an important problem in implementations. The attribute method being used may differ among implementations. In such studies, the important point is to derive attributes more than one and to perform their joint use. In this manner, a better classification success can be obtained.
In the study, sound perception will be performed through vibration. A system will be developed for the hearing impaired individuals to perceive both the direction of speaker and what he is speaking of. In this system, first the perception of specific vowels and consonants will be made, and their distinguishing properties will be determined, and perception by the hearing impaired individual through vibration will be ensured.
6. Conclusions
Consequently, the direction of sound is perceived to a large extent. Moreover, it was also determined whether the speaker is shouting or not. In future studies, deep learning, correlation and hidden Markov model will be used and the success of system will tried to be increased. Also, other methods in the classification stage will be used to get the best result. For further studies, the optimum distances for the microphones will be calculated and the voice recognition will be made with the best categorizing agent. Which sounds are most important for deaf people will be determined using our wearable device in future studies; it is important for standard of living which sound is determined, particularly with direction determination. Meanwhile, real-time visualization requires consideration; a wearable device that transmits the direction from which sounds originate will be made into glasses that a deaf individual can wear.


