Enhanced Photocatalytic Activity of Iron-Doped ZnO Nanowires for Water Purification


ESYCOM, Université Paris-Est, UPEM, 5 Boulevard Descartes, F- 77420 Champs sur Marne, France
*
Author to whom correspondence should be addressed.
Appl. Sci. 2017, 7(11), 1185; https://doi.org/10.3390/app7111185
Submission received: 2 October 2017
/
Revised: 14 November 2017
/
Accepted: 14 November 2017
/
Published: 17 November 2017
(This article belongs to the Special Issue Nanotechnology in Wastewater Treatment Technology)
Abstract
:Featured Application
Water purification.
Abstract
In order to improve the photocatalytic efficiency of ZnO nanowires, iron-doped ZnO nanowires (ZnO:Fe NWs) were successfully synthesized. The morphology, optical properties and photocatalytic performance of ZnO:Fe NWs were studied by scanning electron microscopy (SEM), UV-Visible spectrophotometry and photoluminescence spectroscopy (PL), respectively. The SEM observations showed that the morphology of the ZnO NWs was not modified by iron doping, but the band gap was reduced from 3.29 eV for ZnO NWs to 3.25 eV for ZnO:Fe NWs. This band gap reduction allows the semiconductor to harvest more photons to excite more electrons in the valence band; subsequently, resulting in an improvement of the degradability of the understudied organic dyes: methylene blue (MB), methyl orange (MO), and acid red 14 (AR14). The photocatalytic study showed that the photo-degradation rate of the MB, MO, and AR14 was improved 9%, 20%, and 5% respectively by 1% iron doping in the ZnO NWs.
1. Introduction
In recent years, extensive fundamental research and development of the applied processes have been devoted to the polluted water treatment. Apart from the classical processes such as adsorption, filtration and sedimentation, the photocatalysis of semiconductor materials has attracted much attention as a promising solution for environmental problems. The photocatalysis process presents the advantage of decomposing and mineralizing a wide range of organic water pollutants into harmless products (CO2, H2O, etc.).
The water pollution caused by various dyes originating from textile, pharmaceutical and food-processing industries is becoming critical due to their use in large quantities. The World Health Organization (WHO) has set water quality at the top of its priority action list. In order to reduce the damage caused by organic dye pollution to the ecosystem and human health, the use of photocatalysts to degrade or to convert them into harmless chemical organic compounds in contaminated water has been extensively studied in recent years.
On the other hand, due to its very interesting physicochemical properties, ZnO has been largely studied for water purification in recent years [1,2]. Indeed, ZnO is a non-toxic and biocompatible semiconductor with high photosensitivity, and is relatively easy to synthesize at a low cost. Having the good physical and chemical stability, ZnO possesses a large band gap of 3.37 eV and a high exciton binding energy of 60 meV. Thus, ZnO presents all environmentally friendly features for photocatalytic applications [3,4]. Generally, in the photocatalytic process, photo-generated holes which have a high oxidation power in the valence band (VB) and photo-generated electrons which have sufficient reduction power in the conduction band (CB) are required for efficient photocatalytic reactions. However, the photocatalytic efficiency of ZnO is limited by the very short lifetime (~0.322 ns) of the photo-generated charge carriers (electron–hole pairs) in semiconductors due to the high probability of their recombination [5]. The other lack in the use of the undoped ZnO as photocatalyst is its wide band gap, thus the semiconductor can be activated only under ultraviolet (UV) light irradiation, which limits its practical applications. In consequence, to promote the photocatalytic performance of the semiconductor, it is not only necessary to increase the lifetime of charge carriers, but also to extend absorption edge up to the visible light region.
To expand the light absorption spectrum and to improve the solar energy utilization efficiency, many strategies have been exploited to modify the oxide semiconductor band gap structure in order to increase its sensitivity to visible light [6,7,8,9]. One of the effective methodologies to increase the photocatalytic activities of ZnO, by increasing the visible-light absorption, is the doping of the ZnO nanostructure with transition-metals [10,11], due to the band gap narrowing resulting from the creation of dopant energy levels below the CB [12,13]. This technique has, on the one hand, the advantage of effectively preventing the recombination of photo-generated electron–hole pairs; and on the other hand, can extend the photocatalysis’ spectral range, leading to the improvement of the semiconductor photocatalytic activities. In spite of many transition metals having been reported in the literature, such as Co, Cr, Ag, Sn etc., in our work, we focused on the iron doping of the ZnO, because iron is a transition metal of very little negative impact on the environment. Nevertheless, the morphology of the photocatalyst plays an important role in the photocatalytic activity. The structure of the nanowire arrays has the advantage of a large specific surface with high surface to volume ratio which has prompted us to focus our research on the iron-doped ZnO nanowires (ZnO:Fe NWs).
The photocatalytic activity of the ZnO:Fe NWs for the organic pollutant degradation was investigated using three organic dyes, commonly used in textile, food-processing, and pharmaceutical industries, in aqueous solution: methylene blue (MB), methyl orange (MO), and azorubine (also called acid red 14—AR14). The ZnO NWs (undoped and Fe-doped), synthesized by low-cost hydrothermal method with a high aspect ratio, offer a large surface to volume ratio. The detailed degradation mechanism has been proposed for each dye in our previous work [14].
The morphology of both the un-doped and Fe-doped ZnO NWs was characterized using a scanning electron microscopy (FEG–SEM, NEON 40 ZEISS, Berkochen, Germany) operating at 10 kV accelerating voltage. The photocatalysis process was followed by an UV-Vis spectrophotometer (Lambda 35, Perkin Elmer, Waltham, MA, USA) by periodically monitoring the absorption spectra of the organic dye solution during the photo-degradation process. Photoluminescence spectroscopy (PL) was used to characterize both undoped and Fe-doped ZnO NWs in order to understand the photocatalytic efficiency enhancement mechanism.
2. Fe-Doped ZnO Nanowire Synthesis
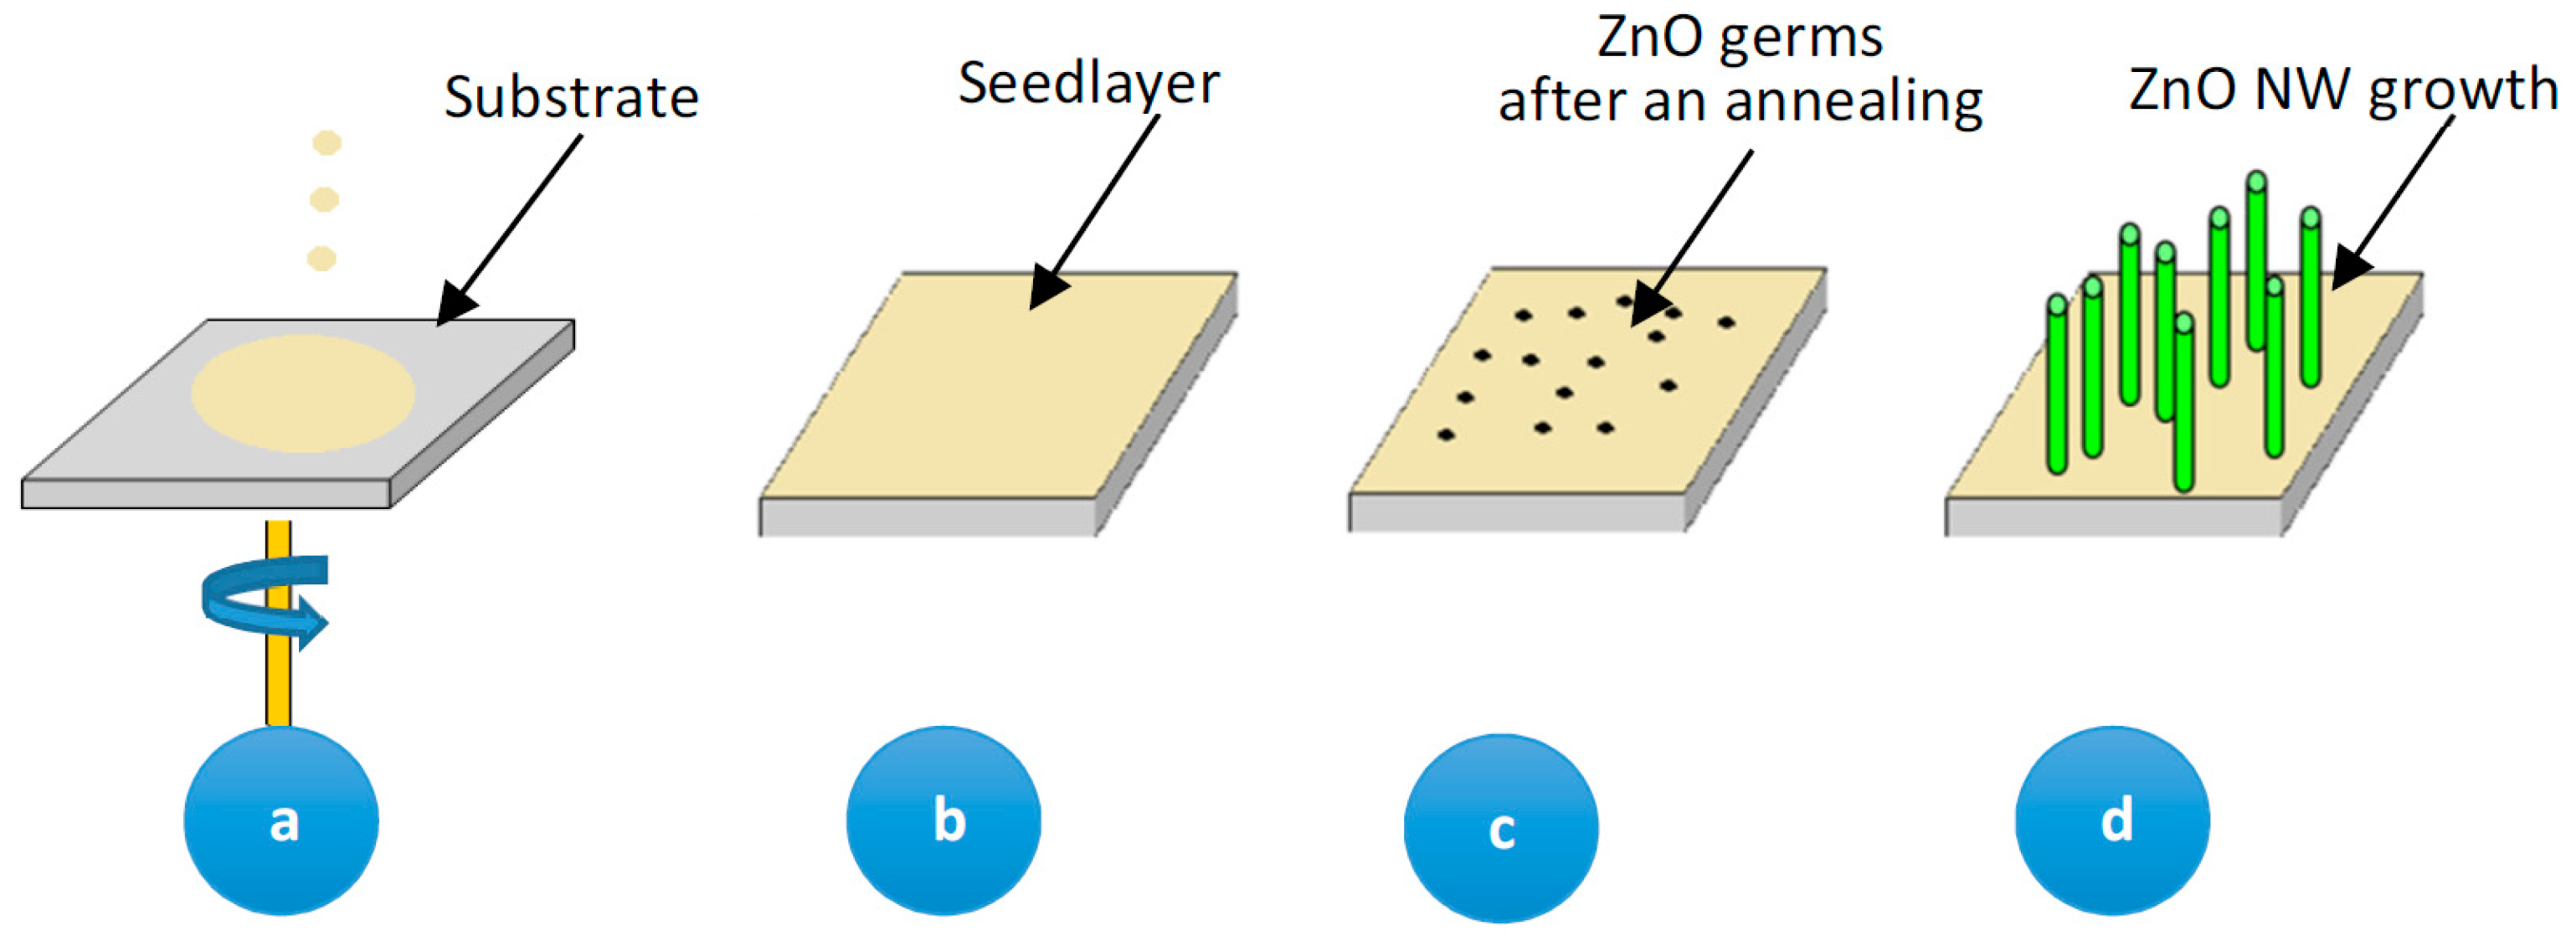
The synthesis of the Fe-doped nanowires was carried out by two-step hydrothermal method: The buffer layer consisting of 2 g of polyvinyl alcohol (PVA) and 0.25 g of zinc acetate dihydrate (Zn(CH3COO)2·2H2O) dissolved in water, was firstly spin-coated on the substrate as described in our previous work [14]; then the growth of ZnO:Fe NWs was carried out in the solution containing 25 mM of zinc nitrate (Zn(NO3)2), 12.5 mM of Hexamethylenetetramine (HMTA), and 0.25 mM of Iron (III) chloride (FeCl3) at 95 °C. The process is similar to un-doped ZnO NWs growth [14], except for the addition of iron (III) to the growth solution.
Figure 1 shows a schema of the Fe-doped ZnO nanowire formation. This synthesis process is valid both for undoped and doped ZnO nanowire growth except the adding of FeCl3 in the growth solution for Fe-doping.
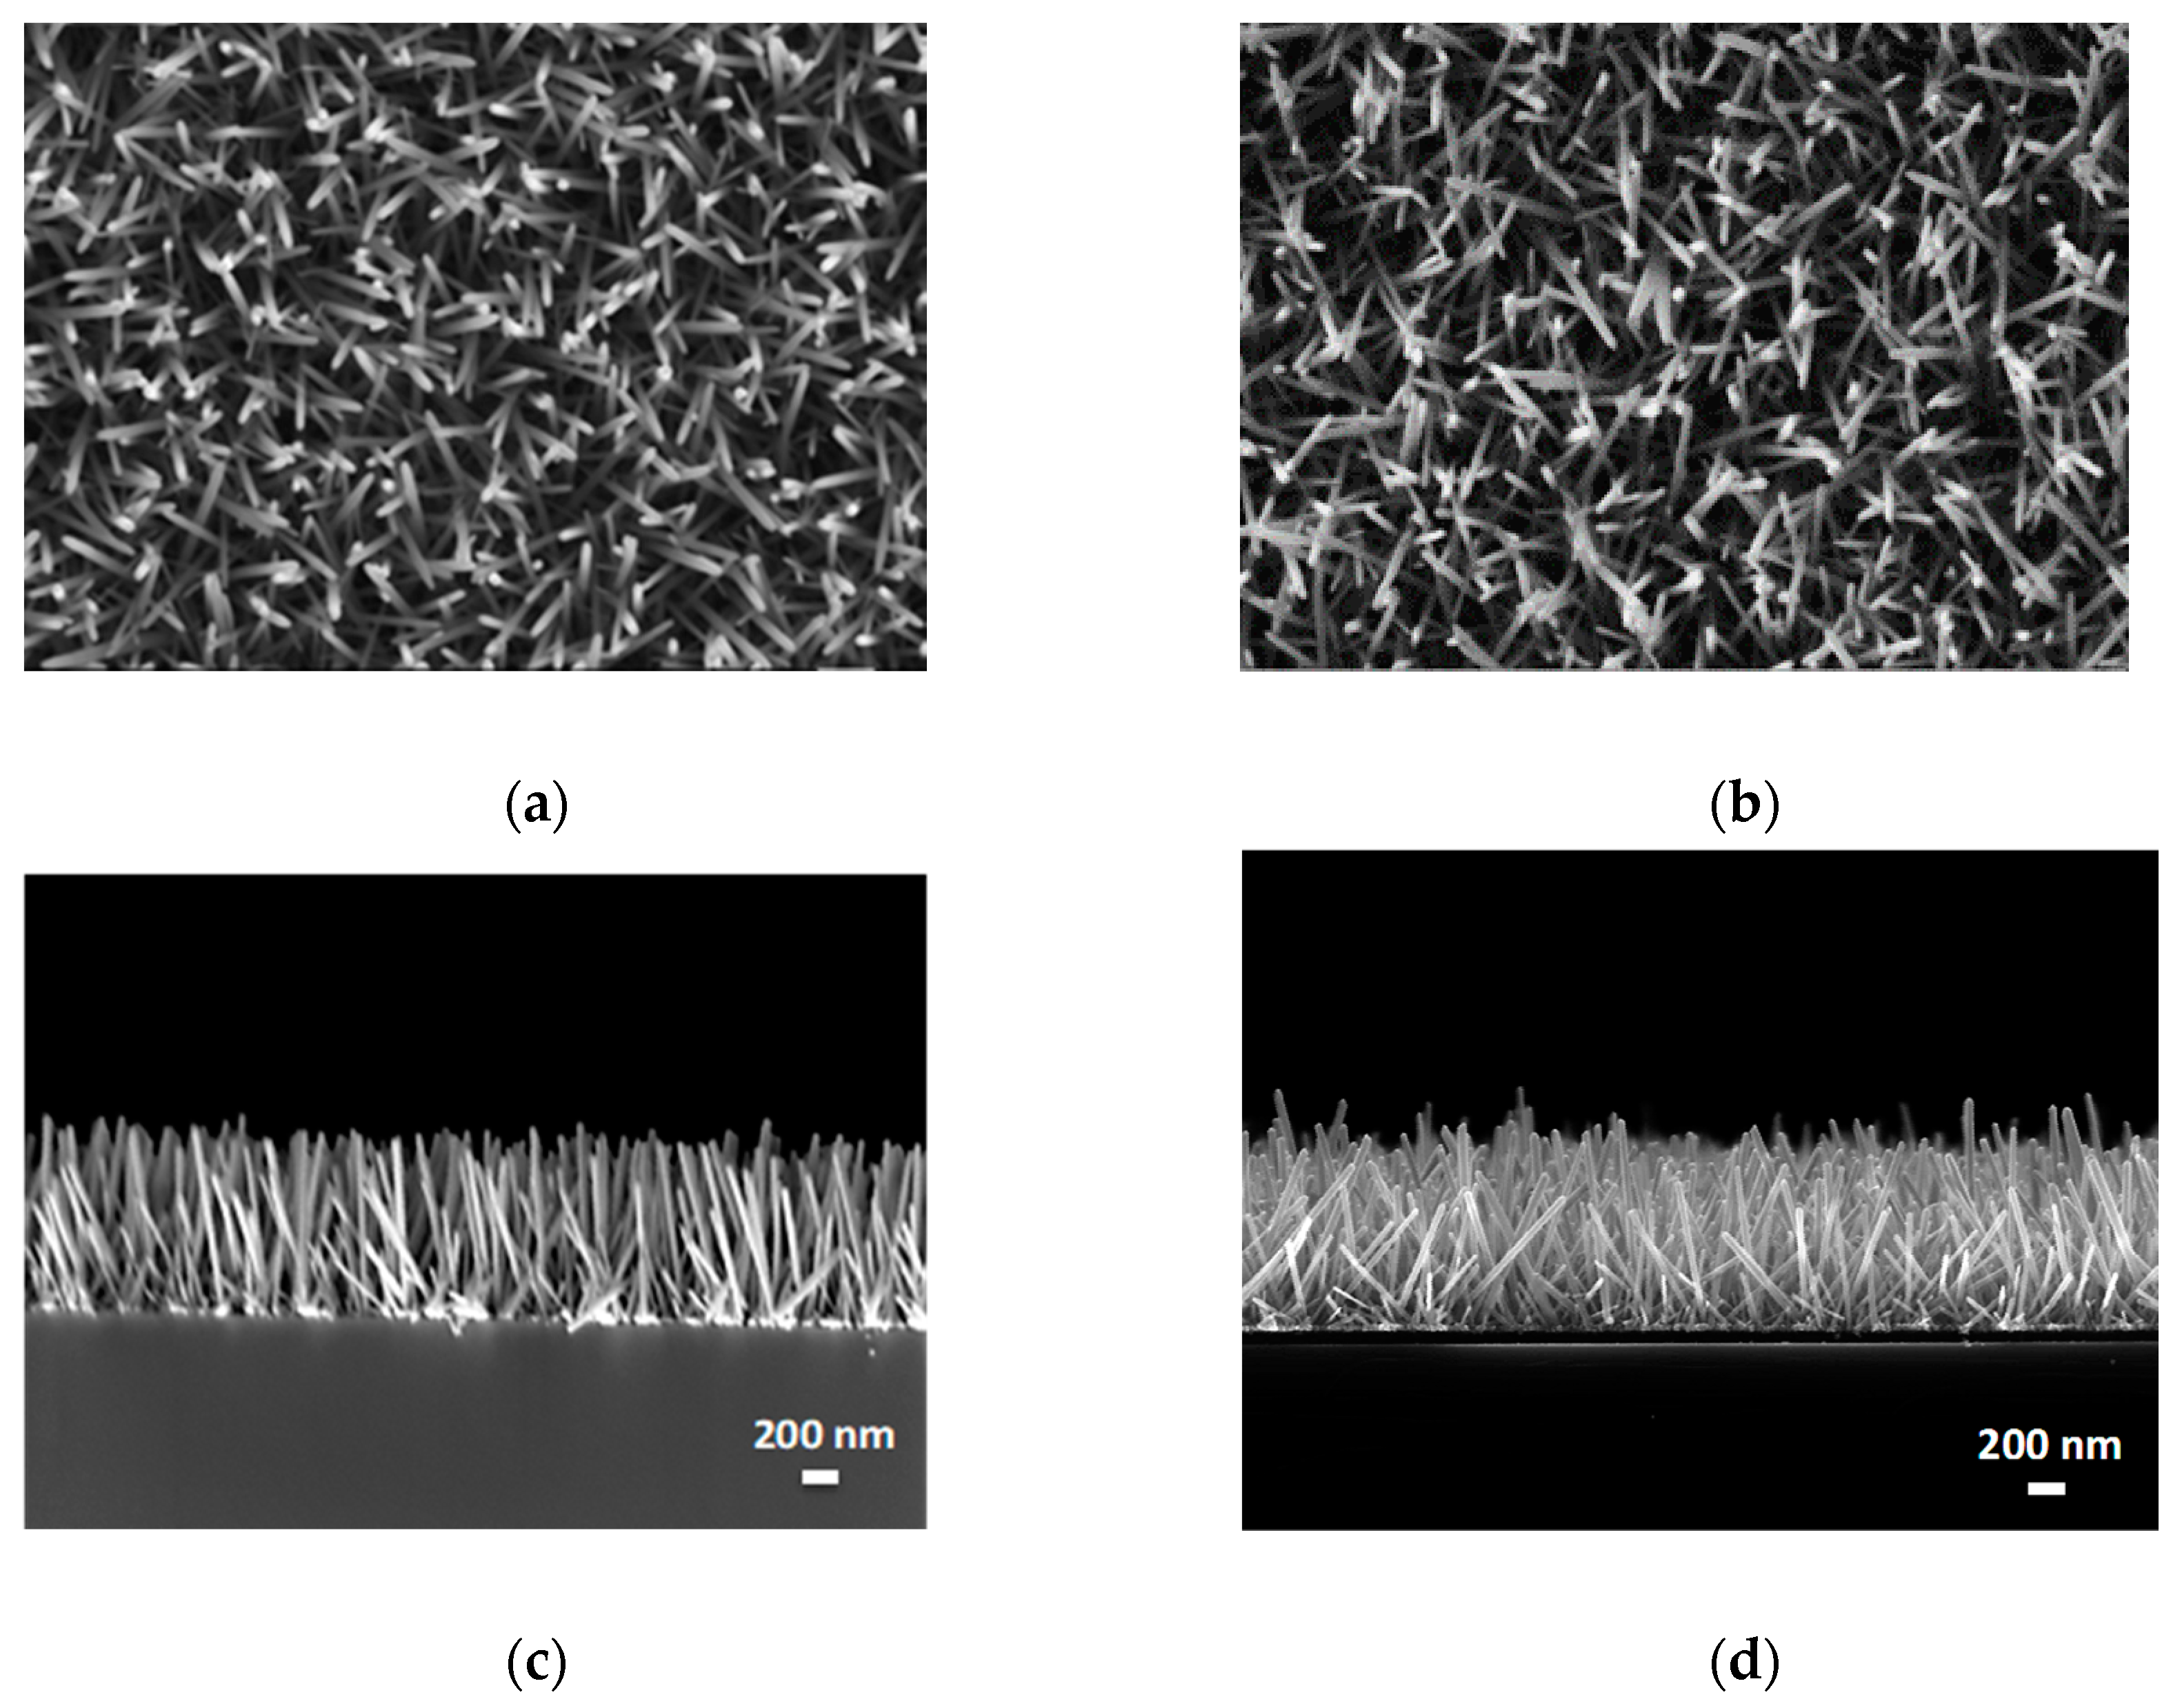
The plane-view and cross-section SEM images of the undoped and Fe-doped ZnO NWs (Figure 2), with the same growth time of 4 h and the same growth temperature of 95 °C, showed that the high aspect ratio ZnO NWs were obtained and the morphology of the nanowires was not modified by the iron doping. From the SEM plane-view images, by using ImageJ software (Version 1.6.0, 2014) and by processing on ten different regions for each sample, we can estimate the nanowire density which was not significantly changed: 63 ± 2 nanowires/µm2 for ZnO NWs vs. 61 ± 2 nanowires/µm2 for ZnO:Fe NWs. Furthermore, the X-ray diffraction (XRD) measurements showed the typical ZnO Würtzite structure with preferred growth direction towards the c-axis both for undoped and Fe-doped ZnO nanowires (Figure 3).
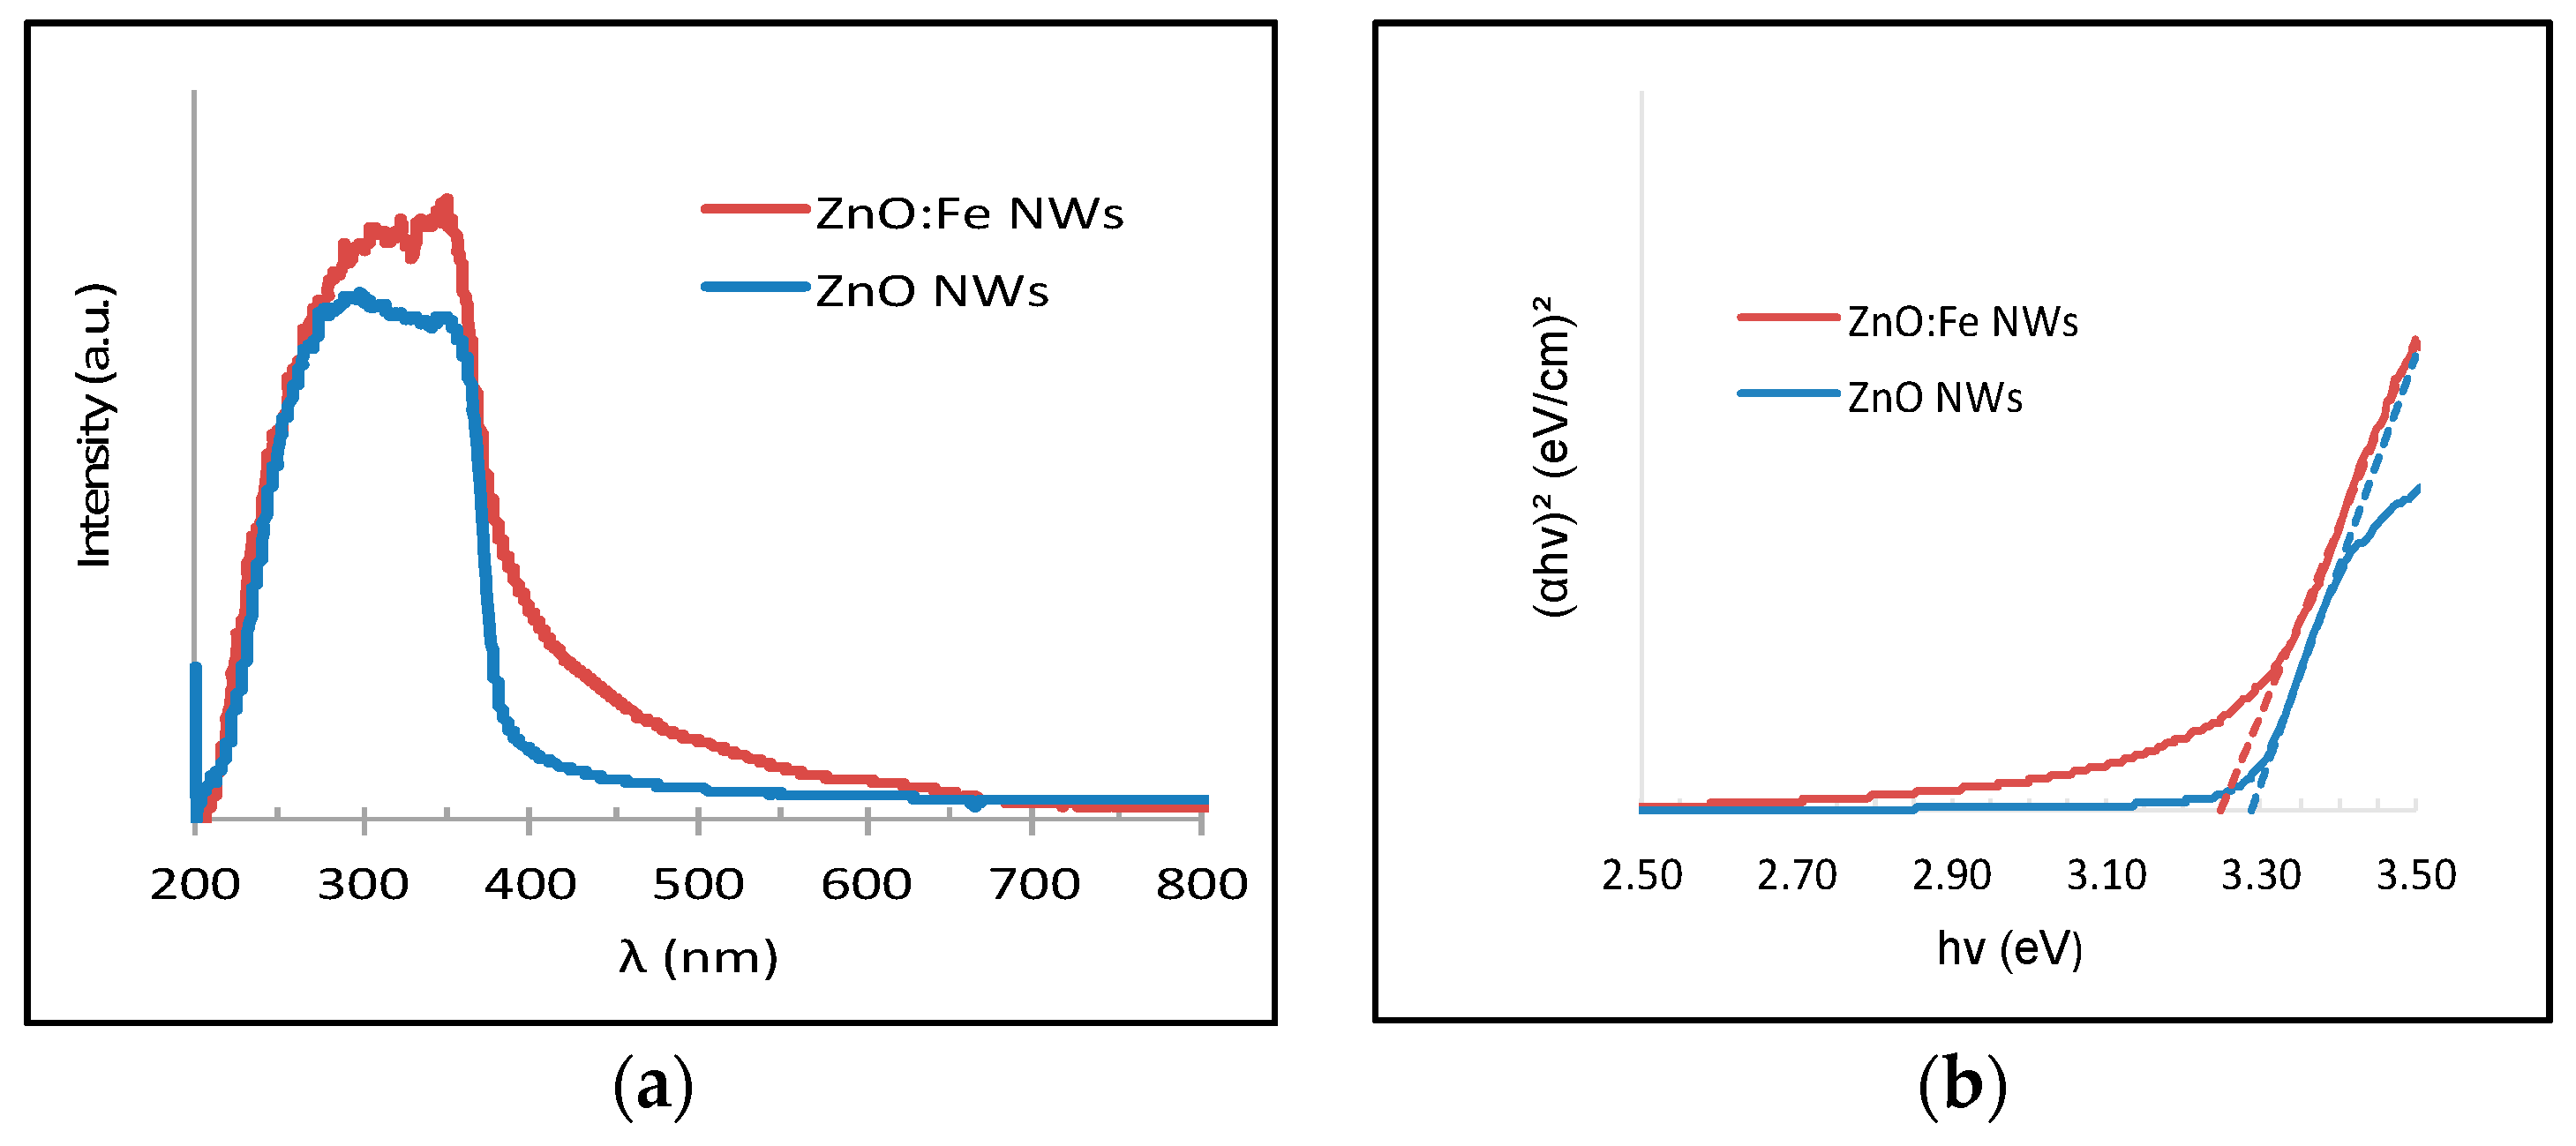
UV-Visible spectroscopy analysis showed that the undoped and Fe-doped ZnO NWs exhibit a similar shape on the absorption spectra (Figure 4a). However, unlike undoped ZnO NWs showing a quasi-total transparency in the visible range, the UV-Visible spectrum of ZnO:Fe NWs exhibits a significant absorption in the visible range (400–600 nm). By using the Tauc plot [15], a red shift (narrowing of band gap) is observed for Fe-doped ZnO (Figure 4b). This red shift is the common result in the transition-metal doped ZnO, due to sp–d exchange interactions between the ZnO band electrons and the localized “d” electrons of the transition-metal doped in the semiconductor matrix [16,17]. In this case, “s–d” and “p–d” exchange interactions lead to a negative correction to the CB edge and a positive correction to the VB edge of the ZnO matrix leading to a band gap narrowing. The band gap (Eg) values calculated by the Tauc’s equation are 3.29 and 3.25 eV, respectively, for ZnO NWs and ZnO:Fe NWs as shown in Figure 4b.
3. Photocatalytic Activity Study and Discussion
The principle of photocatalysis consists in using photon energy to activate the catalyst; this phenomenon is initiated by electron–hole pairs after a photo-excitation in the semiconductor. Indeed, when a photocatalyst is illuminated by light having photon energy larger than the semiconductor band gap, the electrons (e−) of the VB can pass to vacant orbitals of the CB leaving an equal number of holes (h+) in the VB (Equation (1)).
If the free charges (electrons and holes) migrate to the surface of the semiconductor without recombining, then they can participate in various oxidation and reduction reactions with adsorbed species such as water, oxygen and other organic species by generating the hydroxyl radicals OH• which possess a high oxidation power. These successive reactions of oxidation and reduction of the photocatalytic mechanism can be described by the following equations:
ZnO + hν → ZnO + e− + h+
H2O + hVB+ → OH• + H+
OH− + hVB+ → OH•
H2O2 + eBC− → OH• + OH−
Finally, these OH• radicals having a strong oxidation power, can lead to a partial or complete mineralization of the organic substances (such as the dyes, for example) in the waste water, forming non-toxic products such as CO2 and H2O, as shown in Equation (11).
OH• + Pollutants → Intermediary Products → CO2, H2O …
In our study, the photocatalytic efficiency of Fe-doped ZnO nanowires was studied on three organic dyes (MB, MO, and AR14) which are the main components of textile, food-processing and pharmaceutical industrial waste materials. The study of their photo-degradation was carried out under a combined Mercury-Xenon UV-Visible combined lamp (HAMAMATSU-LC8) (Hamamatsu Photonics, Shizuoka, Japan) with main irradiation wavelength of 365 nm and an irradiation intensity of 4500 mW/cm2 under a normal incidence on the out level of the lamp. The sample of ZnO:Fe NWs grown on the Si substrate, has an effective surface area of about 1 cm2. The initial concentration of aqueous solution of each organic dye was 10 μM. The sample of ZnO NWs was placed at the bottom of the container with a fixed dye solution volume of 50 mL. The distance between the UV lamp and the sample surface was maintained at 10 cm for all photocatalysis experiments as shown in our previous work [14]. It is worth noting that during the photocatalytic reaction, there is no stirring in the solution for this study.
The evolution of the photocatalytic reaction was followed by an UV-Vis spectrophotometer, by periodically recording the absorption spectra in order to monitor the concentration change of the residual organic dye in the solution. The residual dye content in the solution was determined by a degradation percentage defined by the following relation:
where A0 is the initial dye absorbance, at the maximum absorption wavelength of the dye, before illumination and At is the dye absorbance at time t.
The characteristic absorption peaks in UV-Vis spectroscopy corresponding to the molecules MB, MO and AR14 are localized at 665, 464 and 515 nm, respectively. Photo-degradation spectra with undoped ZnO NWs and without ZnO NWs were systematically recorded in parallel for each dye in order to compare with Fe-doped ZnO NWs.
Figure 5 summarizes the spectra of photo-degradation for undoped and iron-doped ZnO NWs for the three understudied organic dyes. One can note that the absorption peak for each dye decreases progressively in intensity with the light illumination time, indicating a decrease in the dye concentration in the solution. It worth noting that the photo-degradation time of 180 min is not a time limit; it is more a pre-fixed time for all our photo-degradation process in this study.
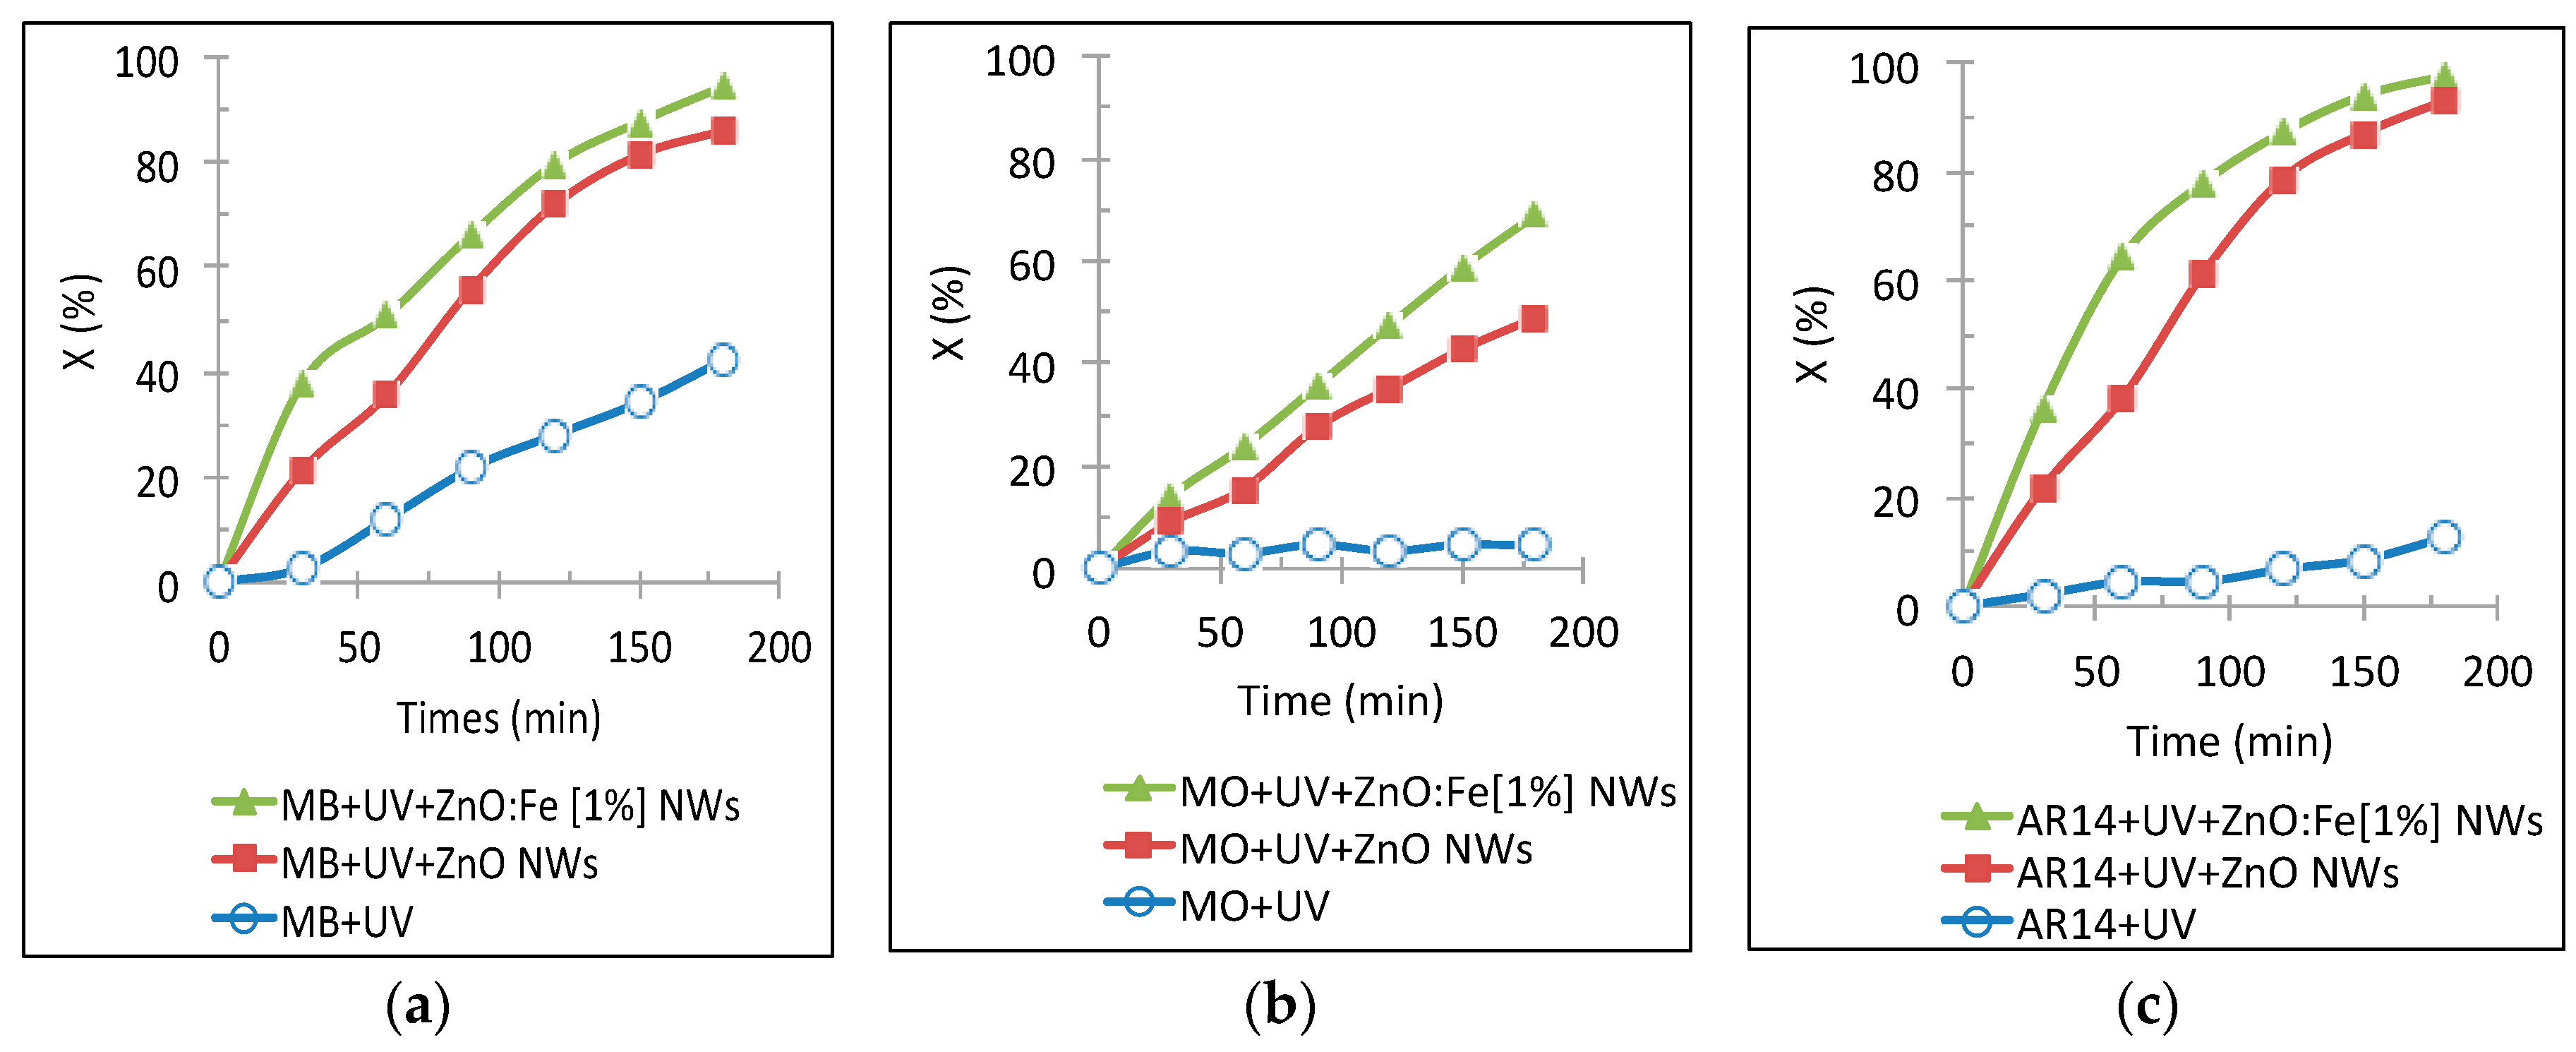
Figure 6 shows a comparison of the photo-degradation rate evolution of the three dye solutions in the presence of ZnO:Fe NWs, ZnO NWs and without ZnO under a UV lamp exposure for 180 min.
According to the obtained results, one can note that the photo-degradation rate of the various dyes (MB, MO and AR14) increases with light irradiation time in the presence of the photocatalyst (undoped and doped ZnO NWS). The photocatalytic activities of ZnO:Fe NWs (with 1% Fe-doping) showed to be more efficient compared to those of ZnO NWs. Using the ZnO:Fe NWs, the photo-degradation rate of MO was improved by 20% compared to a photo-degradation rate with undoped ZnO NWs, going from 49% to 69% after 3 h of illumination. It should be emphasized that due to the high energy of 4.33 eV of the main N=N bond in MO molecule, MO is one of the most difficult dyes to degrade compared to the others dyes such as MB and AR14. Although the AR14 dye also contains the N=N bond, the attracting effect of the OH• radicals on the aromatic ring creates a deficit on the carbon atom in the C–N= bond, which further weakens the C–N bond. The photo-degradation mechanism has been proposed for each dye in our previous work [14] under the same experimental conditions. Iron doping also improved the photocatalytic efficiency for the MB and AR14 depollution, their photo-degradation rate increases from 86% to 95% for MB and from 93% to 98% for AR14. Moreover, since the nanowire density is similar (Figure 2) in two cases, thus, we can conclude that the Fe-doped ZnO NWs have greater photocatalytic activities than the undoped ZnO NWs.
Photocatalytic activity of undoped ZnO is generally attributed to two kinds of states: (1) The donor states formed by the large number of defect sites such as oxygen vacancies and interstitial zinc atoms; (2) the acceptor states formed by zinc vacancies and interstitial oxygen atoms. Dhiman et al. [17] assume that the interfacial electron transfer takes place predominantly between these donor states (oxygen vacancies and interstitial Zn atom) and Methylene Blue. Being a cationic dye, Methylene Blue acquires electrons from excited donor states and decomposes. This faster degradation rate of Methylene Blue under visible light irradiation using Fe-doped ZnO is attributed to the increase in defect sites caused by Fe-doping, leading to an enhanced optical absorption in the visible region.
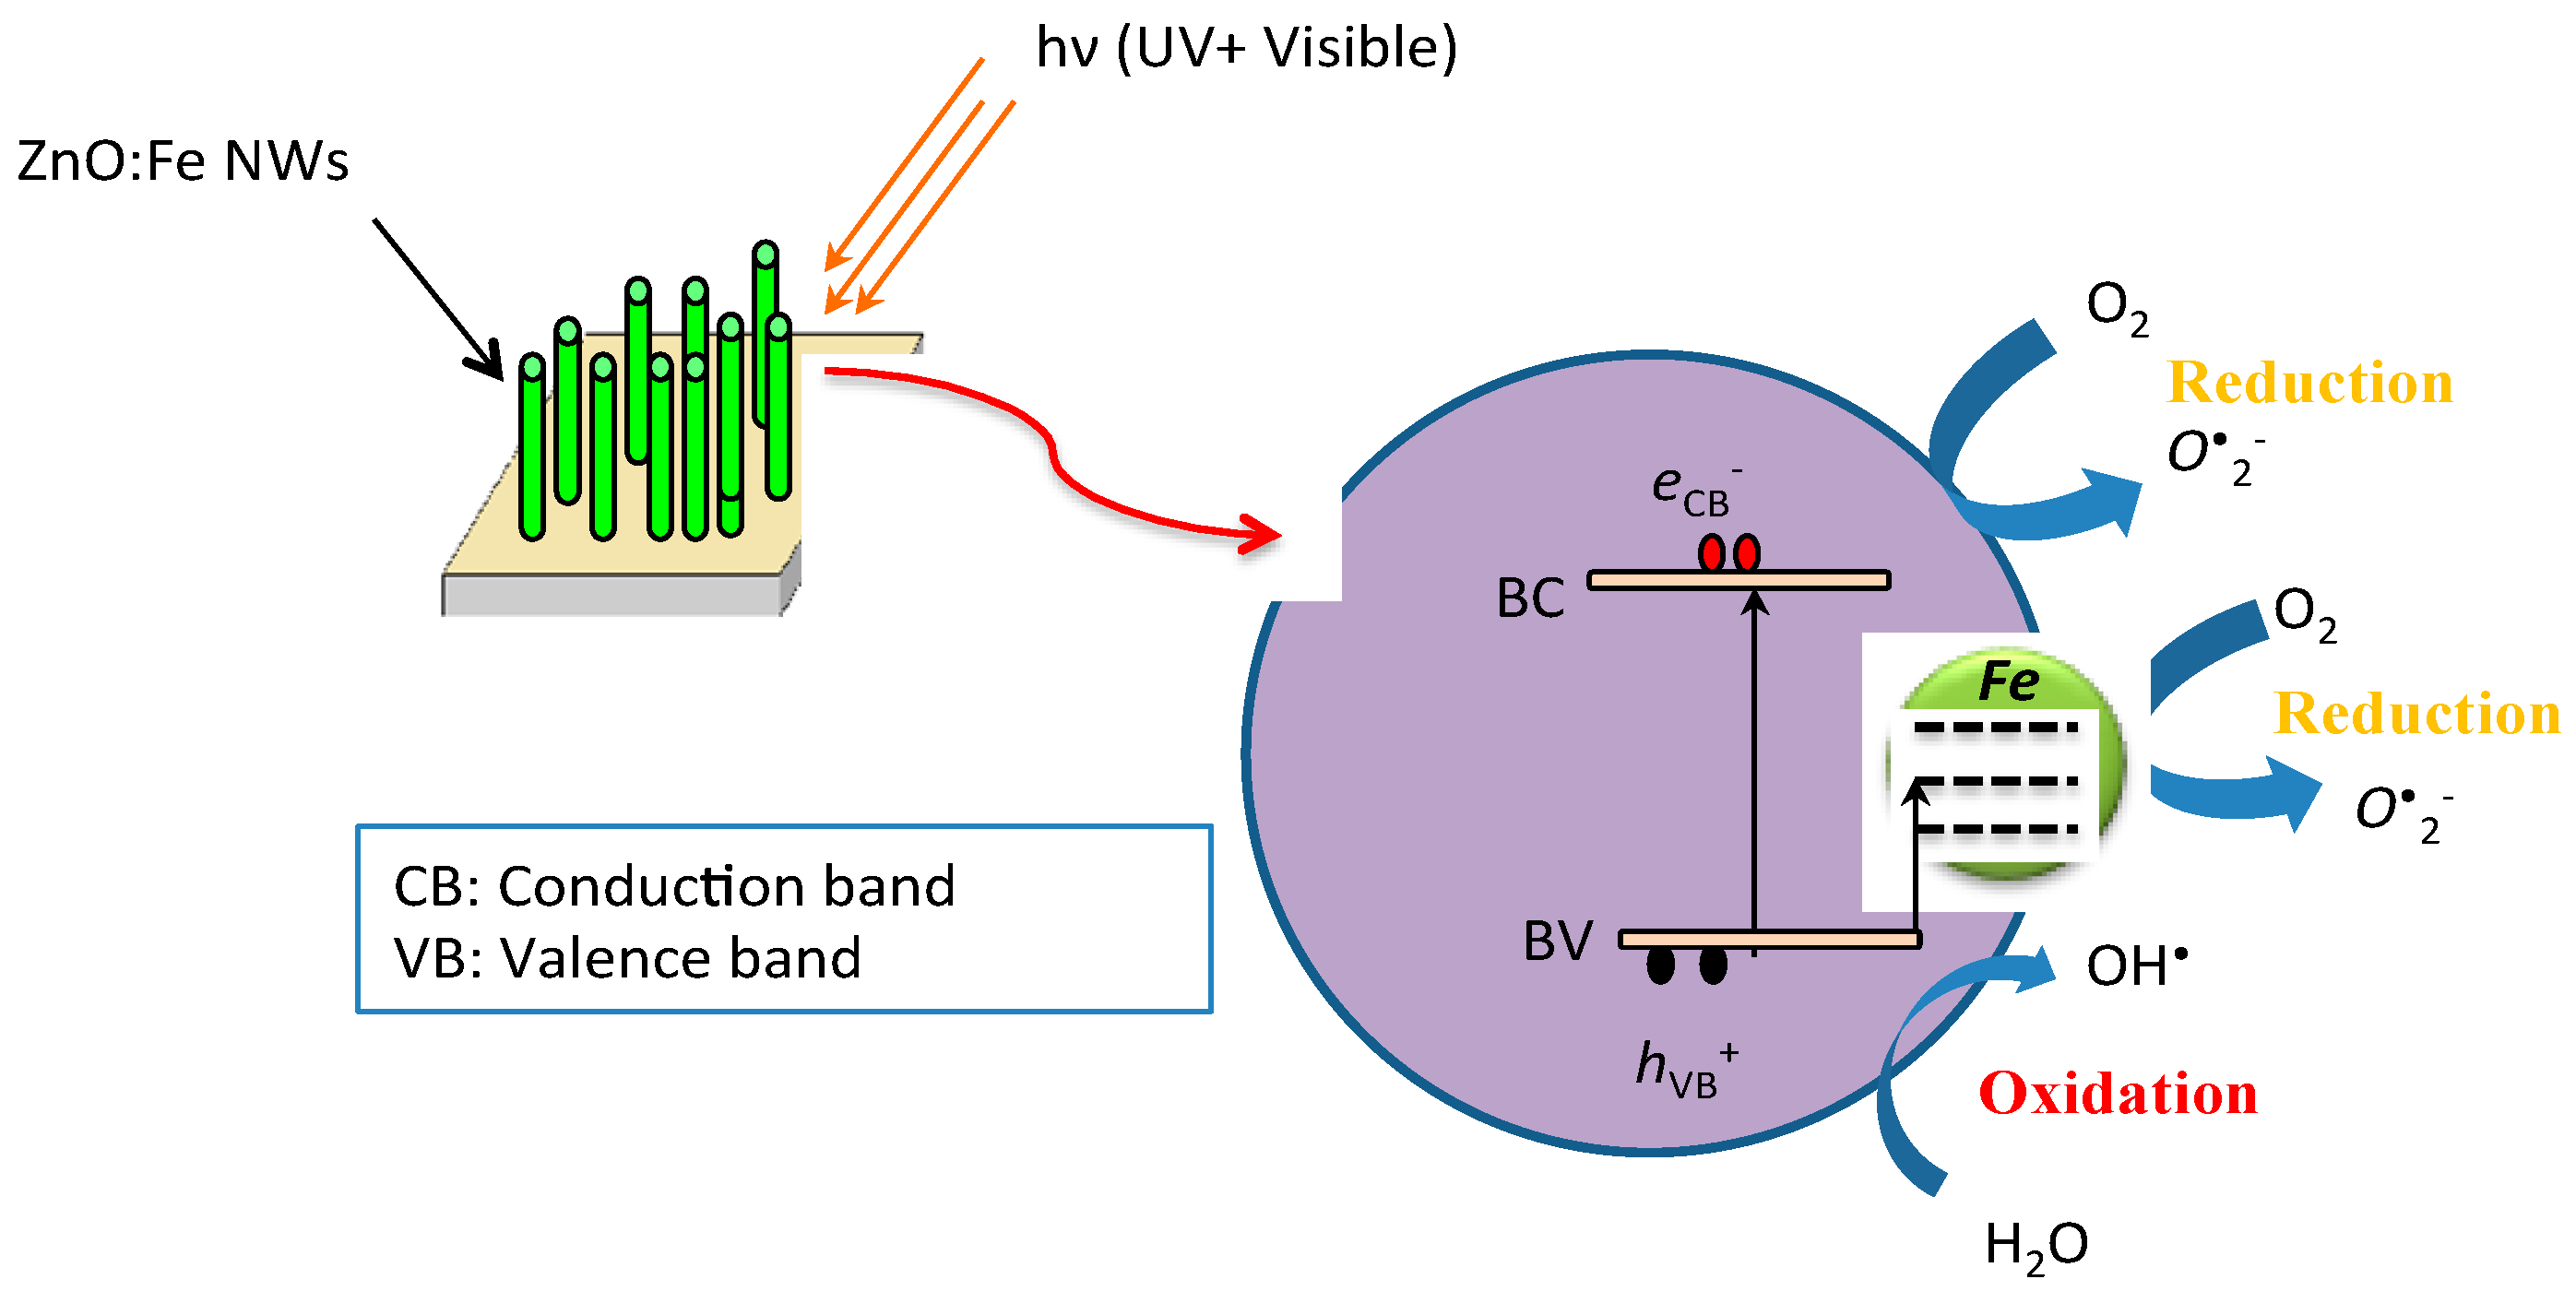
In fact, the Fe-doping of ZnO NWs allows the substitution of a few Zn atoms by Fe atoms, resulting in the creation of other energy levels above VB and below CB of ZnO (Figure 7) [18], leading to a reduction of the gap, then allowing the semiconductor to harvest more photons during the photocatalysis process. In addition, the introduction of iron leads to the formation of additional defects in the ZnO crystal lattice [19], which can become electron traps, reduces the recombination probability of the electron–hole pairs and leads to an acceleration of the formation of hydroxyl radicals. Thus, the photocatalytic efficiency of ZnO will be improved and, consequently, the photo-degradation rate of the dyes will be increased according to the reactions below:
Fe3+ + e− → Fe2+
Fe3+ + h+ → Fe4+
Fe4+ + OH− → Fe3+ + OH•
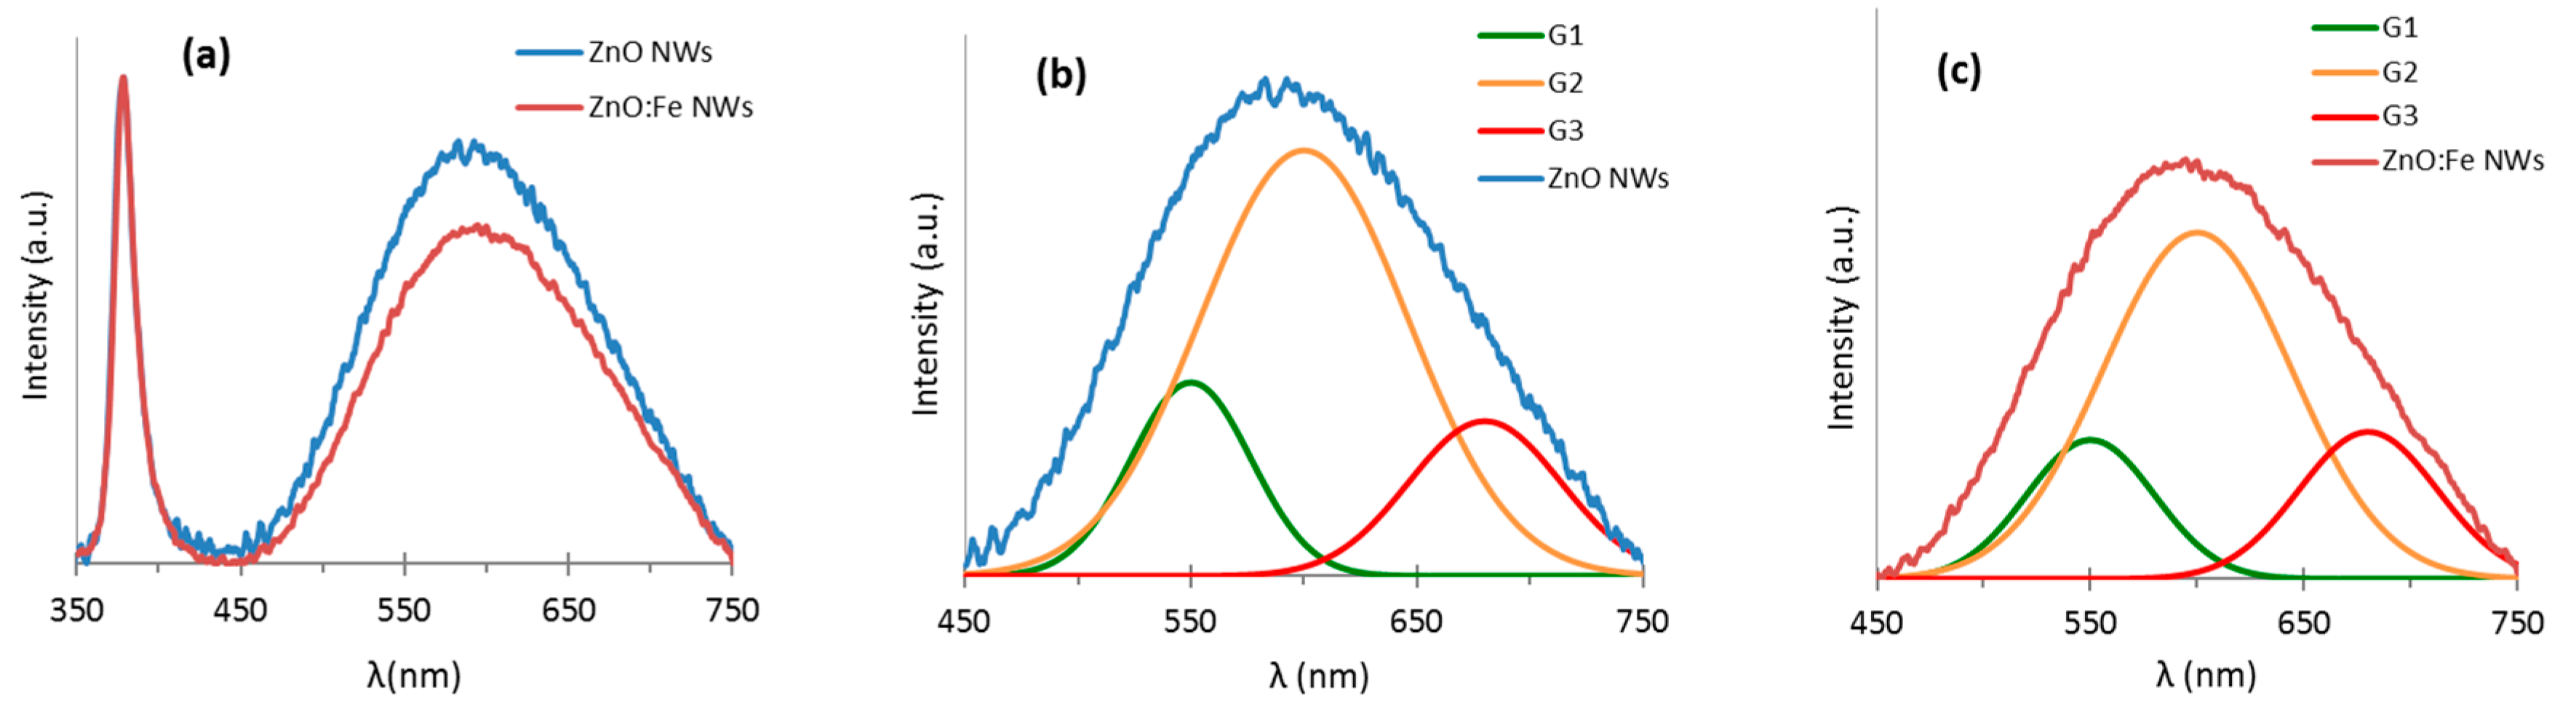
In order to understand the trapping efficiency of charge carriers in doped ZnO NWs, PL measurements were performed on the undoped and doped samples. Figure 8a illustrates the PL emission spectra for undoped and Fe-doped ZnO NWs with an excitation wavelength of 325 nm (Laser He-Cd) (Model IK3101R-D, KIMMON K., Tokyo, Japan). It should be noted that the intensity of the laser on the sample is equal to 0.32 W/cm2 and this value remained constant for all analyses carried out in this same experimental setup. We found that all obtained PL spectra are composed of two distinct emissions: A UV emission peak at 376 nm and a dominant and broad emission in the visible region ranging from green to red. The UV emission corresponding to the ZnO band gap transition is generally attributed to direct exciton recombination, where one of the excitons radically recombines to generate a photon; while the second emission in the visible range corresponds to defects and/or impurities in the structure and/or on the surface of ZnO nanostructures.
In the visible region, three main emissions can be distinguished:
From Figure 8a, we can note that the ZnO NWs and ZnO:Fe NWs samples have the same characteristic peak corresponding to the transition of the ZnO gap energy (centered at 376 nm) and also a wide emission in the visible range which represents various defects. We can notice that the intensity of PL relative to the emission of defects decreases with the introduction of iron into the ZnO NWs. This may be due to the fact that the excited electrons will react with the defects of the ZnO:Fe NWs structures, thus resulting in a decrease in the emission relative to the defects. Cheng et al. [26] also carried out a PL analysis on ZnO films doped at different iron concentrations. They found that as the concentration of Fe in the films increases, the peak intensity of UV emission increases, while the visible emission intensity decreases. The result suggests that the crystal lattice of Fe-doped ZnO films exhibits fewer interstitial oxygen and oxygen vacancies compare to undoped ZnO.
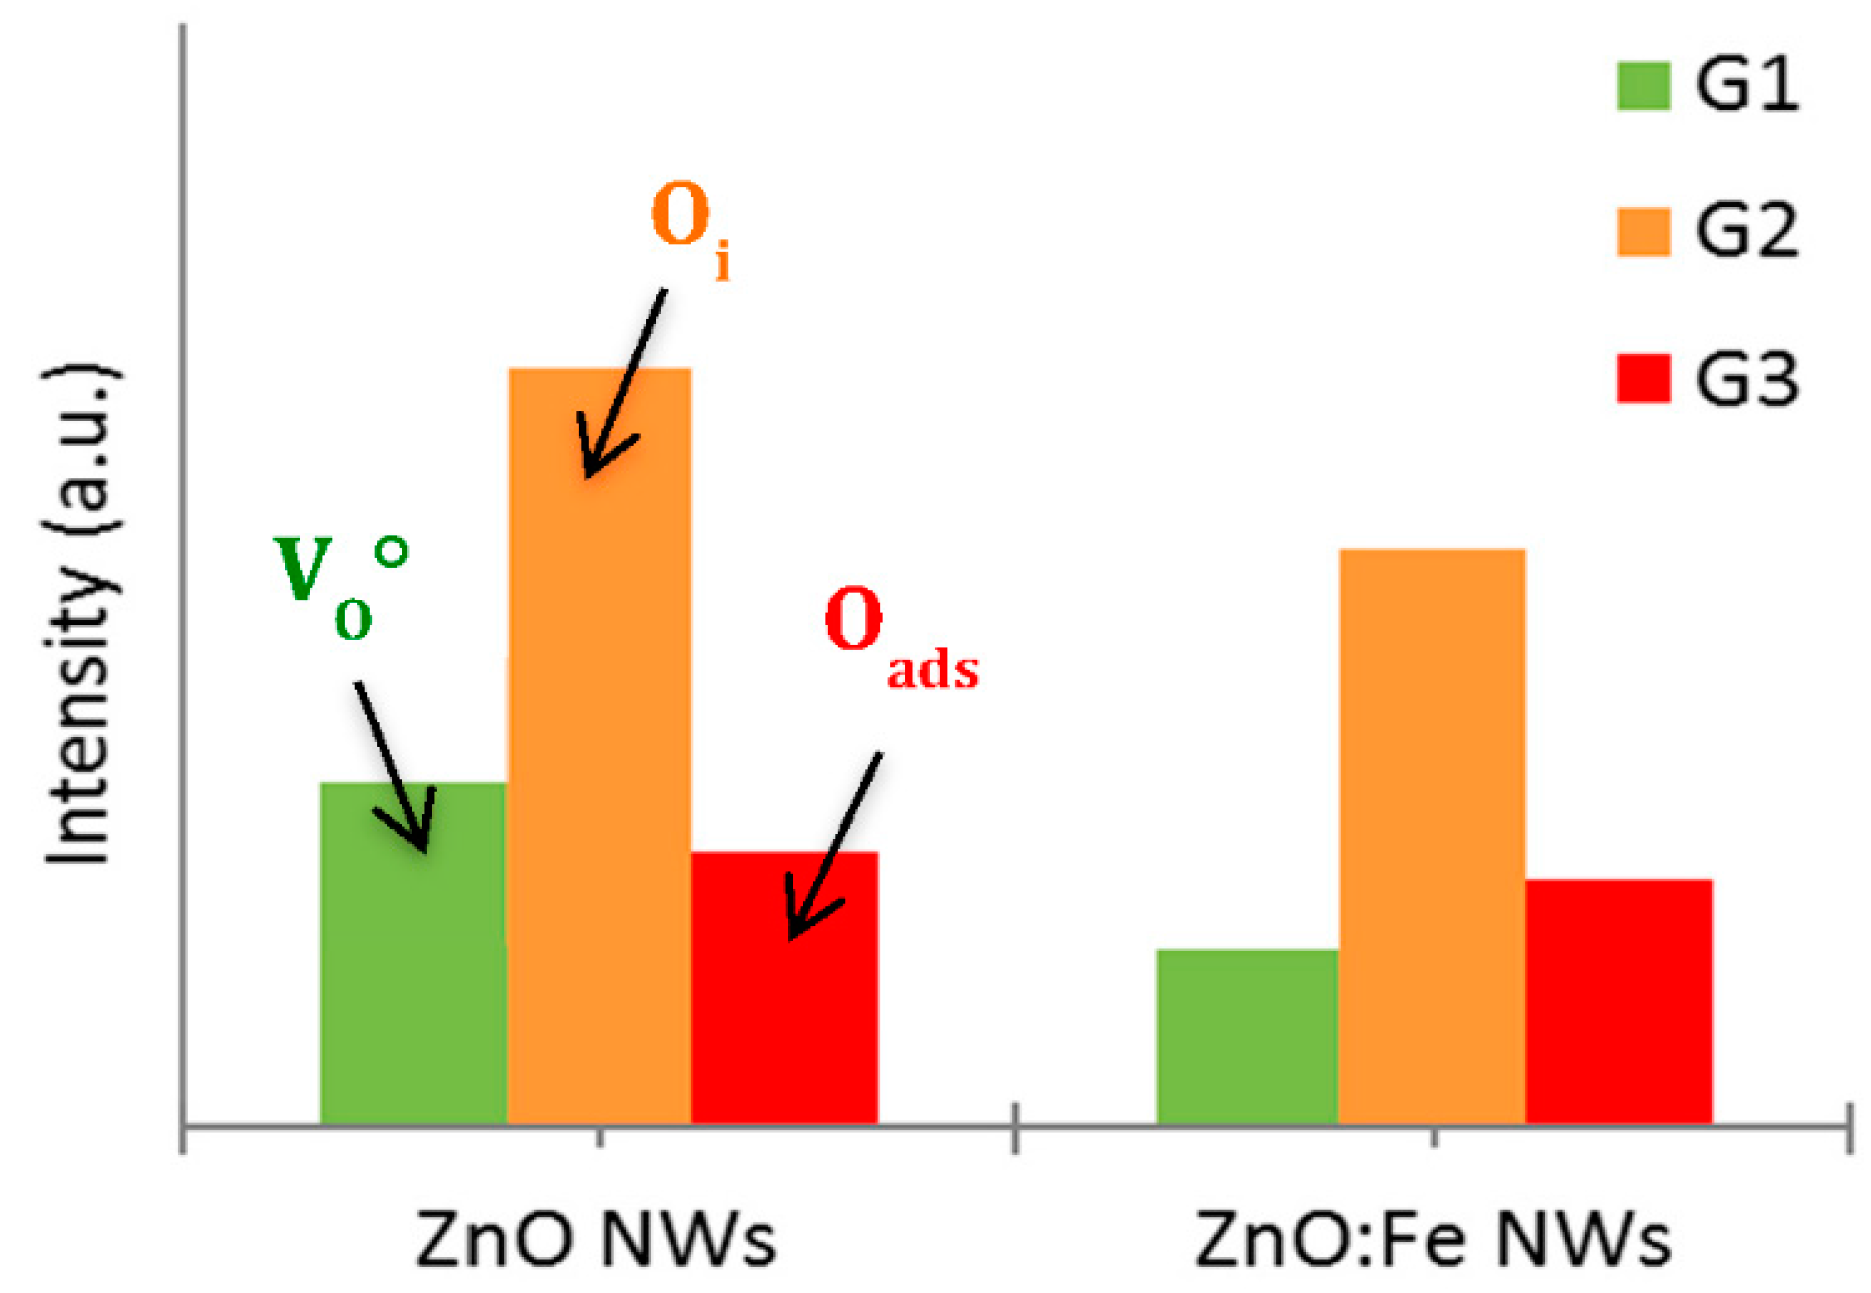
In order to make a comprehensive understanding of the PL evolution, the PL spectra were decomposed by using three Gaussian components: Green (G1), yellow–orange (G2) and red (G3) spectral region (Figure 8b,c), usually suggested in literature and studied in our previous work [27]. After the deconvolution of the PL spectra on the visible emission related to the defects for the undoped and Fe-doped ZnO NWs (Figure 9), we observed a decrease in the intensity of both of G1 and G2 components, related to the oxygen vacancies and the oxygen interstitials, respectively.
The PL spectrum decomposition allowed us to confirm that the electrons can also be trapped by the defects in the ZnO:Fe NW structure leading to a lower electron–hole pair recombination rate, and then increasing the photocatalytic activity, meaning the greater polluted water purification efficiency.
4. Conclusions
In this study, the Fe-doped ZnO NWs has been studied for photocatalysis. Neither morphology nor microstructure of ZnO NWs has been changed by low concentration (1%). Fe-doping is the growth solution for the hydrothermal synthesis method. In fact, doping can considerably increase the lifetime of charge carriers (electron–hole pairs) which play an essential role in the production of OH• radials necessary for the decomposition of the toxic organic compound in the polluted water into harmless compounds. In addition, iron doping allows the semiconductor to widen its light absorption spectral range (UV + Visible) during photocatalysis process and then to increase the defect rate in the ZnO crystal lattice. The electrons can be trapped in the Fe-doped ZnO NWs decreasing the electron–hole pair recombination possibility, leading to an improvement of the ZnO photocatalytic efficiency. We were able to improve the MO degradation rate by 20% with ZnO:Fe NWs compared to the undoped ZnO NWs. PL analysis showed that the introduction of Fe into the ZnO structure leads to an overall decrease in visible emissions. This confirms that defects in the ZnO structure react with electrons, thereby reducing the electron–hole recombination probability.
Author Contributions
Yamina Ghozlane Habba and Martine Capochichi-Gnambodoe onceived and designed the experiments; Yamina Ghozlane Habba performed the experiments; Yamina Ghozlane Habba, Martine Capochichi-Gnambodoe and Yamin Leprince-Wang analyzed the data. Yamin Leprince-Wang supervised this research work and wrote the paper.
Conflicts of Interest
The authors declare no conflict of interest.
References
- Huang, H.; Leung, D.Y.C.; Kwong, P.C.W.; Xiong, J.; Zhang, L. Enhanced photocatalytic degradation of methylene blue under vacuum ultraviolet irradiation. Catal. Today 2013, 201, 189–194. [Google Scholar] [CrossRef]
- Saikia, L.; Bhuyana, D.; Saikia, M.; Malakar, B.; Dutta, D.K.; Sengupta, P. Photocatalytic performance of ZnO nanomaterials for self-sensitized degradation of malachite green dye under solar light. Appl. Catal. A 2015, 490, 42–49. [Google Scholar] [CrossRef]
- Wu, J.J.; Tseng, C.H. Photocatalytic properties of nc-Au/ZnO nanorod composites. Appl. Catal. B 2006, 66, 51–57. [Google Scholar] [CrossRef]
- Wang, Y.W.; Zhang, L.Z.; Deng, K.J.; Chen, X.; Zou, Z.G. Low temperature synthesis and photocatalytic activity of rutile TiO2 nanorod superstructures. J. Phys. Chem. C 2007, 111, 2709–2714. [Google Scholar] [CrossRef]
- Reynolds, D.C.; Look, D.C.; Jogai, B.; Hoelscher, J.E.; Sherriff, R.E.; Harris, M.T.; Callahan, M.J. Time-resolved photoluminescence lifetime measurements of the Γ5 and Γ6 free excitons in ZnO. J. Appl. Phys. 2000, 88, 2152–2153. [Google Scholar] [CrossRef]
- Ryu, J.; Choi, W. Substrate-specific photocatalytic activities of TiO2 and multiactivity test for water treatment application. Environ. Sci. Technol. 2008, 42, 294–300. [Google Scholar] [CrossRef] [PubMed]
- Zou, Z.; Ye, J.; Sayama, K.; Arakawa, H. Direct splitting of water under visible light irradiation with an oxide semiconductor photocatalyst. Nature 2001, 414, 625–627. [Google Scholar] [CrossRef] [PubMed]
- Asahi, R.; Morikawa, T.; Ohwaki, T.; Aoki, K.; Taga, Y. Visible-light photocatalysis in nitrogen-doped titanium oxides. Science 2001, 293, 269–271. [Google Scholar] [CrossRef] [PubMed]
- Anpo, M.; Takeuchi, M. The design and development of highly reactive titanium oxide photocatalysts operating under visible light irradiation. J. Catal. 2003, 216, 505–516. [Google Scholar] [CrossRef]
- Su, X.; Jia, Y.; Liu, X.; Wang, J.; Xu, J.; He, X.; Fu, C.; Liu, S. Preparation, dielectric property and infrared emissivity of Fe-doped ZnO powder by coprecipitation method at various reaction time. Ceram. Int. 2014, 40, 5307–5311. [Google Scholar] [CrossRef]
- Zhang, K.Z.; Lin, B.Z.; Chen, Y.L.; Xu, B.H.; Pian, X.T.; Kuang, J.D.; Li, B. Fe-doped and ZnO-pillared titanates as visible-light-driven photocatalysts. J. Colloid Interface Sci. 2011, 358, 360–368. [Google Scholar] [CrossRef] [PubMed]
- Qiu, X.Q.; Li, L.P.; Zheng, J.; Liu, J.J.; Sun, X.F.; Li, G.S. Origin of the enhanced photocatalytic activities of semiconductors: A case study of ZnO doped with Mg2+. J. Phys. Chem. C 2008, 112, 12242–12248. [Google Scholar] [CrossRef]
- Cao, Y.Q.; He, T.; Chen, Y.M.; Cao, Y.A. Fabrication of rutile TiO2−Sn/Anatase TiO2−N heterostructure and its application in visible-light photocatalysis. J. Phys. Chem. C 2010, 114, 3627–3633. [Google Scholar] [CrossRef]
- Habba, Y.G.; Capochichi-Gnambodoe, M.; Serairi, L.; Leprince-Wang, Y. Enhanced photocatalytic activity of ZnO nanostructure for water purification. Phys. Status Solidi B 2016, 253, 1480–1484. [Google Scholar] [CrossRef]
- Tauc, J. Optical properties and electronic structure of amorphous Ge and Si. Mater. Res. Bull. 1968, 3, 37–46. [Google Scholar] [CrossRef]
- Bhat, S.V.; Deepak, F.L. Tuning the bandgap of ZnO by substitution with Mn2+, Co2+ and Ni2+. Solid State Commun. 2005, 135, 345–347. [Google Scholar] [CrossRef]
- Dhiman, P.; Chand, J.; Kumar, A.; Kotnala, R.K.; Batoo, M.K.; Singh, M. Synthesis and characterization of novel Fe@ZnO nanosystem. J. Alloys Compd. 2013, 578, 235–241. [Google Scholar] [CrossRef]
- Liu, M.; Qiu, X.; Miyauchi, M.; Hashimoto, K. Energy-level matching of Fe(III) ions grafted at surface and doped in bulk for efficient visible-light photocatalysts. J. Am. Chem. Soc. 2013, 135, 10064–10072. [Google Scholar] [CrossRef] [PubMed]
- Kumar, K.; Chitkara, M.; Sandhu, I.S.; Mehta, D.; Kumar, S. Photocatalytic optical and magnetic properties of Fe-doped ZnO nanoparticles prepared by chemical route. J. Alloys Compd. 2014, 588, 681–689. [Google Scholar] [CrossRef]
- Studenikin, S.A.; Golego, N.; Cocivera, M. Fabrication of green and orange photoluminescent, undoped ZnO films using spray pyrolysis. J. Appl. Phys. 1998, 84, 2287–2294. [Google Scholar] [CrossRef]
- Li, D.; Leung, Y.H.; Djurišić, A.B.; Liu, Z.T.; Xie, M.H.; Shi, S.L.; Xu, S.J. Different origins of visible luminescence in ZnO nanostructures fabricated by the chemical and evaporation methods. Appl. Phys. Lett. 2004, 85, 1601–1605. [Google Scholar] [CrossRef] [Green Version]
- Kwok, W.M.; Djurišić, A.B.; Leung, Y.H.; Chan, W.K.; Phillips, D.L. Time-resolved photoluminescence from ZnO nanostructures. Appl. Phys. Lett. 2005, 87, 223111–223114. [Google Scholar] [CrossRef]
- Panigrahy, B.; Aslam, M.; Misra, D.S.; Ghosh, M.; Bahadur, D. Defect-related emissions and magnetization properties of ZnO nanorods. Adv. Funct. Mater. 2010, 20, 1161–1165. [Google Scholar] [CrossRef]
- Cross, R.B.M.; De Souza, M.M.; Sankara Narayanan, E.M. A low temperature combination method for the production of ZnO nanowires. Nanotechnology 2005, 16, 2188–2192. [Google Scholar] [CrossRef] [PubMed]
- Gomi, M.; Oohira, N.; Ozaki, K.; Koyano, M. Photoluminescent and structural properties of precipitated ZnO fine particles. Jpn. J. Appl. Phys. 2003, 42, 481–485. [Google Scholar] [CrossRef]
- Cheng, W.; Ma, X. Structural, optical and magnetic properties of Fe-doped ZnO. J. Phys. Conf. Ser. 2009, 152, 012039. [Google Scholar] [CrossRef]
- Chevalier-César, C.; Capochichi-Gnambodoe, M.; Leprince-Wang, Y. Growth mechanism studies of ZnO nanowire arrays via hydrothermal method. Appl. Phys. A 2014, 115, 953–960. [Google Scholar] [CrossRef]
Figure 1.
Schema of the ZnO nanowire formation: (a) Spin-coating of the seedlayer solution; (b) seedlayer based on the polyvinyl alcohol (PVA) and Zn(CH3COO)2·2H2O; (c) ZnO nanocristallites formation after an annealing at 500 °C during 3 h; (d) undoped and Fe-doped ZnO nanowire (ZnO NW) growth at 95 °C during 4 h.

Figure 2.
Plane-view and cross-section scanning electron microscopy (SEM) images of the undoped ZnO NWs (a,c) and Fe-doped ZnO NWs (b,d) obtained via hydrothermal method with growth time of 4 h at 95 °C.
Figure 2.
Plane-view and cross-section scanning electron microscopy (SEM) images of the undoped ZnO NWs (a,c) and Fe-doped ZnO NWs (b,d) obtained via hydrothermal method with growth time of 4 h at 95 °C.

Figure 3.
X-ray diffraction (XRD) spectra of the nanowire arrays obtained by hydrothermal method both for undoped ZnO NWs and 1% Fe-doped ZnO NWs, respectively.
Figure 3.
X-ray diffraction (XRD) spectra of the nanowire arrays obtained by hydrothermal method both for undoped ZnO NWs and 1% Fe-doped ZnO NWs, respectively.
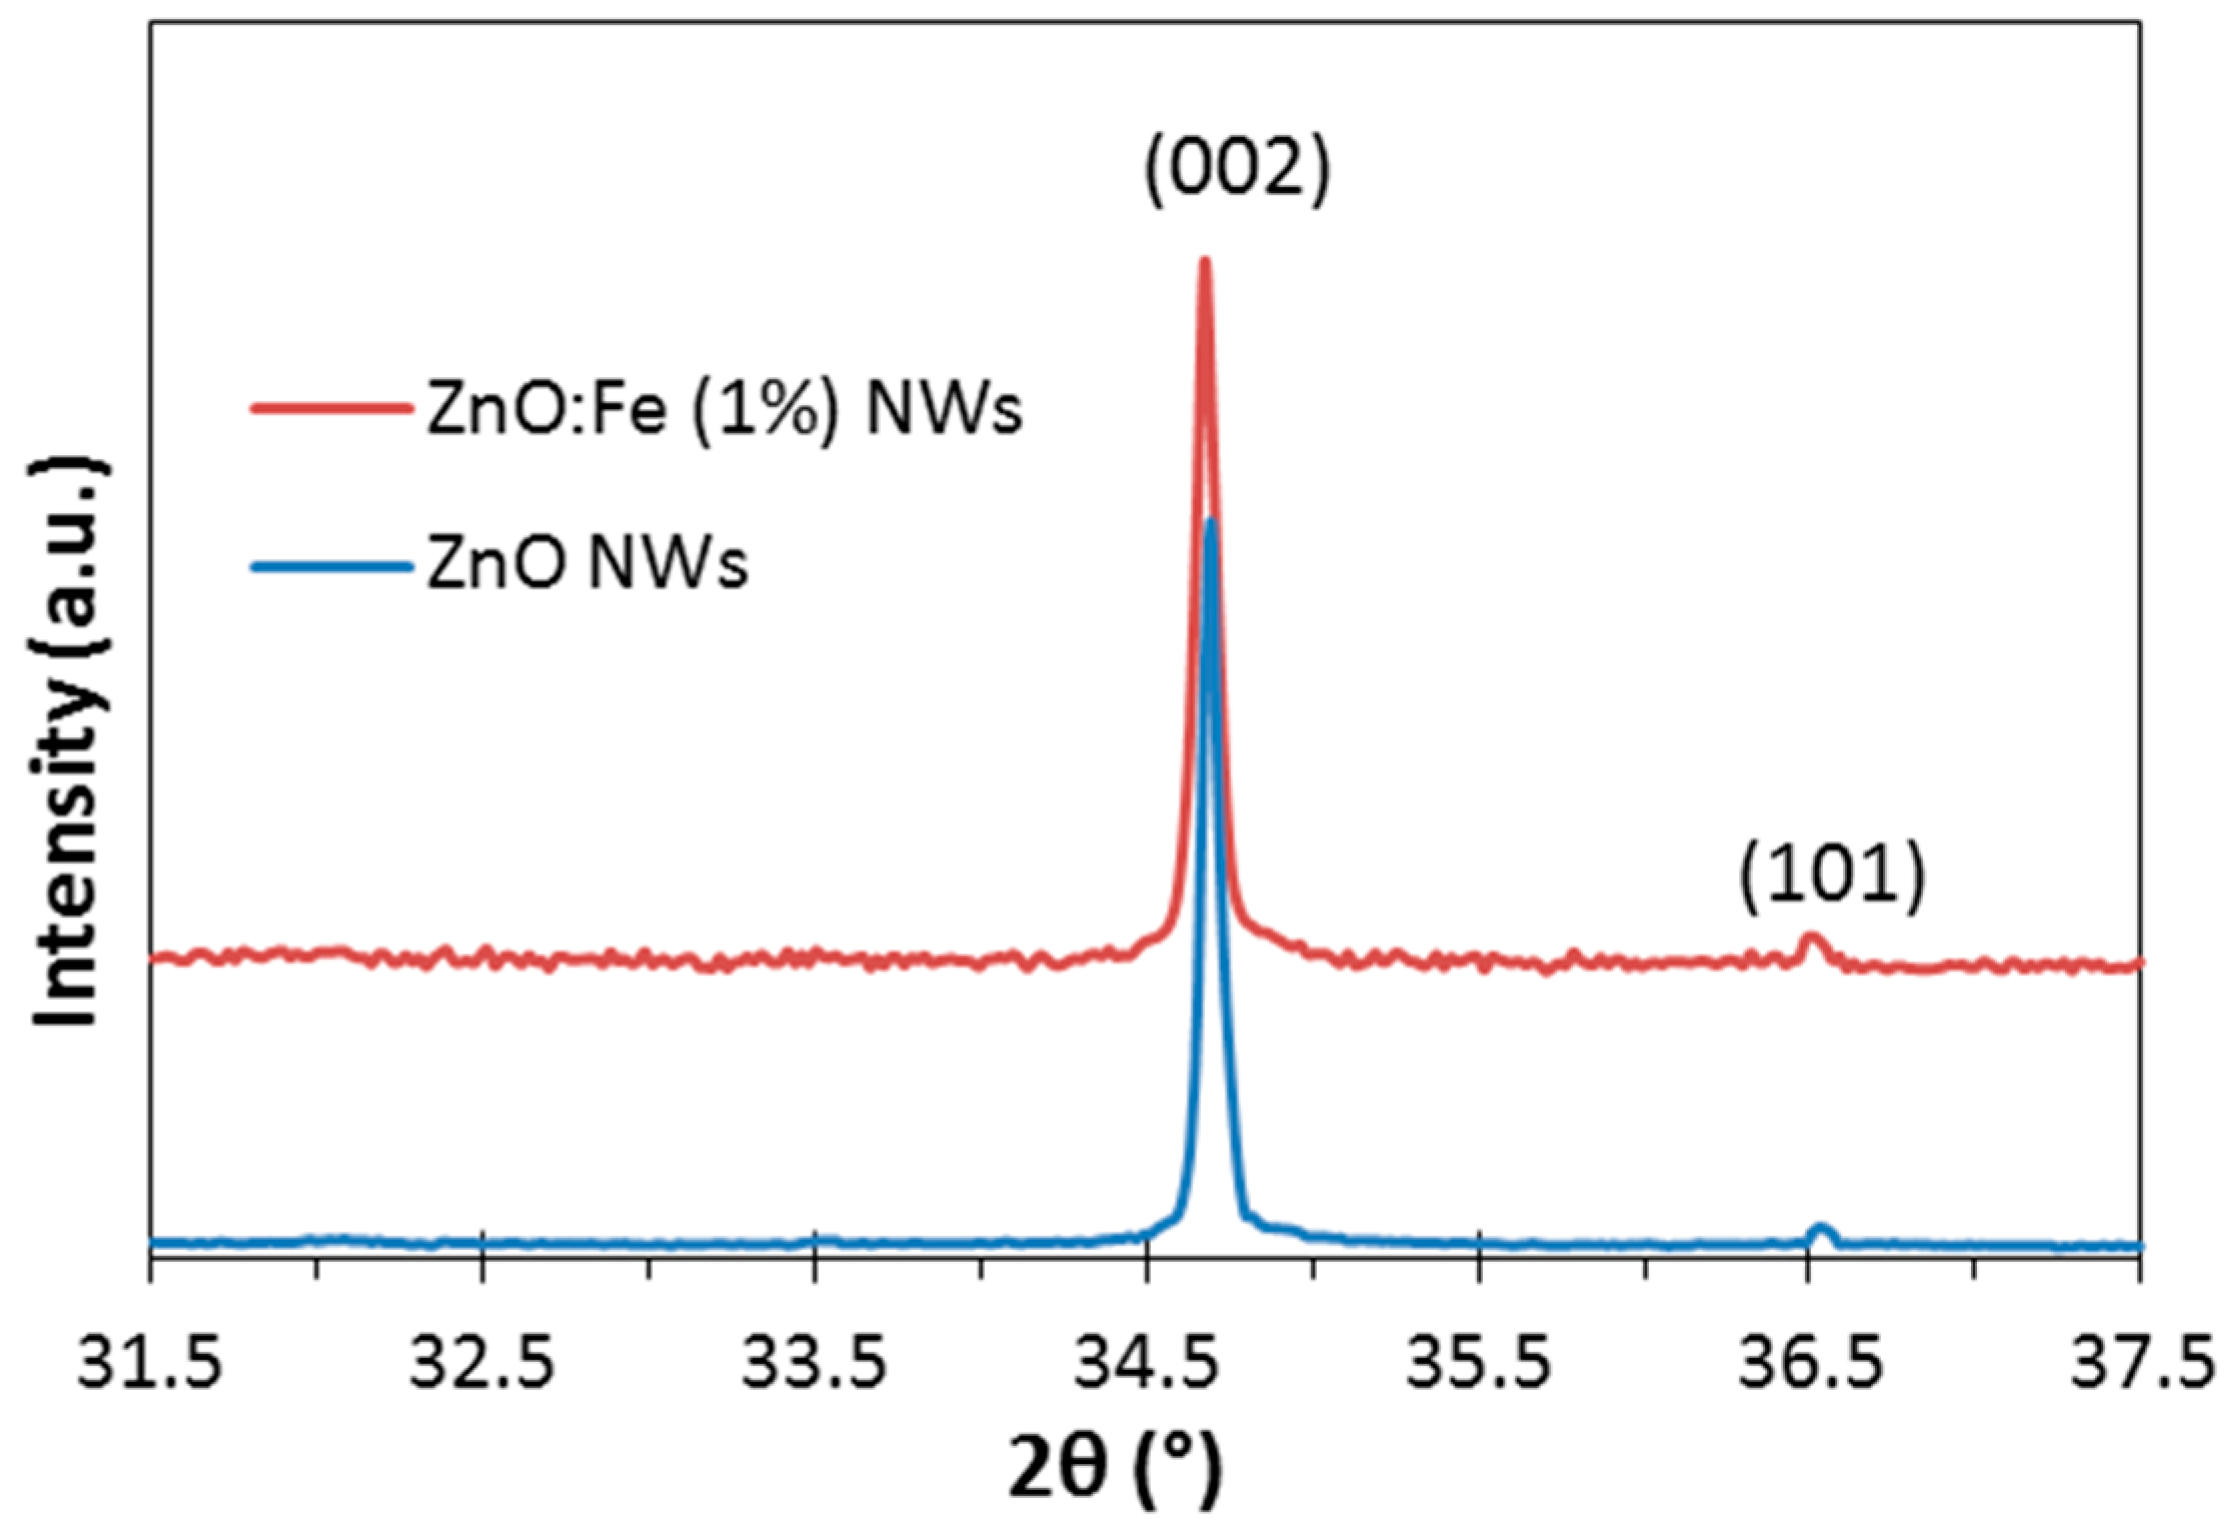
Figure 4.
(a) UV-Visible absorption spectra of undoped and Fe-doped ZnO NWs; (b) Tauc plot showing a narrowing of ZnO NWs band gap after iron doping.
Figure 4.
(a) UV-Visible absorption spectra of undoped and Fe-doped ZnO NWs; (b) Tauc plot showing a narrowing of ZnO NWs band gap after iron doping.

Figure 5.
Evolution of ZnO NWs photocatalysis UV-Vis absorption spectra of MB (a); MO (c) and AR14 (e); and of ZnO:Fe NWs photocatalysis UV-Vis absorption spectra of MB (b); MO (d) and AR14 (f).
Figure 5.
Evolution of ZnO NWs photocatalysis UV-Vis absorption spectra of MB (a); MO (c) and AR14 (e); and of ZnO:Fe NWs photocatalysis UV-Vis absorption spectra of MB (b); MO (d) and AR14 (f).
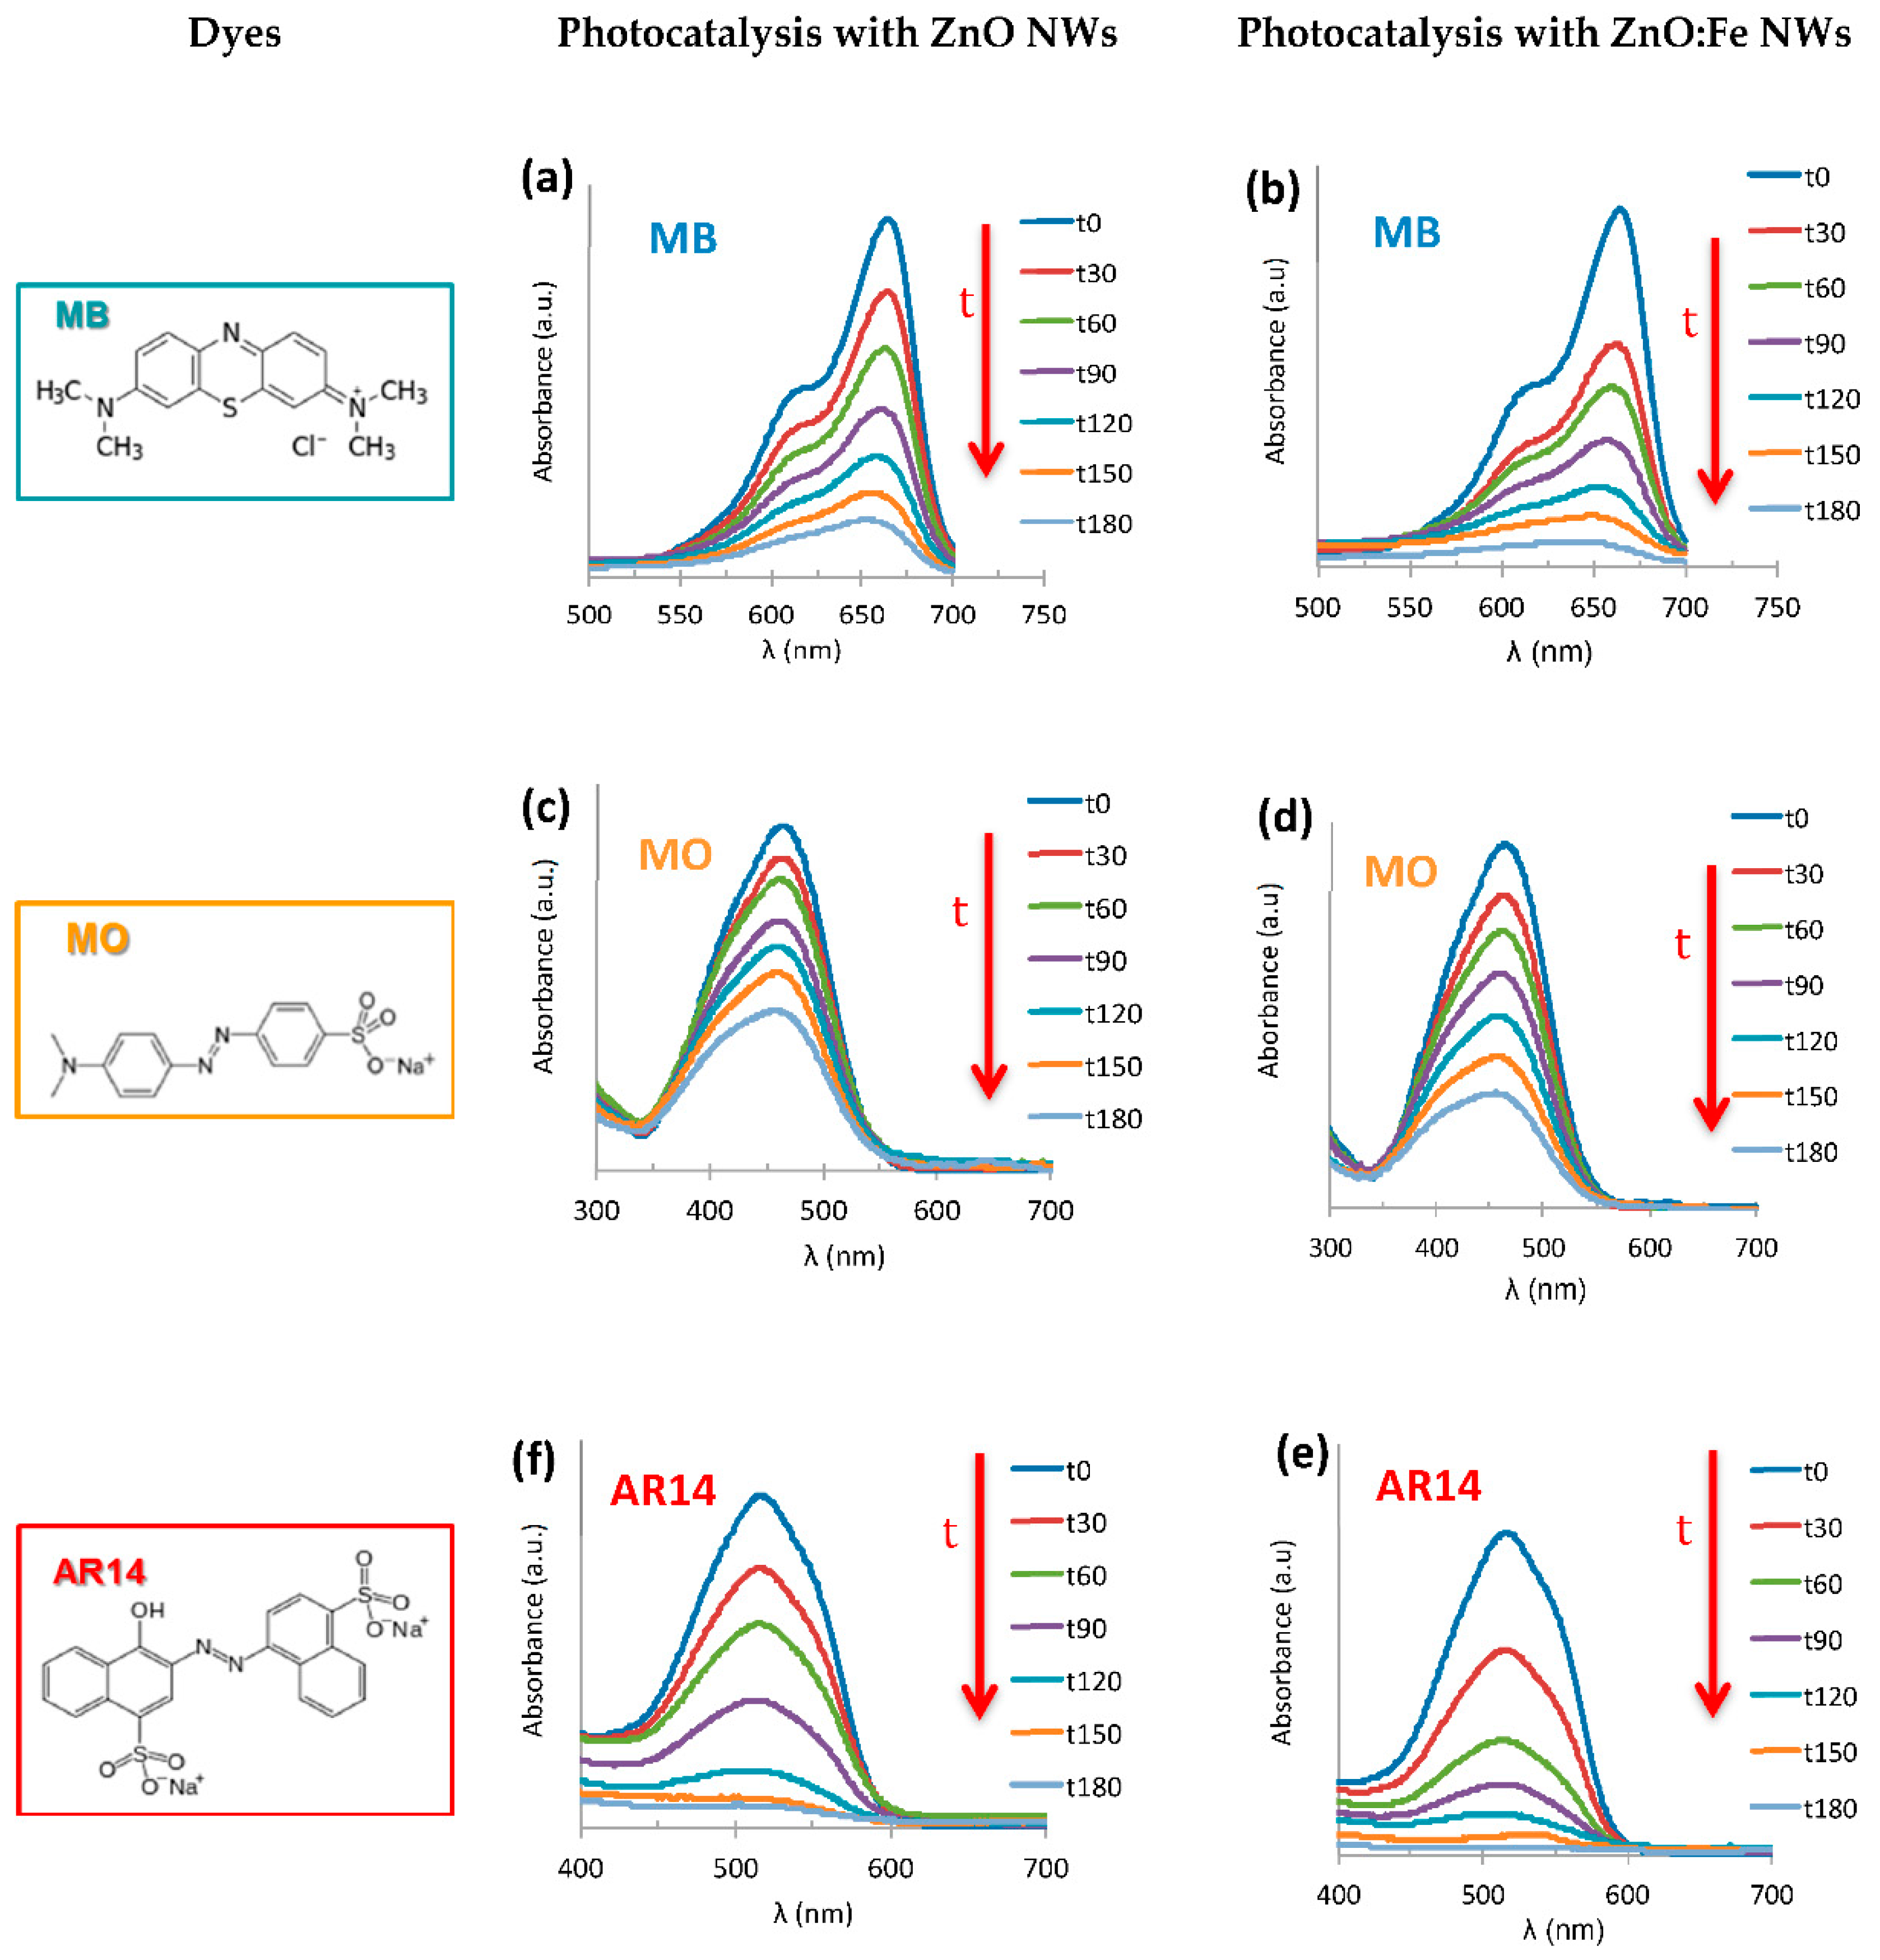
Figure 6.
Photo-degradation rate evolution of the dye solutions: methylene blue (MB) (a); methyl orange (MO) (b); acid red 14 (AR14) (c) by photocatalysis in the presence of ZnO:Fe NWs, ZnO NWs and without ZnO, respectively.
Figure 6.
Photo-degradation rate evolution of the dye solutions: methylene blue (MB) (a); methyl orange (MO) (b); acid red 14 (AR14) (c) by photocatalysis in the presence of ZnO:Fe NWs, ZnO NWs and without ZnO, respectively.

Figure 7.
Diagram describing the photocatalytic mechanism of the Fe-doped ZnO NWs.

Figure 8.
(a) Photoluminescence spectroscopy (PL) spectra of undoped ZnO NWs (blue curve) and Fe-doped ZnO NWs (red curve); (b,c) Visible emission band of PL spectrum and three Gaussian components G1 (green), G2 (yellow) and G3 (red) for ZnO NWs and ZnO:Fe NWs, respectively.
Figure 8.
(a) Photoluminescence spectroscopy (PL) spectra of undoped ZnO NWs (blue curve) and Fe-doped ZnO NWs (red curve); (b,c) Visible emission band of PL spectrum and three Gaussian components G1 (green), G2 (yellow) and G3 (red) for ZnO NWs and ZnO:Fe NWs, respectively.

Figure 9.
Intensity evolution of the various defect emissions in undoped and Fe-doped ZnO NWs.

© 2017 by the authors. Licensee MDPI, Basel, Switzerland. This article is an open access article distributed under the terms and conditions of the Creative Commons Attribution (CC BY) license (http://creativecommons.org/licenses/by/4.0/).
Share and Cite
MDPI and ACS Style
Habba, Y.G.; Capochichi-Gnambodoe, M.; Leprince-Wang, Y. Enhanced Photocatalytic Activity of Iron-Doped ZnO Nanowires for Water Purification. Appl. Sci. 2017, 7, 1185. https://doi.org/10.3390/app7111185
AMA Style
Habba YG, Capochichi-Gnambodoe M, Leprince-Wang Y. Enhanced Photocatalytic Activity of Iron-Doped ZnO Nanowires for Water Purification. Applied Sciences. 2017; 7(11):1185. https://doi.org/10.3390/app7111185
Chicago/Turabian StyleHabba, Yamina Ghozlane, Martine Capochichi-Gnambodoe, and Yamin Leprince-Wang. 2017. "Enhanced Photocatalytic Activity of Iron-Doped ZnO Nanowires for Water Purification" Applied Sciences 7, no. 11: 1185. https://doi.org/10.3390/app7111185
Note that from the first issue of 2016, this journal uses article numbers instead of page numbers. See further details here.