Numerical Characterisation of Active Drag and Lift Control for a Circular Cylinder in Cross-Flow


Department of Mechanical and Manufacturing Engineering, Parsons Building, Trinity College, Dublin 2, Ireland
*
Author to whom correspondence should be addressed.
Appl. Sci. 2017, 7(11), 1166; https://doi.org/10.3390/app7111166
Submission received: 11 September 2017
/
Revised: 31 October 2017
/
Accepted: 8 November 2017
/
Published: 13 November 2017
(This article belongs to the Special Issue Active Flow Control Technologies for Energy and Propulsive Systems)
Abstract
:Synthetic jet actuators have shown promise to control drag and lift for a bluff body in cross-flow. Using unsteady RANS CFD modelling, a significant modification of the drag coefficient for a circular cylinder in cross-flow at = 3900 is achieved by varying the actuation frequency. The variation in actuation frequency corresponds to a range in Stokes number of 2.4 < < 6.4. The trends in drag coefficient modification largely agree with the findings of past publications, achieving a maximum drag reduction at = 4.9 for a fixed jet Reynolds number of the synthetic jet of
= 12. A decrease in the adverse pressure gradient near the jet orifice correlated with a momentum increase in the viscous sublayer and stronger vortical structures at the rear of the cylinder. In these same conditions, a decrease in turbulence intensity was observed in the far field wake, which is a relevant finding in the context of wind and tidal turbine arrays.

1. Introduction
There is an increased drive among industries and policy makers to reduce the amount of carbon dioxide emissions using renewable energy sources and to improve the efficiency of current energy conversion processes. Evidence of this can be seen in the Clean Sky 2 program, an innovation program bringing together the European aviation industry and academia, to achieve 50% reduction in fuel consumption and carbon dioxide emissions by 2020 [1]. Renewable energy sources are increasingly coming to the fore as a means to cut carbon emissions; tidal energy could theoretically provide 1 TW of energy from the more accessible coastal regions [2]. Synthetic jet actuators can help provide potential gains, some marginal and some significant, in improving the efficiencies in both these areas. The outcomes of the present research may add to the progression and development of active flow control through the characterisation of the use of synthetic jet actuators for a cylinder in cross flow.
In recent years, synthetic jet actuators have proven to be useful devices for a wide range of flow control applications [3]. Synthetic jets have been implemented to enhance heat transfer through turbulent mixing [4] as well as being utilised to modify the boundary layer to notably increase lift and decrease drag forces experienced by a body [5]. Studies using NACA0015 aerofoils have achieved a 100% increase in lift and 26.5% decrease in the corresponding drag [6]. Other works have shown increases of 80% in lift as well as increasing the stall angle from 12° to 18° [7]. These changes in the performance of an aerofoil have significant implications on both the payload an aircraft can carry as well as its fuel economy. These optimum operating points are often characterised by a dimensionless actuation frequency (Equation (1)):
where is the jet actuation frequency, is a characteristic length scale (e.g., chord length) and is the freestream velocity.
Synthetic jet actuators are zero net mass flux devices that can alter lift and drag forces by modifying the boundary layer and wake for a body in cross-flow. Boundary layer modification by a synthetic jet emanating from a surface is achieved through a propagating train of vortices. These vortices are created by an oscillating diaphragm within a cavity inside the body [8,9]. As the fluid passes over the sharp edge of the orifice, the shear flow causes the fluid to roll up into a vortex [10]. If the diaphragm deflection amplitude is sufficiently large, the vortex separates from the orifice. On separation, the vortex ring moves with a near constant velocity in a direction perpendicular to its orifice exit plane (at least in quiescent fluid) as a result of the hydrodynamic impulse and thereby momentum is imparted on the surrounding fluid [11,12]. Due to the repeated oscillation of the diaphragm, vortices are ejected periodically from the orifice. Thus, a jet is ‘synthesized’ from the surrounding fluid, which imparts momentum to the boundary layer without adding net mass flux [10]. The physical behaviour of a synthetic jet actuator and its optimal design criteria can be described by lumped element or reduced-order models [4,13,14], using a combination of analytical modelling and empirical coefficients which can be determined through calibration [4]. In cross-flow, the synthetic jet alters the viscous sublayer passing over a body. This alteration modifies the location of the separation point on the surface of the body. By altering the separation point as well as the characteristics of the downstream wake, synthetic jet actuation allows for the lift and drag forces experienced by the object to be altered [10,15,16,17,18].
Another area of interest, other than flow around streamlined aerofoils, is how synthetic jets can alter flow around bluff bodies such as large pylons, e.g., onshore wind turbines, tidal turbine mounts or the risers used for offshore platforms, deep-water wind turbines or bridge sections [19,20,21]. Through periodic vortex shedding, unwanted vibrations can be induced in the structure that can ultimately lead to failure. Synthetic jet actuators could be used to alter the wake produced by a structure and hence reduce the magnitude and/or frequency that a structure oscillates at, hence decreasing the chance of failure. When turbines are implemented in arrays, the wake from one device can affect turbines positioned in its wake, causing a reduction in efficiency [22]. Synthetic jet actuators could be used to alter these wakes and thus increase the efficiency of the array or at least decrease the turbulence intensity experienced by a structure downstream.
Previous flow control work has predominantly focused on aerofoil geometries with air as the fluid. Recently, experimental investigations into active flow control for a circular cylinder in cross-flow have been conducted with water as the fluid, which have shown drag reductions of 20% to 29% [23,24]. Numerical approaches using large eddy simulation (LES) for active drag control for a two-dimensional cylinder in cross-flow by jet actuation have achieved drag reductions of 13%, as reported by Catalano et al. [25]. The optimum location of the synthetic jet orifice has been shown to be at a position perpendicular to the freestream [25]. Higher order methods such as the spectral element method are typically applied to direct numerical simulation (DNS) but have also been applied to LES [26]. More recently, spectral element or hp finite element methods have also been applied to more complex configurations [27,28]. The use of such methods allows for more accurate simulation of complete internal flows such as those of micropumps [28,29], which function similarly to synthetic jet actuators. In the present study, ANSYS Fluent will be used to conduct simulations. Currently, these higher order methods are unavailable for transient simulations in this commercial software package and therefore the unsteady Reynolds-averaged Navier-Stokes (URANS) computational fluid dynamics (CFD) approach with the transition shear stress transport (SST) turbulence model will be used instead, as described in more detail in Section 2. The numerical work presented here focuses on the effect of varying synthetic jet actuation frequency on drag and lift coefficients, pressure coefficient and the turbulence intensity in the wake of a circular cylinder in cross-flow.
2. Numerical Approach
The numerical model was developed using a combination of ANSYS Component System ICEM and ANSYS Fluent for the case of flow around a circular cylinder. Due to limitations of the commercial software, no higher order methods could be used for a time-marching solution. Computational grids for two geometries were developed; flow around a cylinder of diameter mm (Figure 1) and flow around the same cylinder with a cavity embedded within the body and a mm wide rectangular orifice located at the top of the cylinder perpendicular to the freestream (Figure 2). The cylinder and orifice dimensions were identical to those used in a water tunnel experiment in the research group [23]. As the periodic vortex shedding from the cylinder and the operation of a synthetic jet was time dependent, a time marching solution was applied.
An unsteady RANS simulation approach was implemented using the transition SST turbulence model as closure. The model preforms well at predicting the behaviour of turbulent shear flows, such as those found in the wake of a cylinder where periodic vortex shedding has been established. Yet the model performs poorly when dealing with adverse pressure gradients, such as those found after the separation point on the surface of a cylinder in cross-flow [30]. For a more accurate flow behaviour in the boundary layer, the model can be used. This model has proved reliable in the modelling of two-dimensional boundary layers with both adverse and favourable pressure gradients, decelerating and accelerating flow, making it more appropriate when dealing with separated flows [30,31]. One drawback of the model is its inability to resolve unsteady turbulent structures and free shear flows, such as those found in jets [32]. The transition SST model combines aspects of these two models and is better adapted at dealing with the flow regimes associated with a cylinder in cross-flow. This is achieved by utilising the model in regions close to the wall boundary and the model in the regions away from the wall. It is also more suitable for modelling free shear layers associated with separated wakes and jets [33]. Out of most common RANS turbulence models, the SST model has been shown to achieve vortex-shedding Strouhal numbers closest to those obtained through LES [34].
The semi-implicit method for pressure-linked equations (SIMPLE) scheme was used for the pressure-velocity coupling. The discretised momentum and pressure correction equations are solved implicitly, whereas the velocity correction is solved explicitly, thus resulting in a semi-implicit method. Second order upwind spatial discretisation was used for all variables, in combination with the least square cell-based method for the gradients.
Through an iterative design process (Table 1), a computational grid was constructed with results that are independent of the mesh density. For two-dimensional simulations, the expected drag coefficient RMS lift coefficient and vortex shedding Strouhal number are well established, with respective values of 1.74, 1.42 and 0.26 for flow around a cylinder at a Reynolds number = 3900 [25,35]. The works of Beaudan and Moin [35] and Catalano et al. [25] were conducted using DNS and LES, respectively, for a 19-mm diameter cylinder and freestream velocity of 0.296 m/s. To attain the same for the 20-mm diameter cylinder in the present study, the freestream velocity at the inlet is set to a 0.312 m/s. For all cases (both actuated and unactuated), the turbulence intensity at the velocity inlet is set to 5%. The computational grid has been refined until the numerical model achieved results sufficiently close to those reported in literature (see Table 2), using , , and the coefficient of pressure at the rear of the cylinder as reference values. Utilising the URANS approach with the transition SST turbulence model allowed for savings in both computational time and solution file size. A time step of 0.1 ms was used to ensure a Courant-Friedrichs-Lewy (CFL) condition of less than unity.
The final computational grid contains 253,000 elements. The inclusion of the synthetic jet cavity and orifice further increased the total number of elements to 333,000. The density of the mesh was highest at the synthetic jet orifice and cavity, as well as at the surface of the cylinder. The mesh density was increased here to capture the small-scale vortical structures accurately. The mean aspect ratio of the mesh was 6.6, with a mean quality of 0.997. The dimensionless size of the first cell layer near the wall () did not exceed 1.0. A structured mesh was used to minimise computational time. The grid was aligned parallel to the freestream flow away from the cylinder surface and aligned with the cylinder surface in an O-grid structure close to the cylinder surface (Figure 3). In this way, all elements in these regions are orientated in the general direction of the flow. By aligning the orientation of the grid with the flow in that region, the risk of false diffusion when using the upwind scheme can be eliminated and a more physically accurate solution is obtained [36].
Upon achieving a computational grid capable of producing accurate results for a cylinder in cross-flow at = 3900, the synthetic jet actuator geometry was incorporated into the design (Figure 3). Previous research by Catalano et al. [25] excluded the synthetic jet cavity and orifice. Instead, a velocity inlet boundary condition was applied to a 0.135 mm section of the cylinder surface to act as a synthetic jet orifice outlet. By using an alternating velocity inlet boundary condition on the surface of the cylinder, as opposed to modelling an actual cavity and orifice, a realistic synthetic jet would be unable to form. In the absence of an orifice and internal cavity, the flow separation near the sharp orifice edge would not lead to a realistic vortex formation [10]. The inclusion of the fluid-filled cavity and orifice (see Figure 2 and Figure 3) allows for a more accurate modelling of synthetic jet formation. To verify the performance of the present numerical model, the computational grid with the inclusion of the cavity and orifice was compared with the work of Holman et al. [37], which focused on the formation criterion for synthetic jets in quiescent flow.
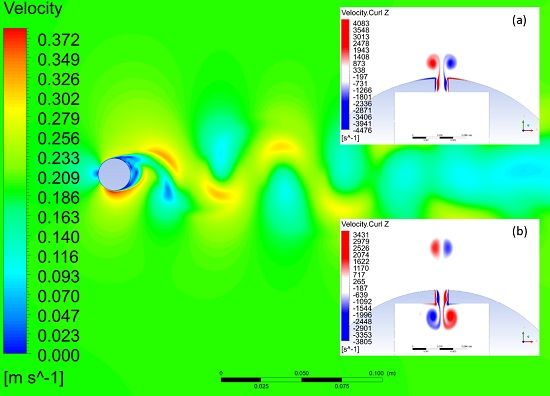
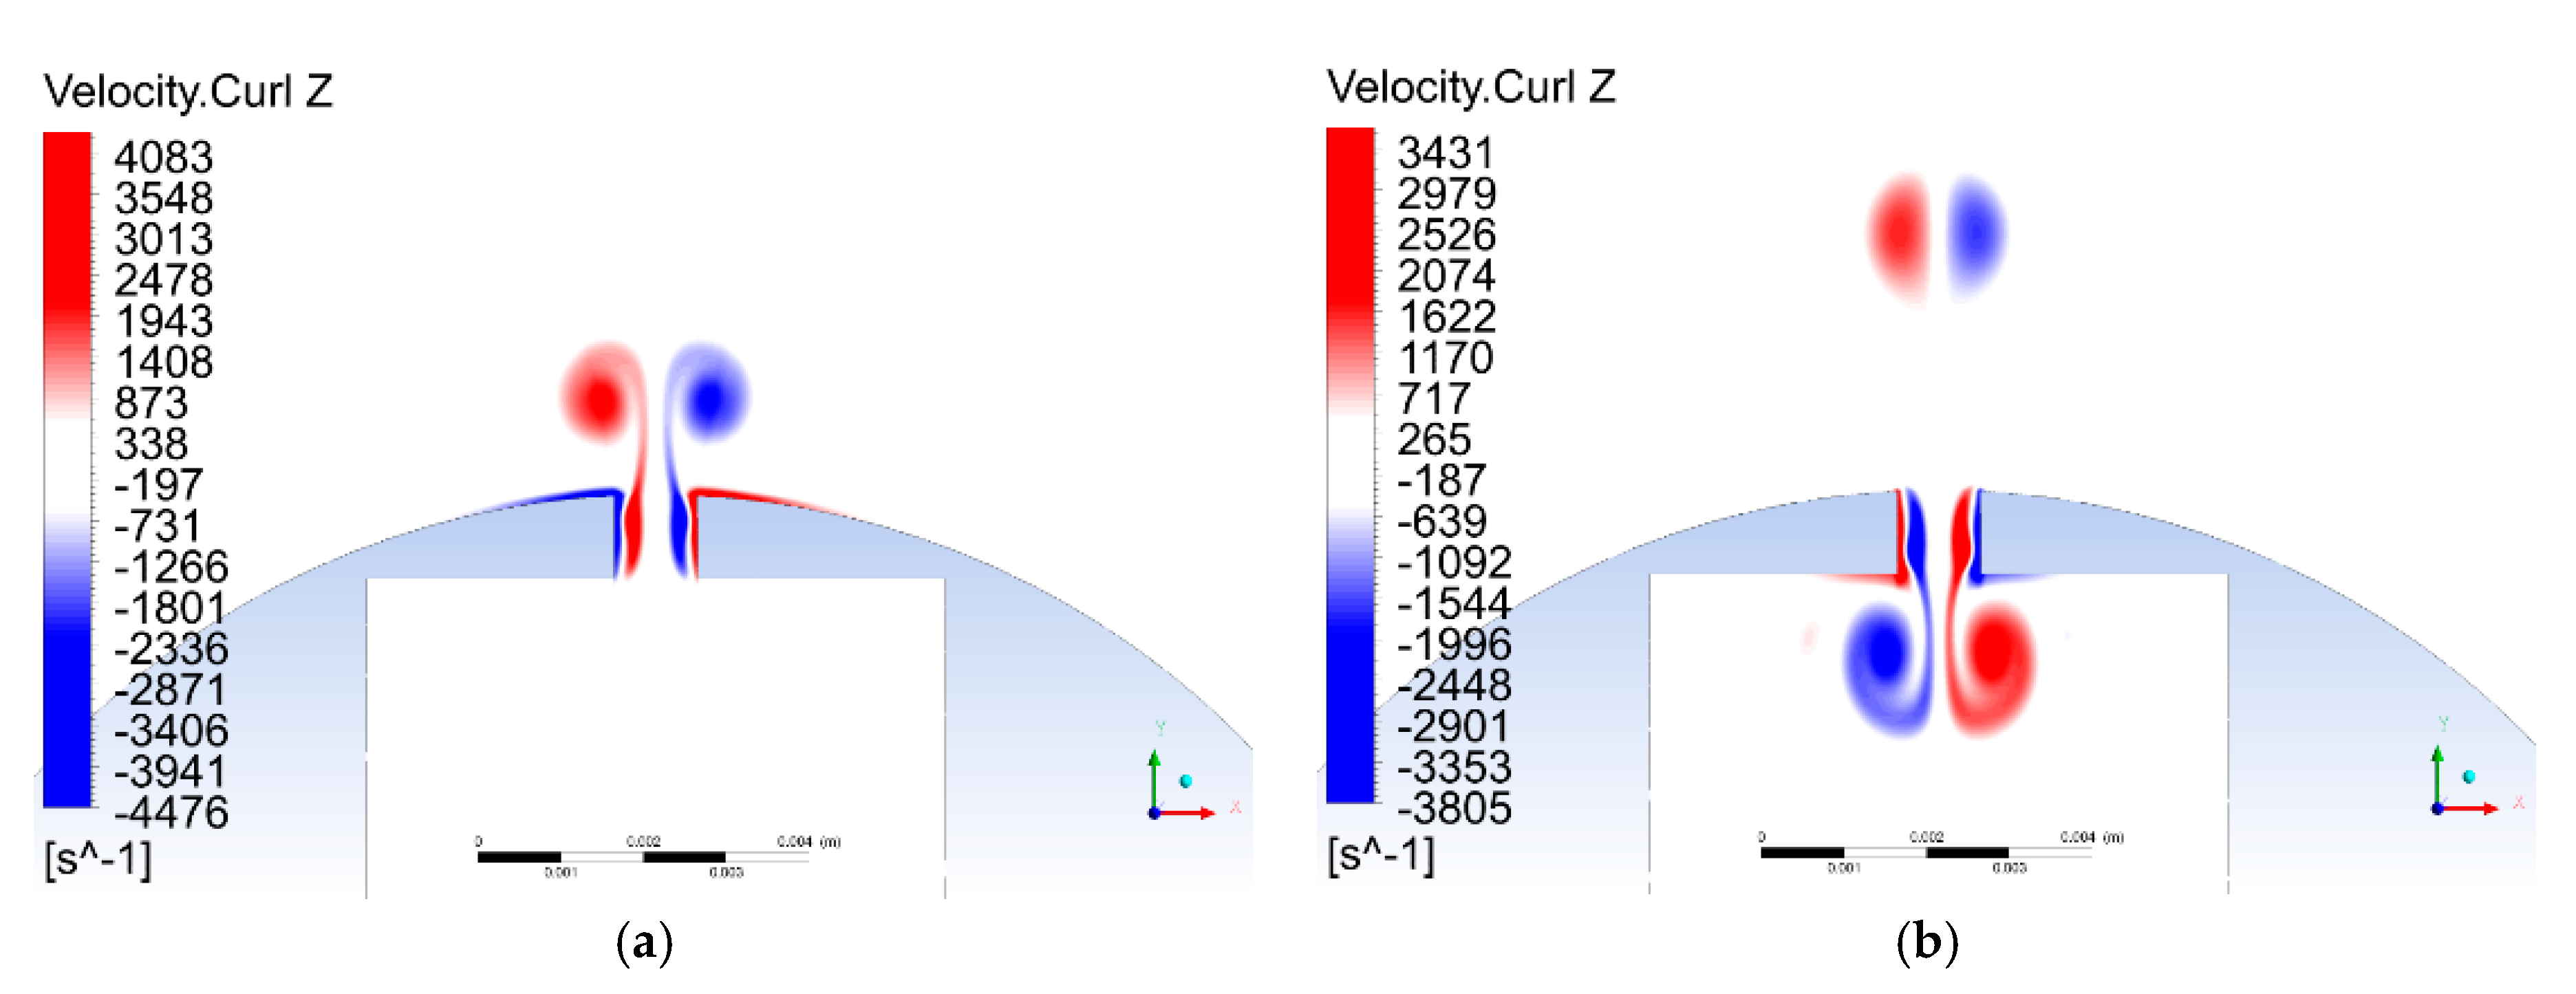
Quiescent flow simulations were conducted with the present model at a jet Reynolds number of 190, 255 and 479 and a fixed jet Stokes number of = 15.8. Figure 4a shows how the vortex sheets produced at the orifice roll up during the blowing phase. When the vortical structures are strong enough to avoid re-entrainment into the cavity during the suction phase, the pair of counter-rotating vortices propagates away from the orifice and moves with a near constant velocity in a direction perpendicular to the plane of the orifice (Figure 4b). During the suction phase, a new vortical structure forms within the internal cavity and the process repeats itself. Subsequent periodic ejections of vortices from the orifice ultimately lead to a train of counter-rotating vortices and, after some periods, establish the fully formed synthetic jet flow field, including the internal flow dynamics within the cavity and orifice.
Once the numerical model was shown to capture the formation of a synthetic jet, the operation of the actuation device in cross-flow was considered. A ‘pseudo diaphragm’ was used in the form of a velocity inlet boundary condition, located at the base of the cavity with a user-defined function (UDF) to produce the appropriate oscillating velocity (Equation (2)):
where is the peak velocity at the orifice, represents time and the factor 10 is the ratio of the diaphragm cross-sectional area to the orifice cross-sectional area.
To verify the numerical model, the jet operating conditions (summarized in Table 3) are based on the jet Strouhal number , Stokes number and Reynolds number , as used in the work of Catalano et al. [25]. All three dimensionless numbers are set to produce comparable synthetic jets, in spite of differing cavity and orifice geometries for actuation devices [38] and are defined by Equations (3)–(6). The synthetic jet orifice used by Catalano et al. [25] has a width of mm, driven at frequencies between 50 Hz and 360 Hz. For the present study, a 1 mm wide synthetic jet orifice is used. To achieve the same values for , and as Catalano et al. [25], the synthetic jet is operated at lower actuation frequencies, between 0.9 Hz and 6.6 Hz. It should be noted that the work of Catalano et al. [25] used a velocity inlet boundary condition at the orifice, without internal cavity flow; hence, no realistic roll up of vortical structures would occur. The addition of the fluid-filled cavity and orifice in the present study should allow for more accurate modelling as actual vortical structures were produced.
Despite the present study and the work of Catalano et al. [25] being carried out at the same freestream Reynolds number, the two cases use different dimensionless actuation frequencies . For the present study, ranges from 0.05 to 0.42, whereas the values for Catalano et al. [25] range from 3.2 to 23.1. This is due to the different jet orifice sizes. It was decided to fix , and at identical values to yield an appropriate comparison between cylinders at the same freestream Reynolds number, similar outer diameter and freestream velocity but having different synthetic jet orifice sizes. All three of these values (, and ) are fixed, as opposed to only fixing the dimensionless actuation frequency , as done in other studies [3,6,16,17].
3. Results and Discussion
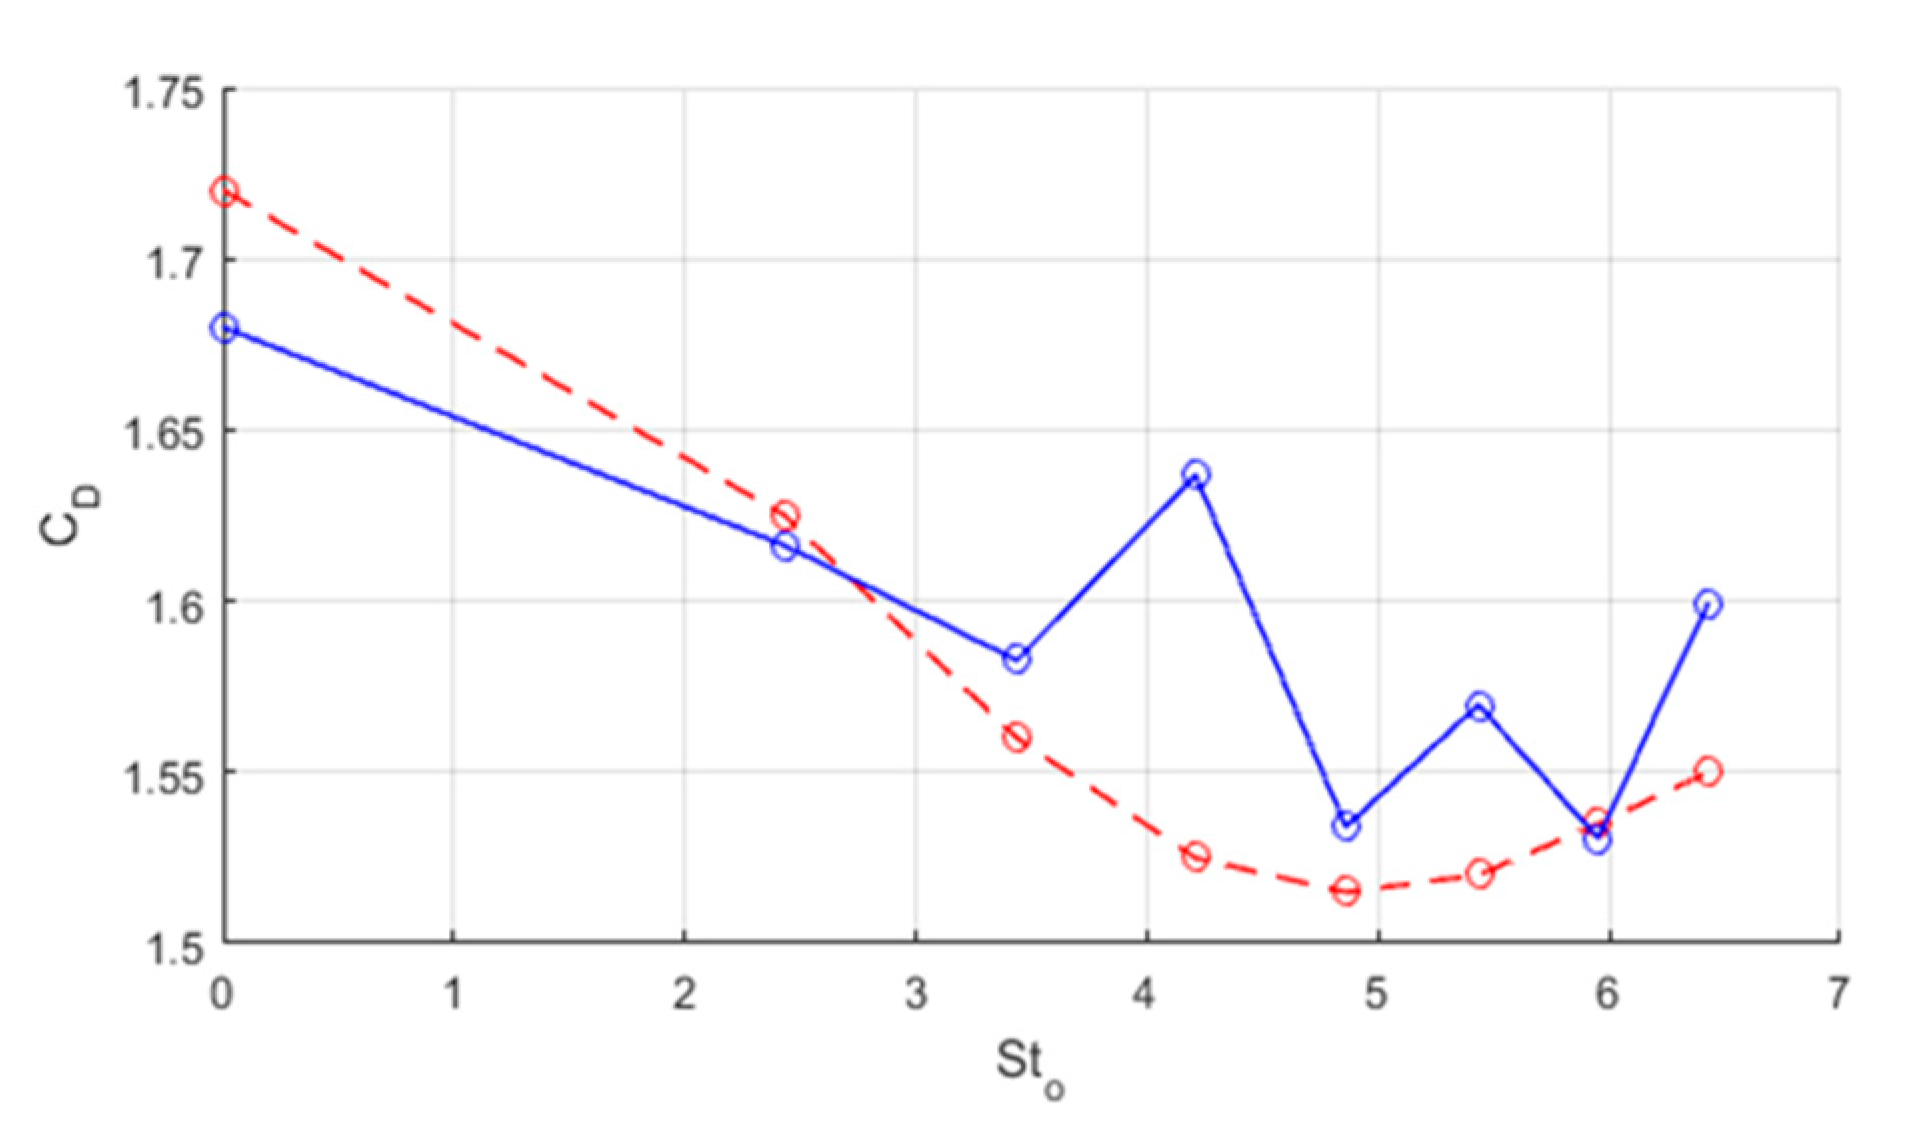
The work of Catalano et al. [25] at = 3900 was used as a reference for the synthetic jet operating parameters of the present study. To the best of the authors’ knowledge, there are no DNS results or other LES simulation results available in the scientific literature for the case of a cylinder in cross-flow with the inclusion of a synthetic jet actuator. The results of Catalano et al. [25] for a synthetic jet orifice located at to the freestream flow were not presented specifically for that location, but rather in a three-dimensional surface plot. The results for the drag coefficient against orifice location and actuation frequency were inferred from these results (Figure 5). To produce the same jet Strouhal number , Stokes number and Reynolds number , the pseudo diaphragm for the present study was driven at frequencies between 0.9 and 6.7 Hz, at similar conditions to Catalano et al. [25]. At these frequencies, a similar overall modification trend was observed, with decreasing overall from a jet Stokes number = 2.43 to 4.86 and then increasing again from = 4.86 to 6.43 (see Figure 5). However, a noticeable deviation from the results presented by Catalano et al. [25] was observed at = 4.21. For this case, the pseudo diaphragm was driven at a frequency of 2.83 Hz, the same frequency as the natural shedding of vortices from the cylinder in cross-flow. This deviation from the overall trend could be the result of a weak feedback loop [39] between the synthetic jet frequency and the cylinder’s vortex shedding frequency. Operating at frequencies from 50 to 360 Hz, Catalano et al. [25] would have been well beyond the vortex shedding frequency and thus no feedback loop would be present.
It should be recalled that the results of Catalano et al. [25] were produced with an alternating velocity inlet boundary condition on the surface of the cylinder. The absence of internal vortex formation within the cavity could be an additional reason for the deviation between the results of Catalano et al. [25] and those of the present study in certain cases (Figure 5).
The root-mean-squared lift coefficient experienced by the cylinder was also altered by the variation of synthetic jet actuation frequency. The trend in the drag coefficient due to increasing the actuation frequency closely matched the modification in RMS lift coefficient (Figure 6). However, the same level of agreement in the and trends was not observed in experimental measurements in comparable conditions [23,24] and was not presented in other numerical studies [25].
Time averaging of the near field and far field of the cylinder was carried out to identify why the values of the drag coefficient and RMS lift coefficient were modified. The averaging was carried out over three vortex shedding cycles, capturing the shedding of six vortices from the cylinder. A sampling rate of 33 Hz was used, since it was found that further increasing this sampling rate yielded no change in values. Near-field locations of interest were: (i) the stagnation point at the front of the cylinder ( = 0); (ii) the top and bottom separation points and ; (iii) and the angle between these two separation points (Figure 7). The position of a stagnation point was determined by examination of the pressure on the surface of the cylinder. To determine the point at which flow separates from the cylinder, the wall shear stress was used to calculate the dimensionless skin friction as . The two separation points are determined by the location where the skin friction equals zero. Both surface pressure and wall shear stress were recorded at 1016 locations on the surface of the cylinder, allowing for sufficiently accurate positioning. Looking first at the stagnation point on the surface of the cylinder, there was small change in position and only a slight variation in pressure, = 22.6 Pa with a standard deviation of = 0.1 Pa. Thus, the effect of the synthetic jet is weak at this location (), far upstream of the synthetic jet orifice.
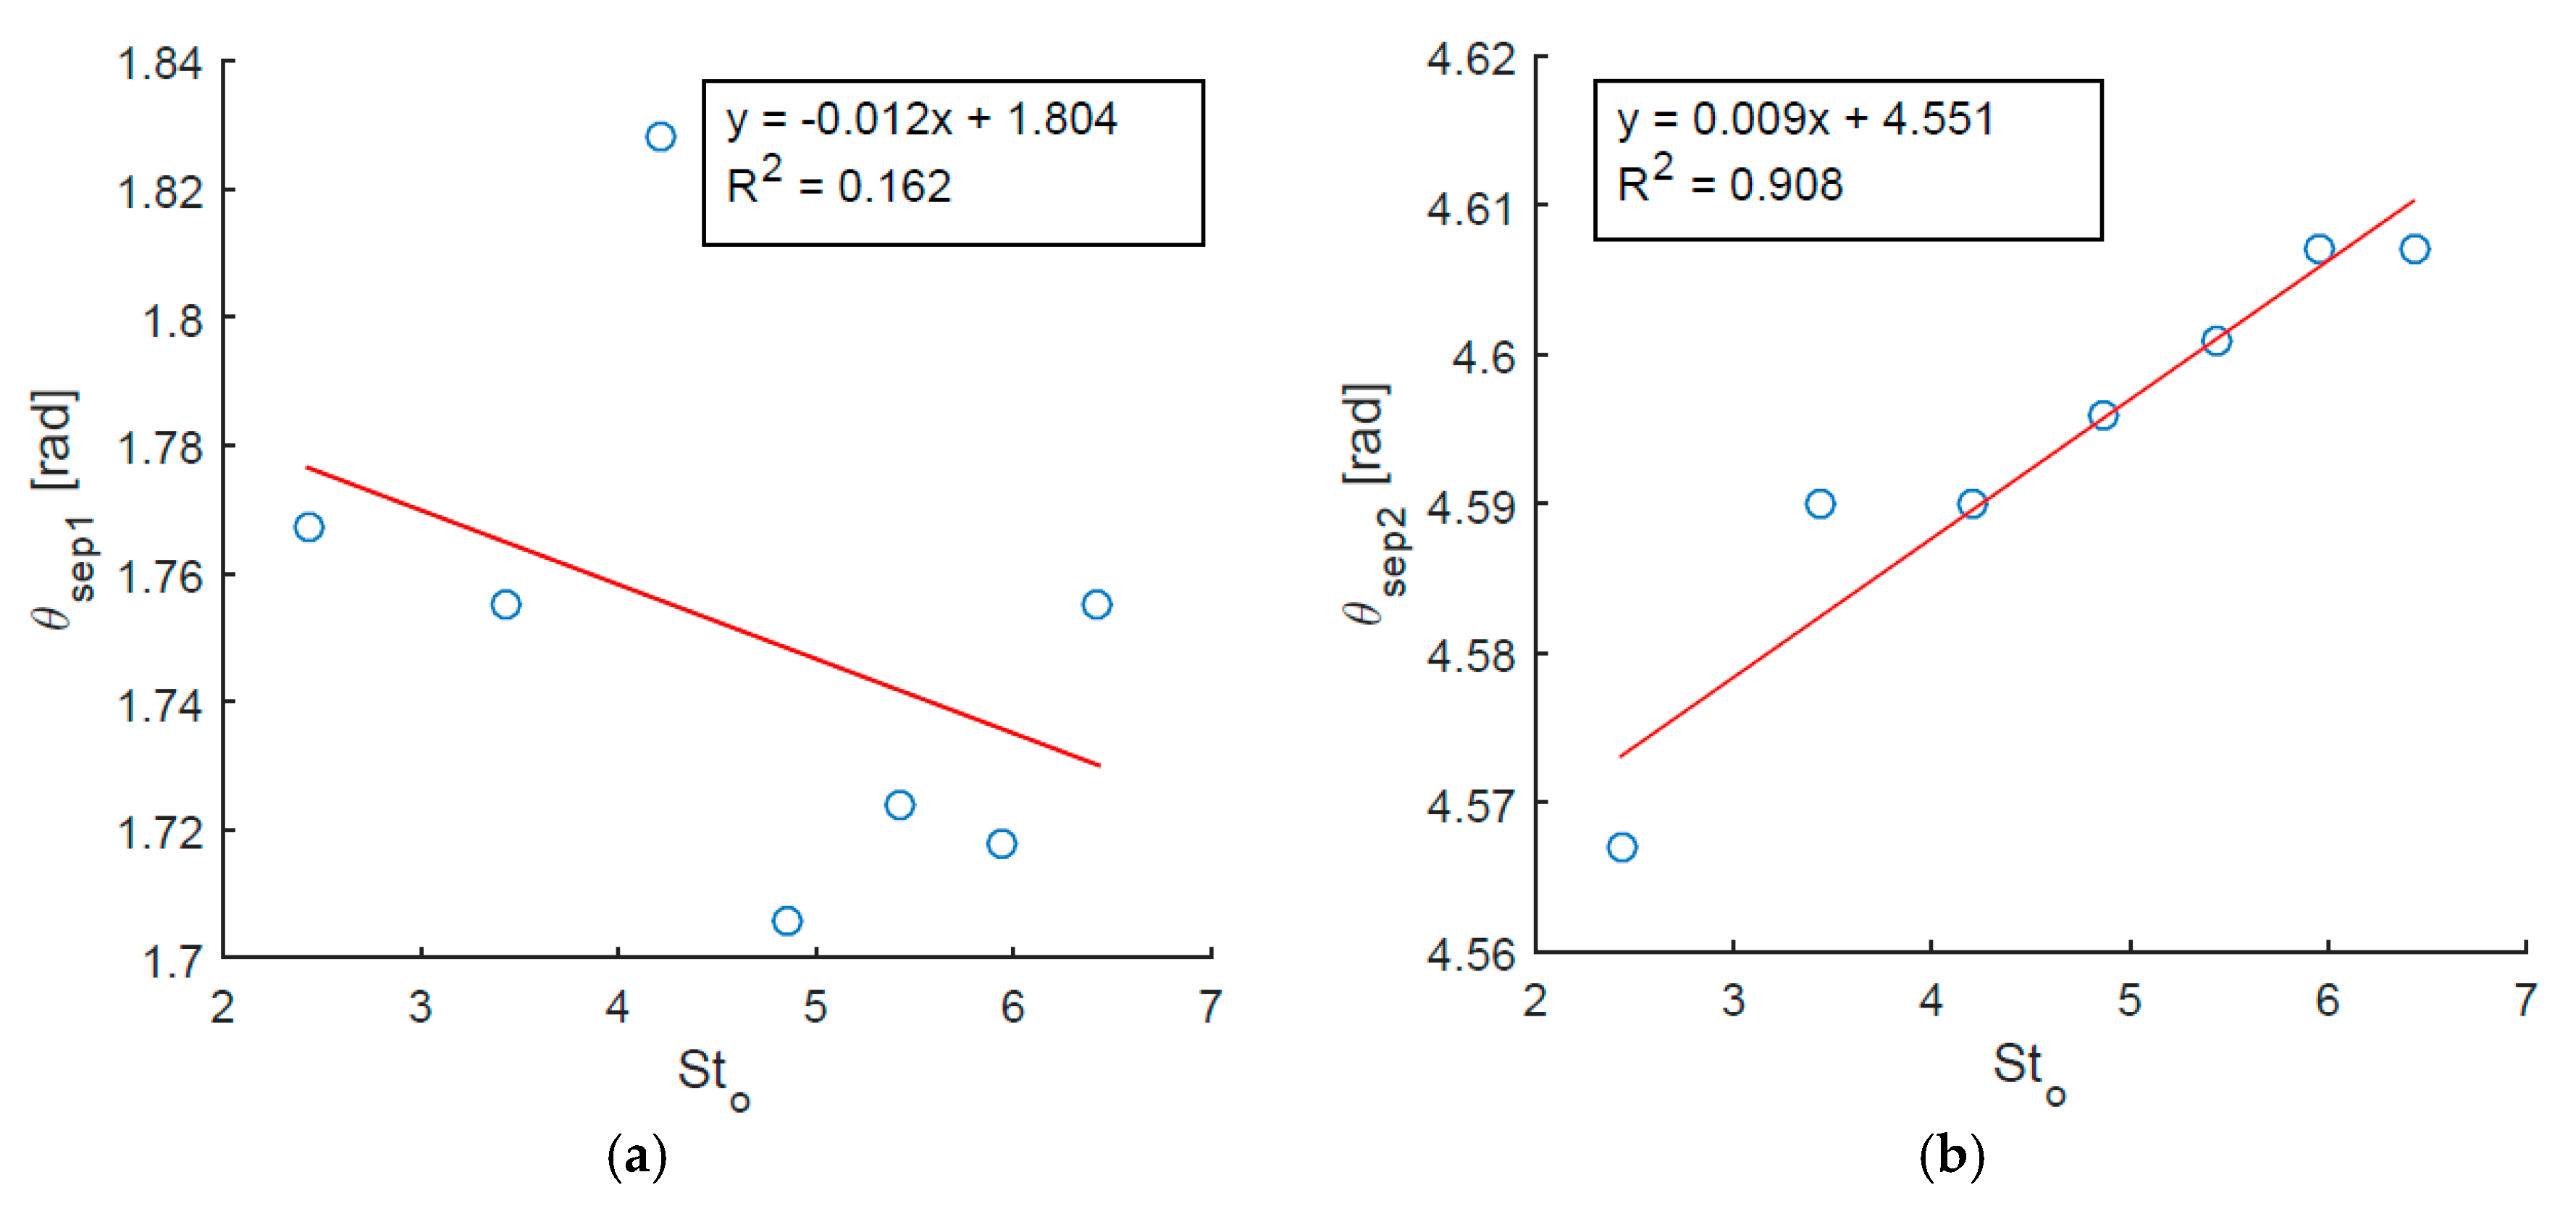
For the case of an aerofoil, it has been shown that synthetic jet actuation can delay separation and hence reduce drag [10,15,16,17,18]. For the present case, the positions of the top and bottom separation points and repond differently as the actuation frequency is varied. The top separation point location is only weakly correlated to an increase in actuation frequency (Figure 8a). For all cases, separation occurs downstream of the synthetic jet orifice, which is located at a fixed position of = 1.57 rad. Thus, the actuator is always acting on decelerating flow that has not yet separated, although subjected to an adverse pressure gradient. However, for the bottom separation point—located on the opposite side to the synthetic jet orifice—a strong correlation is found between the actuation frequency and the separation point location, as evidenced by a high coefficient of determination R2 = 0.908 in Figure 8b. The higher the actuation frequency, the more the bottom separation point moves downstream, towards the rear of the cylinder (Figure 8b).
Although the top separation point location is only weakly correlated to the actuation frequency, a strong correlation is observed between the top separation point location and the drag force. When flow separation occurs closer to the front of the cylinder (and hence closer to the synthetic jet orifice), the drag force on the cylinder is lower (Figure 9a). In the investigated range, the top separation point location varies by 0.12 rad (7°), whereas the bottom separation point varies by only 0.04 rad (2°). Conversely, the bottom separation point location is only weakly correlated with the drag force (Figure 9b).
While the bottom separation point location shows a clear linear dependence on actuation frequency, this is much less pronounced for the top separation point. As such, the angle between the separation points is also just weakly correlated with the actuation frequency (Figure 10a). A stronger relationship is observed between and the drag force (R2 = 0.931). As increases, the drag force decreases (Figure 10b). This contrasts the known relationship between the separation point and drag for aerofoils, where delaying separation results in a drag reduction [10,15,16,17,18].
Ultimately, the modification in drag coefficient is the result of a changing surface pressure distribution. Since the drag force integration contains (Equation (7)), any negative pressure between =/2 and 3/2 gives a positive force in the direction. The drag force per meter span is given by:
A strong correlation is observed between the drag and the minimum pressure over the rear half of the cylinder (Figure 11a). As this pressure decreases, the drag increases.
The near-wall turbulent kinetic energy directly at the rear of the cylinder () has been monitored. As before, averaging was carried out over three vortex shedding cycles at a sampling rate of 33 Hz. This was done to determine how the jet operating conditions altered the turbulence intensity (Equations (8) and (9)) and if indeed any correlation exists between the turbulence intensity and the drag coefficient . The turbulent quantities are defined as follows:
where represents the standard deviation of the flow velocity and is the mean flow velocity, with subscripts , and denoting the three spatial directions. is the turbulent kinetic energy obtained from the two-dimensional CFD calculation.
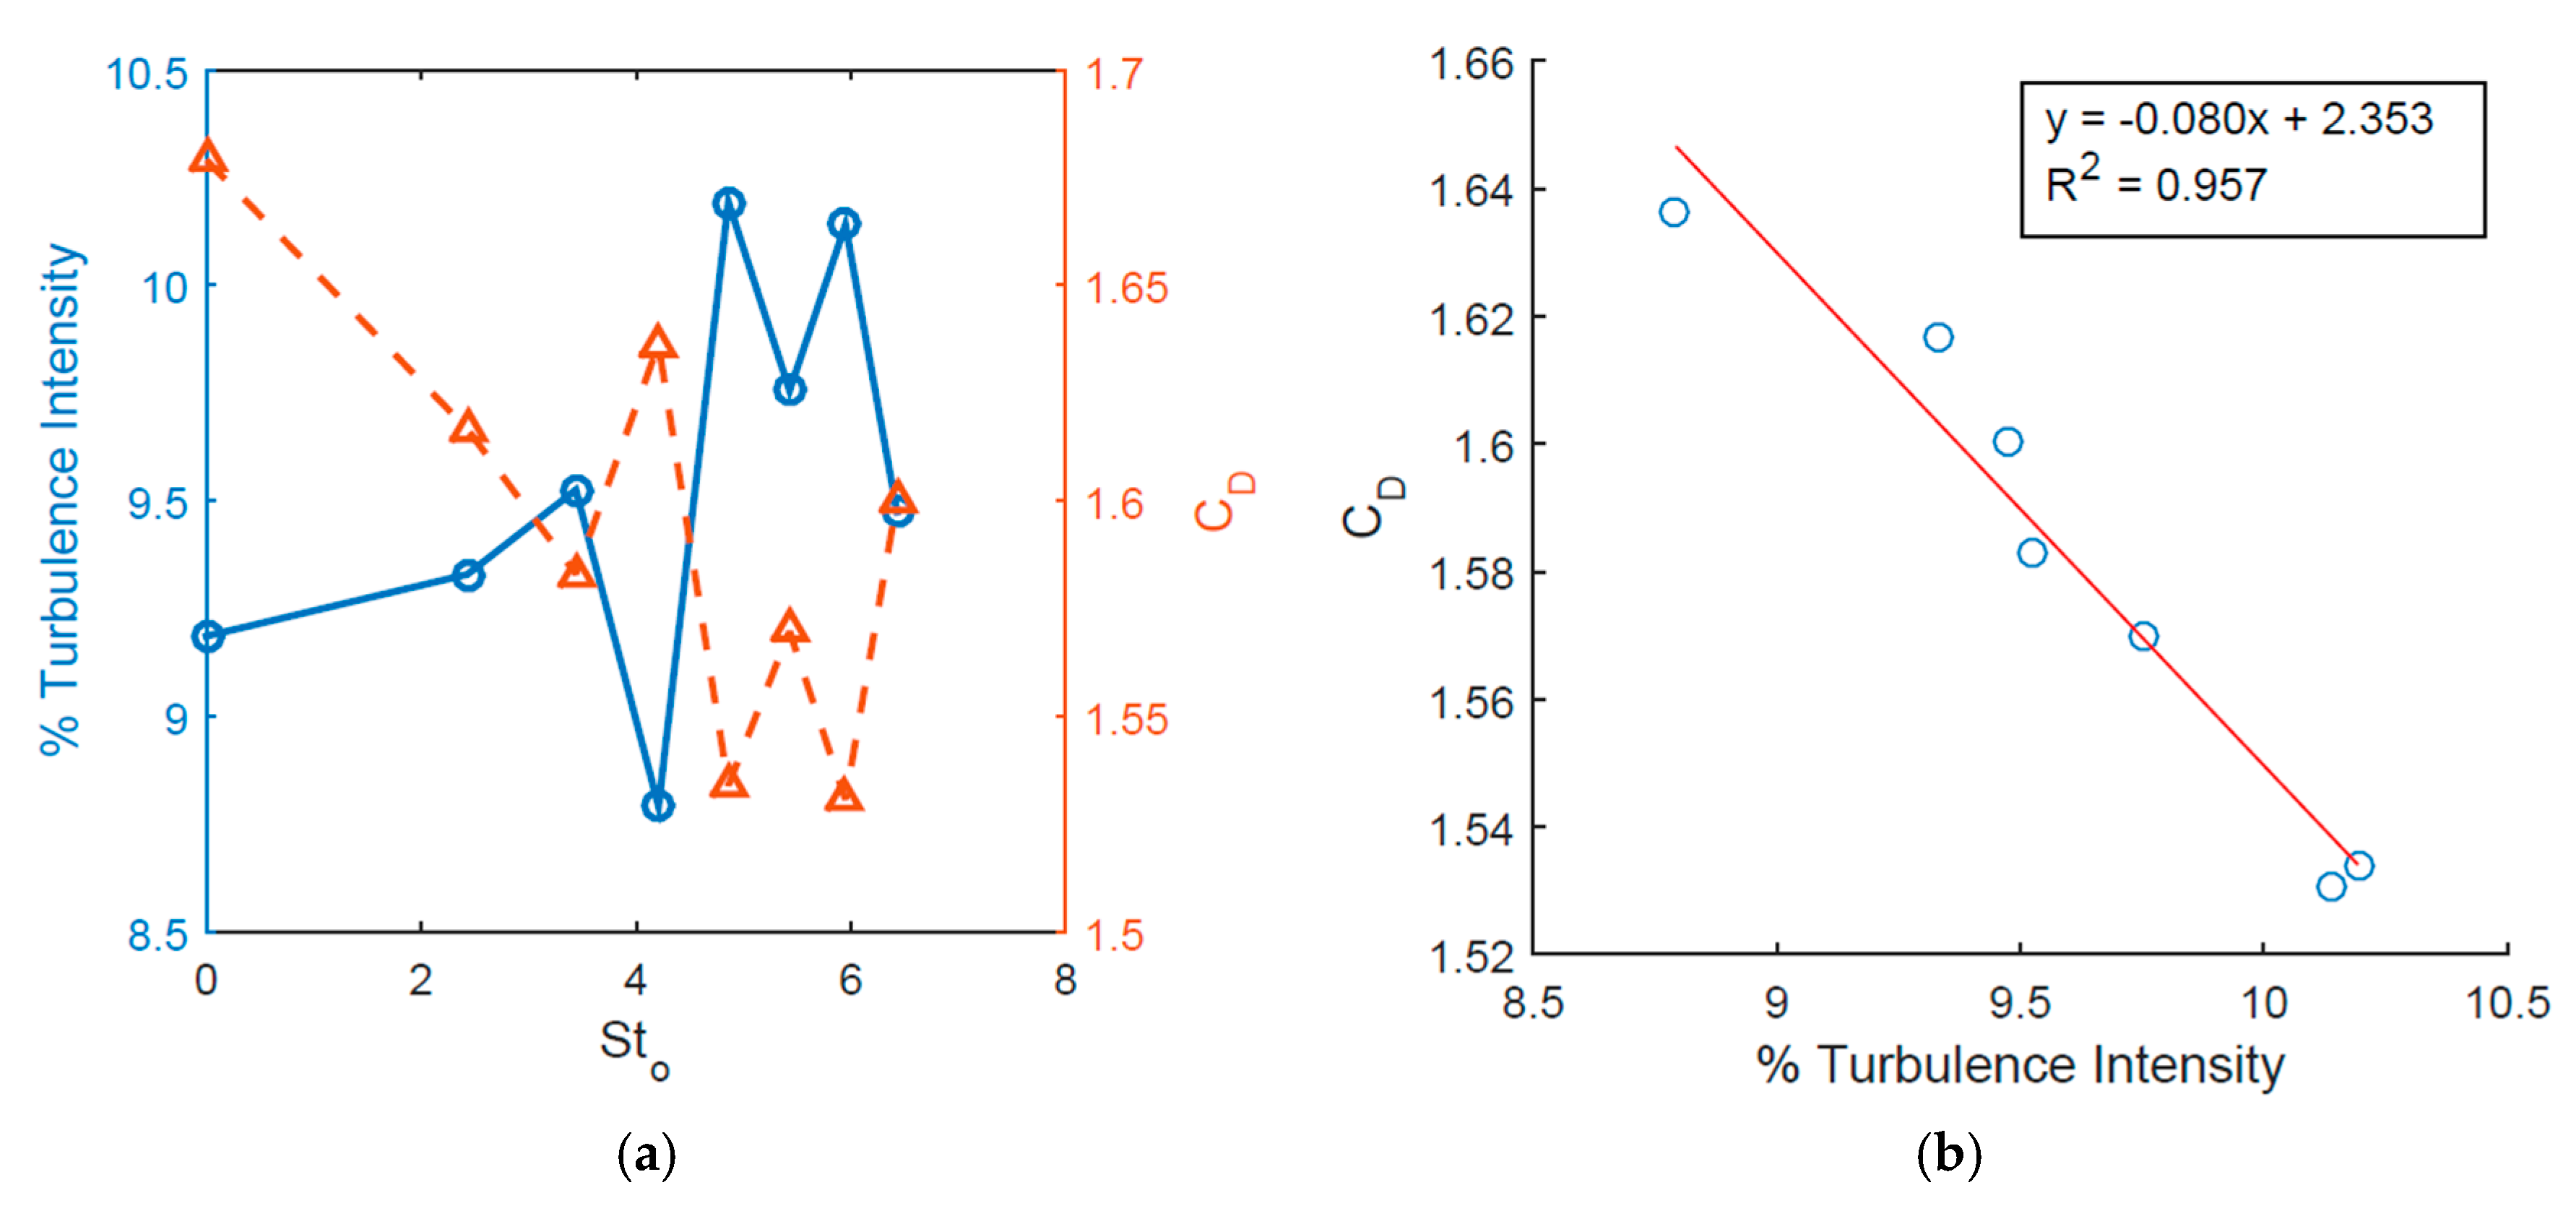
This relationship between turbulence intensity at the rear of the cylinder and the drag coefficient is found to be particularly strong (Figure 12b). For all actuated and unactuated cases, whenever the turbulence intensity at increases, there is a corresponding decrease in the drag coefficient (Figure 12a). This suggests that high momentum fluid is being injected into the near-wall sections of the boundary layer, which is in agreement with other studies [9,40]. It is worth noting that the freestream turbulence intensity applied at the velocity inlet boundary condition is fixed at 5% in the present study, in contrast to Morenko and Fedyaey [41] who varied the inlet turbulence intensity to investigate its effect on the lift and drag force on a circular cylinder in cross-flow.
During the suction phase, retarding flow would be accelerated towards the orifice and entrained into the cavity with higher momentum fluid in the freestream outside the viscous sublayer being drawn into the boundary layer. During the ejection phase, further momentum is added to the retarding viscous sublayer. As previously discussed, the synthetic jet orifice for all cases modelled was upstream of the separated flow region. This means that the synthetic jet would be operating in a region with an adverse pressure gradient and so an increase in momentum would be indicated by a decrease in the magnitude of this adverse pressure gradient across the jet orifice.
A positive correlation is found between the reduction in magnitude of the surface pressure gradient across the orifice (at ) and the turbulence intensity (at ). The perceived link between the two variables is most pronounced at the higher end of the frequency range under investigation, from a jet Stokes number between 4.2 and 6.4. Where the pressure gradient magnitude across the orifice decreases, a higher turbulent intensity is observed at the rear of the cylinder, suggesting agreement with other published results [9,40] on the advantageous increase in momentum of the fluid downstream of the orifice, thus modifying (Figure 13a).
Exactly how these mechanisms affect the surface pressure coefficient can be seen more readily upon closer inspection of Figure 13 and Figure 14. Since the stagnation pressure remains unchanged across the range of actuation frequencies, a direct comparison of plots can be carried out. Comparing two cases of jet Stokes number = 2.43 and 4.86 (Figure 14), the corresponding increase in turbulence intensity from 9.4% to 10.2% appears to transform the pressure distribution, decreasing the magnitude of all maxima and minima of (Figure 14). It appears that the bulk of the drag reduction is due to the reduction in the pressure magnitude between and and hence the reduction in the positive force in the direction (Equation (7)). It is interesting to note the asymmetry when comparing the = 2.43 case (Figure 14a) with the = 4.86 case (Figure 14b). The asymmetry of the time-averaged results offers little correlation between the degree of asymmetry and the drag reduction; only the decrease in the pressure magnitude accounts for this reduction.
The downstream flow domain was observed from the lee of the cylinder at a distance ranging from zero to 16 diameters (16) downstream. For the spatial averaging aspect, the properties of the flow domain were recorded along a series of lines extending in the direction and spaced 2D apart from 0 to 16 from the lee of the cylinder. As previously mentioned, the turbulence intensity at the freestream velocity inlet was fixed at 5%. How the turbulence intensity downstream of the cylinder varies with actuation frequency can provide valuable information for wind or tidal turbine arrays, particularly if the jet operating conditions that yield the minimum drag coefficient and RMS lift coefficient values were to have a negative effect at far field downstream locations, e.g. in the form of increased turbulence intensity. This turns out not to be the case, as described below.
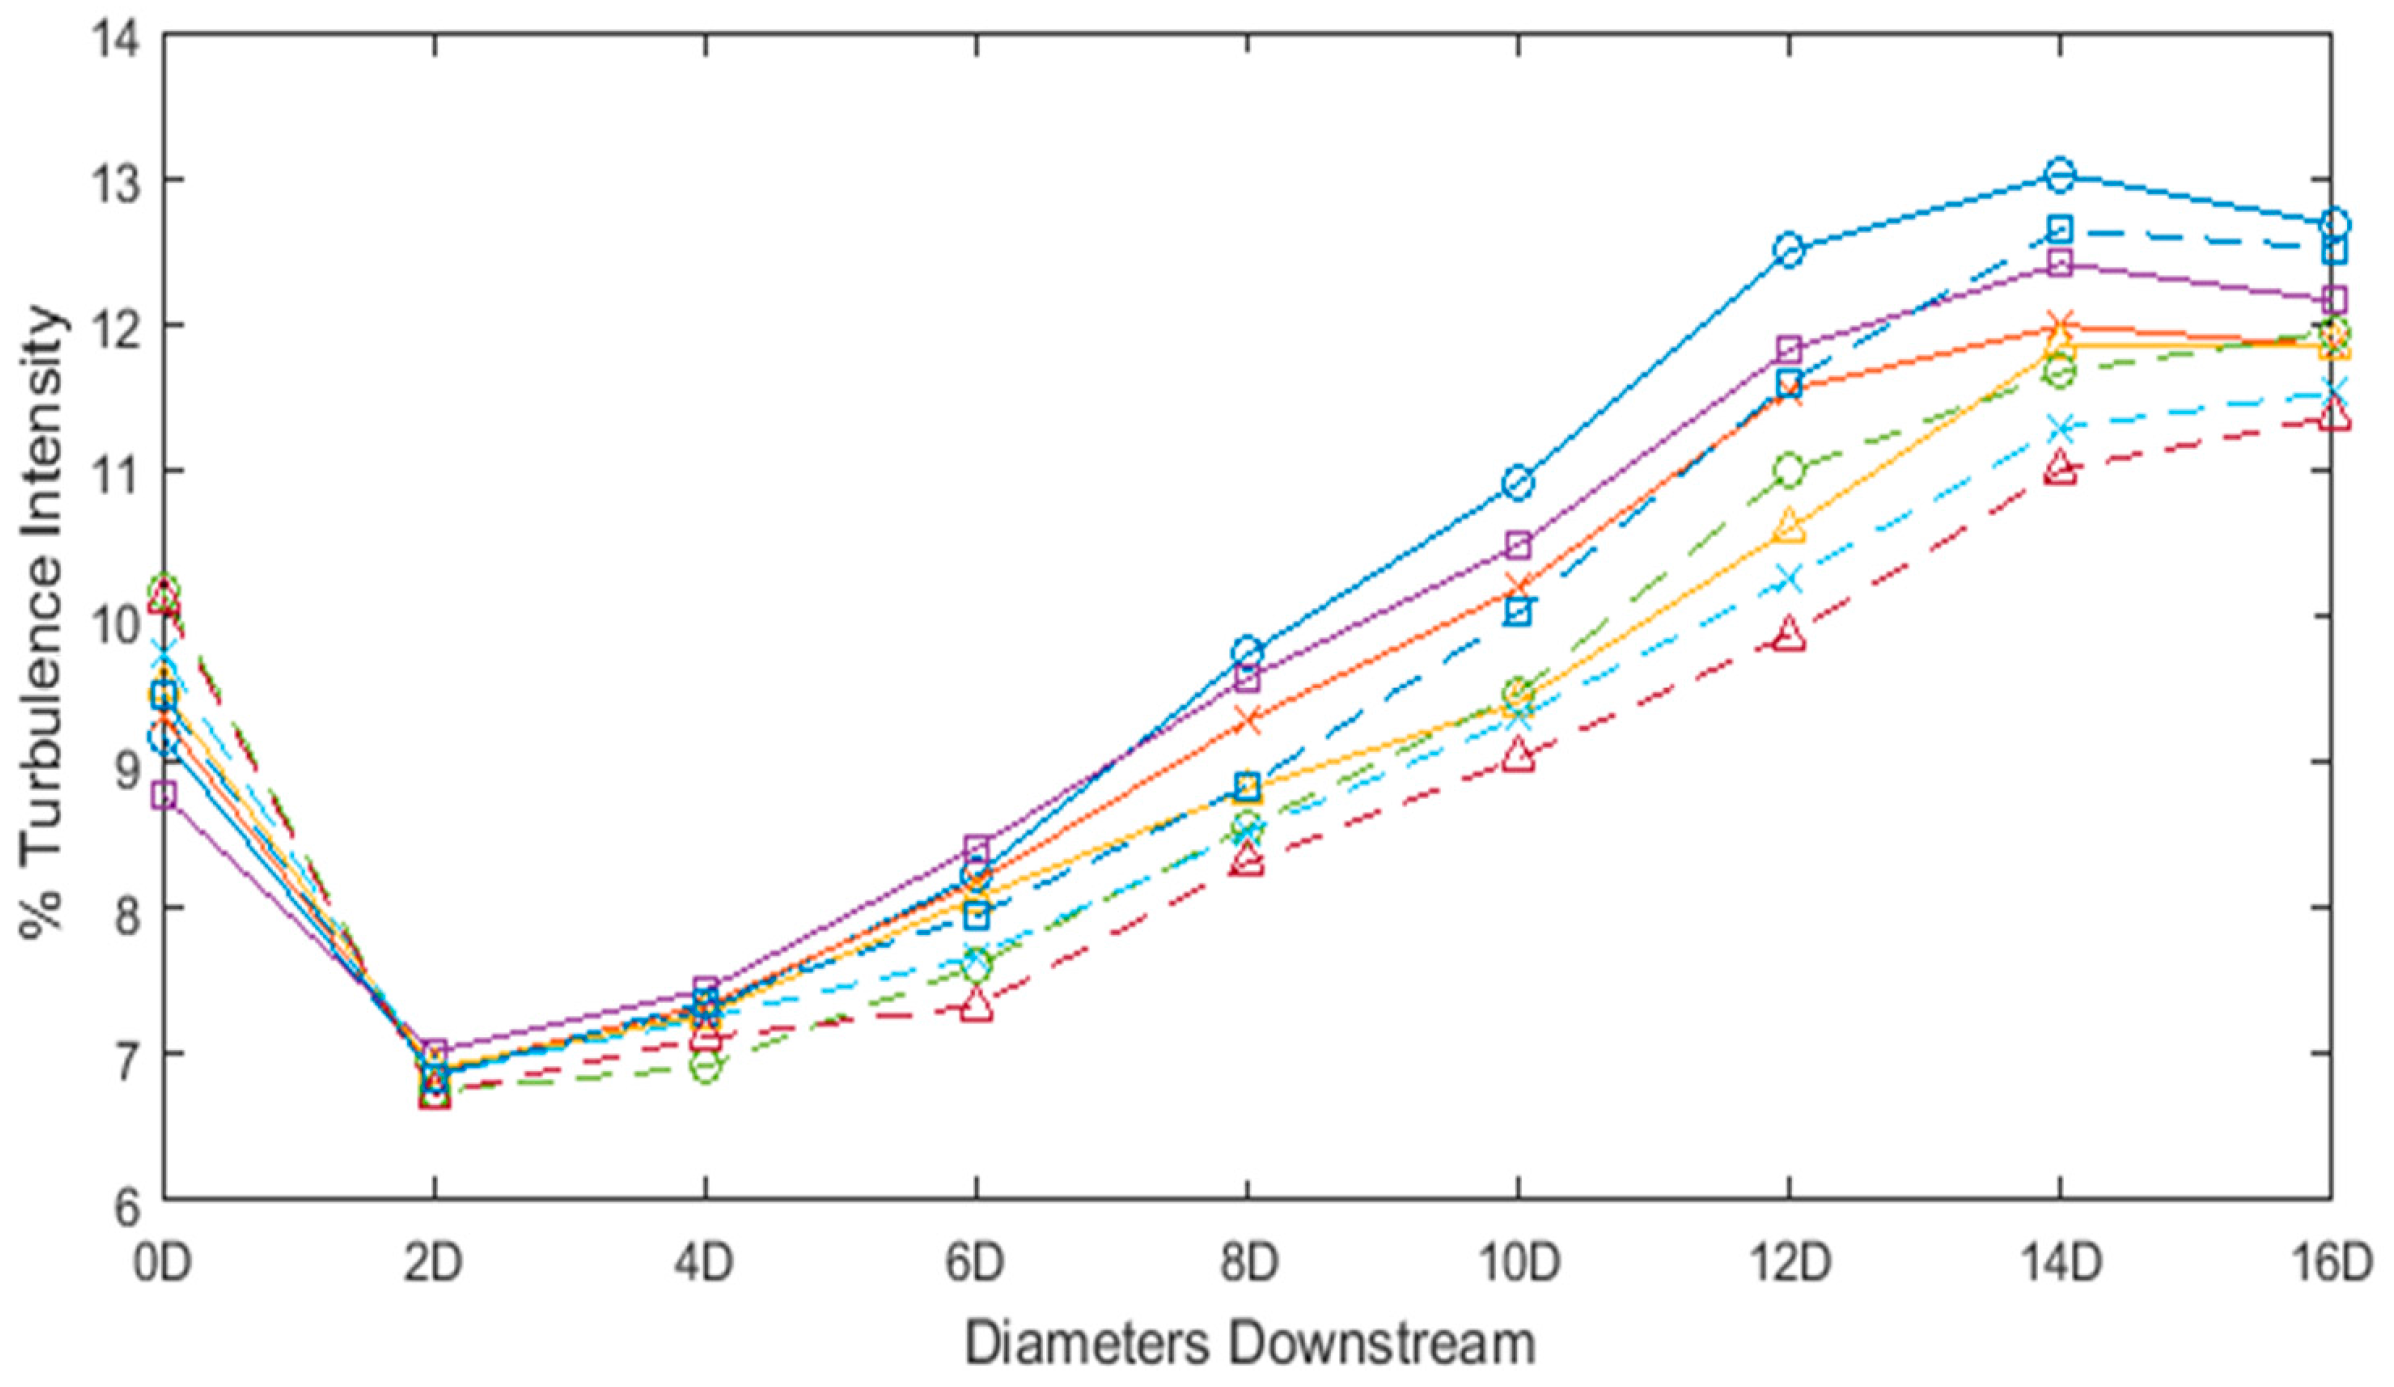
Across all cases modelled, unactuated or actuated, regardless of frequency, at no point in the flow domain does the averaged turbulence intensity return to 5%. The minimum turbulence intensity of 6.7% occurs at 2D downstream of the cylinder. The near-wall turbulence intensity in the lee of the cylinder ranges from 10.2% (for ) to 8.8% (for = 4.21). A common trend for all cases in Figure 15 is that the turbulence intensity decreases in the near-wake, over the first distance of 2. Beyond 2 downstream, the turbulence intensity increases with distance. The peak turbulence intensity (for the unactuated case and actuated cases with = 2.43, 3.44, 4.21 and 6.43) ranges from 11.9% to 13.0% at a downstream distance of 14 from the cylinder. After this point, there is a small decrease before the end of the flow domain is reached. The cases for = 4.86, 5.43 and 5.95 have not yet reached a maximum turbulence intensity at the end of the flow domain. The flow domain would need to be extended further downstream to fully ascertain where the turbulence intensity reaches its peak value for all conditions under investigation. However, since the rate at which the turbulence intensity increases drops towards the end of the flow domain, the maximum turbulence intensity for these cases is not expected to exceed the value of 13.0% observed for the other cases.
As previously noted, in the near wake directly in the lee of the cylinder, as the turbulence intensity increases, decreases. However, for the far wake region beyond 8D downstream of the cylinder, the opposite trend is observed for all cases (both actuated and unactuated); namely, a lower turbulence intensity corresponds to a decrease in (Figure 15).
4. Conclusions
Using unsteady RANS simulations with the transition SST turbulence model, a significant modification of the drag coefficient and RMS lift coefficient for a circular cylinder in cross-flow has been observed, for a freestream Reynolds number and a range of synthetic jet Stokes numbers from = 2.4 to 6.4. Overall, the trend in modification agrees with the work of Catalano et al. [25], with a general decrease in achieved at = 4.9 for a fixed jet Reynolds number of = 12. It was also observed that the modification of the RMS lift coefficient was closely coupled with the modification of the drag coefficient .
Previous research has used the dimensionless actuation frequency for comparison of synthetic jet operating conditions and the effects on flow control for NACA aerofoil geometries [3,6,16,17,42]. Despite a similar-sized cylinder and comparable freestream velocity, the results of the present study and Catalano et al. [25] are characterised by different dimensionless actuation frequencies , due to the different sized synthetic jet orifices used in both studies. The present study opted for an orifice width of 1 mm, identical to the size used in water tunnel experiments in the research group, but larger than the 0.13 mm wide orifice used by Catalano et al. [25]. However, the three dimensionless jet operating parameters , and were maintained the same as Catalano et al. [25] for comparison of the vortex formation process. The optimum drag coefficient and RMS lift coefficient reduction occurs at = 0.4 for the present study and at = 19.5 for Catalano et al. [25], but otherwise similar trends have been observed.
Decreases in the magnitude of the adverse surface pressure gradient across the synthetic jet orifice indicate an increase in the momentum of the viscous sublayer. When the magnitude of the pressure gradient across the orifice decreases, there is an increase in turbulence intensity at the rear of the cylinder. This increase in the strength of the vortical structures at the rear of the cylinder appears to be responsible for the decrease in drag coefficient .
Additionally, an increase in turbulence intensity in the lee of the cylinder also corresponds to a decrease in the turbulence intensity further downstream in the cylinder wake, beyond downstream. This could be a useful insight for structures or devices implemented in arrays, such as tidal turbines and wave energy devices, or the risers used for offshore platforms and deep-water wind turbines. By operating the synthetic jet actuator to minimise the mean drag and RMS lift forces experienced by the structure, the turbulence intensity downstream of the structure will also be minimised. Thus, the ideal synthetic jet operating condition for drag and lift reduction would have a beneficial effect on the flow conditions of downstream devices.
Acknowledgments
The authors gratefully acknowledge the support of Diarmuid Jackson for the useful discussions on flow control, Sajad Alimohammadi for the assistance with the numerical implementation and the resources made available by the Irish Centre for High-End Computing (ICHEC). This work builds on research supported by the Higher Education Authority of Ireland through the Graduate Research Education Programme in Engineering (Programme for Research in Third-Level Institutions—cycle 5 (PRTLI5), co-funded by the European Regional Development Fund) and the Irish Research Council through its INSPIRE International Mobility Fellowship programme (co-funded by Marie Curie Actions; grant No. PD/2010/INSP/1313) and the Government of Ireland Postdoctoral Fellowship programme (grant No. GOIPD/2016/216).
Author Contributions
Philip McDonald carried out the research work under the supervision of Tim Persoons; Philip McDonald is the primary author.
Conflicts of Interest
The authors declare no conflict of interest.
Nomenclature
| Coefficient of drag | ||
| Coefficient of lift | ||
| Coefficient of pressure | ||
| Coefficient of pressure at rear of cylinder | ||
| Cylinder diameter | m | |
| Synthetic jet orifice width | m | |
| Synthetic jet actuation frequency | Hz | |
| Dimensionless actuation frequency | ||
| I | Turbulence intensity | |
| k | Turbulent kinetic energy | m2/s2 |
| L | Characteristic length scale | m |
| P | Pressure | Pa |
| Re | Reynolds number of the freestream flow | |
| Reynolds number of the synthetic jet | ||
| Strouhal number of vortex shedding | ||
| Strouhal number of the synthetic jet | ||
| Stokes number of the synthetic jet | ||
| Pseudo diaphragm velocity | m/s | |
| Averaged velocity at the orifice | m/s | |
| Peak velocity at the orifice | m/s | |
| Freestream velocity | m/s | |
| Velocity at centreline of jet orifice | m/s | |
| x, y | Spatial coordinates | m |
| Greek symbols and abbreviations | ||
| Circumferential coordinate | (rad) | |
| v | Kinematic viscosity | m2/s |
| τ | Wall shear stress | Pa |
| Angular velocity | rad/s | |
| CFL | Courant-Friedrichs-Lewy number | |
| RMS | Root-mean-squared | |
| SST | Shear stress transport | |
| URANS | Unsteady Reynolds-averaged Navier-Stokes | |
References
- Clean Sky. Clean Sky 2: Joint Technical Programme; Clean Sky Joint Undertaking: Brussels, Belgium, 2015. Available online: http://ec.europa.eu/research/participants/data/ref/h2020/other/guide-appl/jti/h2020-guide-techprog-cleansky-ju_en.pdf (accessed on 14 July 2017).
- Charlier, R.H. Sustainable co-generation from the tides: A review. Renew. Sustain. Energy Rev. 2003, 7, 187–213. [Google Scholar] [CrossRef]
- Glezer, A. Some aspects of aerodynamic flow control using synthetic-jet actuation. Philos. Trans. R. Soc. Lond. Ser. A Math. Phys. Eng. Sci. 2011, 369, 1476–1494. [Google Scholar] [CrossRef] [PubMed]
- Persoons, T. General reduced-order model to design and operate synthetic jet actuators. AIAA J. 2012, 50, 916–927. [Google Scholar] [CrossRef]
- Lee, C.; Hong, G.; Ha, Q.P.; Mallinson, S.G. A piezoelectrically actuated micro synthetic jet for active flow control. Sens. Actuators A Phys. 2003, 108, 168–174. [Google Scholar] [CrossRef]
- Zhao, G.; Zhao, Q. Parametric analyses for synthetic jet control on separation and stall over rotor airfoil. Chin. J. Aeronaut. 2014, 27, 1051–1061. [Google Scholar] [CrossRef]
- Gilarranz, J.; Traub, L.; Rediniotis, O. A new class of synthetic jet actuators—Part II: Application to flow separation control. J. Fluids Eng. 2005, 127, 377–387. [Google Scholar] [CrossRef]
- Smith, B.L.; Glezer, A. The formation and evolution of synthetic jets. Phys. Fluids 1998, 10, 2281–2297. [Google Scholar] [CrossRef]
- Tomas, J.M.; van der Weide, E.T.; de Vries, H.; Hoeijmakers, H.W. Numerical simulation of flow control by synthetic jet actuation. In Proceedings of the 27th Congress of International Council of the Aeronautical Sciences, Nice, France, 19–24 September 2010. [Google Scholar]
- Glezer, A.; Amitay, M. Synthetic jets. Annu. Rev. Fluid Mech. 2002, 34, 503–529. [Google Scholar] [CrossRef]
- Shivamoggi, B.K. Hydrodynamic impulse in a compressible fluid. Phys. Lett. A 2010, 374, 4736–4740. [Google Scholar] [CrossRef]
- Auerbach, D. Experiments on the trajectory and circulation of the starting vortex. J. Fluid Mech. 1987, 183, 185–198. [Google Scholar] [CrossRef]
- De Luca, L.; Girfoglio, M.; Chiatto, M.; Coppola, G. Scaling properties of resonant cavities driven by piezo-electric actuators. Sens. Actuators A Phys. 2016, 247, 465–474. [Google Scholar] [CrossRef]
- Chiatto, M.; Capuano, F.; Coppola, G.; de Luca, L. LEM characterization of synthetic jet actuators driven by piezoelectric element: A review. Sensors 2017, 17, 1216. [Google Scholar] [CrossRef] [PubMed]
- Honohan, A.; Amitay, M.; Glezer, A. Aerodynamic control using synthetic jets. In Proceedings of the Fluids 2000 Conference and Exhibit, Denver, CO, USA, 19–22 June 2000; AIAA 2000-2401. American Institute of Aeronautics and Astronautics: Reston, VA, USA, 2000. [Google Scholar]
- Smith, D.; Amitay, M.; Kibens, V.; Parekh, D.; Glezer, A. Modification of lifting body aerodynamics using synthetic jet actuators. In Proceedings of the 36th AIAA Aerospace Sciences Meeting and Exhibit, Reno, NV, USA, 12–15 January 1998; AIAA 98-0209. American Institute of Aeronautics and Astronautics: Reston, VA, USA, 1998. [Google Scholar]
- Seifert, A.; Pack, L. Oscillatory control of separation at high Reynolds numbers. AIAA J. 1999, 37, 1062–1071. [Google Scholar] [CrossRef]
- Zhong, S.; Jabbal, M.; Tang, H.; Garcillan, L.; Guo, F.; Wood, N.; Warsop, C. Towards the design of synthetic-jet actuators for full-scale flight conditions. Flow Turbul. Combust. 2007, 78, 283–307. [Google Scholar] [CrossRef]
- Huarte, F.H.; Bearman, P.; Chaplin, J. On the force distribution along the axis of a flexible circular cylinder undergoing multi-mode vortex-induced vibrations. J. Fluids Struct. 2006, 22, 897–903. [Google Scholar] [CrossRef]
- Zhang, L.Q.; Chen, G.B.; Chen, W.L.; Gao, D.L. Separation control on a bridge box girder using a bypass passive jet flow. Appl. Sci. 2017, 7, 501. [Google Scholar] [CrossRef]
- Fernandez-Gamiz, U.; Zulueta, E.; Boyano, A.; Ramos-Hernanz, J.A.; Lopez-Guede, J.M. Microtab design and implementation on a 5 MW wind turbine. Appl. Sci. 2017, 7, 536. [Google Scholar] [CrossRef]
- Harrison, M.E.; Batten, W.M.J.; Myers, L.E.; Bahaj, A.S. Comparison between CFD simulations and experiments for predicting the far wake of horizontal axis tidal turbines. IET Renew. Power Gener. 2010, 4, 613–627. [Google Scholar] [CrossRef]
- Jackson, D. Active Fluidic Control of a Cylinder in a Cross-Flow Using Synthetic jet Actuation. Ph.D. Thesis, Trinity College, University of Dublin, Dublin, Ireland, 2016. [Google Scholar]
- Feng, L.H.; Wang, J.J. Synthetic jet control of separation in the flow over a circular cylinder. Exp. Fluids 2012, 53, 467–480. [Google Scholar] [CrossRef]
- Catalano, P.; Wang, M.; Iaccarino, G.; Sbalzariniz, I.F.; Koumoutsakos, P. Optimization of cylinder flow control via actuators with zero net mass flux. In Proceedings of the Summer Program, Stanford, CA, USA, 29 July–23 August 2002; Center for Turbulence Research: Stanford, CA, USA, 2002; pp. 297–303. [Google Scholar]
- Bouffanais, R.; Deville, M.O.; Fischer, P.F.; Leriche, E.; Weill, D. Large-eddy simulation of the lid-driven cubic cavity flow by the spectral element method. J. Sci. Comput. 2006, 27, 151–162. [Google Scholar] [CrossRef]
- Karniadakis, G.; Sherwin, S. Spectral/hp Element Methods for Computational Fluid Dynamics; Oxford University Press: Oxford, UK, 2013. [Google Scholar]
- Dutta, P.; Beskok, A.; Warburton, T.C. Numerical simulation of mixed electroosmotic/pressure driven microflows. Numer. Heat Transf. Part A Appl. 2002, 41, 131–148. [Google Scholar] [CrossRef]
- Liu, D.; Maxey, M.; Karniadakis, G. Modeling and optimization of colloidal micro-pumps. J. Micromech. Microeng. 2004, 14, 567. [Google Scholar] [CrossRef]
- Piomelli, U.; Balaras, E. Wall-layer models for large-eddy simulations. Annu. Rev. Fluid Mech. 2002, 34, 349–374. [Google Scholar] [CrossRef]
- Nieto, F.; Hargreaves, D.; Owen, J.S.; Hernández, S. On the applicability of 2D URANS and SST k-ω turbulence model to the fluid-structure interaction of rectangular cylinders. Eng. Appl. Comput. Fluid Mech. 2015, 9, 157–173. [Google Scholar]
- Menter, F.R. Review of the shear-stress transport turbulence model experience from an industrial perspective. Int. J. Comput. Fluid Dyn. 2009, 23, 305–316. [Google Scholar] [CrossRef]
- Wilcox, D. Reassessment of the scale-determining equation for advanced turbulence models. AIAA J. 1988, 26, 1299–1310. [Google Scholar] [CrossRef]
- Rahman, M.M.; Karim, M.M.; Alim, M.A. Numerical investigation of unsteady flow past a circular cylinder using 2-D finite volume method. J. Nav. Archit. Mar. Eng. 2007, 4, 27–42. [Google Scholar] [CrossRef]
- Beaudan, P.; Moin, P. Numerical Experiments on the Flow Past a Circular Cylinder at Sub-Critical Reynolds Number; Report No. TF-62; Stanford University: Stanford, CA, USA, 1994. [Google Scholar]
- Patel, M.; Cross, M.; Markatos, N. An assessment of flow oriented schemes for reducing ‘false diffusion’. Int. J. Numer. Methods Eng. 1988, 26, 2279–2304. [Google Scholar] [CrossRef]
- Holman, R.; Utturkar, Y.; Mittal, R.; Smith, B.L.; Cattafesta, L. Formation criterion for synthetic jets. AIAA J. 2005, 43, 2110–2116. [Google Scholar] [CrossRef]
- Alimohammadi, S.; Fanning, E.; Persoons, T.; Murray, D.B. Characterization of flow vectoring phenomenon in adjacent synthetic jets using CFD and PIV. Comput. Fluids 2016, 140, 232–246. [Google Scholar] [CrossRef]
- Païdoussis, M.P.; Price, S.J.; de Langre, E. Fluid-Structure Interactions: Cross-Flow-Induced Instabilities; Cambridge University Press: Cambridge, UK, 2010. [Google Scholar]
- You, D.; Moin, P. Active control of flow separation over an airfoil using synthetic jets. J. Fluids Struct. 2008, 24, 1349–1357. [Google Scholar] [CrossRef]
- Morenko, I.V.; Fedyaey, V.L. Influence of turbulence intensity and turbulence length scale on the drag, lift and heat transfer of a circular cylinder. China Ocean Eng. 2017, 31, 357–363. [Google Scholar] [CrossRef]
- Amitay, M.; Glezer, A. Role of actuation frequency in controlled flow reattachment over a stalled airfoil. AIAA J. 2002, 40, 209–216. [Google Scholar] [CrossRef]
Figure 1.
Schematic view of the computational domain and boundary conditions.
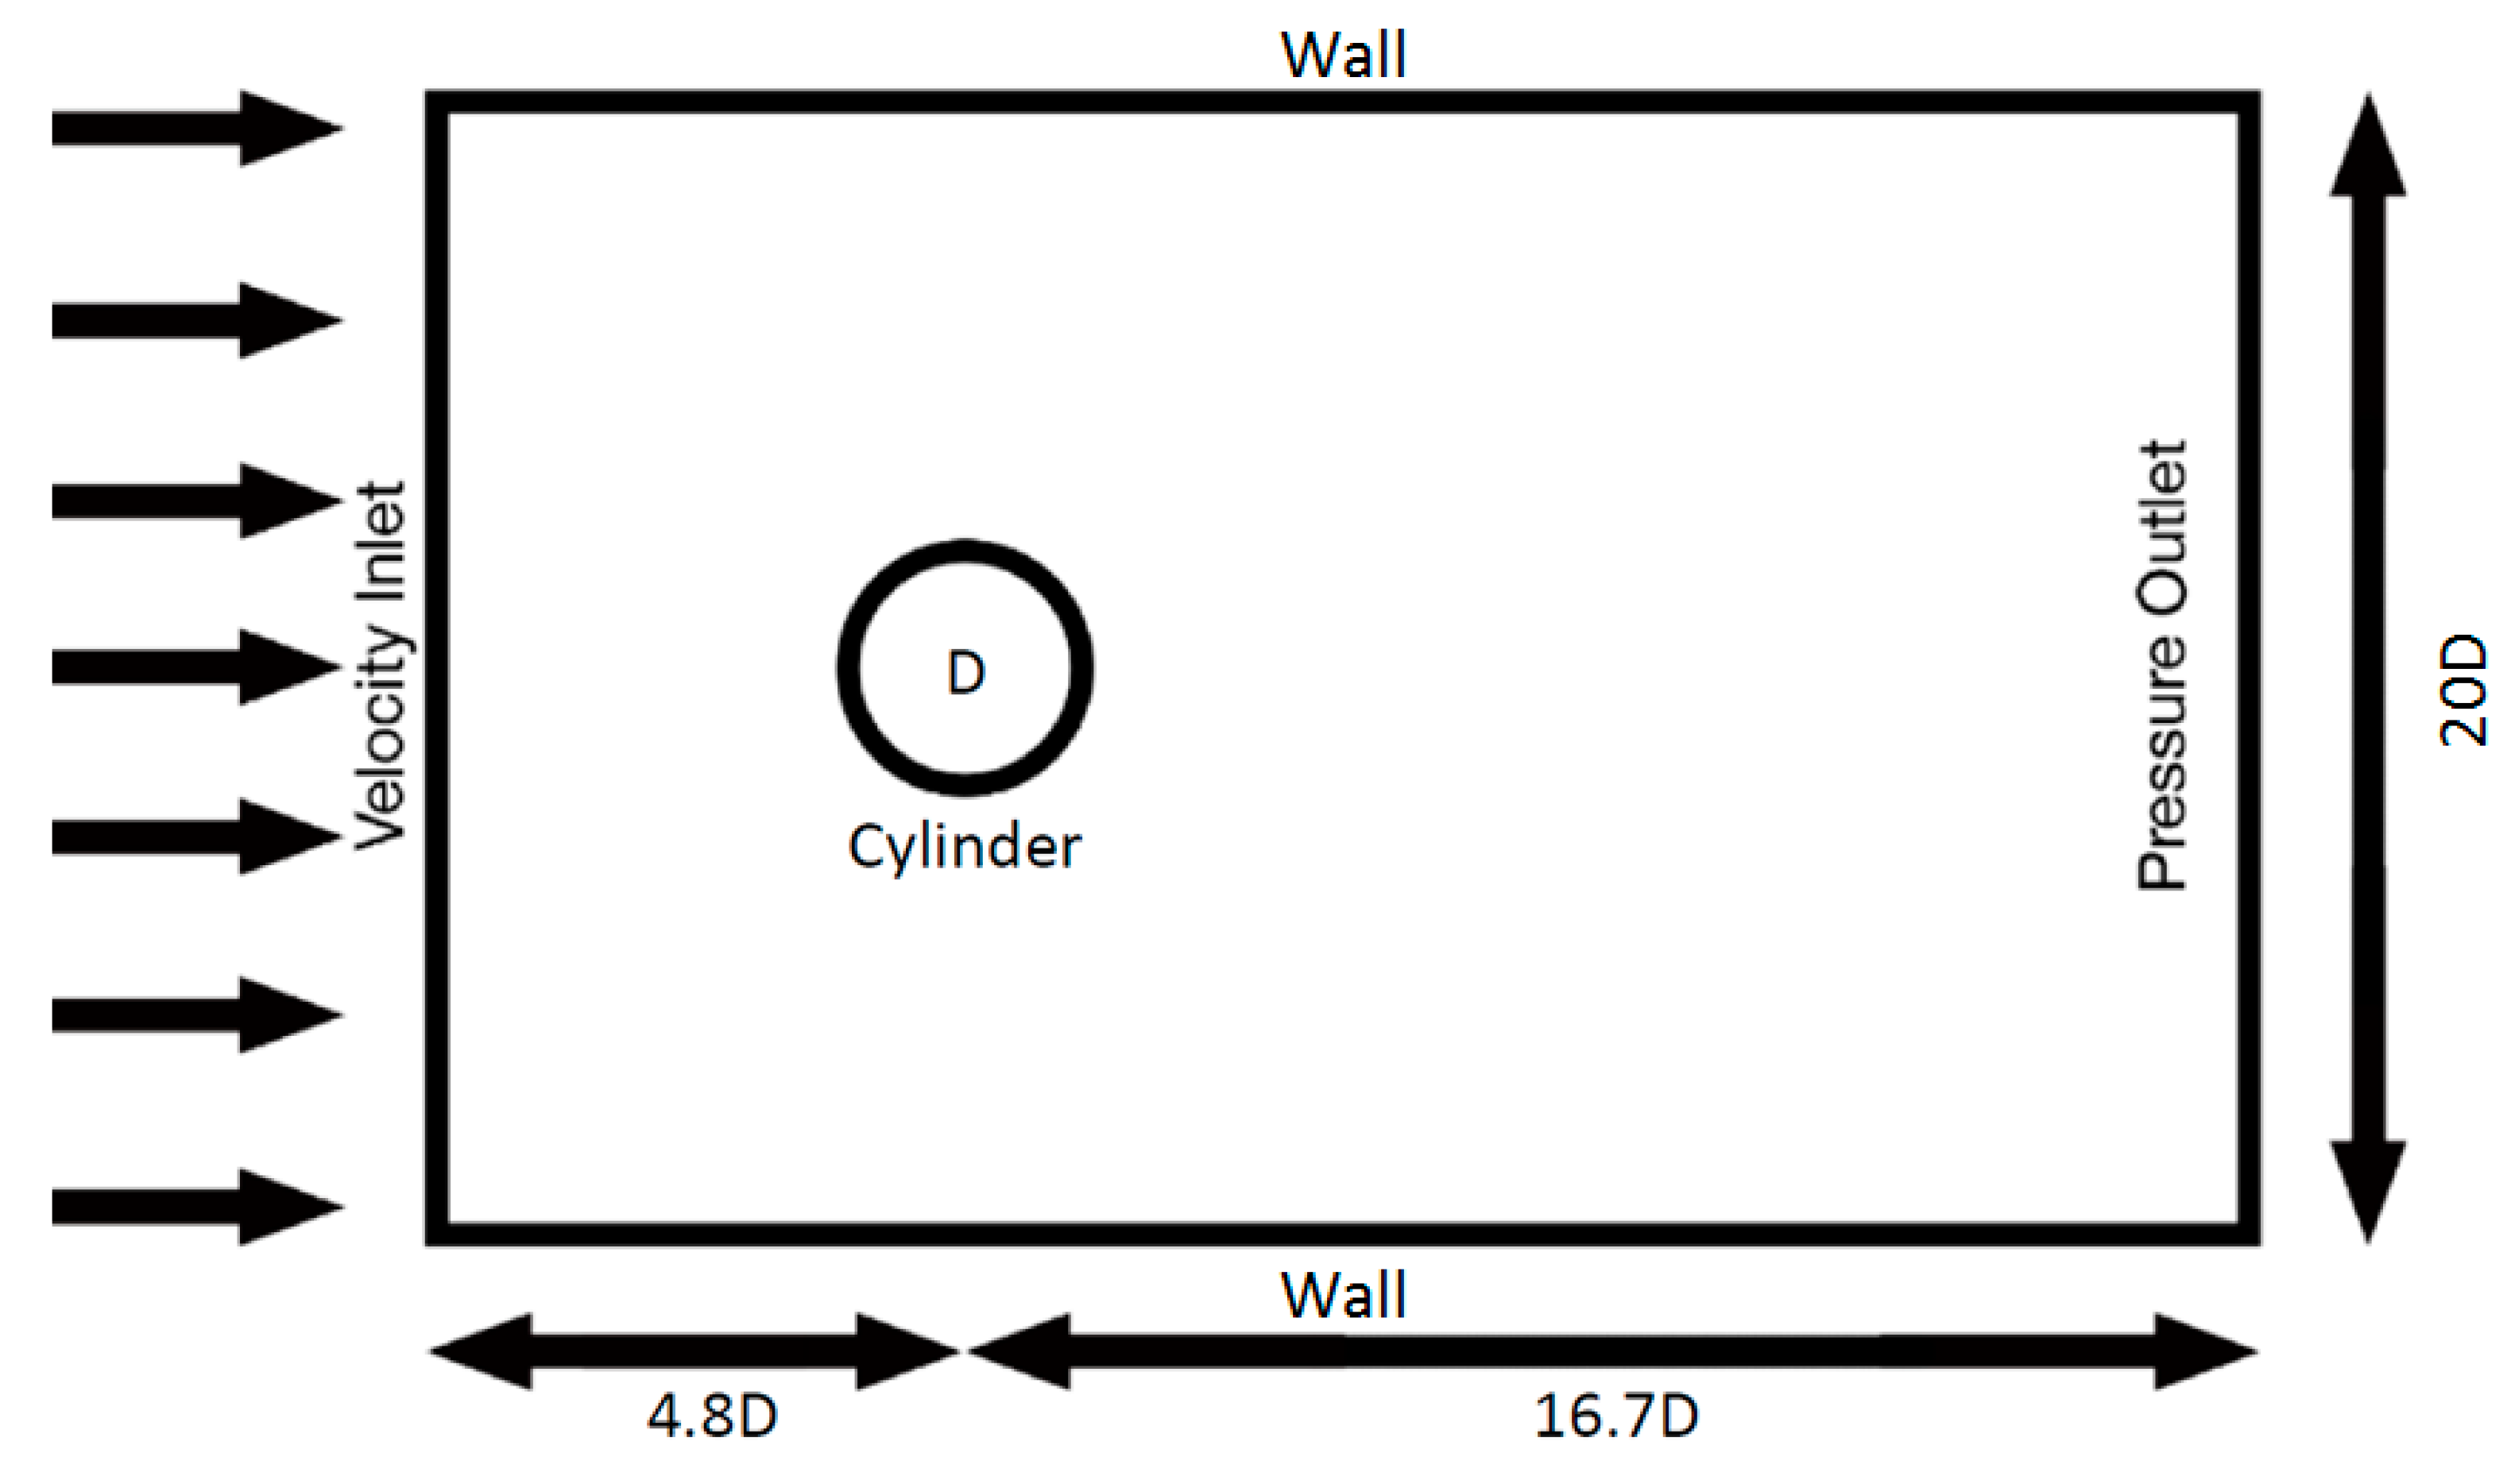
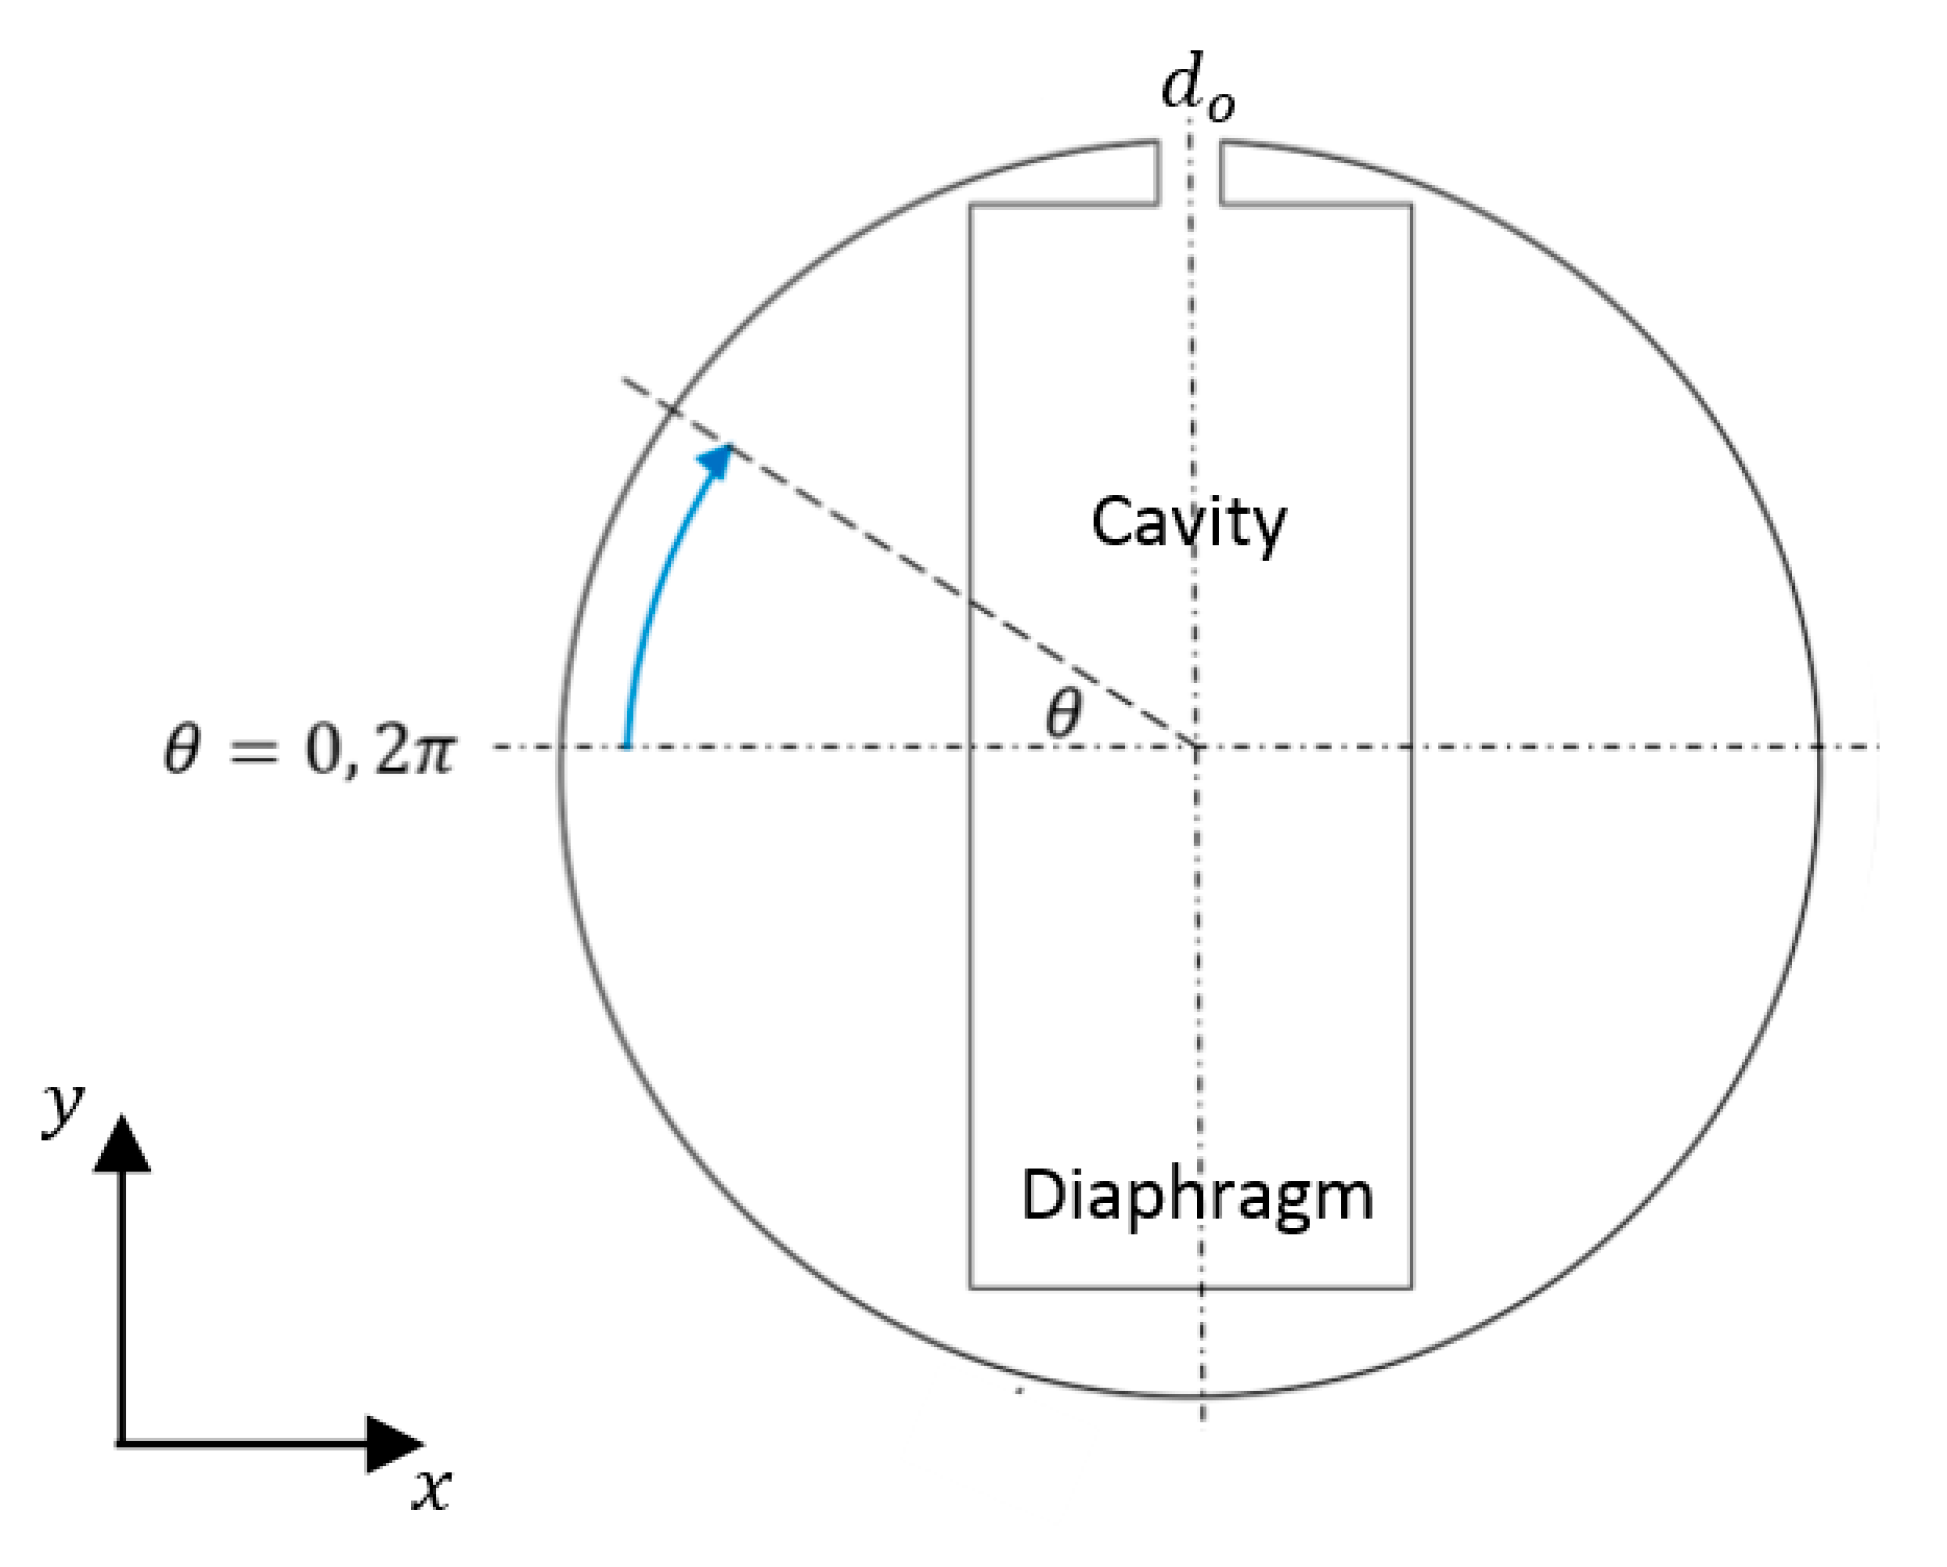
Figure 2.
Schematic diagram of the circular cylinder with internal synthetic jet cavity and pseudo diaphragm, represented by an inlet velocity boundary condition.
Figure 2.
Schematic diagram of the circular cylinder with internal synthetic jet cavity and pseudo diaphragm, represented by an inlet velocity boundary condition.

Figure 3.
Computational grid for (a) the full domain and (b) a close-up view of the vicinity of the cylinder and synthetic jet actuator cavity and orifice.
Figure 3.
Computational grid for (a) the full domain and (b) a close-up view of the vicinity of the cylinder and synthetic jet actuator cavity and orifice.
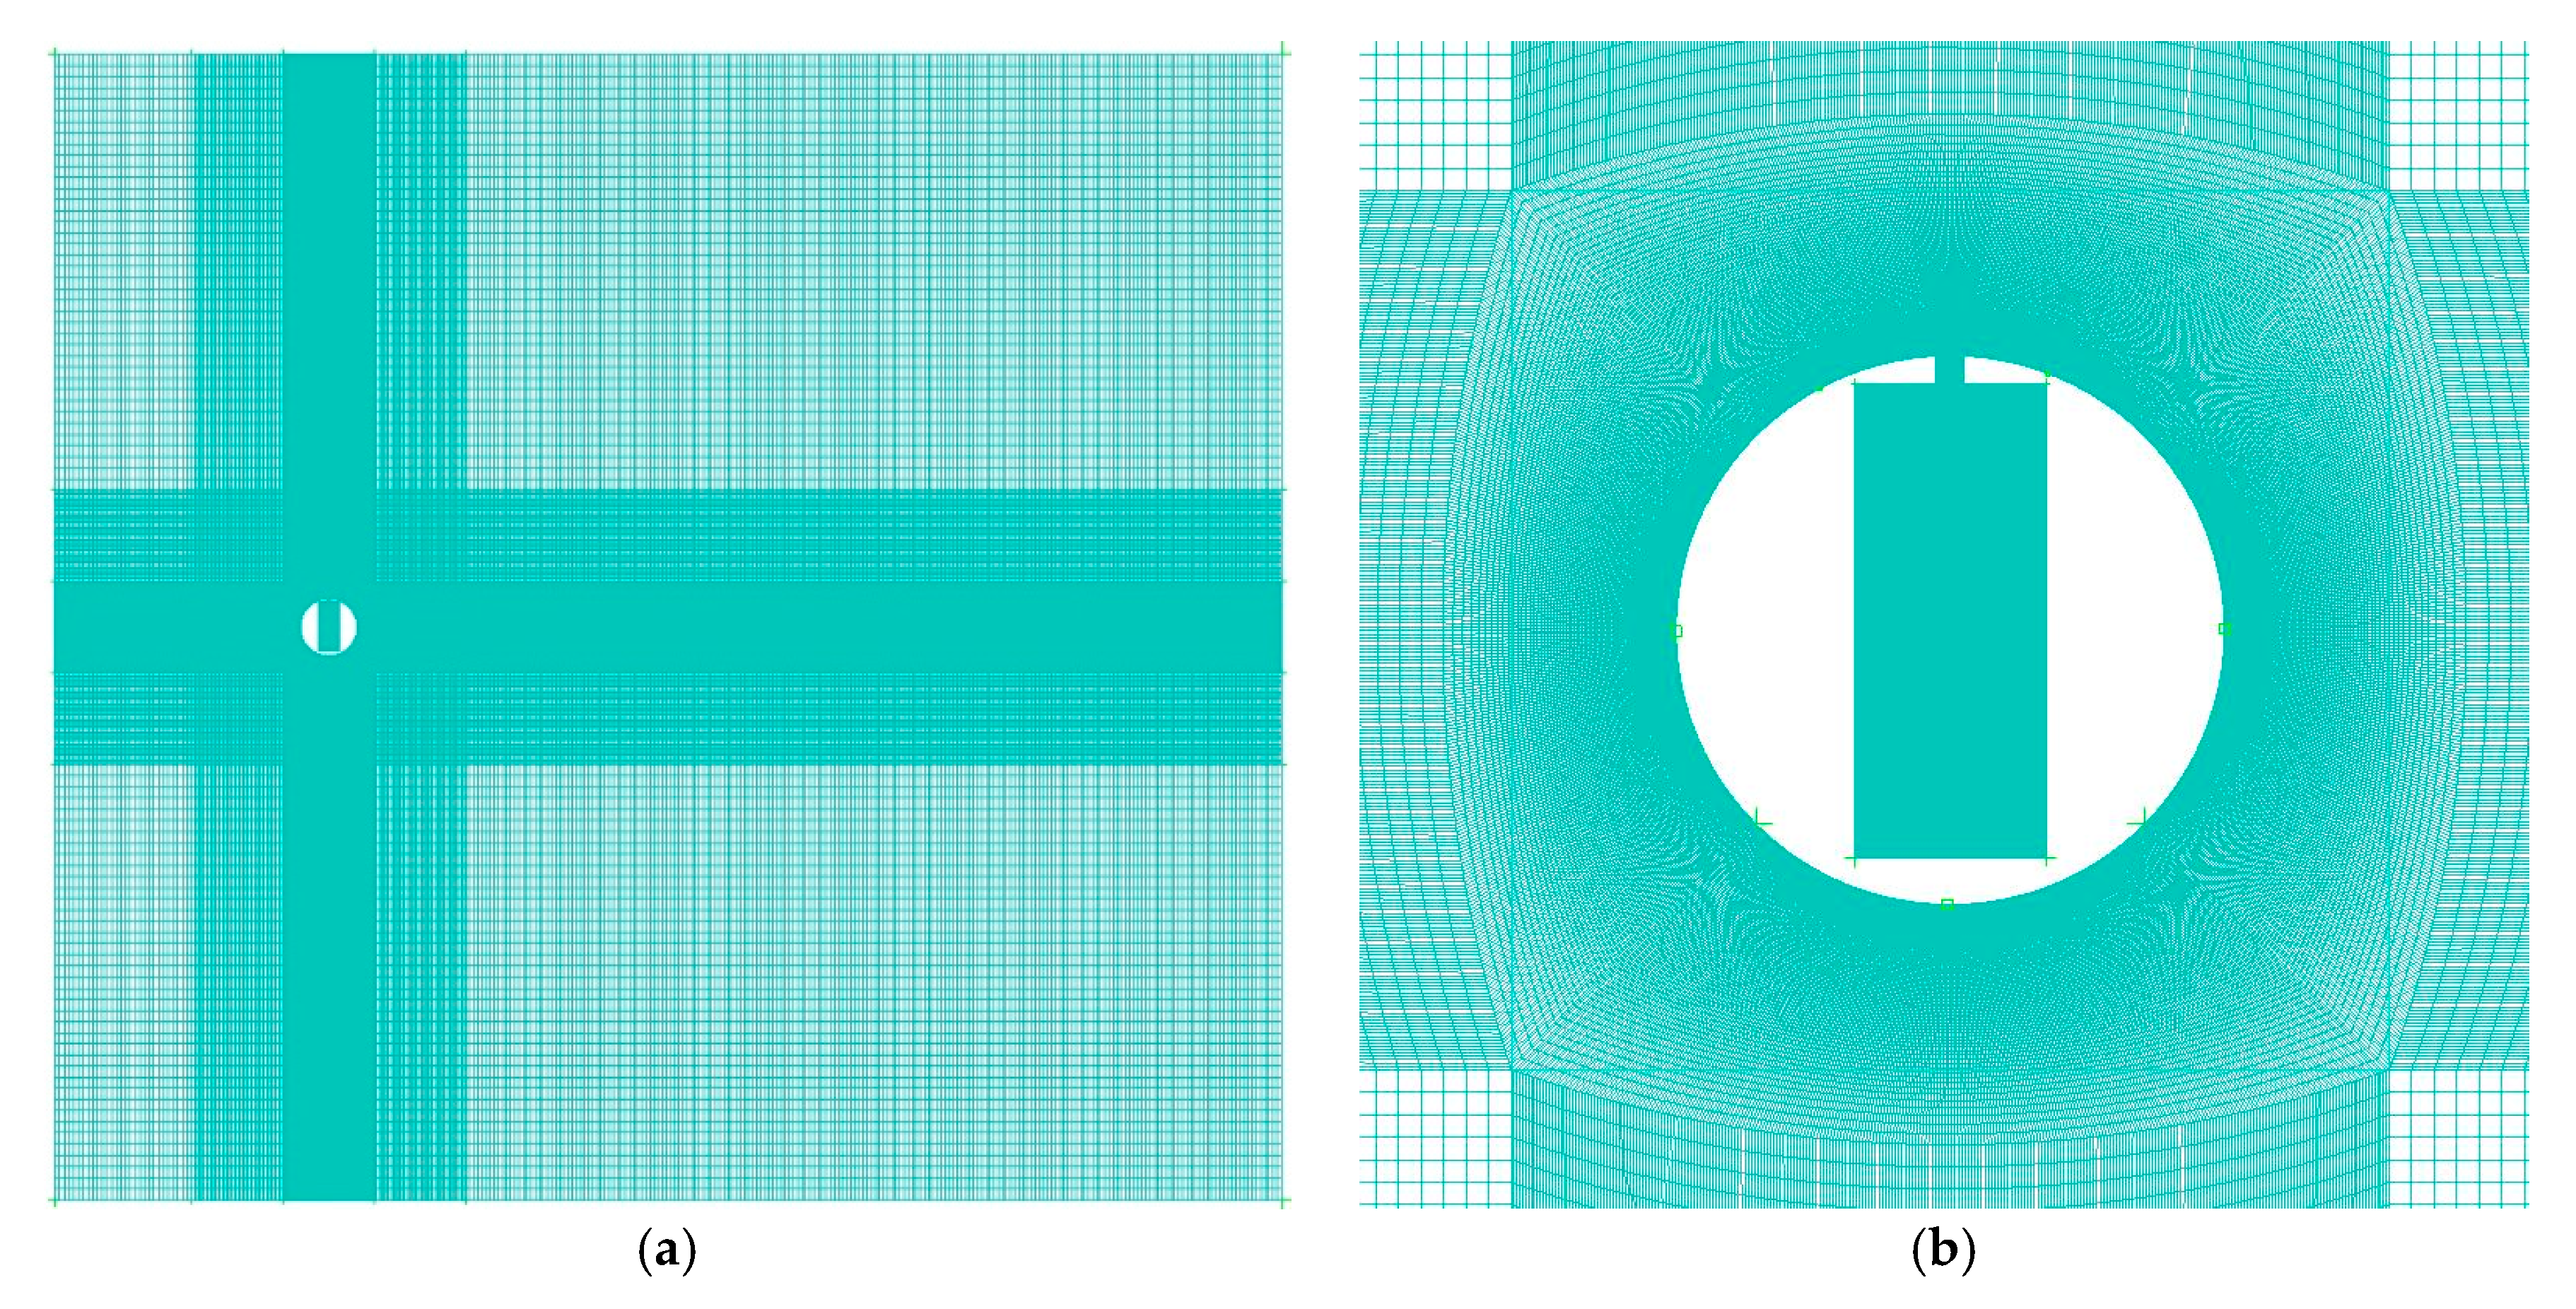
Figure 4.
Vorticity plots for formation criteria set out by Holman et al. [37] for a synthetic jet through two-dimensional simulation in quiescent flow at a fixed jet Stokes number = 15.8 and Reynolds number = 479 ( = 1.92), during the (a) blowing phase and (b) suction phase.
Figure 4.
Vorticity plots for formation criteria set out by Holman et al. [37] for a synthetic jet through two-dimensional simulation in quiescent flow at a fixed jet Stokes number = 15.8 and Reynolds number = 479 ( = 1.92), during the (a) blowing phase and (b) suction phase.

Figure 5.
Modification in drag coefficient as a function of the synthetic jet Stokes number for (- -o- -) Catalano et al. [25] and (‒o‒) the present study.
Figure 5.
Modification in drag coefficient as a function of the synthetic jet Stokes number for (- -o- -) Catalano et al. [25] and (‒o‒) the present study.

Figure 6.
Modification of (- -Δ- -) RMS lift coefficient and (‒o‒) drag coefficient as a function of the synthetic jet Stokes number .
Figure 6.
Modification of (- -Δ- -) RMS lift coefficient and (‒o‒) drag coefficient as a function of the synthetic jet Stokes number .
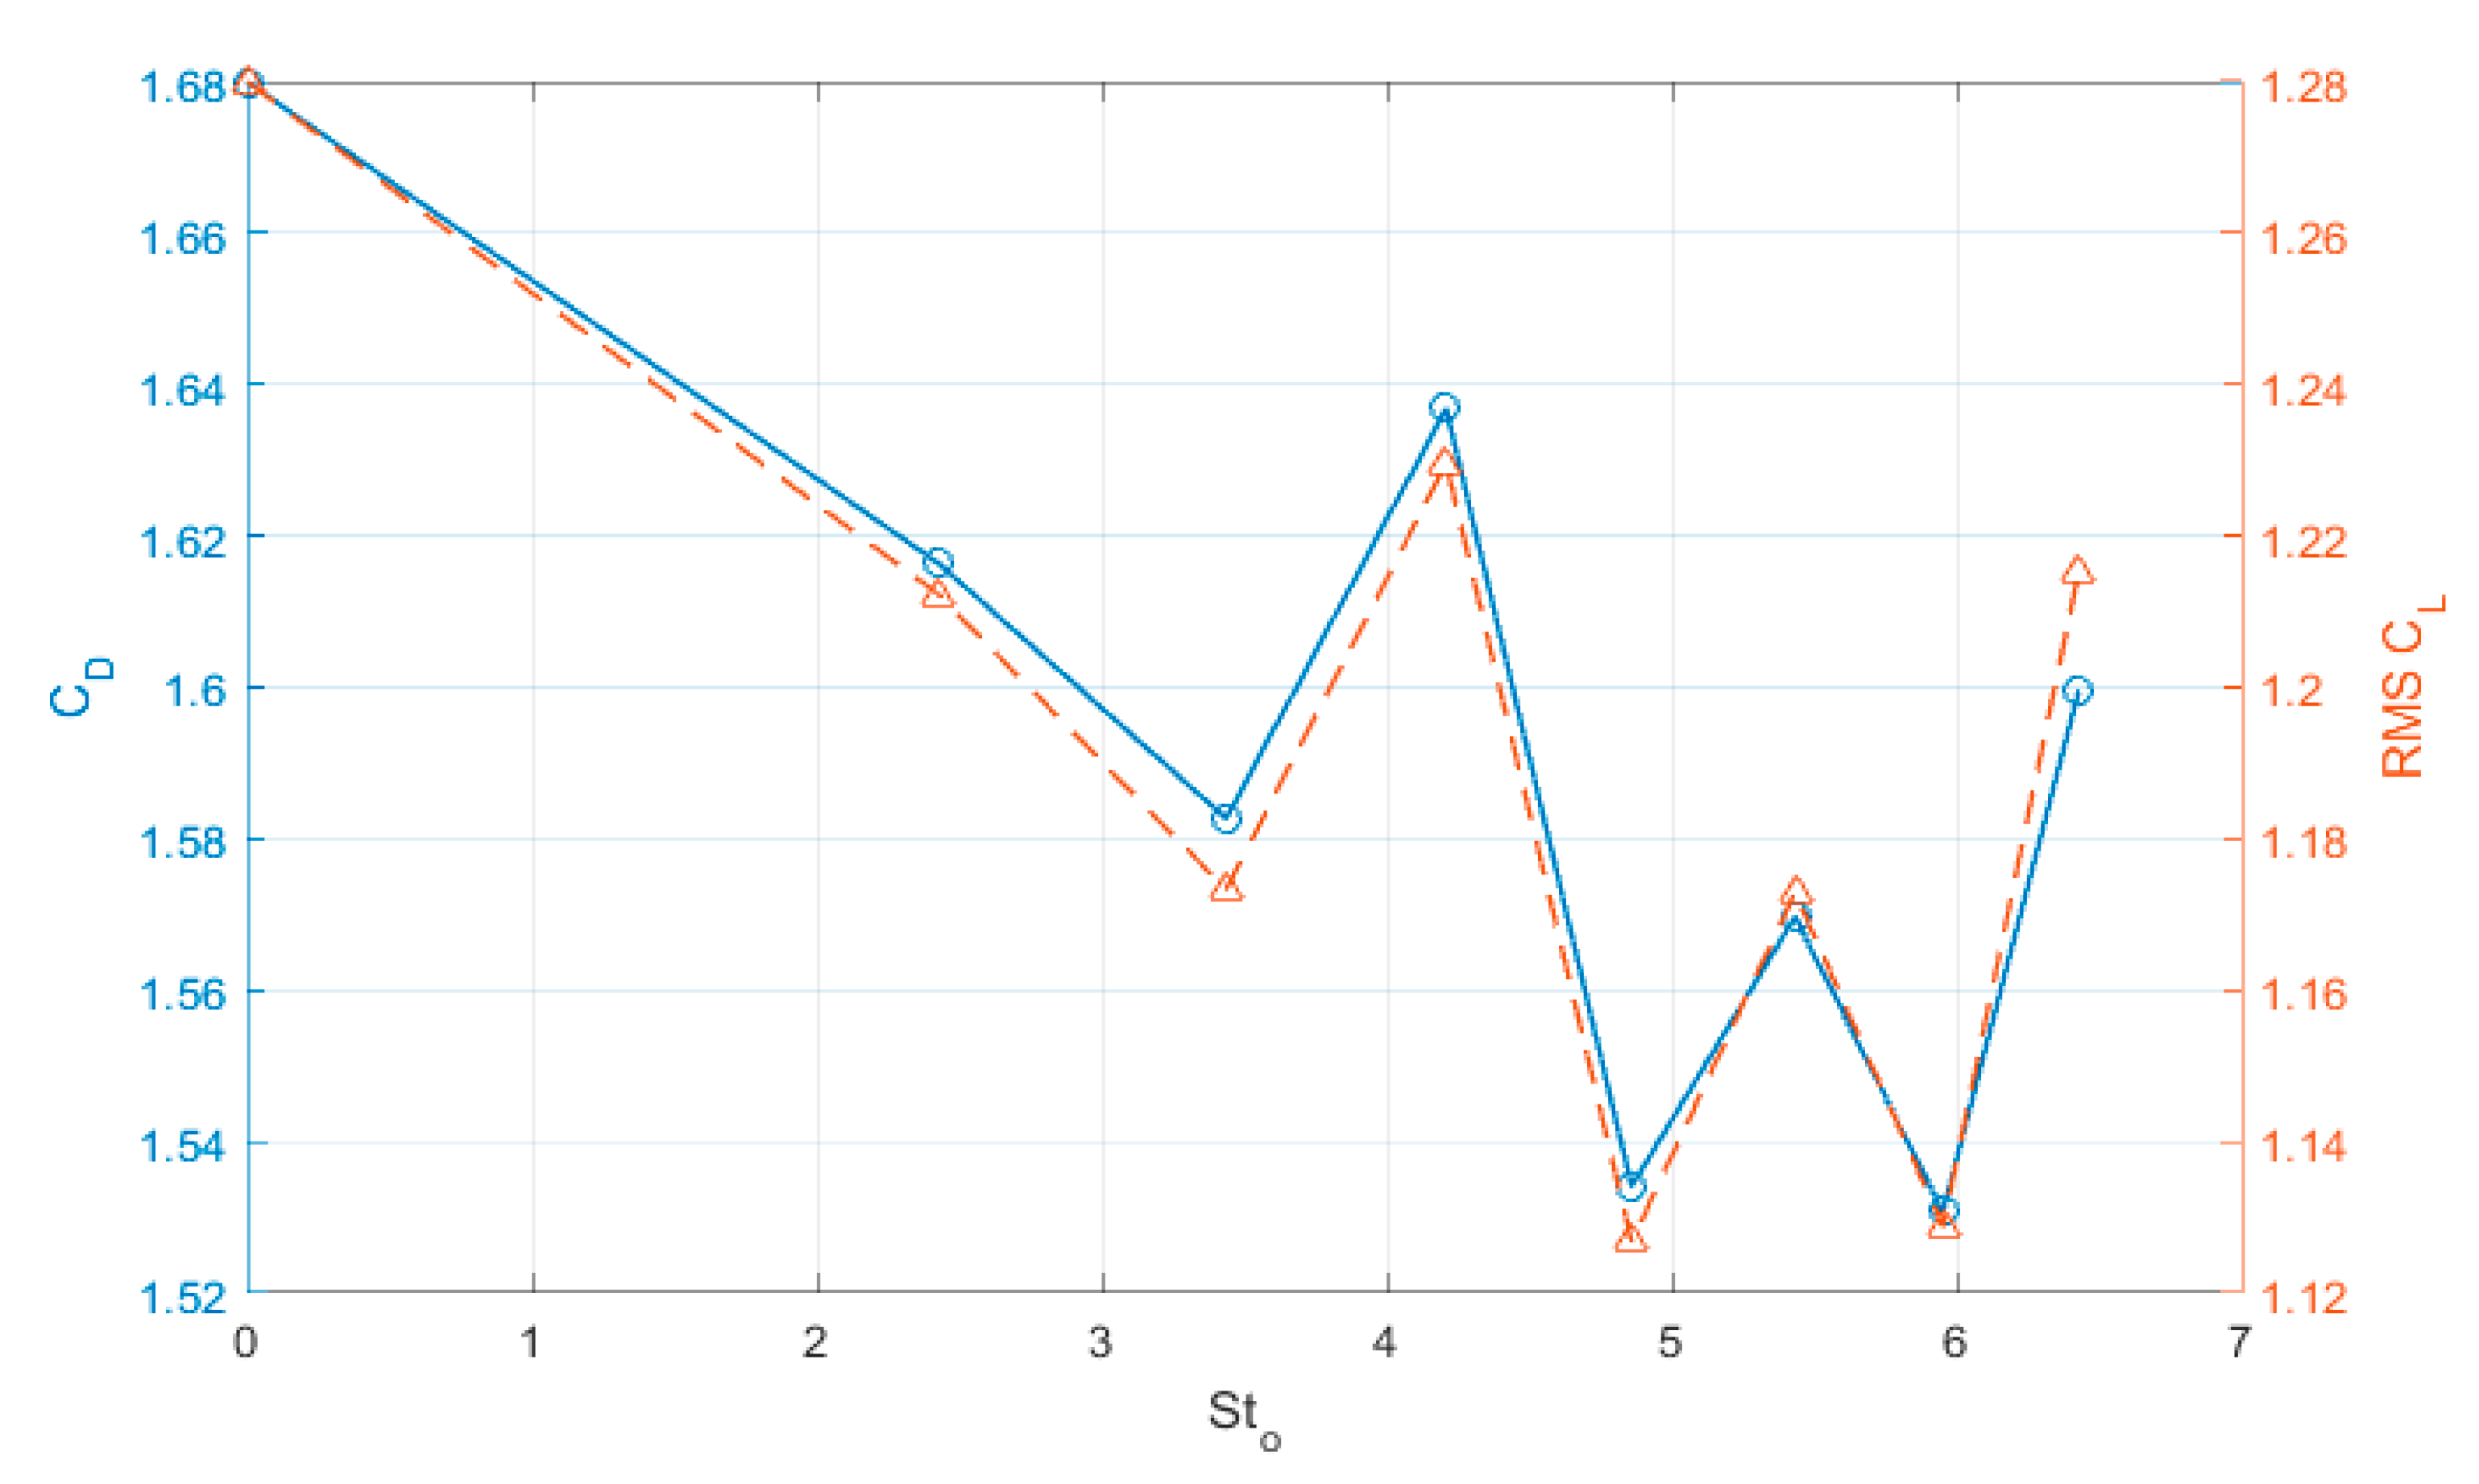
Figure 7.
Schematic diagram of the near-field locations of interest on the cylinder surface: (i) stagnation point at the front of the cylinder ( = 0), (ii) top and bottom separation points and and (iii) the angle between both separation points .
Figure 7.
Schematic diagram of the near-field locations of interest on the cylinder surface: (i) stagnation point at the front of the cylinder ( = 0), (ii) top and bottom separation points and and (iii) the angle between both separation points .
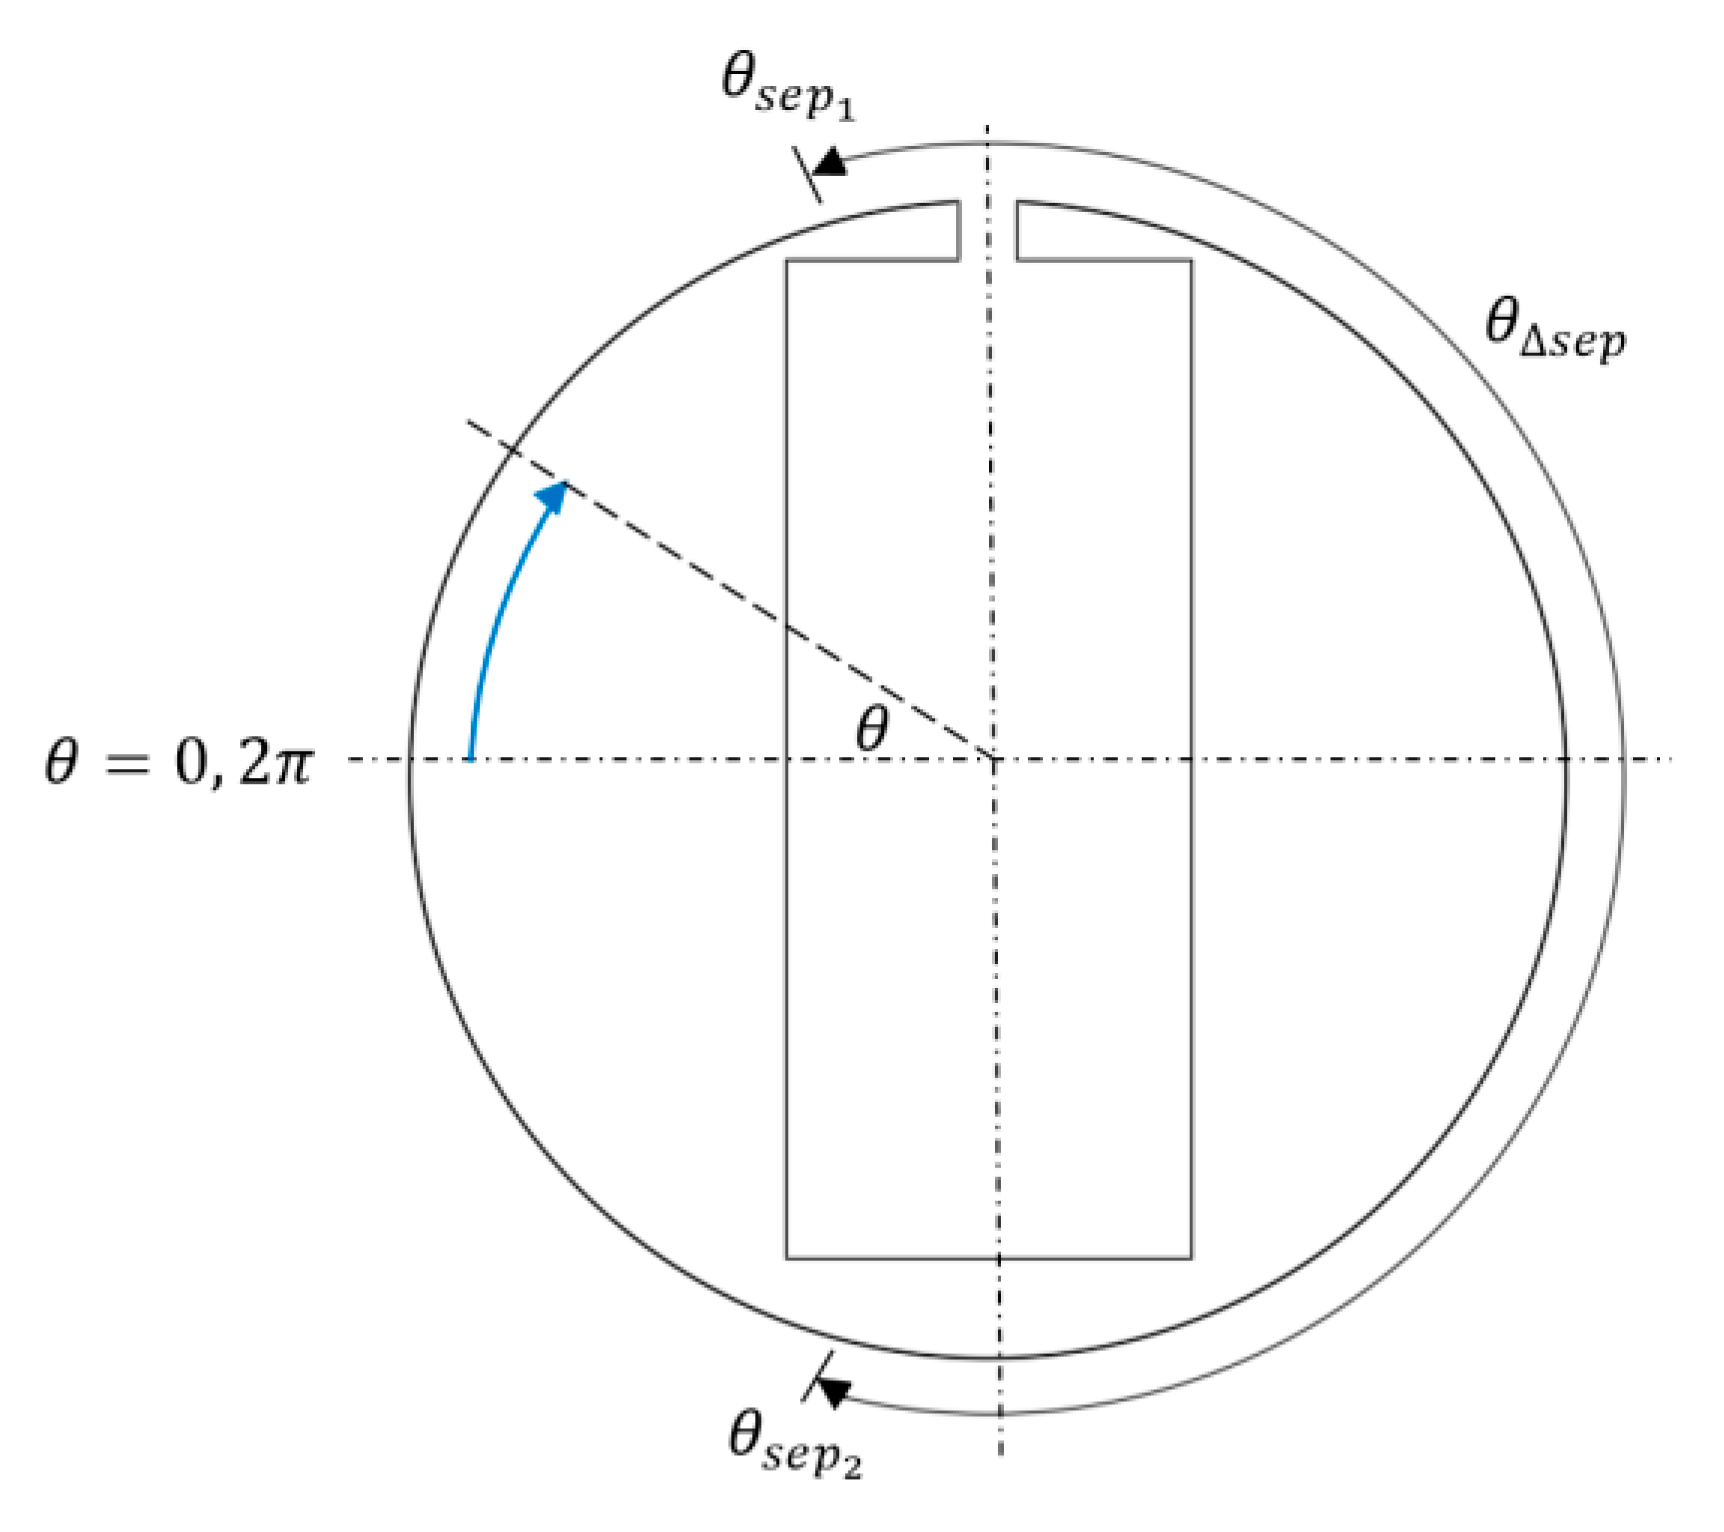
Figure 8.
Comparison of the modification of the separation points as a function of actuation frequency: (a) Top separation point location ; (b) Bottom separation point location .
Figure 8.
Comparison of the modification of the separation points as a function of actuation frequency: (a) Top separation point location ; (b) Bottom separation point location .

Figure 9.
Correlation between the separation point locations and the drag force, for the range of actuation frequencies: (a) Top of the cylinder ; (b) Bottom of the cylinder .
Figure 9.
Correlation between the separation point locations and the drag force, for the range of actuation frequencies: (a) Top of the cylinder ; (b) Bottom of the cylinder .
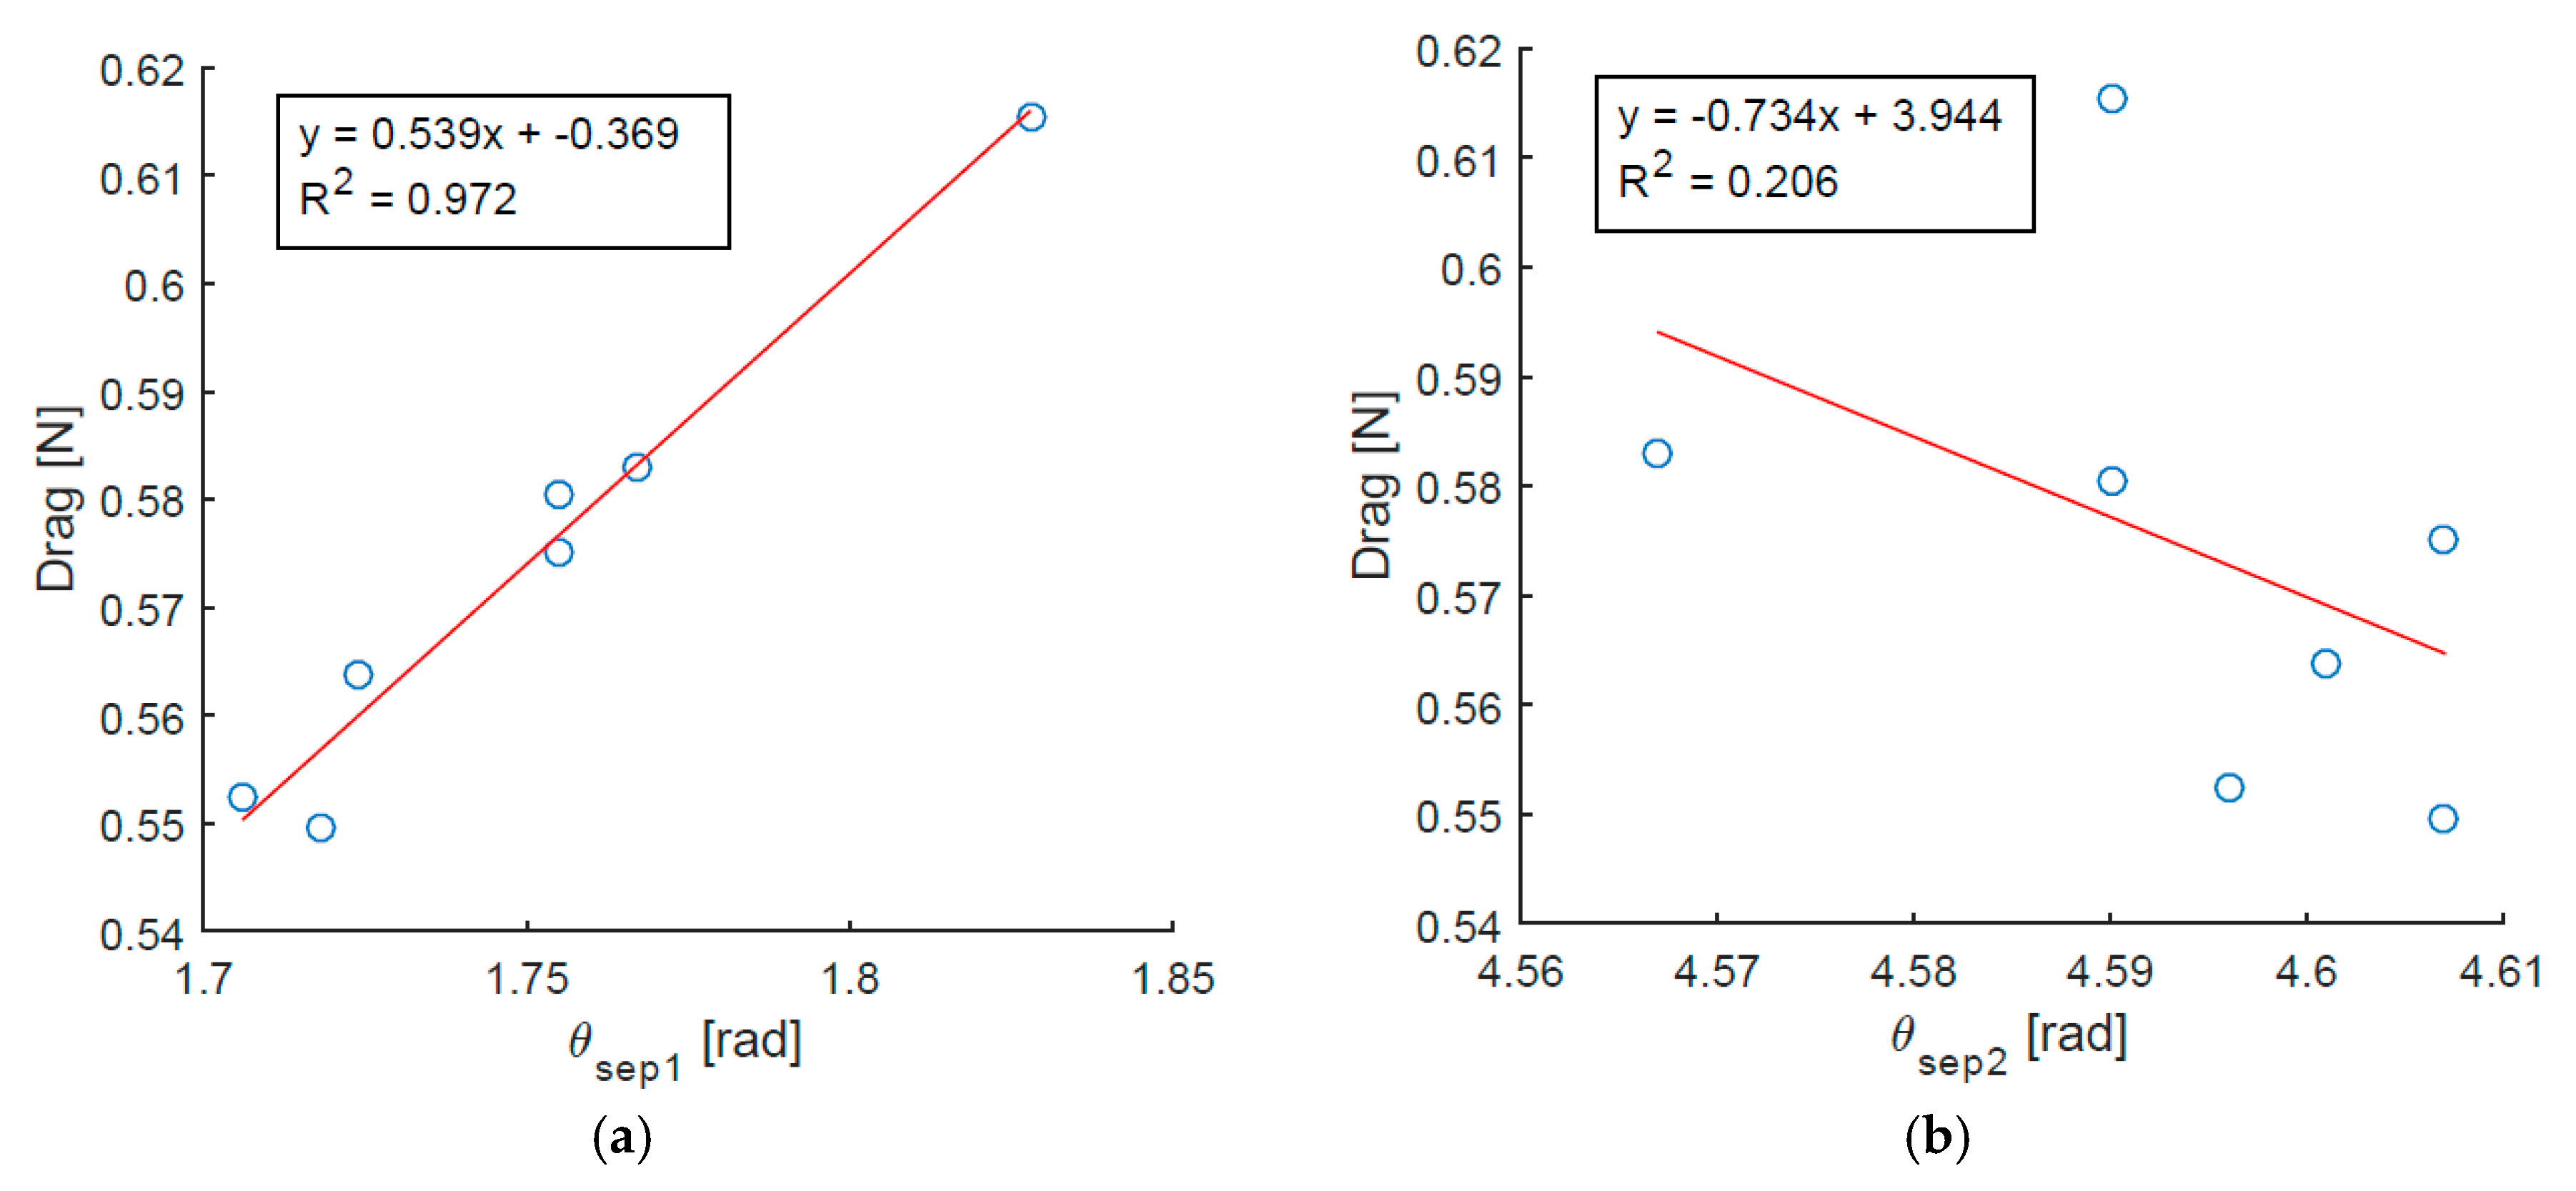
Figure 10.
Comparison of the magnitude of the separation angle (i.e., angle between top and bottom separation points) and the drag force, for the range of actuation frequencies: (a) Change in with ; (b) Change in drag force with .
Figure 10.
Comparison of the magnitude of the separation angle (i.e., angle between top and bottom separation points) and the drag force, for the range of actuation frequencies: (a) Change in with ; (b) Change in drag force with .
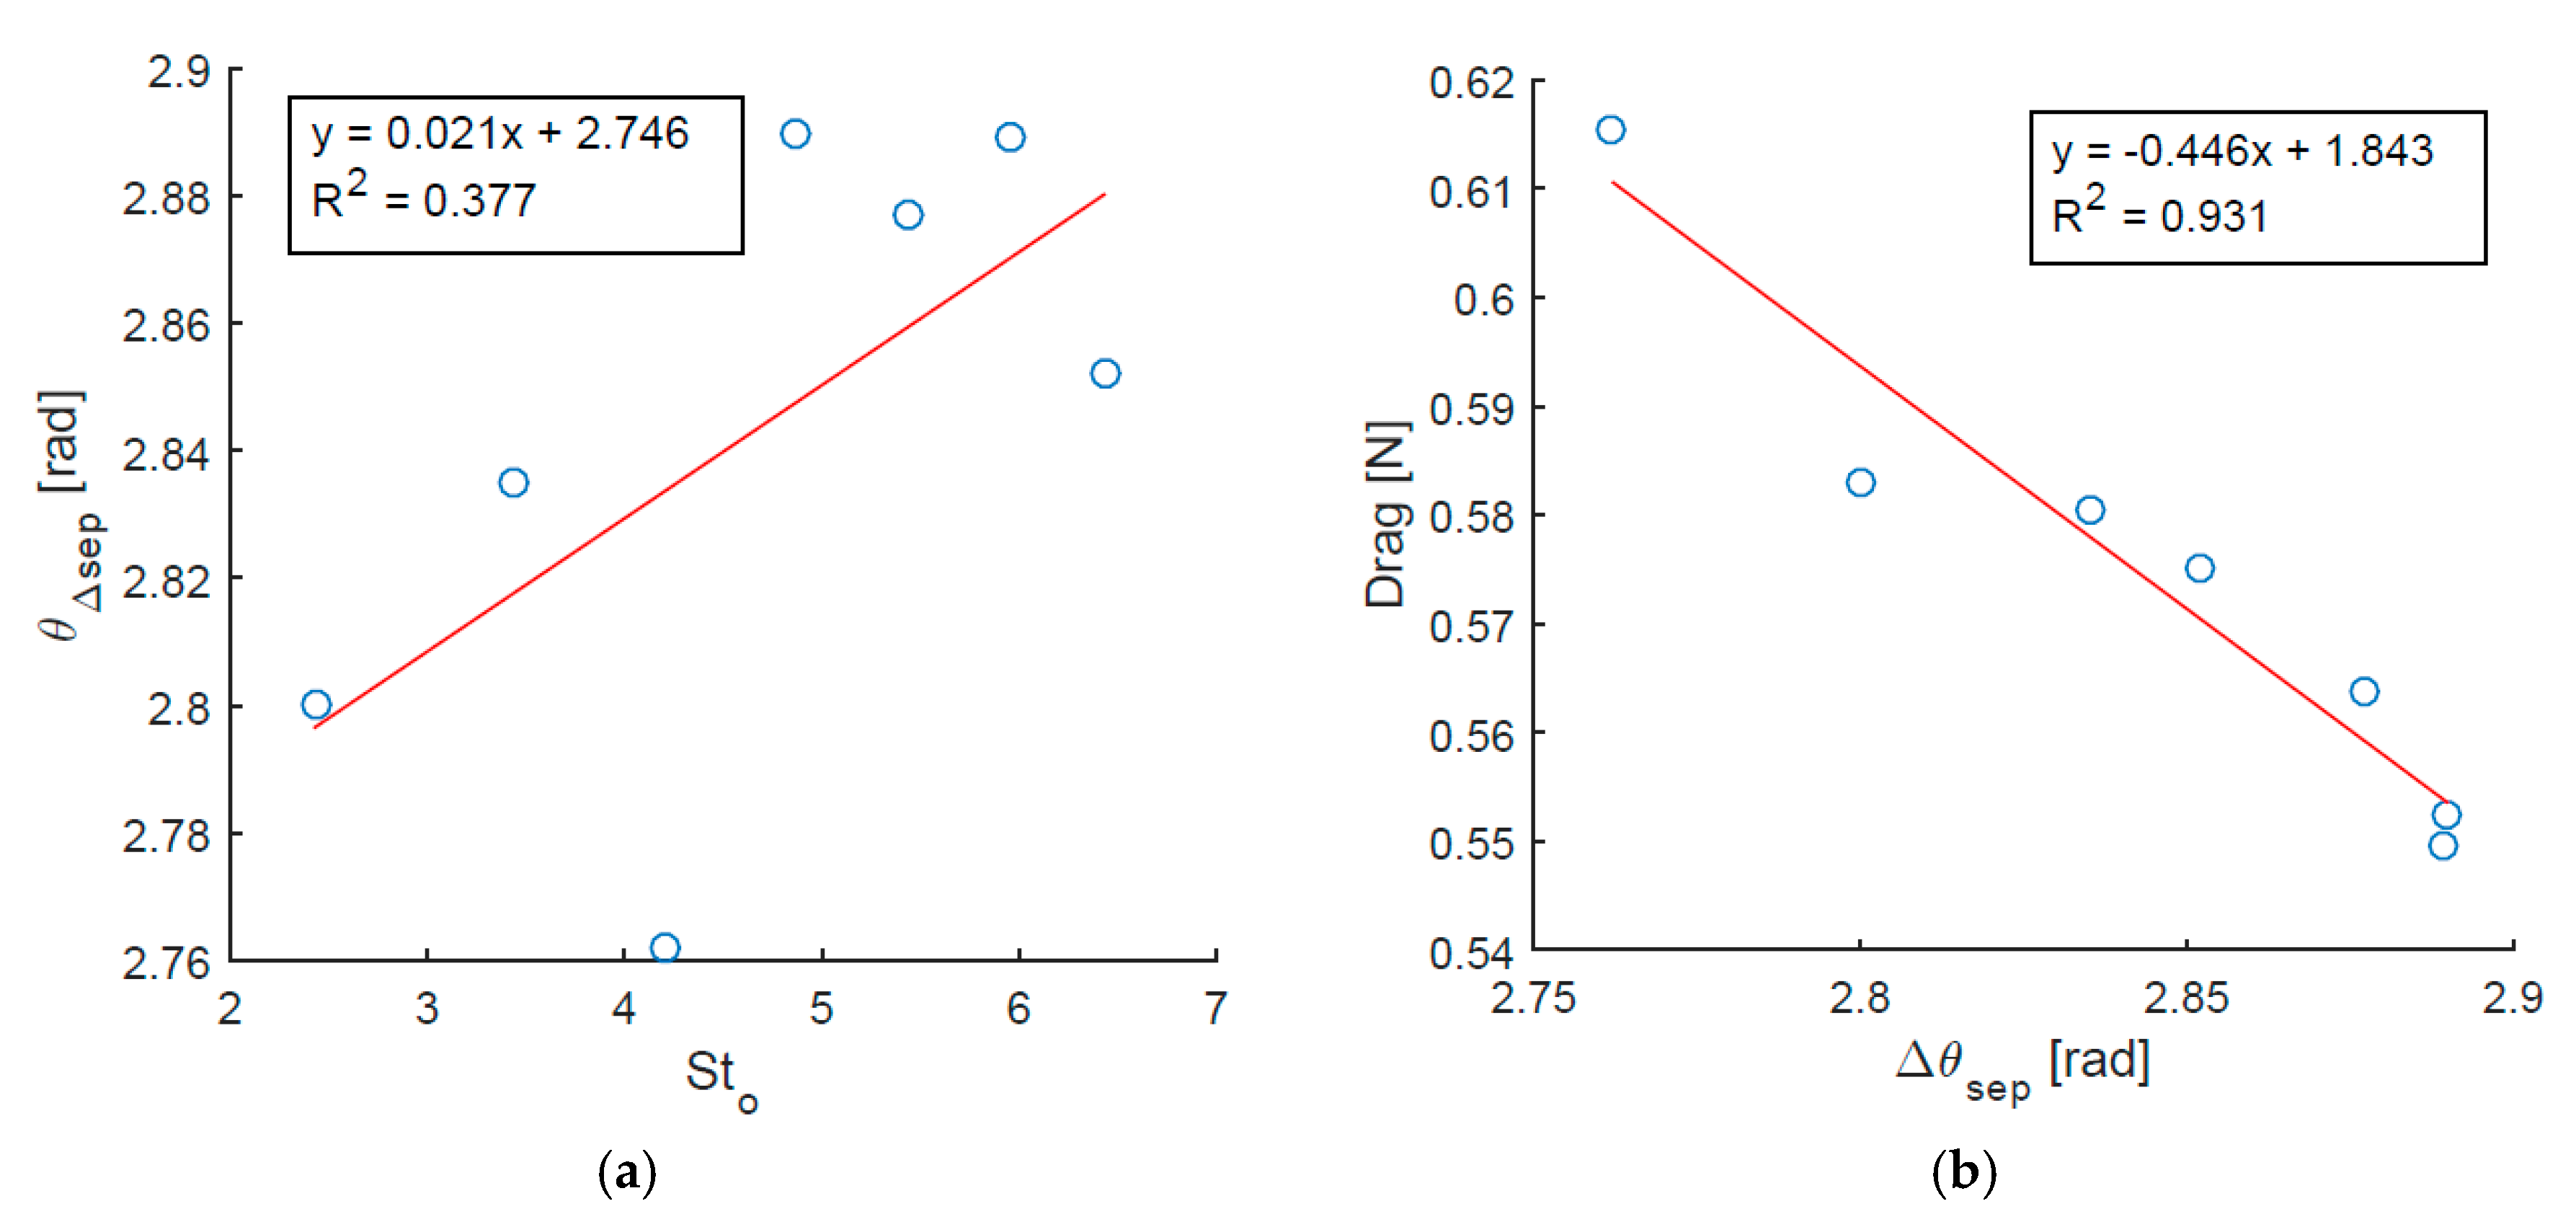
Figure 11.
Change in drag force and minimum pressure over the rear of the cylinder as a function of : (a) Change in pressure and drag with ; (b) Change in drag with pressure.
Figure 11.
Change in drag force and minimum pressure over the rear of the cylinder as a function of : (a) Change in pressure and drag with ; (b) Change in drag with pressure.
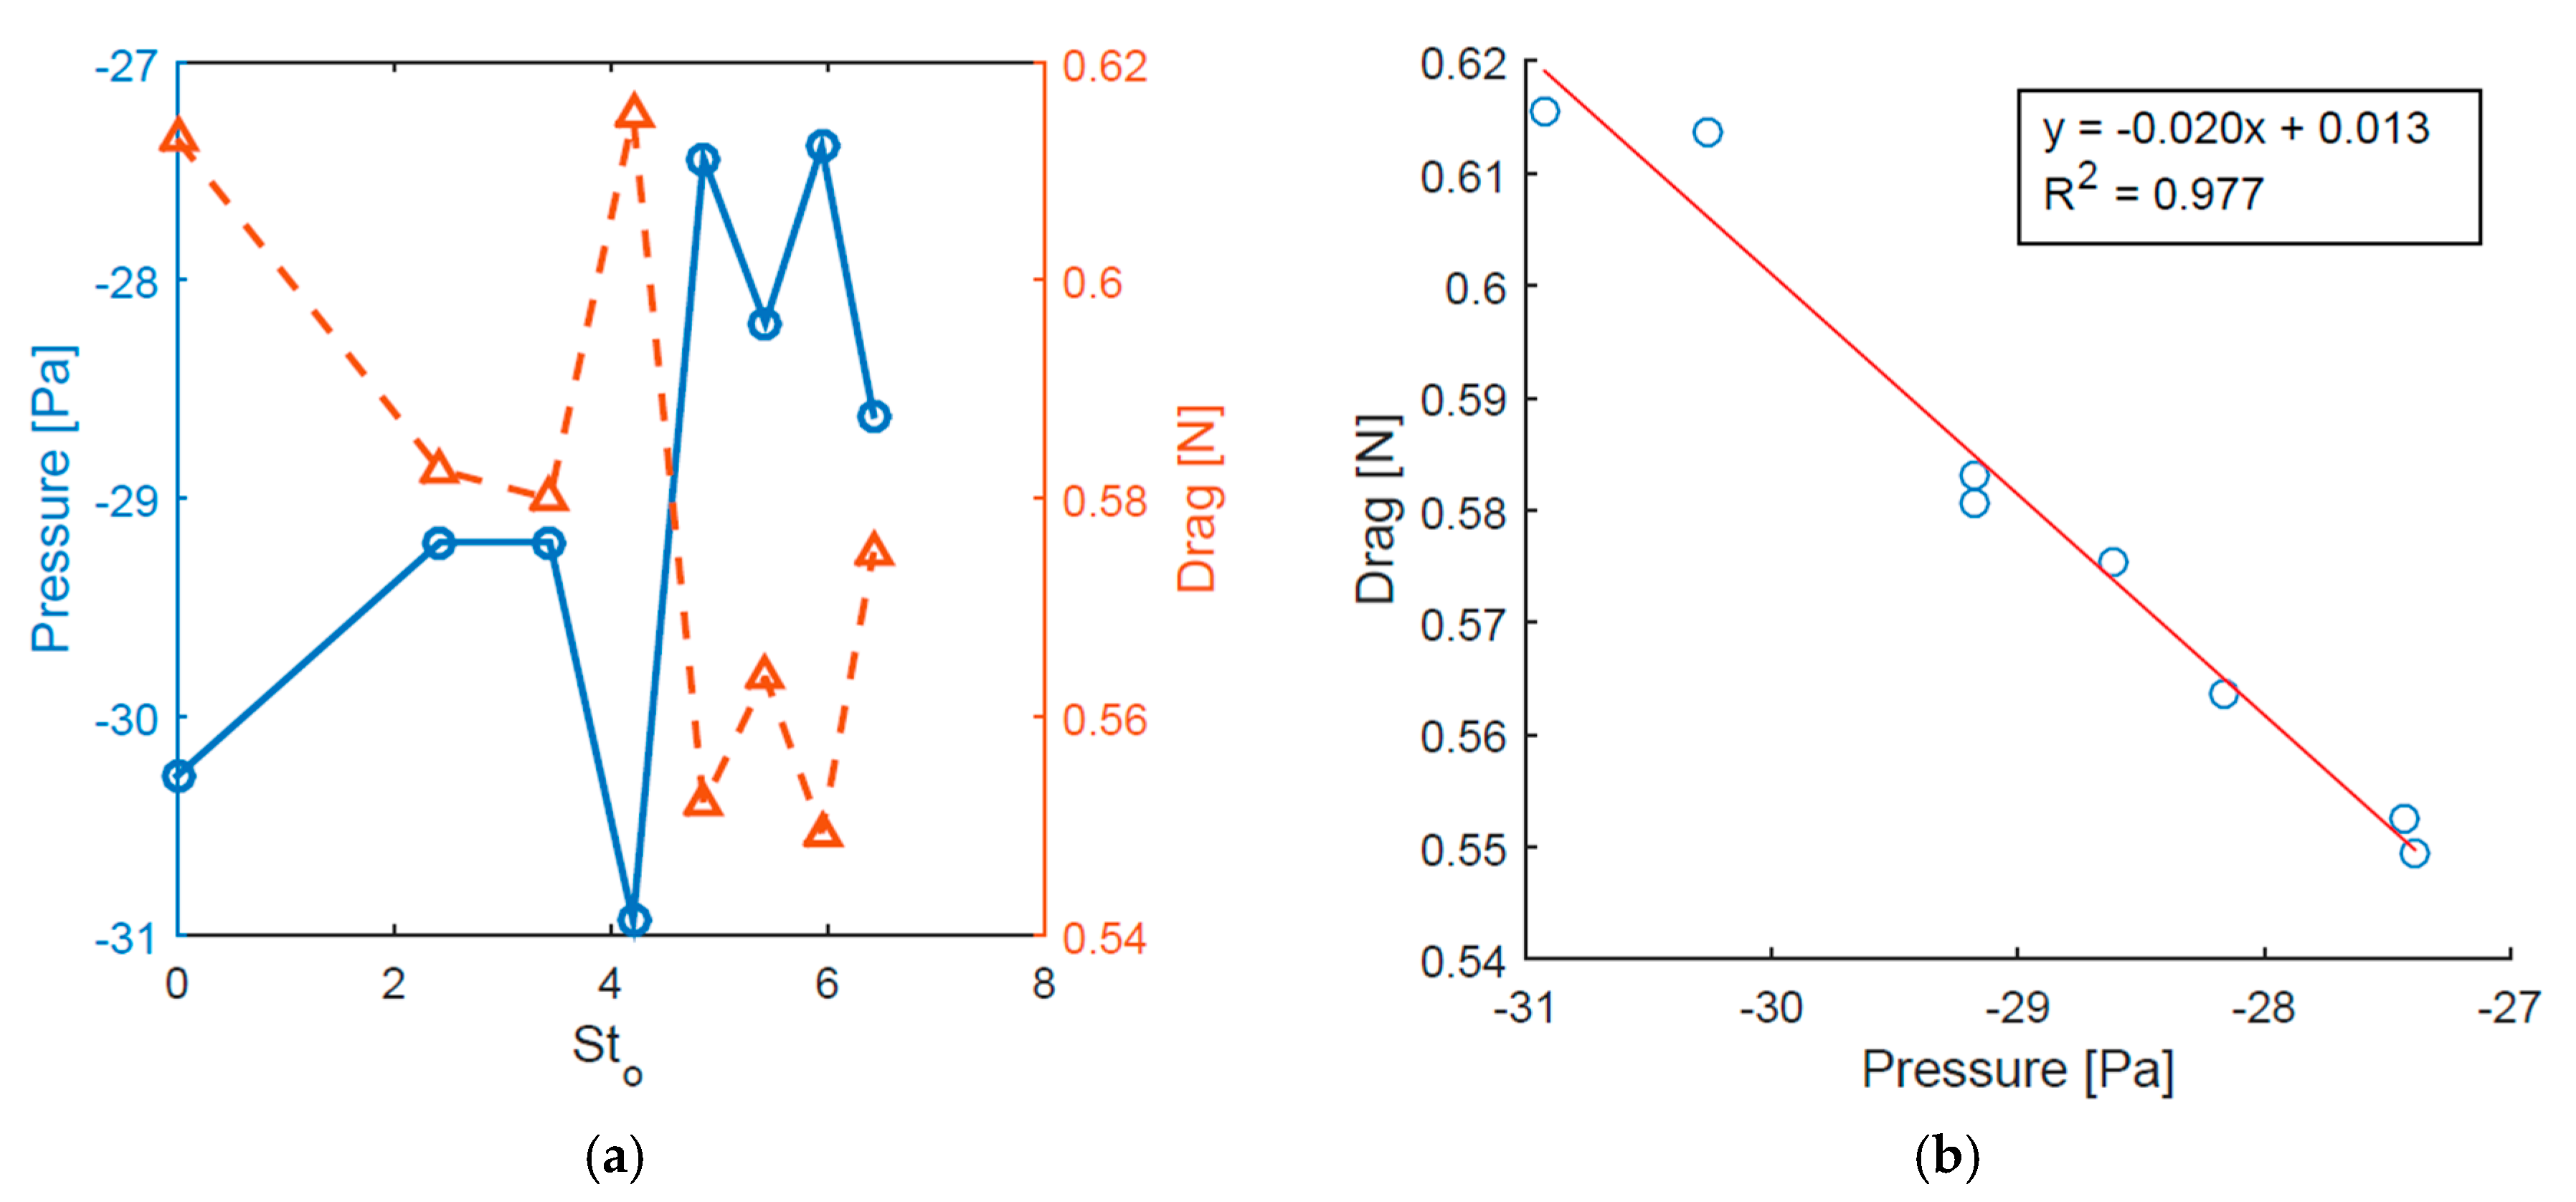
Figure 12.
Effect of time and spatially averaged turbulence intensity at the rear of the cylinder on as a function of : (a) Change in turbulence intensity and with ; (b) Change in with turbulence intensity.
Figure 12.
Effect of time and spatially averaged turbulence intensity at the rear of the cylinder on as a function of : (a) Change in turbulence intensity and with ; (b) Change in with turbulence intensity.

Figure 13.
Alteration of pressure gradient across the jet orifice and the corresponding near-wake turbulence intensity as a function of : (a) Change in turbulence intensity and with ; (b) Change in turbulence intensity with .
Figure 13.
Alteration of pressure gradient across the jet orifice and the corresponding near-wake turbulence intensity as a function of : (a) Change in turbulence intensity and with ; (b) Change in turbulence intensity with .
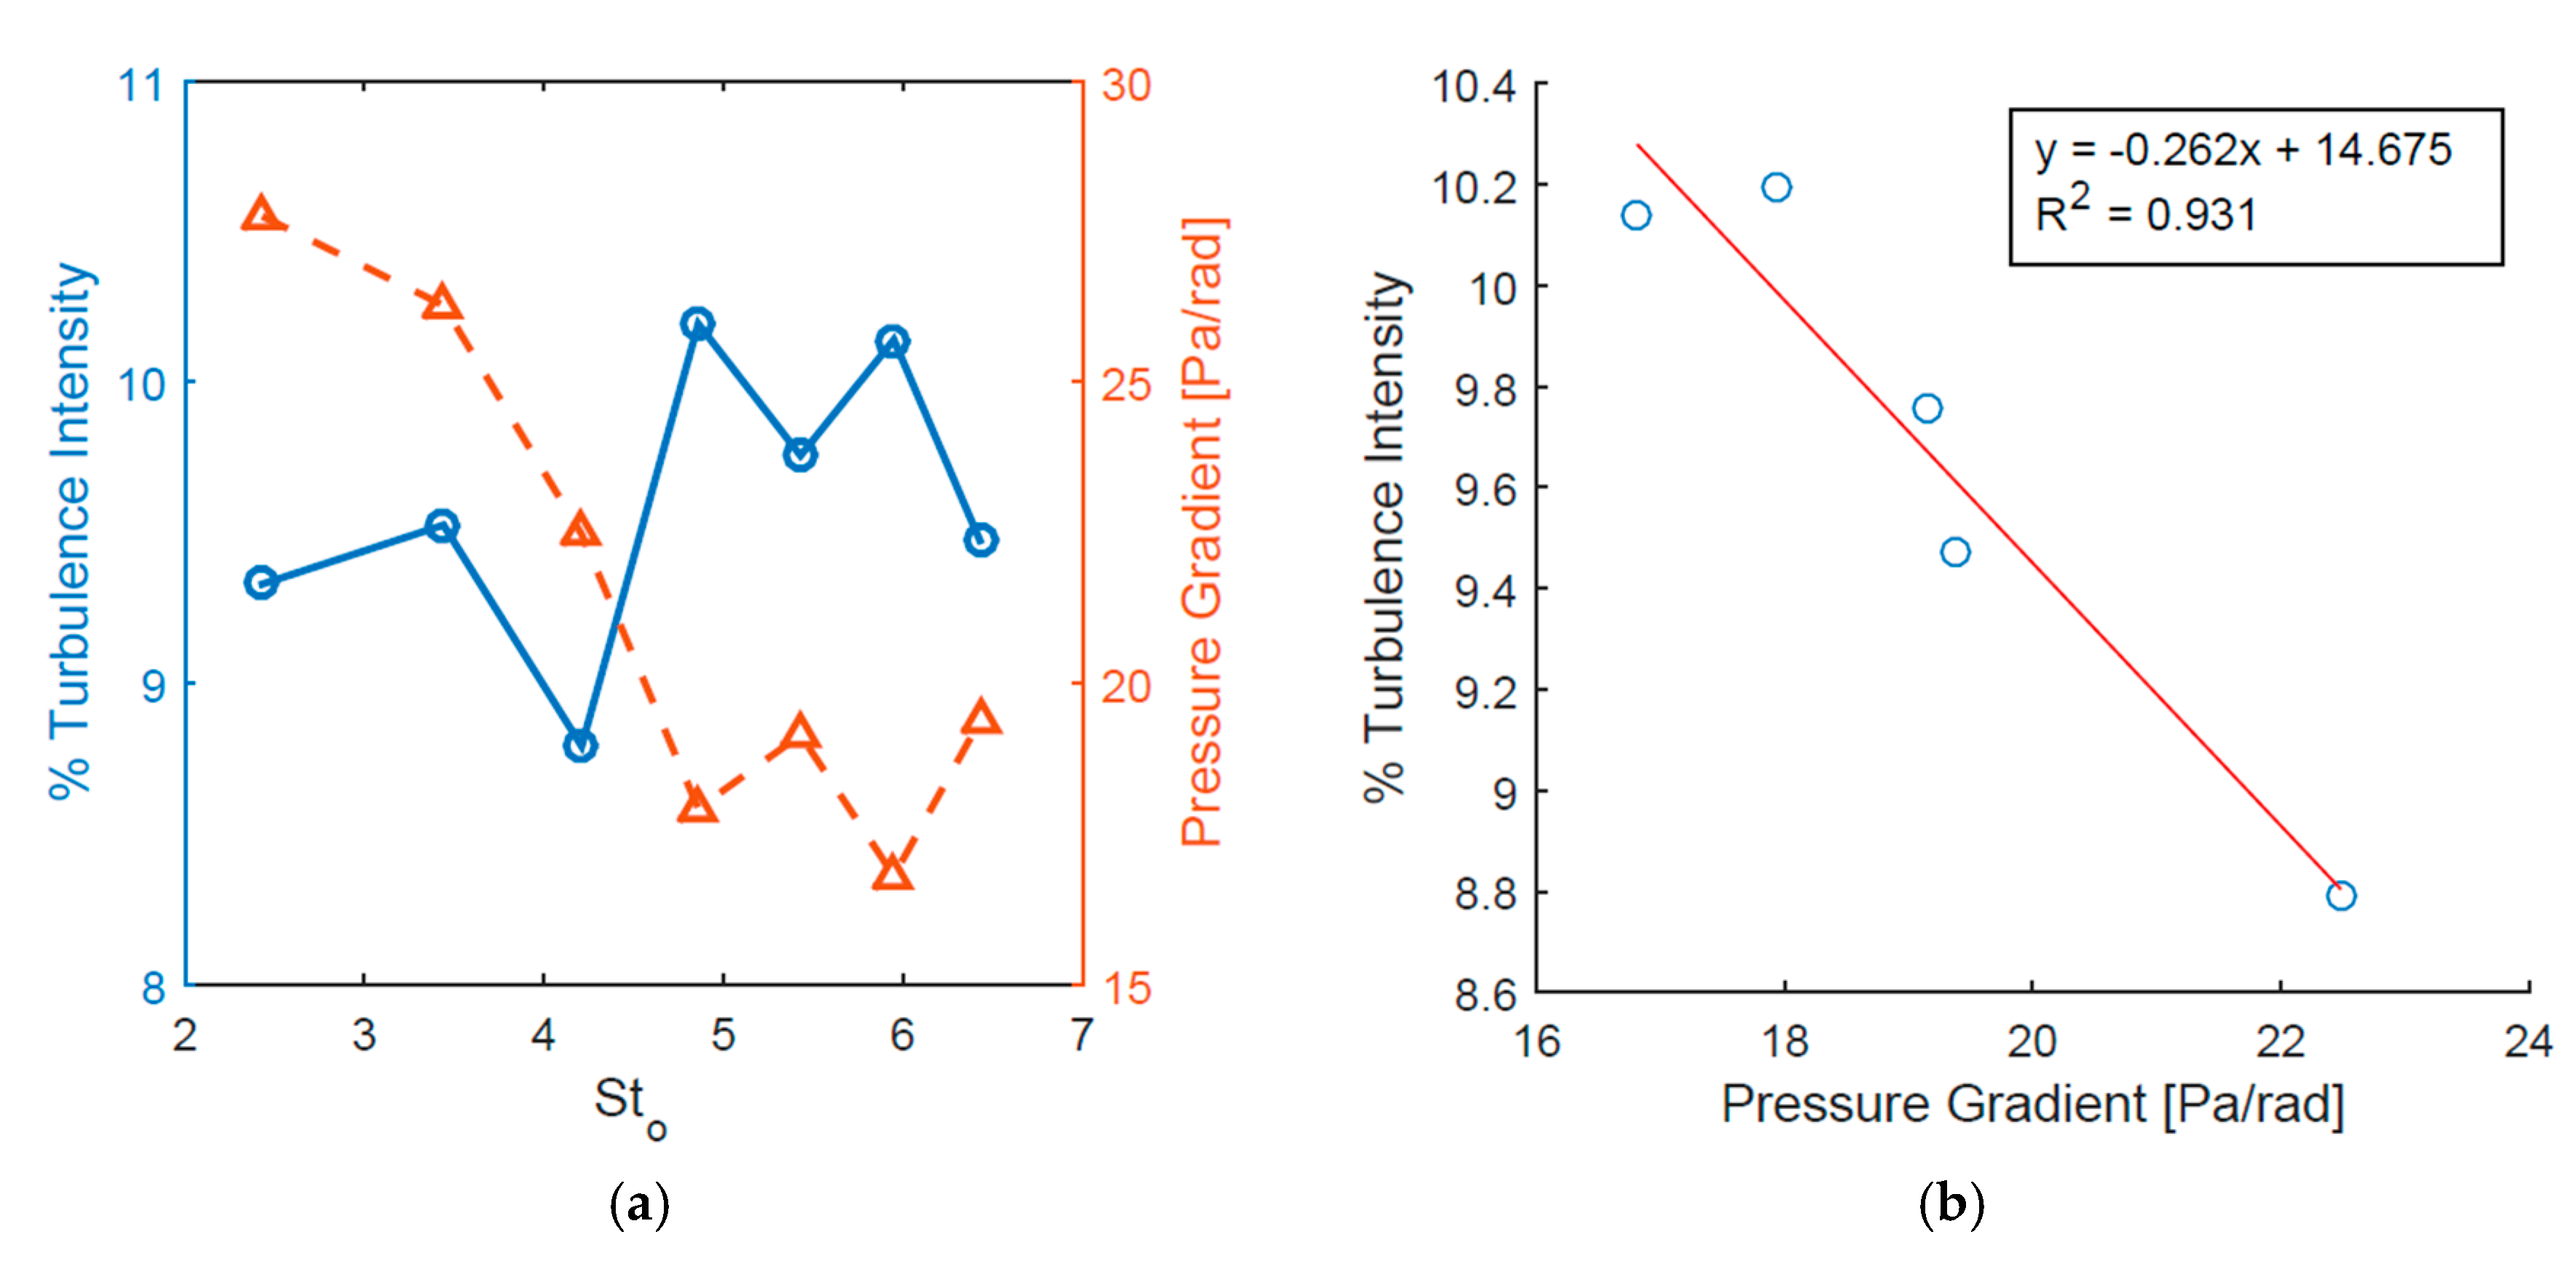
Figure 14.
Change in the surface pressure coefficient distribution: (a) = 2.43, and = 1.62; (b) = 4.86, and = 1.53.
Figure 14.
Change in the surface pressure coefficient distribution: (a) = 2.43, and = 1.62; (b) = 4.86, and = 1.53.
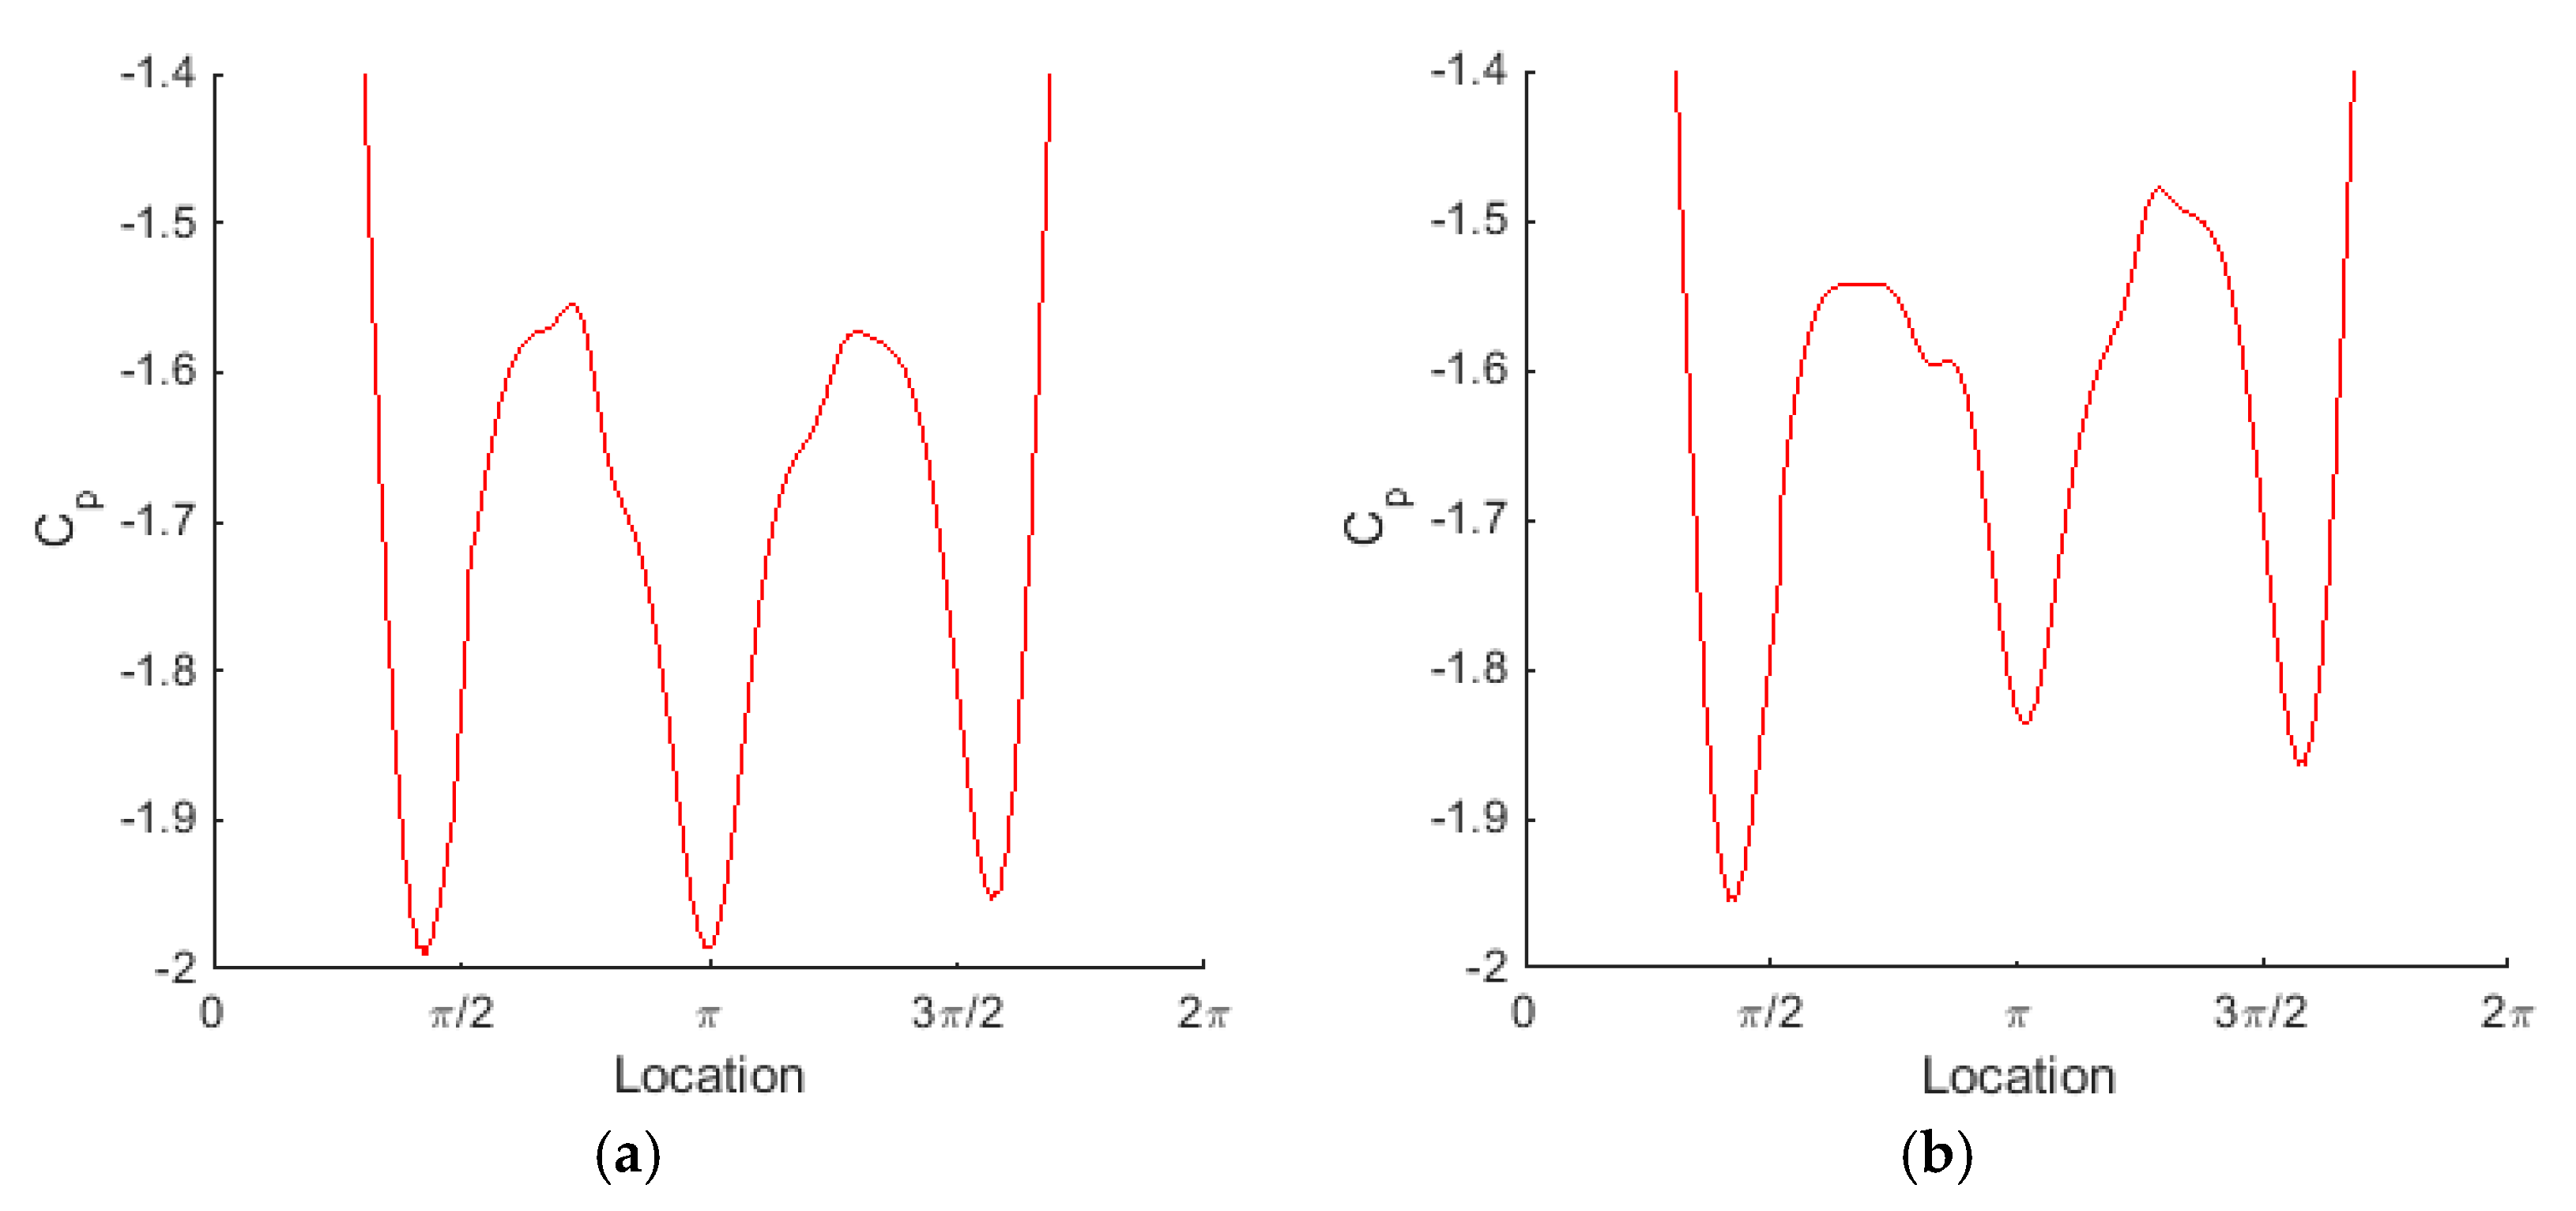
Figure 15.
Time and spatially averaged turbulence intensity in the lee of the cylinder, for a range of synthetic jet actuation frequencies, with corresponding Stokes number values of (‒‒o‒‒) , (‒‒x‒‒) , (‒‒Δ‒‒) , (‒‒□‒‒) , (- - o - -) , (- - x - -) , (- - Δ - -) , (- - □ - -) .
Figure 15.
Time and spatially averaged turbulence intensity in the lee of the cylinder, for a range of synthetic jet actuation frequencies, with corresponding Stokes number values of (‒‒o‒‒) , (‒‒x‒‒) , (‒‒Δ‒‒) , (‒‒□‒‒) , (- - o - -) , (- - x - -) , (- - Δ - -) , (- - □ - -) .


Table 1.
Effect of mesh density on characteristic dimensionless numbers averaged over the quasi-steady portion of flow time after 20 seconds of simulated flow time, for a cylinder in cross-flow at 𝑅𝑒 = 3900. Percentage values in brackets represent deviations for all results to values reported by Catalano et al. [25] and Beaudan and Moin [35].
| Mesh Size | Drag Coefficient | RMS Lift Coefficient | Vortex Shedding | Calculation Time (Approx.) |
|---|---|---|---|---|
| 66,000 | 1.63 (error = −6%) | 1.22 (error = −14%) | 0.36 (error = +37%) | 24 hours |
| 113,000 | 1.66 (error = −5%) | 1.28 (error = −10%) | 0.32 (error = +22%) | 48 hours |
| 253,000 | 1.67 (error = −4%) | 1.33 (error = −6%) | 0.29 (error = +10%) | 96 hours |
| 512,000 | 1.69 (error = −3%) | 1.38 (error = −3%) | 0.27 (error = +3%) | 192 hours |
| Literature [25,35] | 1.74 | 1.42 | 0.26 |
Table 2.
Comparison of the results from the present numerical model using the optimal mesh for a cylinder in cross-flow at 𝑅𝑒 = 3900 with results from Catalano et al. [25] and Beaudan and Moin [35].
| Drag Coefficient | RMS Lift Coefficient ’ | Vortex Shedding | Rear Surface Pressure Coefficient | Flow Separation Locations | |
|---|---|---|---|---|---|
| Other published results [25,35] | 1.74 | 1.42 | 0.26 | −2.16 | 72° and 288° [25] 75° and 285° [35] |
| Present study | 1.67 | 1.33 | 0.29 | −2.07 | 77° and 283° |
| Deviation | (−4%) | (−6%) | (+10%) | (+4%) | (3–6%) |
Table 3.
Operating parameters of the synthetic jet actuator in the present study, in terms of the Reynolds number , actuation frequency , Stokes number and Strouhal number .
Table 3.
Operating parameters of the synthetic jet actuator in the present study, in terms of the Reynolds number , actuation frequency , Stokes number and Strouhal number .
| 12 | 0.9 Hz | 2.43 | 2.03 | 0.49 |
| 12 | 1.9 Hz | 3.44 | 1.01 | 0.99 |
| 12 | 2.8 Hz | 4.21 | 0.68 | 1.48 |
| 12 | 3.8 Hz | 4.86 | 0.51 | 1.97 |
| 12 | 4.7 Hz | 5.43 | 0.41 | 2.46 |
| 12 | 5.7 Hz | 5.95 | 0.34 | 2.96 |
| 12 | 6.6 Hz | 6.43 | 0.29 | 3.45 |
© 2017 by the authors. Licensee MDPI, Basel, Switzerland. This article is an open access article distributed under the terms and conditions of the Creative Commons Attribution (CC BY) license (http://creativecommons.org/licenses/by/4.0/).
Share and Cite
MDPI and ACS Style
McDonald, P.; Persoons, T. Numerical Characterisation of Active Drag and Lift Control for a Circular Cylinder in Cross-Flow. Appl. Sci. 2017, 7, 1166. https://doi.org/10.3390/app7111166
AMA Style
McDonald P, Persoons T. Numerical Characterisation of Active Drag and Lift Control for a Circular Cylinder in Cross-Flow. Applied Sciences. 2017; 7(11):1166. https://doi.org/10.3390/app7111166
Chicago/Turabian StyleMcDonald, Philip, and Tim Persoons. 2017. "Numerical Characterisation of Active Drag and Lift Control for a Circular Cylinder in Cross-Flow" Applied Sciences 7, no. 11: 1166. https://doi.org/10.3390/app7111166
Note that from the first issue of 2016, this journal uses article numbers instead of page numbers. See further details here.