Article

Vision-Based Perception and Classification of Mosquitoes Using Support Vector Machine

1
Department of Robotics and Mechatronics, Tokyo Denki University, Tokyo 120-8551, Japan
2
SUTD-JTC I 3 Centre, Singapore University of Technology and Design, Singapore 487372, Singapore
3
Engineering Product Development Pillar, Singapore University of Technology and Design, Singapore 487372, Singapore
4
Department of Biomedical Engineering, National University of Singapore, Singapore 117583, Singapore
*
Author to whom correspondence should be addressed.
Appl. Sci. 2017, 7(1), 51; https://doi.org/10.3390/app7010051
Submission received: 3 October 2016 / Revised: 14 December 2016 / Accepted: 27 December 2016 / Published: 5 January 2017

Abstract

:
The need for a novel automated mosquito perception and classification method is becoming increasingly essential in recent years, with steeply increasing number of mosquito-borne diseases and associated casualties. There exist remote sensing and GIS-based methods for mapping potential mosquito inhabitants and locations that are prone to mosquito-borne diseases, but these methods generally do not account for species-wise identification of mosquitoes in closed-perimeter regions. Traditional methods for mosquito classification involve highly manual processes requiring tedious sample collection and supervised laboratory analysis. In this research work, we present the design and experimental validation of an automated vision-based mosquito classification module that can deploy in closed-perimeter mosquito inhabitants. The module is capable of identifying mosquitoes from other bugs such as bees and flies by extracting the morphological features, followed by support vector machine-based classification. In addition, this paper presents the results of three variants of support vector machine classifier in the context of mosquito classification problem. This vision-based approach to the mosquito classification problem presents an efficient alternative to the conventional methods for mosquito surveillance, mapping and sample image collection. Experimental results involving classification between mosquitoes and a predefined set of other bugs using multiple classification strategies demonstrate the efficacy and validity of the proposed approach with a maximum recall of 98%.

1. Introduction

It is estimated that half of the world’s population is under the risk of dengue fever, spread by mosquitoes [1]. It is also identified that approximately 390 million dengue infections are identified every year around the globe [2]. There is also evidence of the outbreak of combined infections of dengue and chikungunya pathogens in human beings [3]. Even a typical dengue vaccine such as Sanofi Pasteur CYD-TDV shows an efficiency of only 65.5% among people in the age group of above nine years and 44.6% in children younger than nine years [4]. The major transmission vectors of zika, dengue, yellow fever and chikungunya include mosquitoes such as Aedes, Culex and Anopheles [5,6]. The inference from the analysis of research works related to mosquito-transmitted diseases demands the development of an efficient automated system for detection, surveillance and classification of mosquitoes.
Several works have reported the prediction and mapping of geographical regions that are vulnerable to mosquito transmitted diseases, by analyzing and manipulating the satellite images. Hay, Snow and Rogers presented an aerial photographic identification of mosquito larva inhabitants through of remote sensing [7]. In this study, the authors indicated the possibility of predicting spatial and temporal distribution of malaria, by analyzing the mosquito larval density and data through remote sensing. A similar technique was used by Zou, Miller and Schmidtmann, where the authors used Global Information System (GIS), and integrated remote sensing methods for estimating the potential larval inhabitants of Culex mosquitoes that transmit the West Nile virus [8]. In addition to the mosquito larva inhabitant analysis on a macroscopic level, there are also works that reported on the analysis of mosquito activities and flight trajectory analysis [9]. In the above-mentioned work, the authors used multiple cameras to extract the flight trajectory of mosquitoes to understand the characteristics of mosquito colonies. Even though several works have reported the geographical distribution of mosquito larva and disease outbreak, minimal focus is given to species-wise classification of mosquitoes, which lights the path for mosquito density mapping and classification.
The mosquito identification method includes DNA analysis, which required a very undeveloped mosquito sample collection method. Moreover, the method requires several laboratory examinations to be performed with an expert supervision [10,11]. Hence, an automated method could be more useful for mosquito classification. Li et al. presented a mosquito classification by spectral analysis of wing beat waveforms followed by an artificial neural network classification system [12]. Results of this study indicated an average accuracy of 72.67% in classifying the mosquito species. Similarly, the work carried out by Moore, Miller, et al. proposed a method for classifying flying insects including the Aedes mosquito by analyzing their wing-beat frequencies [13]. The study indicated success in classifying species and sex of individual insects with an accuracy of 84%. Even though the method of spectral analysis of wing beat waveforms, followed by a trained classifier method, yields success, it is very difficult to acquire the wing-beat waveform from a mosquito inhabitant.
The typical method for vision-based object classification starts with feature extraction, followed by using a trained classifier for classification. Raymer et al. presents a new feature extraction approach that uses genetic algorithm for feature selection, feature extraction, and training classifiers [14]. A method for the order level classification of insects from the images using support vector machine (SVM) and artificial neural network (ANN) has been mentioned by Wang et al. [15], where the authors introduced a novel feature extraction method from the acquired images of insects. In this feature extraction method, body area ratio, eccentricity, upper body length ratio, width ratio, body shape parameter and color complexity parameters of the insects that attribute the uniqueness of the insects are taken into account.
Numerous works have been identified for formulating effective methods for image retrieval and classification. A novel computer chip defect detection method was discussed in [16] that is more effective and efficient than typical template image comparison methods. In the above-mentioned work, the authors introduce a new methodology that uses phase only Fourier transform (POFT) for saliency detection followed by a local discrepancy evaluation between the test images and defect free images. The work mentioned in [17] presents a novel subspace learning framework called conjunctive patches subspace learning (CPSL) for effective semantic subspace learning. In this work, the authors also demonstrate the effectiveness of the proposed framework in improving the performance of content-based image retrieval (CBIR). Similarly, the research work put forward by Zhang et al. introduces two methods called biased maximum margin analysis (BMMA) and semi-supervised biased maximum margin analysis (SemiBMMA) that reduces the downsides of conventional SVM-based relevant feedback scheme in CBIR [18]. In addition to the image retrieval, significant research works have been identified in formulating classification methods and improving existing methodologies for classification. The work mentioned in [19] presented an effective method for complexity reduction and performance elevation of neural network-based classifications. A novel neuro-SVM-based classification strategy had been proposed for the classification of LIDAR backscatter intensity data in the work mentioned in [20]. From the authors’ perspective, the proposed architecture shows a high prediction accuracy, hence it is most suitable for LIDAR data classification. The work of [21] discusses the usage of a semi-supervised neural network for classification of hyperspectral images. The authors are able to achieve better accuracy in hyperspectral image classification problems. Similarly, the design of efficient artificial neural networks in the context of multi-sensor remote-sensing image classification is mentioned in [22].
Even though both ANN- and SVM-based methodologies are used in classification and image retrieval scenarios, it is identified that the SVM-based classification could provide more accurate results [23,24,25]. This paper details the design and development of an automated mosquito classification system, concluding with experimental results using the prototype sensor module that validates the proposed approach in classifying mosquitoes from a set of other predefined bugs. The developed system can classify mosquitoes from a set of other predefined bugs such as bees and flies. The main challenges in designing an automated mosquito surveillance system includes the choice of extracted features, classification algorithm and the non-trivial process of implementing theoretical designs generated analytically into physical mechanisms. The proposed approach is environment-friendly, in terms of mosquito surveillance in open or closed drain perimeter, narrow channels and reservoirs, where the satellite mapping and manual examination methods are highly difficult. We analyze the morphological characteristics that distinguish the mosquitoes from other insects and provide color-based analysis for distinguishing the mosquito species. Our long-term objective is to deploy the developed mosquito classification system on a mobile robotic platform, capable of autonomously synthesizing mosquito-vector-density maps across larger areas.
The rest of the paper is organized as follows: Section 2 presents the method used in this paper. Section 2.1 shows the system overview of the developed sensor module. Section 2.2 discusses the feature extraction method implemented. Section 2.3 introduces the SVM-based classification process used. Section 3 presents the experiments involving 400 images of mosquitoes and a predefined set of other insects to validate our approach. Lastly, Section 4 concludes this study and discusses the future work.

2. Methods

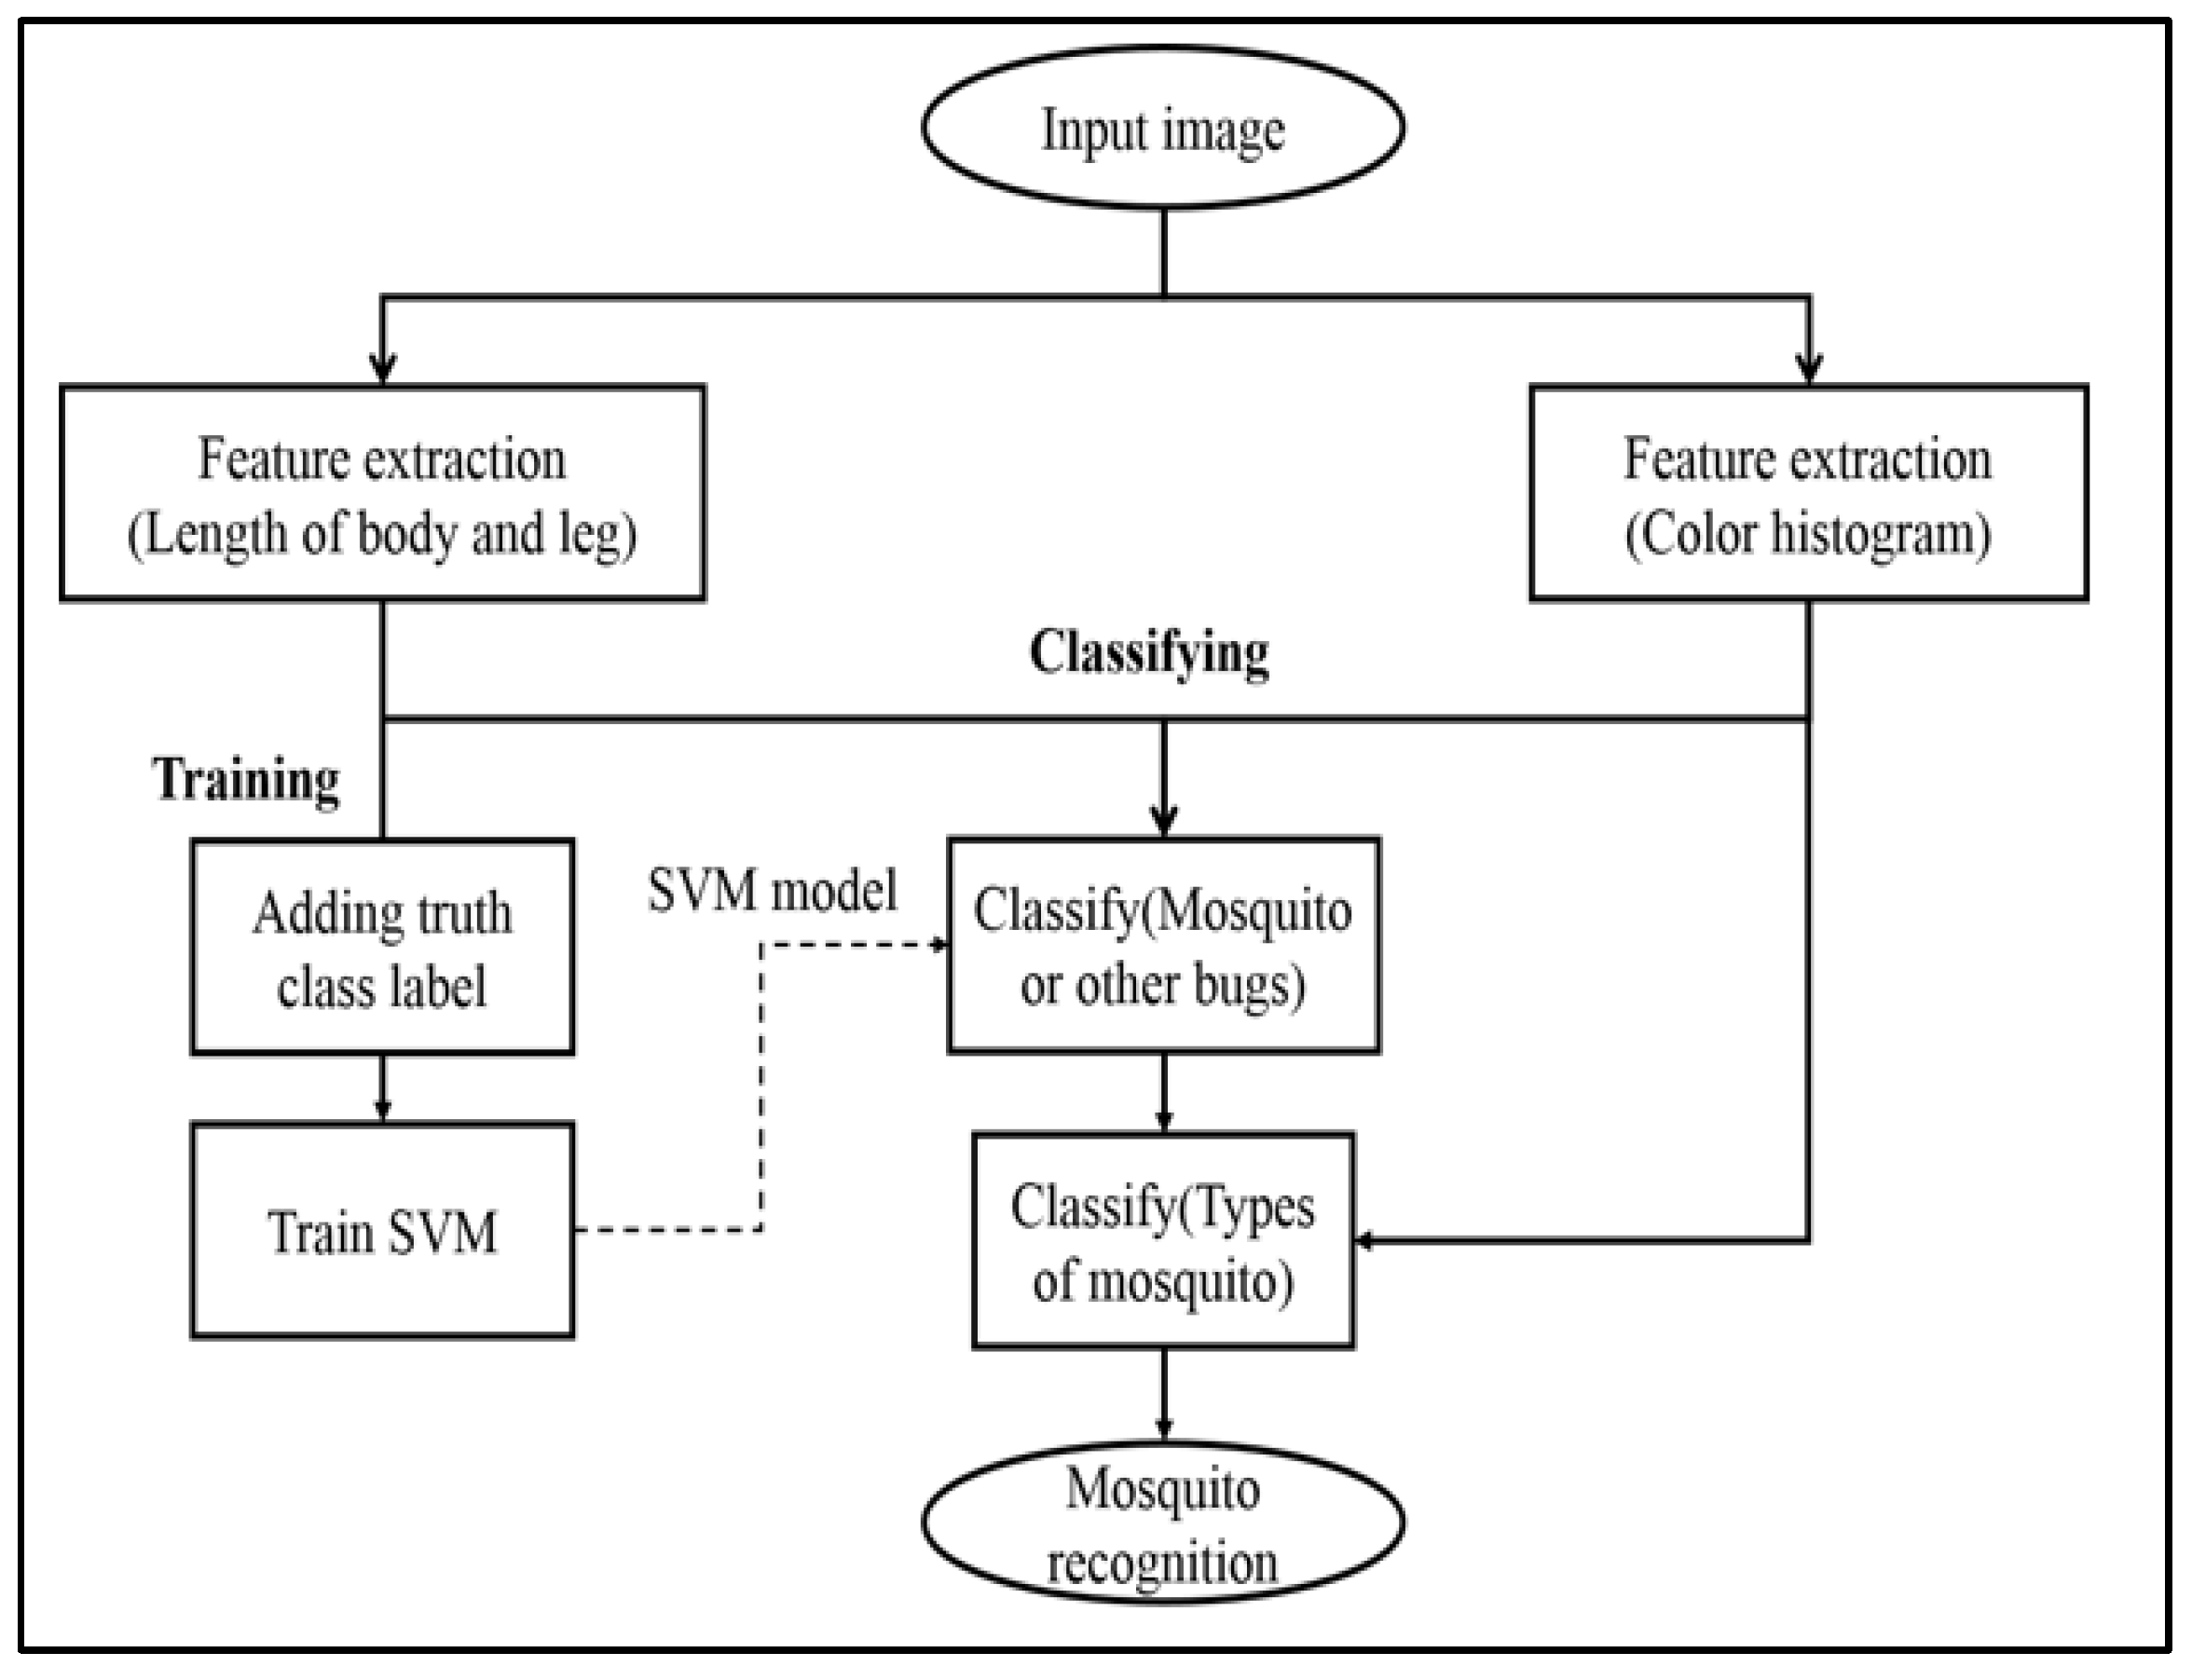
2.1. The System Overview

We structured a system for classification of mosquitoes among other insects based on vast research literature that deals with pattern and object recognition approaches applied to diverse application domains. Object recognition is usually performed by using a feature extraction method followed by a trained classification. Some of the methods used for the object recognition include SURF [26] or SIFT [27] feature extraction with Bag of visual word (BoW) representation of features, and training SVM [28]. This typical method for feature extraction and classification forms the basis of our work. The first step in this system of classification is image segmentation using split-and-merge algorithm to isolate the insect of interest from the background region. After the image pre-processing, the feature extraction is carried out in the images of every specimen. The morphological and color-based features are extracted from the images simultaneously. Once the set of features are extracted they are combined together and truth class labelling is done for these combined features.
The truth class labelling will cluster the extracted features, and the resultant clusters are used for the purpose of training the SVM classifiers. Figure 1 shows the architecture diagram of the mosquito classification system. We implemented the whole system in C++ platform linked with OpenCV 2.4.1 library on a PC with Windows system. OpenCV 2.4.1 is a portable, architecture neutral and open source computer vision library.

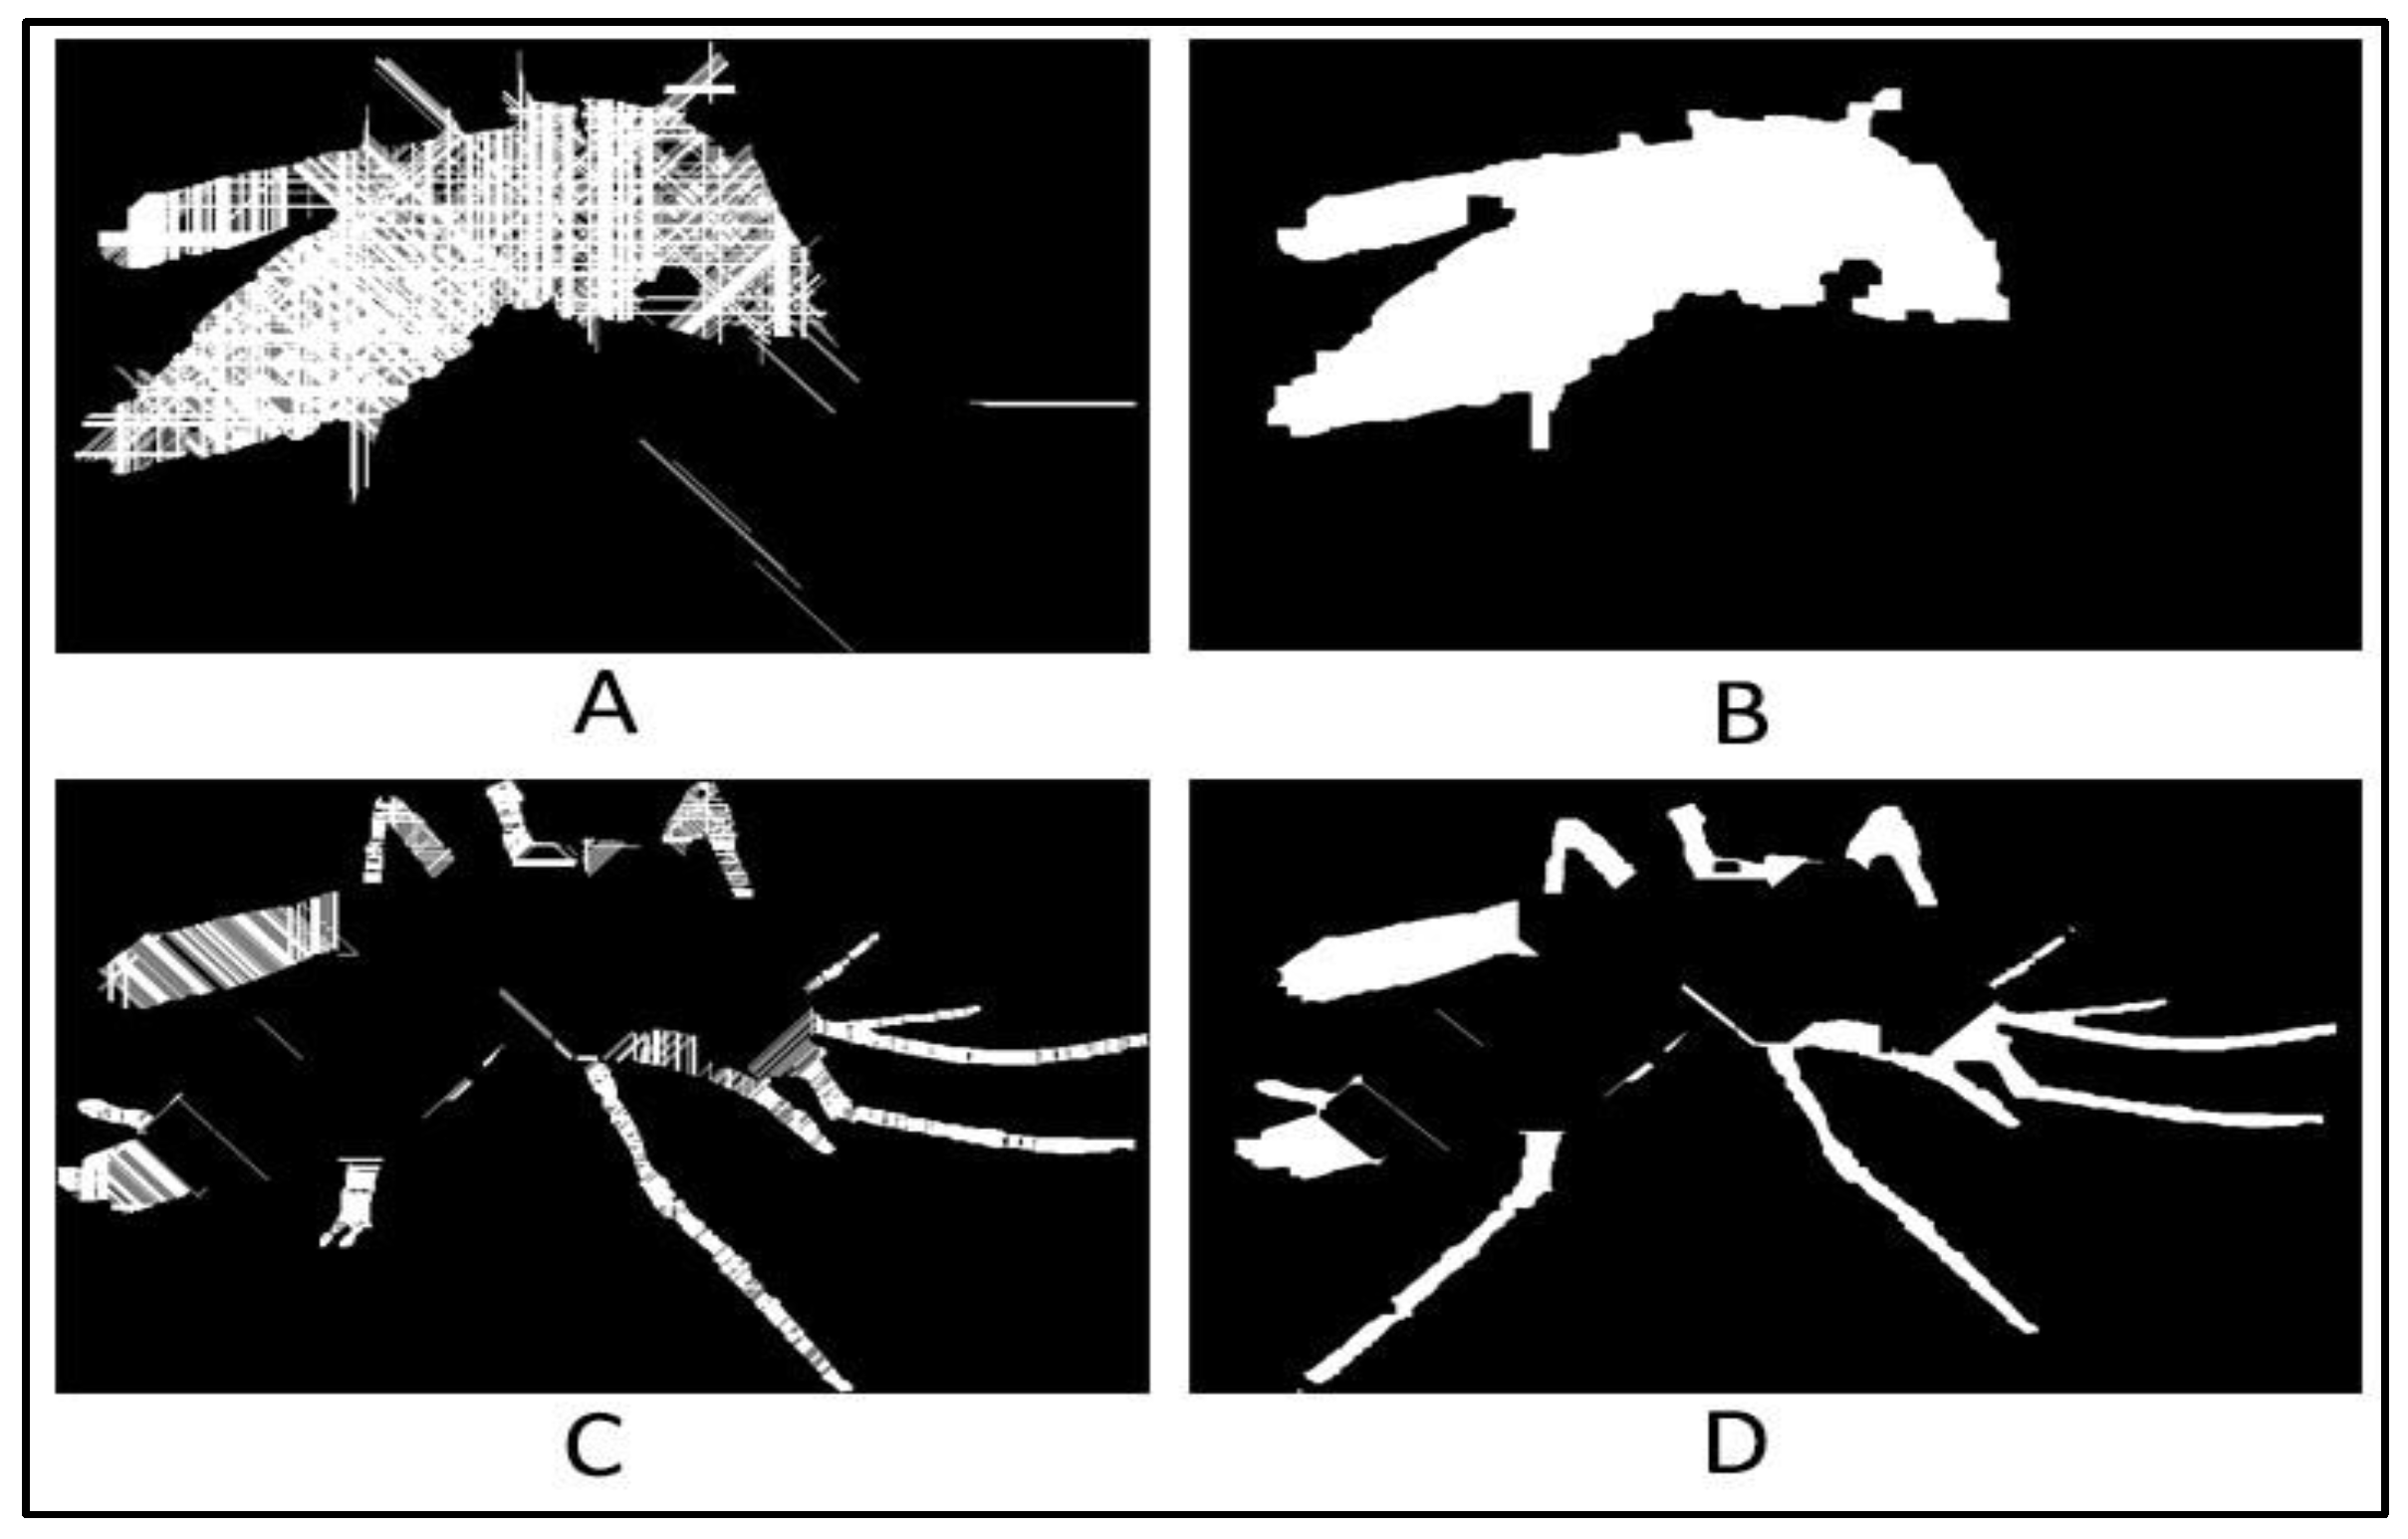
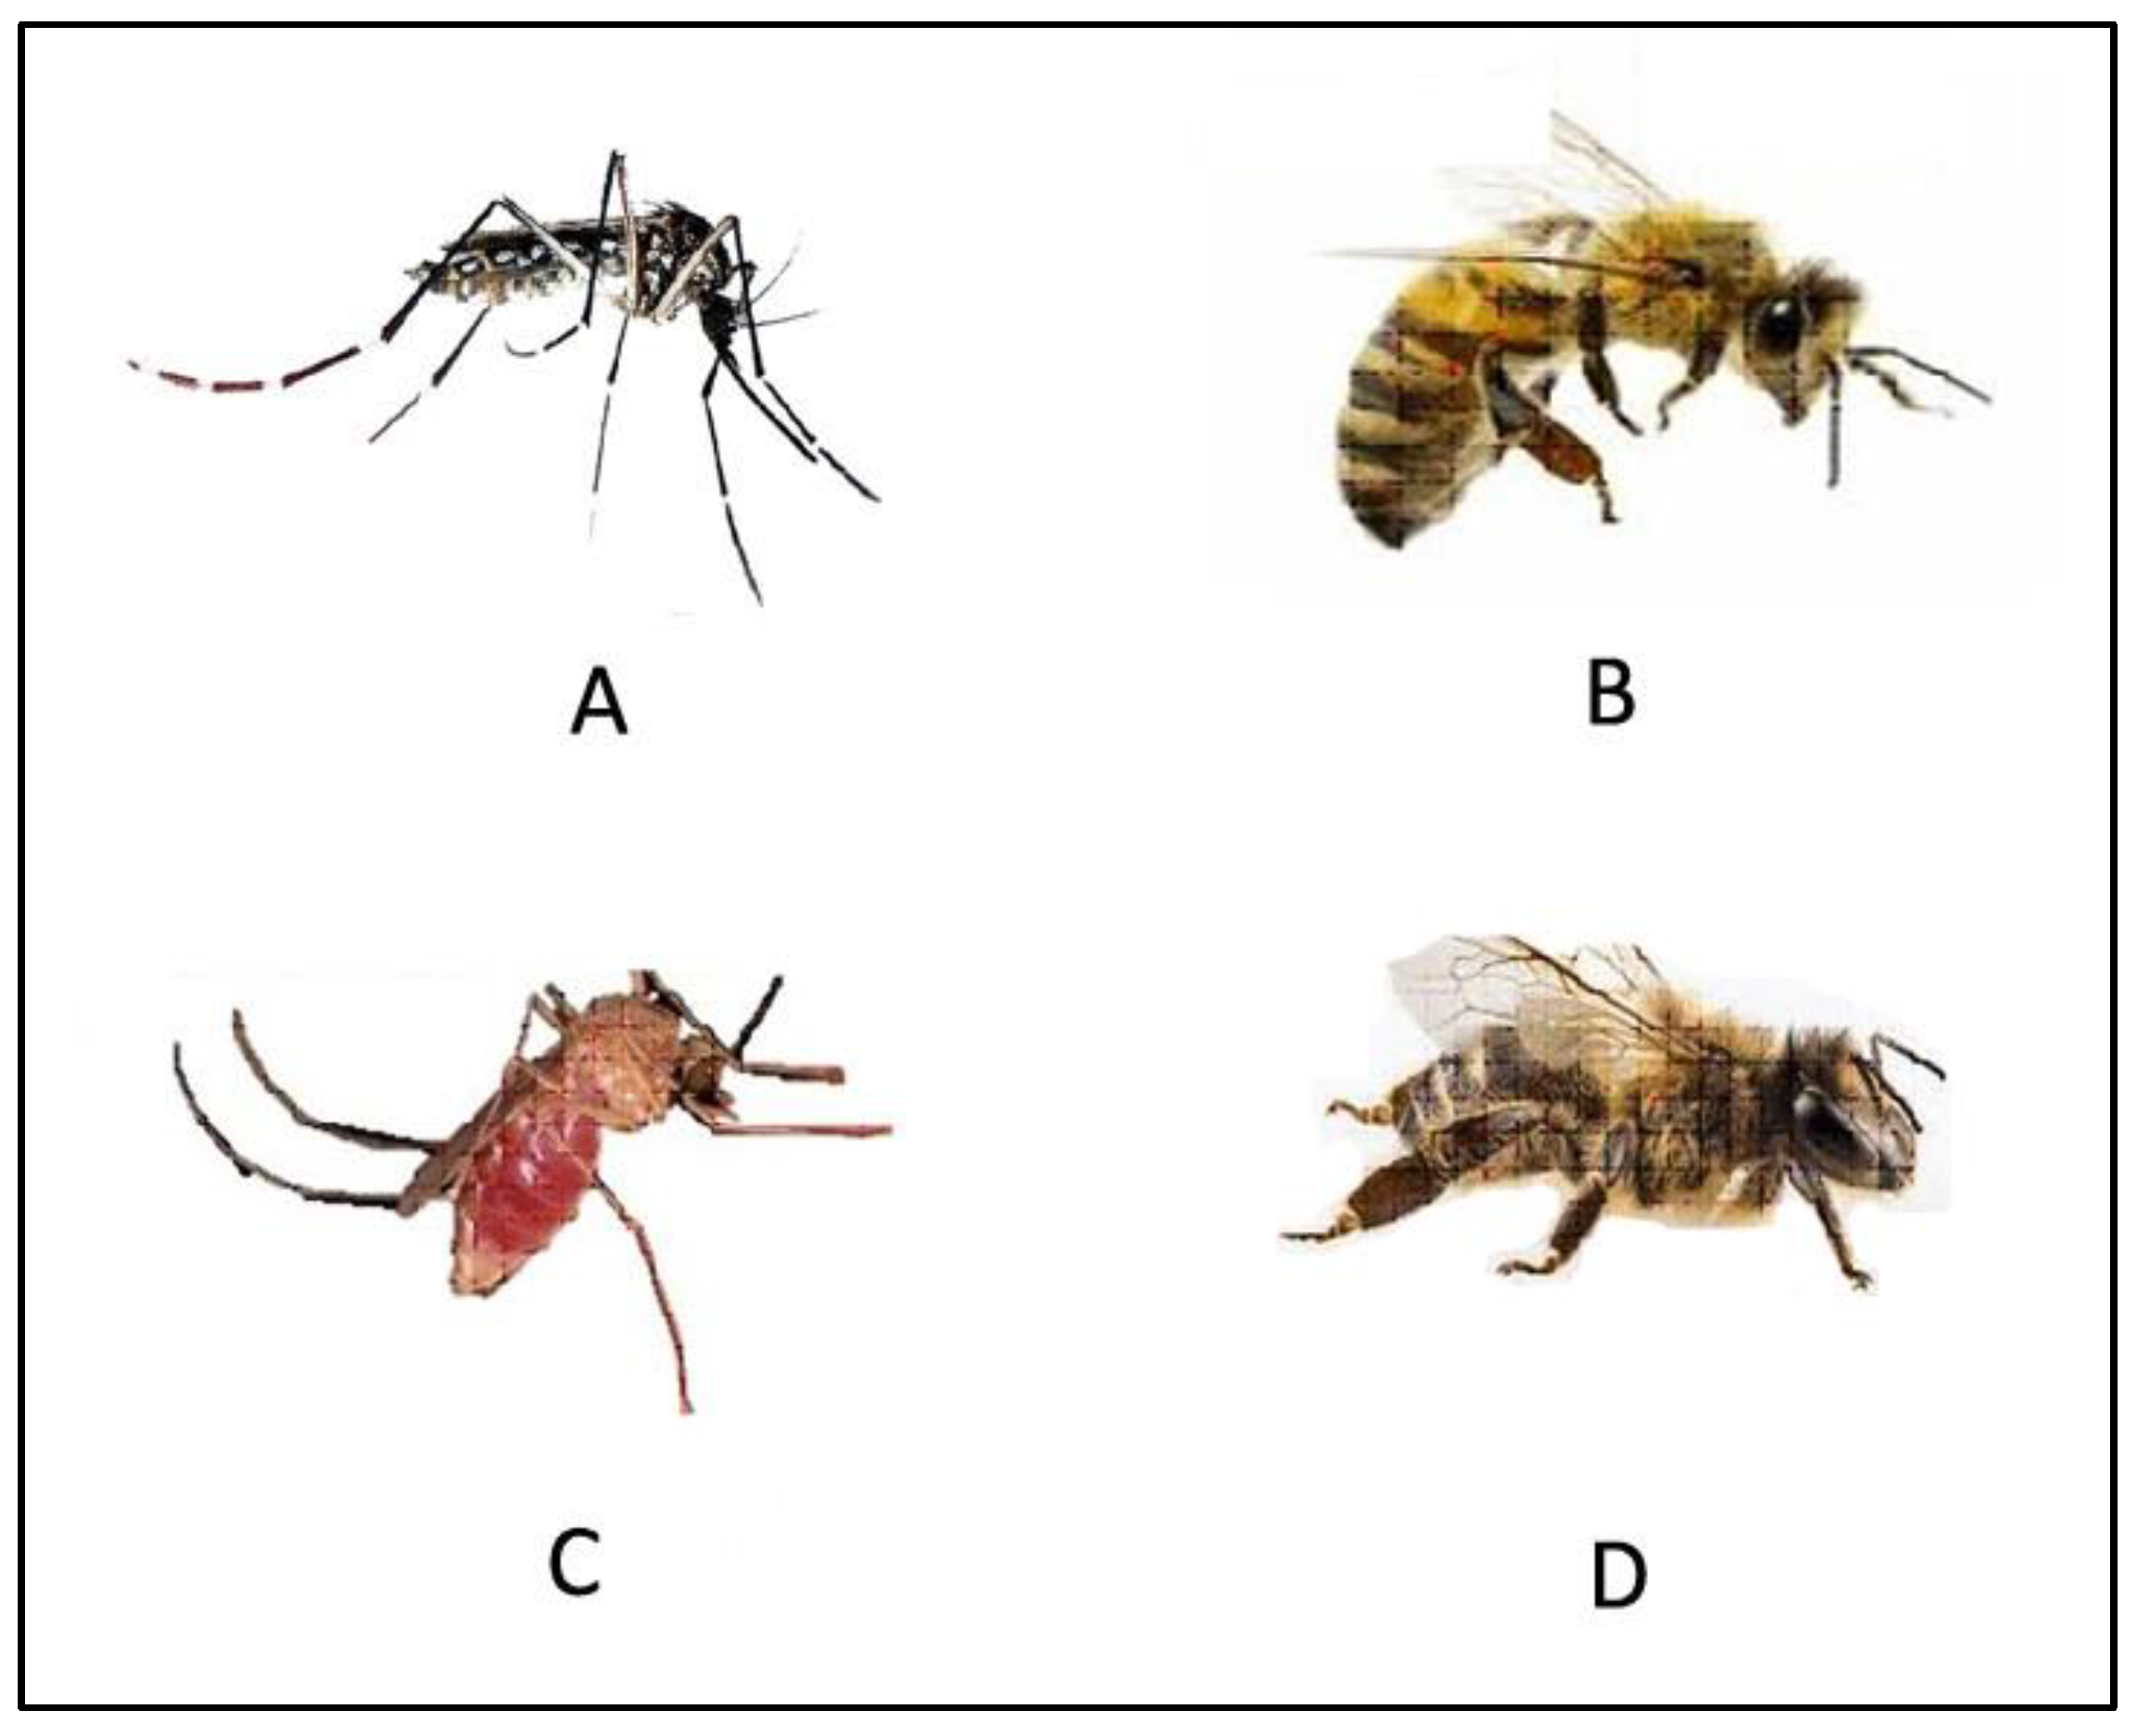
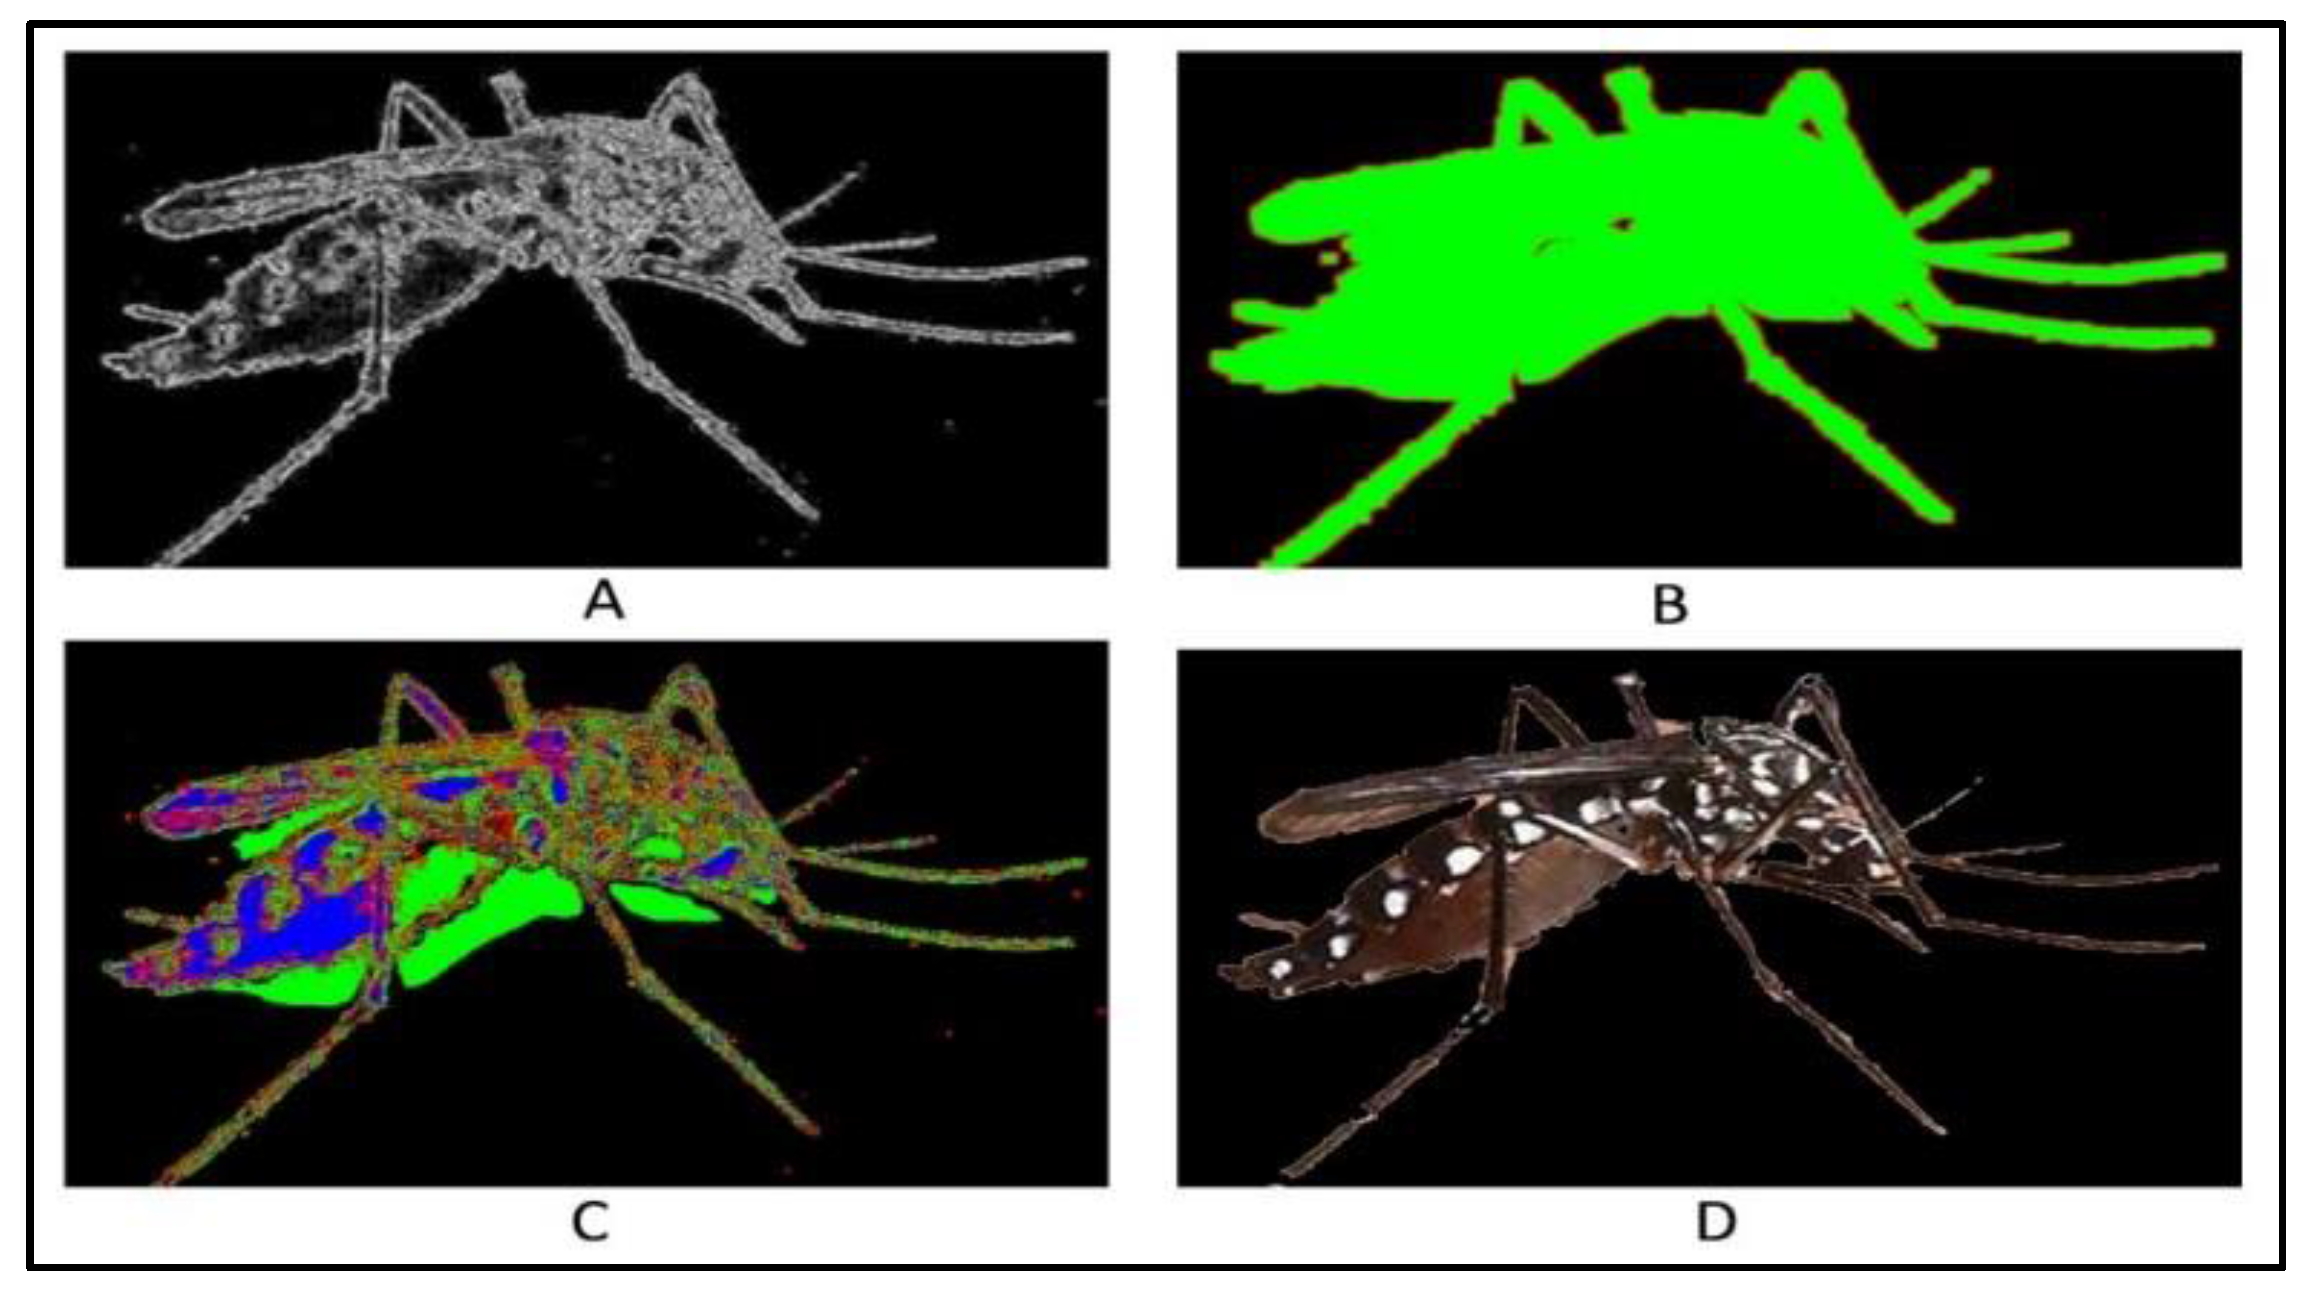
2.2. The Feature Extraction

There are numerous feature extraction methods that exist in the image processing and computer vision domains. One popular approach to this end is the SIFT feature extraction method that has been extensively used for texture recognition and object identification tasks [27]. In the above-mentioned work, the authors used a standard dataset containing images of patterns and objects. In the context of mosquito classification, the above-mentioned methodology is challenging because it is quite tedious to distinguish mosquitoes considering body pattern as a classification criterion. In this work, we propose a new feature extraction method which accounts for both the color and morphological features of the acquired images of insects. In this feature extraction method, morphological difference between the mosquitoes and insects accounts for the identification of mosquitoes among the other insects. As the first step of feature extraction, the color histogram of each image is extracted. After the color histogram extraction, we segment all images for trunk and leg regions. Upon these, the ratios of the trunk width to the leg length of segmented regions are determined using mathematical formulations and distance calculation algorithms. As the third step in the feature extraction, we perform the truth class labeling for the extracted feature and use it for training the support vector machine classifiers. Figure 2 shows the flow diagram of the feature extraction method used in this research work. For the background–foreground extraction, we used the graph cut algorithm commonly used in the computer vision community. The graph cut is a graph theory-based image processing method which is used for segmentation of images [29]. In order to use the graph cut algorithm for extracting the background or foreground, the algorithm must be trained with foreground or background regions of the image. Therefore, we determined the edges and saliency map of the images.
Both the edges and saliency map of the images are taken as the training data for the graph cut algorithm. The saliency map is generated by combining multi scale image features to a feature map which can be used as a tool for rapid scene analysis [30]. The saliency map integrates the orientation, color, and intensity information from an image. Therefore, we extracted the color map, intensity map and orientation map of the input images and integrated them to generate the saliency map. Figure 3 shows the saliency map generated from a sample mosquito image. On a saliency map, the pixels that show the foreground data will possess the highest value. Hence, to identify the foreground, we have defined a couple of thresholds N1 and N2 to determine the foreground from the saliency map. Using trial and error methods, we assigned the values 50 and 30 corresponding to N1 and N2. The pixels that show a value greater than N1% of the maximum pixel value in the saliency map are treated as most probable foreground pixels. The pixels that show a value less than N2% of the maximum pixel value in the saliency map are treated as the least probable foreground pixels. The pixels that have a value range between N2% to N1% of the maximum pixel value in the saliency map are considered as moderately probable foreground pixels.
However, with the help of the saliency map alone, we cannot determine the foreground pixels accurately. Hence, we also used the edge information of the image for determining the foreground accurately. The edge information from the image is done by applying a Sobel filter in the image [31]. The Sobel filter applies a 2D gradient on the image, so that the rapid changes in a grayscale image along the vertical and horizontal direction can be determined. To determine the foreground pixels from an edge image, we introduced certain thresholds for deciding the foreground and background data. As we did in the saliency map, three thresholds N3, N4 and N5 were fixed. The pixels that show a value greater that N3 in the edge image are treated as most probable foreground pixels. The set of pixels that possesses values more than N5 in the edge image are treated as the most probable background pixels. The pixels that have values ranging between N4 to N5 are treated as moderate probable foreground pixels. By trial and error, we fixed the N3, N4 and N5 as 255 × 0.8, 255 × 0.5 and 255 × 0.2 respectively. After completing the foreground estimation of images by applying thresholds in saliency map and edge images, the graph cut algorithm is trained. The images obtained from the saliency map and edge images are used as the training images for the graph cut algorithm for identifying the mosquito region Figure 4.
Once the mosquito region is extracted from the image using graph cut, the next step in the image segmentation process is decimation of each image to trunk and leg regions. We made an assumption in this work that all the insects of the same species appear similar in size in all the images. The leg-trunk decimation of the mosquito images can be done based on the morphological difference between the legs and the body of the mosquito. The species that belong to the hexapod class typically possess thinner and more elongated limb appendages than the thorax region. Hence, we decided upon the width of mosquito region as the criterion for decimation. Since the mosquito region is complex and irregularly structured, it is difficult to estimate the dimensions. Hence, for the width estimation, we extracted the contours of the mosquito region using geometric methods. Once the contour is defined, we assumed line segments that starts from each and every pixel on the contour and ends on another pixel on the contour by bisecting the mosquito region. Each line segment emanating from a single pixel will have a 45-degree difference in the slope. The lengths of assumed line segments give the thickness of the mosquito region measured along eight directions from all pixels in its contour. The mosquito region that shows a thickness above 40 pixels per unit or above is considered as the trunk region and the remaining portion is considered as the leg region (Figure 5). The final task in the image segmentation process is building smooth and complete leg and trunk regions which helps to extract the length-to-width ratios from the leg and trunk regions. To fill the leg and trunk regions in the contour images, we perform several erosion and dilation processes. To develop a filled and smooth trunk region, a total of six erosions and 10 dilations are done. Similarly, for the leg region, 12 erosions and dilations have been executed.
After the process of image segmentation, the ratios of the trunk width to the leg length of segmented regions have to be estimated. For the trunk-width and leg-length estimation, we adopt different methodologies. In the case of the leg-length estimation, we transform the leg region image to a sparse image consisting of end point, branch point and passing point. The shortest distance between the endpoints gives the length of the leg region. We use Dijkstra’s algorithm [32] to obtain the shortest distance between the end points. For finding out the width of the trunk region, we determine the centroid of the trunk region first. The minimal distances measured from one boundary pixel to the other in the trunk region are calculated along all the directions indicated by a straight line passing through the centroid. This minimal distance gives the trunk width. Figure 6 explains the length and width estimation of leg and trunk regions. The normalized form of the length-to-width ratio of the leg and trunk regions becomes the morphological feature extracted from the mosquito images. Equation (1) represents the normalization of ratios as captured in this work.
X n o r m = ( X m ) ( M m )
where X is the leg length to trunk width ratio, M is the maximum value for X, and m is a minimum value of X.

2.3. The Classification Process

After the feature extraction, the data vectors are encoded using truth class labelling before the classification. In this work, we used support vector machine (SVM) classifiers for classifying the mosquito species, bees and flies. SVM is a supervised learning algorithm used for data classification. SVM classifies its input by considering the input as data vectors in a higher-dimensional space, and optimal classification boundaries are created to separate the data vectors. The classification boundaries can be the hyperplanes that partitions the vector space. If the data vectors can be placed in a bi-dimensional space, we can consider the hyperplane as the line segment that defines the classification boundary among the vectors that belong to the bi-dimensional space. Since SVM is a supervised learning algorithm, it defines the hyperplanes using the training data given in its training phase. In the training phase of the SVM, both the positive and negative examples from each category to be classified (mosquitoes and other bugs) have to be used for the hyperplane generation. The SVM classifiers define the hyperplanes by maximizing the Euclidian distance between the support vectors and the margin of the hyperplane in the higher-dimensional space. In this work, we use three variants of SVM classifiers, and the performance of these variants in the context of mosquito classification is evaluated. We use C-Support Vector Classification (C-SVC) and nu-Support Vector Classification (nu-SVC) variants of SVM modules to perform the classification. With the C-SVC module, we perform the classification using linear and radial basis function (RBF) as the kernel functions. In addition to C-SVC, we preformed the classification using RBF as the kernel for nu-SVC type of SVM classifiers. Here, the three variants of SVMs (SVM-I, SVM-II and SVM III) address a single classification scenario as comparisons. The strategy of using multiple classification methodologies on identical classification scenario paves the way for identifying the felicitous variant of SVM for the classification task considered. The mathematical expression that defines the C-SVS is shown below.
f ( x ) = 1 2 w 2 + C n = 1 N ξ n
in this equation, we represent w as the weight vector, and C represents the penalty weight and ξ n is the slack variable. The nu-SVC classifier with ρ and ν as the parameters can be mathematically expressed as,
1 2 w 2 ν ρ + 1 N n = 1 N ξ n
We fix the parameters such that, ρ ν = 0.5. The Table 1 shows the three types of SVM used in the proposed classification scheme as well as the corresponding kernel functions used where X1 and X2 represent the feature vectors. In the case of RBF, we set the σ value as 5.0 × 10⁻⁴.

3. Results

The insect dataset was generated after three months of field data collection via a digital camera and web-based image collection using images.google.com as the key search engine. A total of 400 images of mosquitoes (200), flies (100) and bees (100) were collected. Among the 400 images, 100 images of mosquitoes, 50 images of flies and another 50 images of bees were taken for training the system. Remaining images from each set were used for the validation of the system. Figure 6 demonstrates the results from classified images from our training experiments using the SVM. We use the SVM by invoking LibSVM library that is included in the OpenCV package. Figure 7 illustrates the sample images correctly and incorrectly classified from our test. Table 2 shows the experimental results of accuracy analysis in terms of mosquito identification, while SVM I is used for classification. The experiments show accuracies of 65.6% and 76.0% in identifying the other bugs namely bees and flies. The experiments show a recall percentage of 82%—the proportion of positive images that are returned in the case of mosquito identification—and a recall percentage of 57% in identifying other bugs.
The results convey that the usage of SVM with linear kernel function is not effective for classifying mosquitoes and other bugs. The linear basis function generates a simple 2D hyperplane to decimate the data vectors into two classes. If the data points are clustered in an overlapped fashion in the multidimensional space, the probability of error in the classification using SVM with linear kernel function will be higher. In the above-mentioned case, a complex hyperplane can classify the data points effectively, whereas the RBF kernel generates a complex hyperplane in the multi-dimensional space. Table 3 and Table 4 shows the experimental results of accuracy analysis in terms of the mosquito identification where SVM II and SVM III are used. The results show the accuracies of 85.2% and 98.9% when using SVM II and SVM III for identifying mosquitoes, respectively. Moreover, the classifications using SVM II and SVM III show 97.6% and 92.2% accuracy in identifying the other bugs, namely bees and flies. The results with SVM II show a recall percentage of 98%, but in the case of SVM III the recall percentage is 92%.

4. Conclusions

We have developed a novel mosquito identification and classification method based on SVM. The image-based classification is achieved by extracting the width-to-length ratio of the trunk and leg region of mosquitoes and other insects followed by a trained SVM classifier. The accuracy of the proposed method using three variants of SVM classifiers is evaluated. The proposed approach with C-SVC SVM module shows a maximum accuracy of 85.2%—the proportion of returning images that are positive while identifying the mosquitoes—and a 97.6% accuracy in identifying the other bugs namely bees and flies. The experiments show a recall percentage of 98%—the proportion of positive images that are returned in the case of mosquito identification—and a recall percentage of 85% in identifying other bugs. Future research will focus on: (1) developing sensor hardware and extending our experiments to online field trials; (2) including additional features to improve the performance of the classifier; (3) expanding the work done to compare alternative learning approaches, including neural networks, genetic algorithms and fuzzy logic in the context of mosquito classification; (4) integrating the proposed sensor module on-board a mobile robot platform to synthesize mosquito vector density maps of extended regions; and (5) finding distinguishable features to conduct sub-species mosquito classification.

Acknowledgments

We hereby acknowledge that this work is supported by SUTD—MIT international design Centre at Singapore University of Technology and Design.

Author Contributions

Masataka Fuchida and Rajesh Elara Mohan conceived and designed the experiments; Masataka Fuchida, Rajesh Elara Mohan and Thejus Pathmakumar performed the experiments; Masataka Fuchida, Akio Nakamura and Thejus Pathmakumar analyzed the data; Akio Nakamura, Thejus Pathmakumar, and Ning Tan contributed reagents/materials/analysis tools; Masataka Fuchida, Rajesh Elara Mohan, Thejus Pathmakumar, Akio Nakamura and Ning Tan wrote the paper. Authorship must be limited to those who have contributed substantially to the work reported.

Conflicts of Interest

The authors declare no conflict of interest.

References

  1. World Health Organization. Global Strategy for Dengue Prevention and Control 2012–2020; World Health Organization: Geneva, Switzerland, 2012. [Google Scholar]
  2. Bhatt, S.; Gething, P.W.; Brady, O.J.; Messina, J.P.; Farlow, A.W.; Moyes, C.L.; Drake, J.M.; Brownstein, J.S.; Hoen, A.G.; Sankoh, O. The global distribution and burden of dengue. Nature 2013, 496, 504–507. [Google Scholar] [CrossRef] [PubMed] [Green Version]
  3. Furuya-Kanamori, L.; Liang, S.; Milinovich, G.; Magalhaes, R.J.S.; Clements, A.C.; Hu, W.; Brasil, P.; Frentiu, F.D.; Dunning, R.; Yakob, L. Co-distribution and co-infection of chikungunya and dengue viruses. BMC Infect. Dis. 2016, 16. [Google Scholar] [CrossRef] [PubMed]
  4. Hadinegoro, S.R.S. Efficacy and Long-Term Safety of a Dengue Vaccine in Regions of Endemic Disease Integrated Analysis of Efficacy and Interim Long-Term Safety Data for a Dengue Vaccine in Endemic Regions. N. Engl. J. Med. 2015. [Google Scholar] [CrossRef] [PubMed]
  5. Roth, A.; Mercier, A.; Lepers, C.; Hoy, D.; Duituturaga, S.; Benyon, E.G.; Guillaumot, L.; Souares, Y. Concurrent outbreaks of dengue, chikungunya and Zika virus infections-an unprecedented epidemic wave of mosquito-borne viruses in the Pacific 2012–2014. Eurosurveillance 2014, 19, 20929. [Google Scholar] [CrossRef] [PubMed]
  6. Jasinskiene, N.; Coates, C.J.; Benedict, M.Q.; Cornel, A.J.; Rafferty, C.S.; James, A.A.; Collins, F.H. Stable transformation of the yellow fever mosquito, Aedes aegypti, with the Hermes element from the housefly. Proc. Natl. Acad. Sci. USA 1998, 95, 3743–3747. [Google Scholar] [CrossRef] [PubMed]
  7. Hay, S.I.; Snow, R.W.; Rogers, D.J. From predicting mosquito habitat to malaria seasons using remotely sensed data: Practice, problems and perspectives. Parasitol. Today 1998, 14, 306–313. [Google Scholar] [CrossRef]
  8. Zou, L.; Miller, S.N.; Schmidtmann, E.T. Mosquito larval habitat mapping using remote sensing and GIS: Implications of coalbed methane development and West Nile virus. J. Med. Entomol. 2006, 43, 1034–1041. [Google Scholar] [CrossRef] [PubMed]
  9. Khan, B.; Gaburro, J.; Hanoun, S.; Duchemin, J.-B.; Nahavandi, S.; Bhatti, A. Activity and Flight Trajectory Monitoring of Mosquito Colonies for Automated Behaviour Analysis. In Neural Information Processing, Proceedings of the 22nd International Conference, ICONIP 2015, Istanbul, Turkey, 9–12 November 2015; Springer: Germany, 2015; Part IV; pp. 548–555. [Google Scholar]
  10. Walton, C.; Sharpe, R.G.; Pritchard, S.J.; Thelwell, N.J.; Butlin, R.K. Molecular identification of mosquito species. Biol. J. Linn. Soc. 1999, 68, 241–256. [Google Scholar] [CrossRef]
  11. Sharpe, R.G.; Hims, M.M.; Harbach, R.E.; Butlin, R.K. PCR-based methods for identification of species of the Anopheles minimus group: Allele-specific amplification and single-strand conformation polymorphism. Med. Vet. Entomol. 1999, 13, 265–273. [Google Scholar] [CrossRef] [PubMed]
  12. Li, Z.; Zhou, Z.; Shen, Z.; Yao, Q. Automated identification of mosquito (diptera: Culicidae) wingbeat waveform by artificial neural network. In Proceedings of the IFIP International Conference on Artificial Intelligence Applications and Innovations, Beijing, China, 7–9 September 2005.
  13. Moore, A.; Miller, R.H. Automated identification of optically sensed aphid (Homoptera: Aphidae) wingbeat waveforms. Ann. Entomol. Soc. Am. 2002, 95, 1–8. [Google Scholar] [CrossRef]
  14. Raymer, M.L.; Punch, W.F.; Goodman, E.D.; Kuhn, L.A.; Jain, A.K. Dimensionality reduction using genetic algorithms. IEEE Trans. Evol. Comput. 2000, 4, 164–171. [Google Scholar] [CrossRef]
  15. Wang, J.; Lin, C.; Ji, L.; Liang, A. A new automatic identification system of insect images at the order level. Knowl. Based Syst. 2012, 33, 102–110. [Google Scholar] [CrossRef]
  16. Bai, X.; Fang, Y.; Lin, W.; Wang, L.P.; Ju, B.-F. Saliency-based Defect Detection in Industrial Images by Using Phase Spectrum. IEEE Trans. Ind. Inform. 2014, 10, 2135–2145. [Google Scholar] [CrossRef]
  17. Zhang, L.; Wang, L.P.; Lin, W. Conjunctive patches subspace learning with side information for collaborative image retrieval. IEEE Trans. Image Process. 2012, 21, 3707–3720. [Google Scholar] [CrossRef] [PubMed]
  18. Zhang, L.; Wang, L.P.; Lin, W. Semi-supervised biased maximum margin analysis for interactive image retrieval. IEEE Trans. Image Process. 2012, 21, 2294–2308. [Google Scholar] [CrossRef] [PubMed]
  19. Fu, X.J.; Wang, L.P. Data dimensionality reduction with application to simplifying RBF network structure and improving classification performance. IEEE Trans. Syst. Man Cybern. B Cybern. 2003, 33, 399–409. [Google Scholar] [PubMed]
  20. Mitra, V.; Wang, C.J.; Banerjee, S. Lidar detection of underwater objects using a neuro-SVM-based architecture. IEEE Trans. Neural Netw. 2006, 17, 717–731. [Google Scholar] [CrossRef] [PubMed]
  21. Ratle, F.; Camps-Valls, G.; Weston, J. Semi supervised Neural Networks for Efficient Hyperspectral Image Classification. IEEE Trans. Geosci. Remote Sens. 2010, 48, 2271–2282. [Google Scholar] [CrossRef]
  22. Giorgio, G.; Fabio, R. Design of effective neural network ensembles for image classification purposes. Image Vis. Comput. 2001, 19, 699–707. [Google Scholar]
  23. Vanajakshi, L.; Rilett, L.R. A comparison of the performance of artificial neural networks and support vector machines for the prediction of traffic speed. In Proceedings of the 2004 IEEE Intelligent Vehicles Symposium, Parma, Italy, 14–17 June 2004; pp. 194–199.
  24. Byvatov, E.; Fechner, U.; Sadowski, J.; Schneider, G. Comparison of support vector machine and artificial neural network systems for drug/nondrug classification. J. Chem. Inf. Comput. Sci. 2003, 43, 1882–1889. [Google Scholar] [CrossRef] [PubMed]
  25. Wong, W.T.; Hsu, S.H. Application of SVM and ANN for image retrieval. Eur. J. Oper. Res. 2006, 173, 938–950. [Google Scholar] [CrossRef]
  26. Tong, S.; Koller, D. Support vector machine active learning with applications to text classification. J. Mach. Learn. Res. 2001, 2, 45–66. [Google Scholar]
  27. Lowe, D.G. Object recognition from local scale-invariant features. In Proceedings of the Seventh IEEE International Conference on Computer Vision, Kerkyra, Greece, 20–27 September 1999; pp. 1150–1157.
  28. Freedman, D.; Zhang, T. Interactive graph cut based segmentation with shape priors. In Proceedings of the 2005 IEEE Computer Society Conference on Computer Vision and Pattern Recognition (CVPR’05), San Diego, CA, USA, 21–23 September 2005; pp. 755–762.
  29. Itti, L.; Koch, C.; Niebur, E. A model of saliency-based visual attention for rapid scene analysis. IEEE Trans. Pattern Anal. Mach. Intell. 1998, 20, 1254–1259. [Google Scholar] [CrossRef]
  30. Vincent, O.R.; Folorunso, O. A descriptive algorithm for sobel image edge detection. In Proceedings of the Informing Science IT Education Conference (In SITE), Macon, GA, USA, 12–15 June 2009; pp. 97–107.
  31. Ta, D.N.; Chen, W.C.; Gelfand, N.; Pulli, K. Surftrac: Efficient tracking and continuous object recognition using local feature descriptors. In Proceedings of the Computer Vision and Pattern Recognition (CVPR), Miami, FL, USA, 20–26 June 2009; pp. 2937–2944.
  32. Dijkstra, E.W. A note on two problems in connexion with graphs. Numerische Math. 1959, 1, 269–271. [Google Scholar] [CrossRef]
Figure 1. The schematic system architecture diagram of the proposed mosquito classification system.
Applsci 07 00051 g001
Figure 2. The flow diagram illustrating the background-foreground extraction and feature extraction methods.
Applsci 07 00051 g002
Figure 3. The saliency map generation from an input image (A), the color map (B), intensity map (C), and the orientation map (D) are combined to obtain the saliency map (E).
Applsci 07 00051 g003
Figure 4. The edge image (A); the training image (B) (the green region represents the most probable foreground pixels and red region represents the moderate probable foreground region); the training image (C) after thresholding the saliency map; and the segmented region (D).
Applsci 07 00051 g004
Figure 5. The contour image of the trunk region (A); the extracted trunk region (B); the contour image of the leg region (C); and the extracted leg region (D).
Applsci 07 00051 g005
Figure 6. Support vector machine (SVM) classification of bees, flies and mosquitoes (green color indicates correctly identified bees or flies, blue color indicate correctly identified mosquitoes, red color indicates the incorrect identification of bees or flies, and orange color indicate the incorrect identification of mosquitoes).
Applsci 07 00051 g006
Figure 7. Sample classification results. A correctly classified mosquito (A) and a correctly classified bug (B); (C,D) shows wrongly classified bug and mosquito.
Applsci 07 00051 g007
Table 1. Three types of support vector machine (SVM) and corresponding kernel functions used for the classification process, C–SVC: C-Support Vector Classification, nu-SVC: nu-Support Vector Classification.
TypeSVM ModuleKernelMathematical Expression for Kernel
SVM IC-SVCLinear K ( x 1 , x 2 ) = x 1 T x 2
SVM IIC-SVCRadial Basis Function K ( x 1 , x 2 ) = exp ( | x 1 x 2 | 2 2 σ 2 )
SVM IIInu-SVCRadial Basis Function K ( x 1 , x 2 ) = exp ( | x 1 x 2 | 2 2 σ 2 )
Table 2. The result of the classification of mosquitoes and others bugs using SVM I.
InsectMosquitoesOther BugsAccuracy %
Mosquitoes824365.6
Others185776.0
Recall %82.057.0
Table 3. The result of the classification of mosquitoes and others bugs using SVM II.
InsectMosquitoesOthers BugsAccuracy %
Mosquitoes981785.2
Others28397.6
Recall %98.083.0
Table 4. The result of the classification of mosquitoes and others bugs using SVM III.
InsectMosquitoesOthers BugsAccuracy %
Mosquitoes92198.9
Others89992.5
Recall %92.099.0

