Abstract
This study used Raman spectral imaging coupled with self-modeling mixture analysis (SMA) for identification of three components mixed into a complex food powder mixture. Vanillin, melamine, and sugar were mixed together at 10 different concentration level (1% to 10%, w/w) into powdered non-dairy creamer. SMA was used to decompose the complex multi-component spectra and extract the pure component spectra and corresponding contribution images. Spectral information divergence (SID) values of the extracted pure component spectra and reference component spectra were computed to identify the components corresponding to the extracted spectra. The contribution images obtained via SMA were used to create Raman chemical images of the mixtures samples, to which threshold values were applied to obtain binary detection images of the components at all concentration levels. The detected numbers of pixels of each component in the binary images was found to be strongly correlated with the actual sample concentrations (correlation coefficient of 0.99 for all components). The results show that this method can be used for simultaneous identification of different components and estimation of their concentrations for authentication or quantitative inspection purposes.
1. Introduction
Food authentication is important in food supply chain operations, as illustrated by various incidents of food fraud that have caused public outcry around the world, raised public concerns, and highlighted the need for effective ingredient authentication methods. The toxic addition of melamine to dairy products and infant formula for the purpose of counterfeiting protein content was a high profile example of economically motivated food adulteration that posed significant health risks. Other forms of food fraud can include products that may be safe but have been made with ingredients omitted from product labels, as well as products whose labels over represent the content of desirable or costly ingredients. A variety of highly accurate analytical methods, such as DNA-based methods [1], polymerase chain reaction [2], mass spectrometry [3], and gas and liquid chromatography [4], can be used for food authentication but are limited in practical application due to high operational costs, long sampling times, and limited sampling volumes. Alternatively, interest in the development and use of non-destructive optical analysis methods for food safety and quality applications has been increasing due to their greater simplicity, lower operational costs, and suitability for rapidly analyzing larger sample volumes for a variety of safety and quality parameters. Optical spectroscopy and imaging techniques have been used for a variety of food safety and quality inspection applications, including inspection of poultry eggs for freshness and for micro cracks [5,6]; evaluation of tenderness, color, and pH of beef [7,8]; identification of systemically diseased chickens [9,10]; detection of citrus canker disease [11]; detection of contaminants and pathogens in fresh produce and meat [12,13,14,15]; and detection of meat adulteration [16,17,18]. Among the optical techniques, visible/near infrared spectroscopy, fluorescence spectroscopy, hyperspectral imaging, and Raman spectroscopy and imaging are extensively utilized for food authentication research and application [19,20,21,22,23,24,25].
Raman spectroscopy and imaging techniques are valuable tools for food production and quality control applications, largely due to their specificity, sensitivity, simplicity, and non-sensitivity to water, which permit use with a wide variety of food and food products. Some examples include real-time monitoring of multiple components during wine fermentation and vinegar fermentation [26,27]; detection of adulteration of olive oils [28]; prediction of meat spoilage [29]; discrimination of meats such as beef and horsemeat [30]; and detection of adulteration of food powders such as melamine in milk, benzoyl peroxide in flour, maleic acid in starch, and metanil yellow dye in turmeric [31,32,33]. Although Raman spectroscopy is a proven tool for chemical analysis, its use is often limited to very small sample volumes. The inability to acquire information from large surface areas is a major drawback in the measurement of heterogeneous samples such as food powder mixtures. Raman spectral imaging is an alternative technique that combines Raman spectroscopy and imaging to acquire Raman chemical images containing pixel-based spatial and spectral information. From this data, simultaneous spectral analysis and image processing can be performed for a wide range of food samples for safety and quality purposes [25]. Given the widespread consumption of food powders, it is important to detect the ingredient composition in it. Qin et al. (2013) used Raman imaging for detection of multiple chemical adulterants in skim milk powder [34]. The study has shown Raman imaging as a potential tool for the detection of multiple components in skim milk powder. In addition to detecting components, it is equally important to evaluate its concentration in food powder mixture. This study provides a method for the detection and evaluation of percentage composition of different components in food powder. This study presents the use of Raman spectral imaging to obtain Raman chemical images of a food powder mixed with multiple components. Self modeling mixture analysis (SMA) was used to decompose complex spectra and extract pure component spectra of each component in the sample mixtures [35]. A simple image processing method was utilized to identify pixels of each component in the Raman chemical images, in order to evaluate the concentration of the individual components in the mixtures. The main objectives of this study were to:
- acquire Raman spectral images of powdered non-dairy creamer mixed with vanillin, melamine, and sugar at 10 different concentrations;
- apply a self modeling mixture analysis to decompose complex spectra and obtain pure component spectra and contribution;
- apply a simple image processing method to visualize and identify each pixels of each component in the Raman chemical images; and
- establish a correlation between the detected number of component pixels and the actual component concentration in the mixture samples.
2. Materials and Methods
2.1. Raman Spectral Imaging System
A 1024 × 256 pixel, 16-bit charge-coupled device (CCD) camera (Newton DU920N-BR-DD, Andor Technology, South Windsor, CT, USA) is mounted with a Raman imaging spectrometer (Raman Explorer 785, Headwall Photonics, Fitchburg, MA, USA) and used with a 785 nm laser module (I0785MM0500MF, Innovative Photonics Solutions, Monmouth Junction, NJ, USA) for sample excitation. A bifurcated optical fiber bundle, with one end connected to the laser source and the other end connected to the input slit, delivers the laser light to the optical probe for sample excitation, and then collects and delivers the Raman scattering signal to the input slit (100 µm wide) of the spectrometer. The point-scan imaging system uses a two-axis motorized positioning table (MAXY4009W1-S4, Velmex, Bloomfield, NY, USA) to precisely move samples for high-resolution imaging of the sample surfaces, which are maintained at a 7 mm working distance below the optical probe, which results in a 0.155 mm diameter spot size for laser excitation. System settings and spectral acquisition operations are controlled through software developed in-house on a LabView platform (National Instruments, Austin, TX, USA).
2.2. Sample Preparation and Acquisition of Spectral Image
A sample mixture was prepared at ten different concentration levels, 1% through 10%, by mixing powdered non-dairy creamer (Nestle USA Inc., Glendale CA, USA) with equal weights of vanillin (Sigma-Aldrich, St. Louis, MI, USA), granulated sugar (sucrose) (Domino Food, Baltimore, MD, USA), and melamine (Sigma-Aldrich, St. Louis, MI, USA). The 1% concentration sample thus contained 1% vanillin, 1% sugar, 1% melamine, and 97% non-dairy creamer, while the 10% concentration sample contained 10% vanillin, 10% sugar, 10% melamine, and 70% non-dairy creamer. Samples for the concentration levels between 1% and 10% were prepared similarly. The total weight of each sample mixture was approximately 8.3 g to 8.5 g.
To produce thorough particle distribution throughout the sample mixtures, each mixture was subjected to 20 min in an acoustic mixer (Resodyn Acoustic Mixers, Inc., Butte, MT, USA). Since particle size can influence the mixing quality [36], the particle sizes of the mixture components were examined using a Horiba Jobin Yvon LabRam Aramis Raman Spectrometer (Horiba, Ltd., Tokyo, Japan) with a charged couple device camera and Olympus BX41 microscope. From the microscope images, the particle sizes of vanillin, melamine, sugar, and non-dairy creamer were observed to be in the ranges of 26–30 µm, 15–20 µm, 45–50 µm, and 20–25 µm, respectively.
For imaging, each sample mixture was packed into a nickel-plated sample holder (interior dimensions 100 mm × 50 mm × 3 mm), and the powder surface was leveled flush with the upper edge of the sample holder, as shown in Figure 1. A Raman spectral image of the sample surface was acquired by point-scanning across a 96 mm × 46 mm area that excluded the edges of the sample, using a CCD exposure time of 0.1 s, a spatial resolution of 0.5 mm, and a laser power of 250 mW. The final sample image acquired was a 192 × 92 × 1024 hyperspectral cube with 17,664 spatial pixels at each of 1024 spectral wavenumbers. One hyperspectral cube was acquired for each of the ten concentration samples.
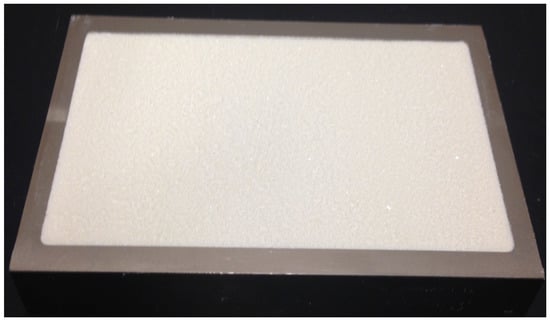
Figure 1.
Mixture sample packed in sample holder.
2.3. Spectral Analysis and Image Processing
Spectral analysis and image processing algorithms were carried out using Matlab (MathWorks, Natick, MA, USA) and ENVI software (Exelis Visual Information Solutions, Boulder, CO, USA).
First of all, each three-dimensional hyperspectral sample image was converted into two-dimensional Raman spectral data. To eliminate fluorescence background from the spectra, an 8th order polynomial curve was generated that resembled the fluorescence spectra and this curve was then subtracted from the original Raman spectra [31]. The corrected spectra were then decomposed using a self modeling mixture analysis (SMA) algorithm to extract Raman signatures of the sample components. SMA is a series of algorithm that is used to decompose mixed spectral data to obtain pure component spectra and their corresponding contributions [37,38]. The purity function in the PLS_Toolbox (Eigenvector Research, Inc., Wenatchee, WA, USA) was used for spectral analysis. The basic formulas for SMA are as follows:
where D is a (m × n) matrix of mixed spectral data; C is the contribution matrix (m × k); ST is the transpose of S (n × k), which represents the matrix of pure component spectra; k is the number of analytes present in the data; and E is the residual error. The contribution C can be estimated using the spectral intensities (columns of D). As C and D are known, S can be calculated using the following equation:
where S represents the estimated pure component spectra. Next, the estimated contribution C* can be calculated by the following equation:
D = CST + E
S = DTC (CTC)−1
C* = DS (ST S)−1.
In the purity function, it is desirable to define an appropriate offset level. The offset level is determined by the maximum of the mean of the variable. An offset level of 5 was used in the purity function, which corresponds to a 5% × (maximum intensity) offset value in the original SMA method [37]. For each sample concentration, the 17,664 × 1024 spectral matrix was decomposed to extract pure component spectra and corresponding score vectors. Each of the score vectors (17,644 × 1) corresponding to mixture components was converted into a two-dimensional contribution image (92 × 192) matching the original spatial dimensions of the Raman hyperspectral sample image.
After extracting the pure component spectra and corresponding contribution maps, each component was identified using the spectral information divergence (SID) method, which compares the dissimilarity between two spectra by relative entropy [39]. Matlab code was developed for SID calculation based on the following formulas:
where X (975 × 1) is the reference spectrum, Y (975 × 1) is the spectrum resolved from SMA, and P and Q are probability values of X and Y, respectively.
P = X/sum (X)
Q = Y/sum (Y)
The relative entropy (i.e., information divergence) of Y with respect to X can be calculated as
D(X‖Y) = P’ * log (P./Q).
Similarly, the relative entropy of X with respect to Y can be calculated as
where P’ and Q’ are the transpose matrices of P and Q, respectively. (P./Q) and (Q./P) are element by element matrix divisons in Matlab.
D(Y‖X) = Q’ * log (Q./P)
The SID value can be calculated as
SID (X,Y) = D(X‖Y) + D(Y‖X).
A smaller SID value means there is less disparity between the two spectra. Based on SID values, each extracted spectrum was identified as being that of vanillin, melamine, or sugar and was then used to create contribution images for these three components of the sample mixture.
For each concentration level, the contribution images of each component (vanillin, melamine, and sugar) were imported into ENVI for further analysis. A histogram for each contribution image was created to determine a threshold value to obtain binary image of each component at all concentration levels. The contribution image, the binary image, and the corrected Raman images of the sample were linked together for a pixel-to-pixel comparison. For lower threshold values, some of the background pixels were identified as a pixel containing one of the three components (false positive); at larger threshold values, some component pixels were converted into background pixels (false negative). Based on iterative pixel-to-pixel analysis, a final threshold value for each component at each concentration level was selected to obtain a binary image of the component. For the purpose of visualizing the component pixels across the sample surface, the binary images of the three components were fused together and simple image processing was performed to color code the pixels of vanillin, melamine, and sugar as well as pixels containing multiple components together. To estimate the amount of vanillin, melamine, and sugar present in the non-dairy creamer mixture, the number of detected pixels for each component was correlated with the concentration of the component in the sample.
3. Results and Discussion
3.1. Identification of Components from Mixed Samples
In this study, to investigate methodology for identifying multiple components mixed to form a complex food matrix, vanillin and sugar were chosen as components due to their common use as flavorings in coffee creamers. Melamine was chosen as the third component due to its use for increasing the perceived protein content of dairy and dairy-substitution products in past instances of economically driven chemical adulteration.
Figure 2 shows the Raman spectra of vanillin, melamine, sugar, and non-dairy creamer. Each component has several Raman spectral peaks, some of which overlap with peaks of other components, while others are unique without overlap. For each of the four components, the unique peak of the highest intensity is labeled in Figure 2 (vanillin: 1597 cm−1, melamine: 674 cm−1, sugar: 543 cm−1, and non-dairy creamer: 1452 cm−1) and was selected as the Raman spectral fingerprint for that component.
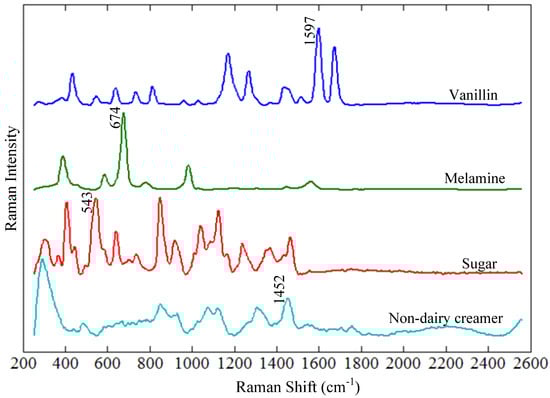
Figure 2.
Raman spectra of vanillin, melamine, sugar, and non-dairy creamer.
Raman spectral images of all samples were collected over a sample surface area of 96 mm × 46 mm using a spatial resolution of 0.5 mm. This spatial resolution was selected based on our previous work that demonstrated effective detection of melamine particles at 0.5 mm spatial imaging resolution [31,32]. For each image, the total numbers of pixels in the vertical and horizontal spatial axes were 92 and 192, respectively, with a total of 1024 Raman wavebands measured at each spatial pixel.
For identification of individual chemical components in a mixture, the Raman spectral fingerprint of an individual component must be identified from the matrix of mixture spectra. Although time-consuming and tedious for large data sets, such identification can be performed manually by identifying a key Raman spectral peak of the component of interest. Alternatively, the spectral matrix can be decomposed to extract spectra of individual components and then identify the components. One such method is the application of the self modeling mixture analysis (SMA) to extract pure component spectra and score vectors followed by the use of spectral information divergence (SID) to identify the components corresponding to the spectra [40]. The expected number of pure components is pre-defined before SMA computation. For an unknown number of components in a mixture, it is generally desirable to overestimate the number of pure components, and to visually analyze the SMA result to determine the true number of pure components in the mixture. Although this study mixed three known components with non-dairy creamer, using the approach of initially overestimating the number of components (five components) for SMA computation produced favorable results—five component spectra and five corresponding scores, of which three were identified as being the pure component spectral contributions from vanillin, melamine, and sugar. The remaining two spectra/scores were identified as residual noise and disregarded from further analysis.
Figure 3a shows the pure component spectra of vanillin, melamine, and sugar obtained by SMA for the 6% concentration sample. After the spectral mixture was diffused and pure component spectra and corresponding contributions were extracted, the SID method was used to identify the component corresponding to each pure component spectrum and contribution. Each of the pure component spectra was compared and computed against the reference spectra in the spectral library to obtain SID value. The extracted pure component spectra that showed the least divergence (smallest SID value) compared to a reference component spectrum was assigned identification corresponding to the reference component. Figure 3a shows that the three extracted pure component spectra and their corresponding reference spectra are well matched and, for vanillin and melamine, can be regarded as exact matches. For sugar, the majority of the spectral peaks in the extract spectrum match those of the reference spectrum, although some unmatched peaks can be seen in the extracted spectrum at 674 cm−1, 1597 cm−1, and 1675 cm−1. The peak at 674 cm−1 is from melamine, and the 1597 cm−1 and 1675 cm−1 peaks are from vanillin. These errors in the extracted spectrum for sugar may be due to the large number of sugar peaks that are very close to each other and occur without a flat baseline. Vanillin and melamine both contain sharp and somewhat more separated peaks along flat baselines, and the corresponding extract spectra for these two components did not show errors like that in the extracted sugar spectrum.
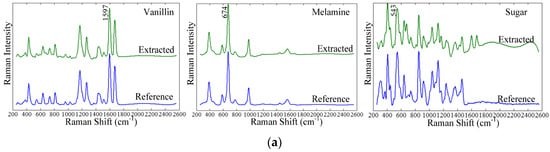
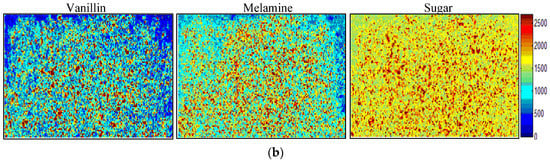
Figure 3.
Result of self-modeling mixture analysis of components. (a) Extracted and reference component spectra for vanillin, melamine, and sugar; (b) corresponding contribution images for the 6% concentration level.
The corresponding score factors of each component were unfolded back to obtain a two-dimensional contribution image (92 × 192). A representative contribution image of each component is shown in Figure 3b. The score values in the contribution images are proportional to concentration of the component in the mixture sample. The pixels with high intensities represent the component particle in each contribution image.
The contribution images of each component obtained at all mixture concentration levels were utilized for pixel-to-pixel identification of the components in the mixture samples. Raman chemical images of each component were obtained from contribution images. A histogram for each chemical image was created to obtain a threshold value. The threshold value was applied to convert all the pixels with intensities below the threshold value into background, and to identify all pixels with intensities above the threshold value as representing a particle of the component of interest. Thus one binary image per component per sample was obtained, for a total of 30 binary images (three components at 10 concentration levels). Each binary image was compared with a single-band sample image at the spectral fingerprint peak of the corresponding component to ensure that none of the pixels were misclassified. At each concentration level, the binary images of the three components were then combined and the pixels of each component were color-coded: green for vanillin, magenta for melamine, and blue for sugar. Combination pixels that contained any two of the three components were represented in red, and combination pixels that contained all three components were represented in black. The non-dairy creamer was represented in white. Figure 4 shows the result of the image processing for pixel-to-pixel analysis of the components at 6% concentration. It can be seen that the green, magenta, and blue pixels (of vanillin, melamine, and sugar, respectively) are scattered throughout the sample surface. The concentrations of these three pixel colors can roughly be estimated to be equal. Red pixels can also be seen, indicating the presence of any two of the three components at the same imaging spot but at different layers within the total sample depth of 3 mm. Black pixels, indicating the presence of all three components at the same spot, are also observed in Figure 4 but occur in fewer instances than the red pixels do.
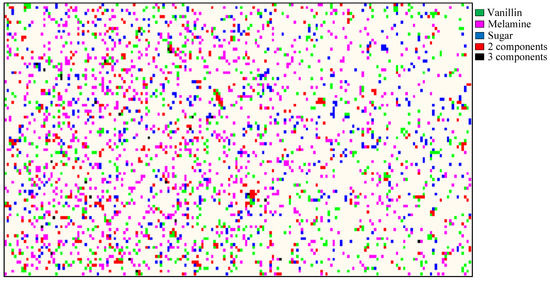
Figure 4.
Color-coded chemical image of sample mixture (6% concentration) generated by contribution images.
3.2. Estimation of Component Concentrations
The image processing method discussed above was used to color-code pixels of each component for images of samples at all 10 concentration levels. A total of 10 color-coded images were created; for each image, the total numbers of identified pixels of each component were calculated. Figure 5a shows the color-coded images for 4 of the 10 sample concentrations. The pixels of vanillin, melamine, and sugar are scattered throughout the sample surface. The concentrations of colored pixels are low in the 1% concentration image, and progressively increase in the 5%, 8%, and 10% concentration images. This shows that the detected numbers of component pixels are correlated to sample concentration. The red and black combination pixels, indicating the presence of multiple overlapping components, can also be observed to increase progressively from low frequency occurrences at 1% concentration to higher frequency occurrences at 10% concentration. This progressive increase was observable because the volume and presented area of the sample holder was held constant (100 mm × 50 mm × 3 mm) for all sample concentrations while the component concentrations increased, thus resulting in overlapping of components at different layers within the sample depth. Figure 5b shows Raman spectra of pixels for the 10% concentration sample. The fingerprint peaks of the three components and the non-dairy creamer are readily visible in the spectra.
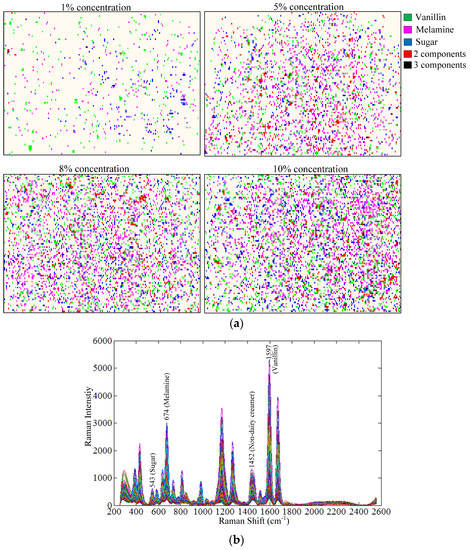
Figure 5.
(a) Raman chemical images generated from contribution images for 1%, 5%, 8%, and 10% concentration samples; (b) Raman spectra of pixels for the 10% concentration sample.
The numbers of detected pixels increased considerably with increasing actual concentration. The increasing trend was observed to be linear. This shows that component concentrations can be estimated by calculating the number of detected pixels of any component as a percentage of the total number of pixels in the detection image. To develop an estimation model, the numbers of detected pixels were correlated with actual sample concentration. The results showed a very strong positive correlation between numbers of detected pixels and the actual component concentrations, which can be used to estimate the concentrations of individual components. Figure 6 shows the correlation between component concentrations and the numbers of detected pixels, with a correlation coefficient of 0.99 for each of the three components.
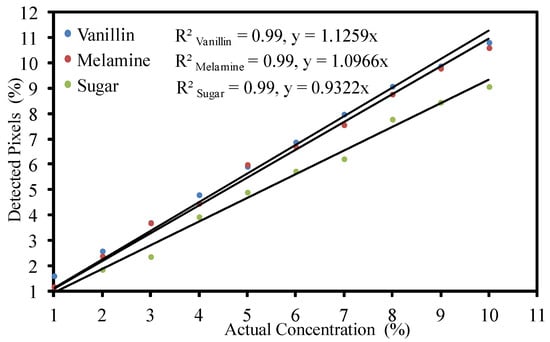
Figure 6.
Correlation between component concentration and detected number of pixels.
Pixels representing non-dairy creamer at each concentration were calculated simply by subtracting the sum of detected pixels of the other three components from the total number of all image pixels. It was observed that the numbers of detected pixels of non-dairy creamer were also strongly correlated with the actual concentration of non-dairy creamer (a correlation coefficient of 0.99, figure not shown).
4. Conclusions
This study reported a method based on Raman spectral imaging for the identification of different components in a complex food matrix. Vanillin, melamine, and sugar were mixed together with powdered non-dairy creamer to create sample mixtures at 10 different concentrations (w/w). Raman spectral images of the sample mixtures were acquired, providing mixed-component spectra for analysis. Self modeling mixture analysis (SMA) was used to extract pure component spectra and corresponding contribution images of the components. The method was able to precisely extract the pure component spectra of vanillin, melamine, and sugar at all concentration levels. The pure component spectra were identified based on spectral information divergence (SID) values. The contribution images obtained by SMA were used to generate Raman chemical images of samples. A simple image processing method was used to color code detected pixels of each component. Numbers of pixels identified for each component were correlated with actual concentrations of the component in the samples. Correlation coefficients of 0.99 were observed between detected numbers of pixels and actual component concentrations. The results show that the method can be utilized for identification of different components and estimation of their concentrations in a complex food matrix. Future research is required to validate this method for higher concentration samples where overlapping particles is not uncommon.
Author Contributions
Sagar Dhakal and Kuanglin Chao conceived and designed the experiments; Sagar Dhakal performed the experiments, Yankun Peng, Jianwei Qin, and Moon Kim helped in the experiment; Sagar Dhakal and Kuanglin Chao analyzed the data; Sagar Dhakal and Diane Chan wrote the paper.
Conflicts of Interest
The authors declare no conflict of interest.
References
- Lockley, A.K.; Bardsley, R.G. DNA-based methods for food authentication. Trends Food Sci. Technol. 2011, 11, 67–77. [Google Scholar] [CrossRef]
- Mafra, I.; Ferreira, I.M.P.L.V.O.; Beatriz, M.; Oliveira, P.P. Food authentication by PCR-based methods. Eur. Food Res. Technol. 2008, 227, 649–665. [Google Scholar] [CrossRef]
- Furtunato, G.; Mumic, K.; Wunderli, S.; Pillonel, L.; Bosset, J.O.; Gremaud, G. Application of strontium isotope abundance ratios measured by MC-ICP-MS for food authentication. J. Anal. Atomic Spectrom. 2004, 19, 227–234. [Google Scholar] [CrossRef]
- Karoui, R.; De Baerdemaeker, J. A review of the analytical methods coupled with chemometric tools for the determination of the quality and identity of dairy products. Food Chem. 2007, 102, 621–640. [Google Scholar] [CrossRef]
- Dhakal, S.; Wu, J.; Chen, J.; Peng, Y. Prediction of egg’s freshness using backward propagation neural network. Appl. Eng. Agric. 2011, 27, 279–285. [Google Scholar] [CrossRef]
- Li, Y.; Dhakal, S.; Peng, Y. A machine vision system for identification of micro-crack in egg shell. J. Food Eng. 2014, 123, 267–273. [Google Scholar] [CrossRef]
- Wu, J.; Peng, Y.; Li, Y.; Wang, W.; Chen, J.; Dhakal, S. Prediction of beef quality attributes using VIS/NIR hyperspectral scattering imaging technique. J. Food Eng. 2012, 109, 267–273. [Google Scholar] [CrossRef]
- Andersen, J.R.; Borggaard, C.; Rasmussen, A.J.; Houmoller, L.P. Optical measurements of pH in meat. Meat Sci. 1999, 53, 135–141. [Google Scholar] [CrossRef]
- Chao, K.; Yang, C.C.; Chen, Y.R.; Kim, M.S.; Chan, D.E. Hyperspectral- multispectral line-scan imaging system for automated poultry carcass inspection applications for food safety. Poult. Sci. 2007, 86, 2450–2460. [Google Scholar] [CrossRef] [PubMed]
- Chao, K.; Yang, C.C.; Kim, M.S.; Chan, D.E. High throughput spectral imaging system for wholesomeness inspection of chicken. Appl. Eng. Agric. 2008, 24, 475–485. [Google Scholar] [CrossRef]
- Qin, J.; Burks, T.; Kim, M.S.; Chao, K.; Ritenour, M.A. Citrus canker detection using hyperspectral reflectance imaging and PCA-based image classification method. Sens. Instrum. Food Qual. Saf. 2008, 2, 168–177. [Google Scholar] [CrossRef]
- Everard, C.D.; Kim, M.S.; Lee, H. A comparison of hyperspectral reflectance and fluorescence imaging techniques for detection of contaminants on spinach leaves. J. Food Eng. 2014, 143, 139–145. [Google Scholar] [CrossRef]
- Kim, T.M.; Lee, H.S.; Kim, M.S.; Lee, W.H.; Cho, B.K. Optimal optical filters of fluorescence excitation and emission for poultry fecal detection. J. Biosyst. Eng. 2012, 37, 265–270. [Google Scholar] [CrossRef]
- Tao, F.; Peng, Y. A nondestructive method for prediction of total viable count in pork meat by hyperspectral scattering imaging. Food Bioprocess Technol. 2015, 8, 17–30. [Google Scholar] [CrossRef]
- Panagou, E.Z.; Papadopoulou, O.; Carstensen, J.M.; Nychas, G.J.E. Potential of multispectral imaging technology for rapid and non-destructive determination of the microbiological quality of beef filets during aerobic storage. Int. J. Food Microbiol. 2014, 174, 1–11. [Google Scholar] [CrossRef] [PubMed]
- Alamprese, C.; Casale, M.; Sinelli, N.; Lanteri, S.; Casiraghi, E. Detection of minced beef adulteration with turkey meat by UV-vis, NIR and MIR spectroscopy. LWT-Food Sci. Technol. 2013, 53, 225–232. [Google Scholar] [CrossRef]
- Gayo, J.; Hale, S.A.; Blanchard, S.M. Quantitative analysis and detection of adulteration in crab meat using visible and near-infrared spectroscopy. J. Agric. Food Chem. 2006, 54, 1130–1136. [Google Scholar] [CrossRef] [PubMed]
- Mamani-Linares, L.W.; Gallo, C.; Alomar, D. Identification of cattle, IIama and horse meat by near infrared reflectance or transflectance spectroscopy. Meat Sci. 2012, 90, 378–385. [Google Scholar] [CrossRef] [PubMed]
- Ding, H.B.; Xu, R.J. Near-infrared spectroscopic technique for detection of beef hamburger adulteration. J. Agric. Food Chem. 2000, 48, 2193–2198. [Google Scholar] [CrossRef] [PubMed]
- Cozzolino, D.; Smyth, H.E.; Gishen, M. Feasibility study on the use of visible and near-infrared spectroscopy together with chemometrics to discriminate between commercial white wines of different varietal origins. J. Agric. Food Chem. 2003, 51, 7703–7708. [Google Scholar] [CrossRef] [PubMed]
- Peng, Y.; Dhakal, S. Optical methods and techniques for meat quality inspection. Trans. ASABE 2015, 58, 1371–1386. [Google Scholar]
- Karoui, R.; Blecker, C. Fluorescence spectroscopy measurement for quality assessment of food systems—A Review. Food Bioprocess Technol. 2011, 4, 364–386. [Google Scholar] [CrossRef]
- EIMasry, G.; Sun, D.W.; Allen, P. Near-infrared hyperspectral imaging for predicting color, pH and tenderness of fresh beef. J. Food Eng. 2012, 110, 127–140. [Google Scholar] [CrossRef]
- Dhakal, S.; Li, Y.; Peng, Y.; Chao, K.; Qin, J.; Guo, L. Prototype instrument development for non-destructive detection of pesticide residue in apple surface using Raman technology. J. Food Eng. 2014, 123, 94–103. [Google Scholar] [CrossRef]
- Qin, J.; Chao, K.; Kim, M.S. Raman chemical imaging system for food safety and quality inspection. Trans. ASABE 2010, 53, 1873–1882. [Google Scholar] [CrossRef]
- Wang, Q.; Li, Z.; Ma, Z.; Liang, L. Real time monitoring of multiple components in wine fermentation using an on-line auto-calibration Raman spectroscopy. Sens. Actuators B: Chem. 2014, 202, 426–432. [Google Scholar] [CrossRef]
- Uysal, R.S.; Soykut, E.A.; Boyaci, I.H.; Topcu, A. Monitoring multiple components in vinegar fermentation using Raman spectroscopy. Food Chem. 2013, 141, 4333–4343. [Google Scholar] [CrossRef] [PubMed]
- Lopez-Diez, E.C.; Bianchi, G.; Goodacre, R. Rapid quantitative assessment of the adulteration of virgin olive oils with hazelnut using Raman spectroscopy and chemometrics. J. Agric. Food Chem. 2003, 51, 6145–6150. [Google Scholar] [CrossRef] [PubMed]
- Argyri, A.A.; Jarvis, R.M.; Wedge, D.; Xu, Y.; Panagou, E.Z.; Goodacre, R.; Nychas, G.J.E. A comparison of Raman and FT-IR spectroscopy for the prediction of meat spoilage. Food Control 2013, 29, 461–470. [Google Scholar] [CrossRef]
- Boyaci, I.H.; Temiz, H.T.; Uysal, R.S.; Velioglu, H.M.; Yadegari, R.J.; Rishkan, M.M. A novel method for discrimination of beef and horsemeat using Raman spectroscopy. Food Chem. 2014, 148, 37–41. [Google Scholar] [CrossRef] [PubMed]
- Dhakal, S.; Chao, K.; Qin, J.; Kim, M.; Chan, D. Raman spectral imaging for quantitative contaminant evaluation in skim milk powder. Food Meas. Charact. 2016, 10, 374–386. [Google Scholar] [CrossRef]
- Dhakal, S.; Chao, K.; Qin, J.; Kim, M.; Schmidt, W.; Chan, D. Parameter selection for Raman spectroscopy- based detection of chemical contaminants in food powders. Trans. ASABE 2016, 59, 751–763. [Google Scholar]
- Dhakal, S.; Chao, K.; Schmidt, W.; Qin, J.; Kim, M.; Chan, D. Evaluation of turmeric powder adulterated with metanil yellow using FT-Raman and FT-IR spectroscopy. Foods 2016, 5, 36. [Google Scholar] [CrossRef]
- Qin, J.; Chao, K.; Kim, M.S. Simultaneous detection of multiple adulterants in dry milk using macro-scale Raman chemical imaging. Food Chem. 2013, 138, 998–1007. [Google Scholar] [CrossRef] [PubMed]
- Zhai, C.; Peng, Y.; Li, Y.; Chao, K. Extraction and identification of mixed pesticides’ Raman signal and establishment of their prediction models. J. Raman Spectrosc. 2016. [Google Scholar] [CrossRef]
- Nienow, A.W.; Harnby, N.; Edwards, M.F. Mixing in the Process Industries, 2nd ed.; Elsevier: Amsterdam, The Netherlands, 1997; pp. 1–24. [Google Scholar]
- Winding, W.; Guilment, J. Interactive self- modeling mixture analysis. Anal. Chem 1991, 63, 1425–1432. [Google Scholar] [CrossRef]
- Winding, W.; Gallagher, N.B.; Shaver, J.M.; Wise, B.M. A new approach for interactive self-modeling mixture analysis. Chemom. Intell. Lab. Syst. 2005, 77, 85–96. [Google Scholar] [CrossRef]
- Chang, C.I. An information theoretic- based approach to spectral variability, similarity and discriminability for hyperspectral image analysis. IEEE Trans. Inf. Theory 2000, 46, 1927–1932. [Google Scholar] [CrossRef]
- Vanja, B.; Patyi, G.; Nagy, Z.; Bodis, A.; Farkas, A.; Marosi, G. Comparison of chemometric methods in the analysis of pharmaceuticals with hyperspectral Raman imaging. J. Raman Spectrosc. 2011, 42, 1977–1986. [Google Scholar]
© 2016 by the authors; licensee MDPI, Basel, Switzerland. This article is an open access article distributed under the terms and conditions of the Creative Commons Attribution (CC-BY) license (http://creativecommons.org/licenses/by/4.0/).