Article

Detection of Proteins Using Nano Magnetic Particle Accumulation-Based Signal Amplification

1
BioMINDS (Bio Micro/Nano Devices and Sensors) Lab, Department of Electrical and Electronics Engineering, Abdullah Gül University, Kayseri 38080, Turkey
2
Bioengineering Department, Abdullah Gül University, Kayseri 38080, Turkey
*
Author to whom correspondence should be addressed.
Appl. Sci. 2016, 6(12), 394; https://doi.org/10.3390/app6120394
Submission received: 4 November 2016 / Revised: 22 November 2016 / Accepted: 24 November 2016 / Published: 29 November 2016
(This article belongs to the Section Nanotechnology and Applied Nanosciences)

Abstract

:
We report a biosensing method based on magnetic particles where coated magnetic particles are used for immunomagnetic separation, and uncoated magnetic particles are used for signal enhancement. To quantify the signal amplification, optical micrographs are analyzed to measure changes in pixel area and pixel intensity. Microcontact-printed surface receptors are arranged in alternating lines on gold chips, enabling differential calculations. In a model experiment, target molecules-streptavidin-are first captured and separated by biotin-coated magnetic particles, and then exposed to a gold surface functionalized with biotin-coupled bovine serum albumin, forming a sandwich assay. Applying a magnetic field and introducing uncoated magnetic particles resulted in accumulation around magnetic particles in the sandwich assay and enhancement of the contrast to noise ratio at least by eight-fold in a range of 0.1–100 μM.

1. Introduction

The advances in micro/nano fabrication methods have led to the development of various biosensing platforms using magnetic particles. Micro/nano-cantilevers [1,2], stripe/wires [3,4], and pores [5,6] are some of the platforms. There are also magnetic particle-based Food and Drug Admisnistration (FDA) approved isolation technologies available in the market [7], and in the literature, many microfluidic devices have been developed for the separation of various biomolecules [4,8,9].
After the separation step, there are various techniques to read out signal from magnetic particles; electrochemical detection [10], magnetometer [11], magnetic remanence [12], magnetoresistance [13,14], hall sensors [15], optical methods such as laser diffraction [16], optical light microscope [17], and fluorescent detection [18]. Common approaches to amplifying the signal from magnetic particle-based biosensors are the use of additional magnetic [16] or nonmagnetic particles, such as labels coated with biomolecules to either bind to a target molecule [19] or bind to magnetic beads [18,20]. In a companion paper [21] we introduced an alternative signal amplification method based on magnetic bead accumulation. Briefly, in this method, immunomagnetic beads are first used to capture and separate the target molecules; then, under an external magnetic field, added uncoated magnetic particles form flocs around the immunomagnetic beads due to magnetic dipole–dipole interactions. These accumulations increase the total volume and area of the magnetic particles, thus resulting in increased pixel area in the recorded images. This method does not require biomolecular interactions for accumulation/signal amplification, and this feature brings some advantages, such as time and cost effectiveness and independence from temperature and pH.
In the previous work, we experimentally investigated accumulation dynamics in detail; in this manuscript, we demonstrate step-by-step the application of this amplification method to a complete biosensing scenario, including target capture, separation, and specific binding to surface receptors. We also explore various quantification methods in this manuscript, such as calculating pixel numbers, pixel intensity changes, and differential pixel numbers from the recorded images to measure the signal amplification.
The first set of experiments was performed to investigate the accumulation of iron nano particles around the magnetic particles already immobilized on the gold chip in a microfluidic chamber, and to investigate the different quantification methods using the recorded images. For this purpose, periodic patterns of biotin-coupled bovine serum albumin (BBSA) were micro contact-printed on gold chips using a polydimethylsiloxane (PDMS) stamp. The uncoated parts of the gold surface were passivated by using bovine serum albumin (BSA). Then, the suspension of streptavidin-coated immunomagnetic particles was transferred onto the gold chip containing BBSA micropatterns for the in situ assembly of gratings. Streptavidin-coated beads were observed to specifically attach to the BBSA micropatterns, while unbound beads were removed by rinsing with phosphate-buffered saline (PBS). Then, the gold chip was placed in a microfluidic chamber made of polymethyl methacrylate (PMMA) to implement magnetic accumulation-based signal amplification. The iron nano particles were injected in the microfluidic channel using a syringe pump, while the external magnetic field was applied perpendicular to fluid flow using permanent magnets (Figure 1). In the first set of experiments, the streptavidin-coated magnetic beads were immobilized on the printed pattern and acted as base beads to attract iron nanoparticles under an applied magnetic field for signal amplification.
The second set of experiments was performed to demonstrate a complete biosensing; streptavidin was chosen as the model target molecule, and biotin-coated magnetic beads were used as the capture and separation agents. The same immobilization process as in the first set of experiments was followed to functionalize the surface. The biotin-coated magnetic beads were added to the medium, containing different concentrations of streptavidin for capturing and separation. After the separation step, the magnetic beads (biotin-coated magnetic beads + streptavidin = streptavidin-loaded magnetic beads) were washed and introduced to the surface forming the sandwich assay on the gold chip as BBSA + streptavidin (target) + immunomagnetic bead (biotin-coated magnetic bead). Then, iron nano particles were added under an external magnetic field for signal amplification (Figure 2). For the second set of experiments, the biotin-coated magnetic beads simultaneously served two main purposes: (1) as immunomagnetic capture agents to capture and separate the target (streptavidin); (2) as base beads immobilized on the surface to attract iron nano particles under an applied magnetic field for signal amplification.
In this method, the biotin-coated magnetic beads serve as target capture and separation agents and as base beads for the magnetic attraction of added uncoated magnetic particles. Applying an external magnetic field and exposing uncoated magnetic particles is the signal amplification step (Video S1). For both steps, images of well-defined and robust patterns of base beads and iron nano particles were recorded to quantify the impact of signal amplification.

2. Materials and Methods

The PMMA was purchased from McMaster Carr (Elmhurst, IL, USA), Neodymium N42 permanent magnets (3 mm × 3 mm) (Hefei Super Electronics, Hefei, China) were purchased from a local hobby shop, biotin and streptavidin-coated superparamagnetic beads 1 μm in diameter were purchased from Chemicell (Berlin, Germany). Iron nanopowder (60–80 nm in diameter), gold-coated slides, PBS, and Bovine Serum Albumin were purchased from Sigma-Aldrich (St. Louis, MO, USA). Biotin-coupled bovine serum albumin (BBSA) and streptavidin was purchased from Thermo-Fisher (Waltham, MA, USA). Optical micrographs were recorded using a Nikon (Melville, NY, USA) microscope connected to a CCD camera (Nikon, Melville, NY, USA). The microfluidic chamber was fabricated layer by layer by cutting PMMA using an Epilog (Golden, CO, USA) laser cutter. The magnetic field inside the microfluidic channel was measured to be 8.5 mT, as explained in the companion work [21]. The PDMS stamp was kindly provided by the Savran Lab of Purdue University.

2.1. Experimental Procedures

2.1.1. Immobilization of BBSA on Gold Chips

After reviewing the literature [22], the incubation times and concentrations related to PDMS stamping were optimized by trial and error. The PDMS stamp that contains 20 μm alternating lines was washed using an ultrasonic cleaner using 70% ethanol and rinsed using 70% ethanol followed by deionized (DI) water. The stamp was gently dried by using a stream of nitrogen gas. The gold chips of size 8.3 mm × 3.8 mm were prepared by first cutting the gold-coated glass slides, cleaning with ethanol and DI water, followed by drying with nitrogen gas. Then, the PDMS stamp was inked with 2 mg/mL of BBSA, and BBSA solution was left on the stamp for 15 min before removing the excess solution from the stamp using a wick of tissue paper. The stamp was again dried using a gentle stream of nitrogen gas. The stamp was brought into contact with the gold chip, and a small force was applied to make a contact between the two surfaces. After waiting for 1 min, the stamp was removed. The gold chip was rinsed gently with PBS to remove the unbound BBSA. In order to passivate the rest of the surface that had no BBSA, the gold chips were covered with a solution of BSA (1 mg/mL) and incubated for 2 min before washing with DI water to remove the unbound BSA.

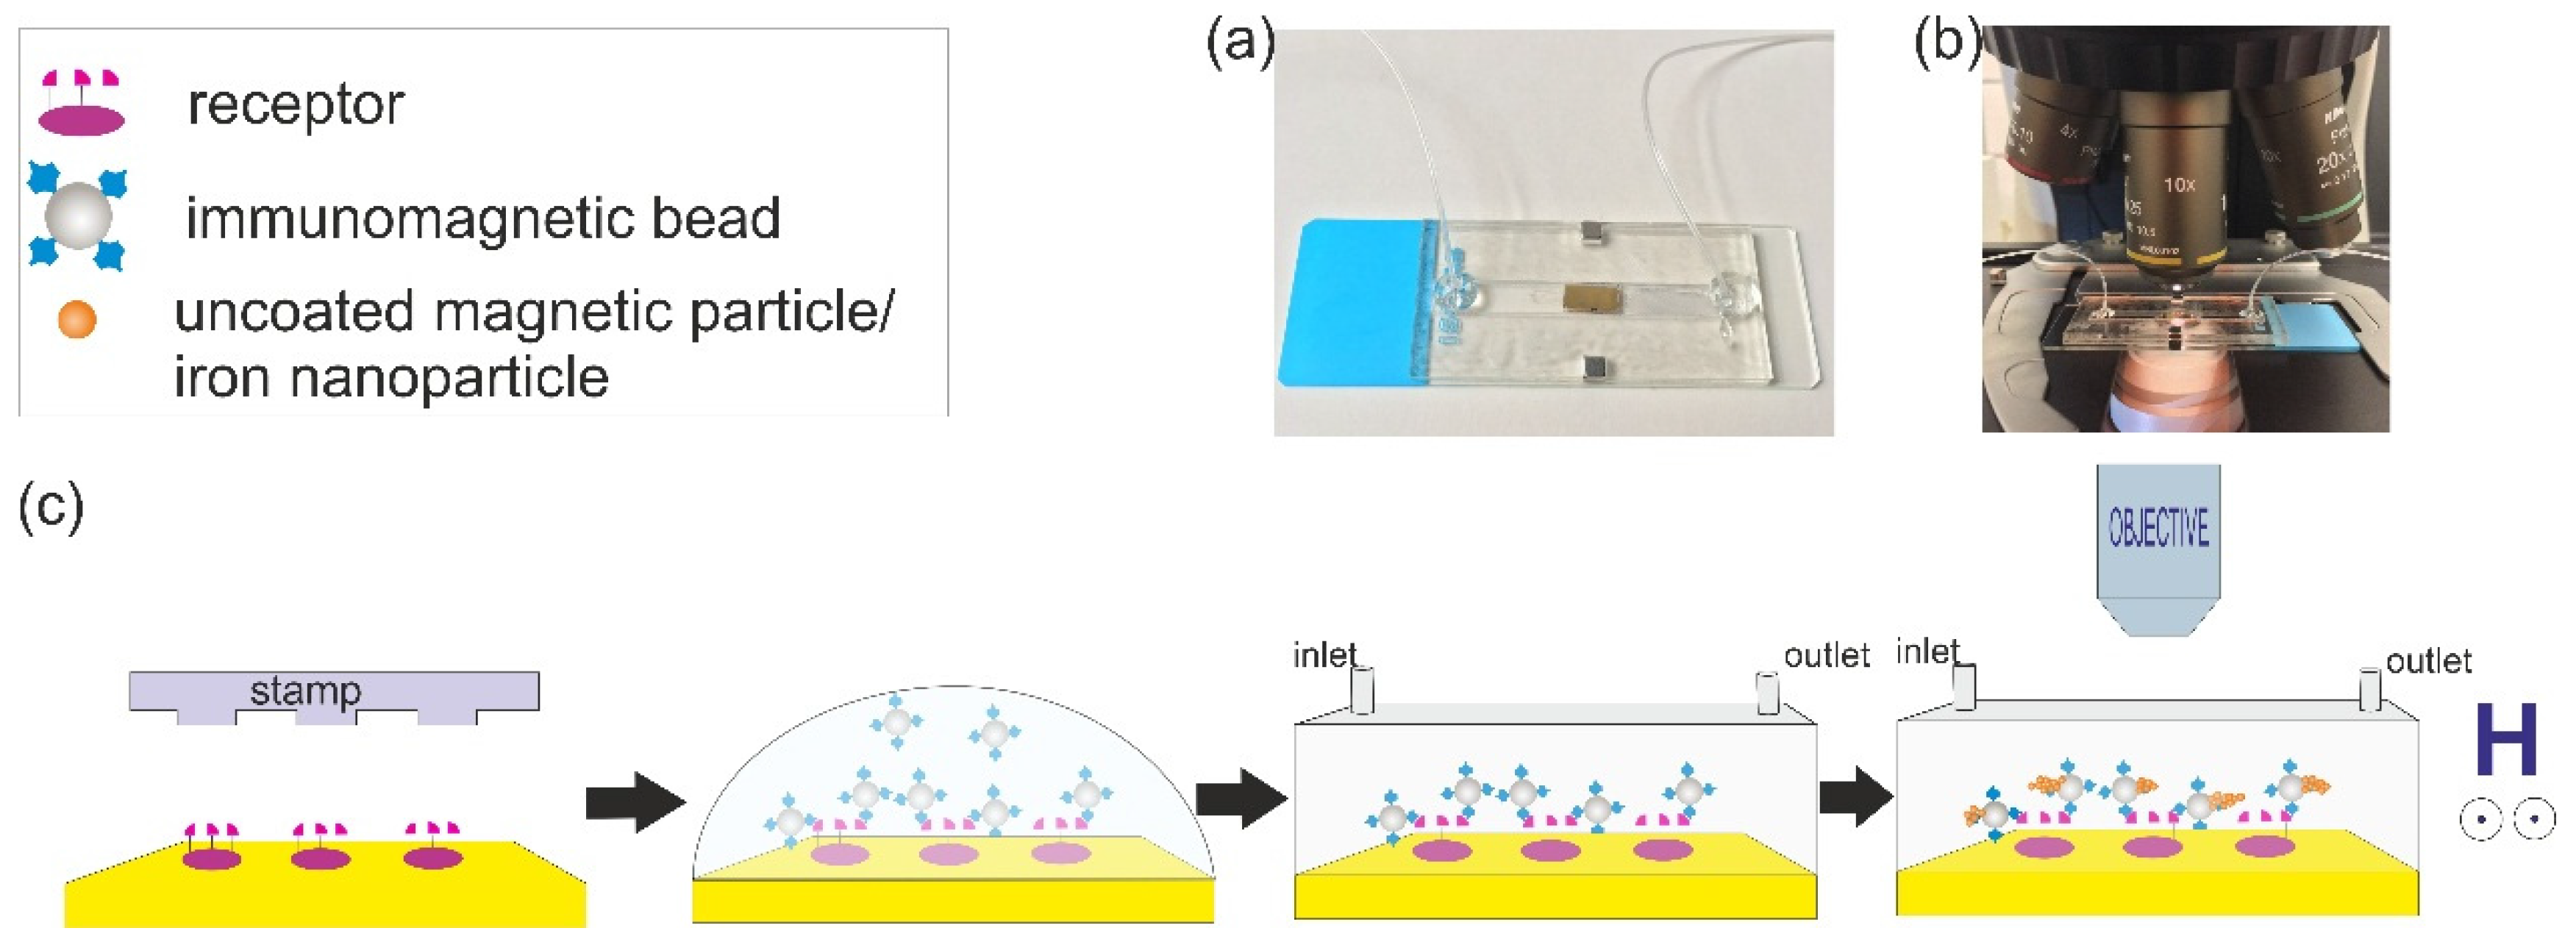
2.1.2. First Set of Experiments: Magnetic Accumulation of Iron Nano Particles around the Immobilized Streptavidin-Coated Magnetic Beads

The purpose of the first experiments was to test the magnetic accumulation of iron nano particles around the immobilized streptavidin-coated magnetic beads, and to determine the quantification method for the measurement of the signal amplification. The streptavidin-coated beads were bound to the BBSA-coated gold chips. Under the applied external magnetic field, the introduced iron nano particles accumulate around the streptavidin-coated beads through magnetic dipole–dipole interaction. Then, images were recorded for quantification of the signal amplification. The concentration of streptavidin-coated magnetic beads was changed, and a fixed amount of iron nano particles was exposed to show that when more base beads were present on the surface, a higher number of iron nano particles accumulate. Figure 1 illustrates the steps followed for the first experiments. The gold chip containing the BBSA pattern was incubated with various concentrations (0.0335 mg/mL, 0.067 mg/mL, 0.67 mg/mL and 6.7 mg/mL) of streptavidin-coated magnetic beads. After 20 min of waiting, the gold chip was washed with DI water and dried. The gold chips with immobilized streptavidin-coated magnetic beads (base beads) were then placed in the fluidic chamber for signal amplification. Two permanent magnets were placed at both sides of the fluidic chamber. The gold chip was placed at exactly the center of the magnetic field where the base beads were magnetized. The fluidic chamber was placed under the microscope, as shown in Figure 1b. Iron nano particles were used as the added beads for signal amplification. After the optimization experiments, a concentration of 0.25 mg/mL of iron nano particles were placed in a syringe. The syringe was connected to the fluidic chamber through the inlet tube, and the iron nano particles were pumped to the fluidic chamber at a rate of 100 μL /min for 3 min. The interaction of the iron nano particles with base beads was observed, and images both before and after amplification were recorded using the optical microscope.

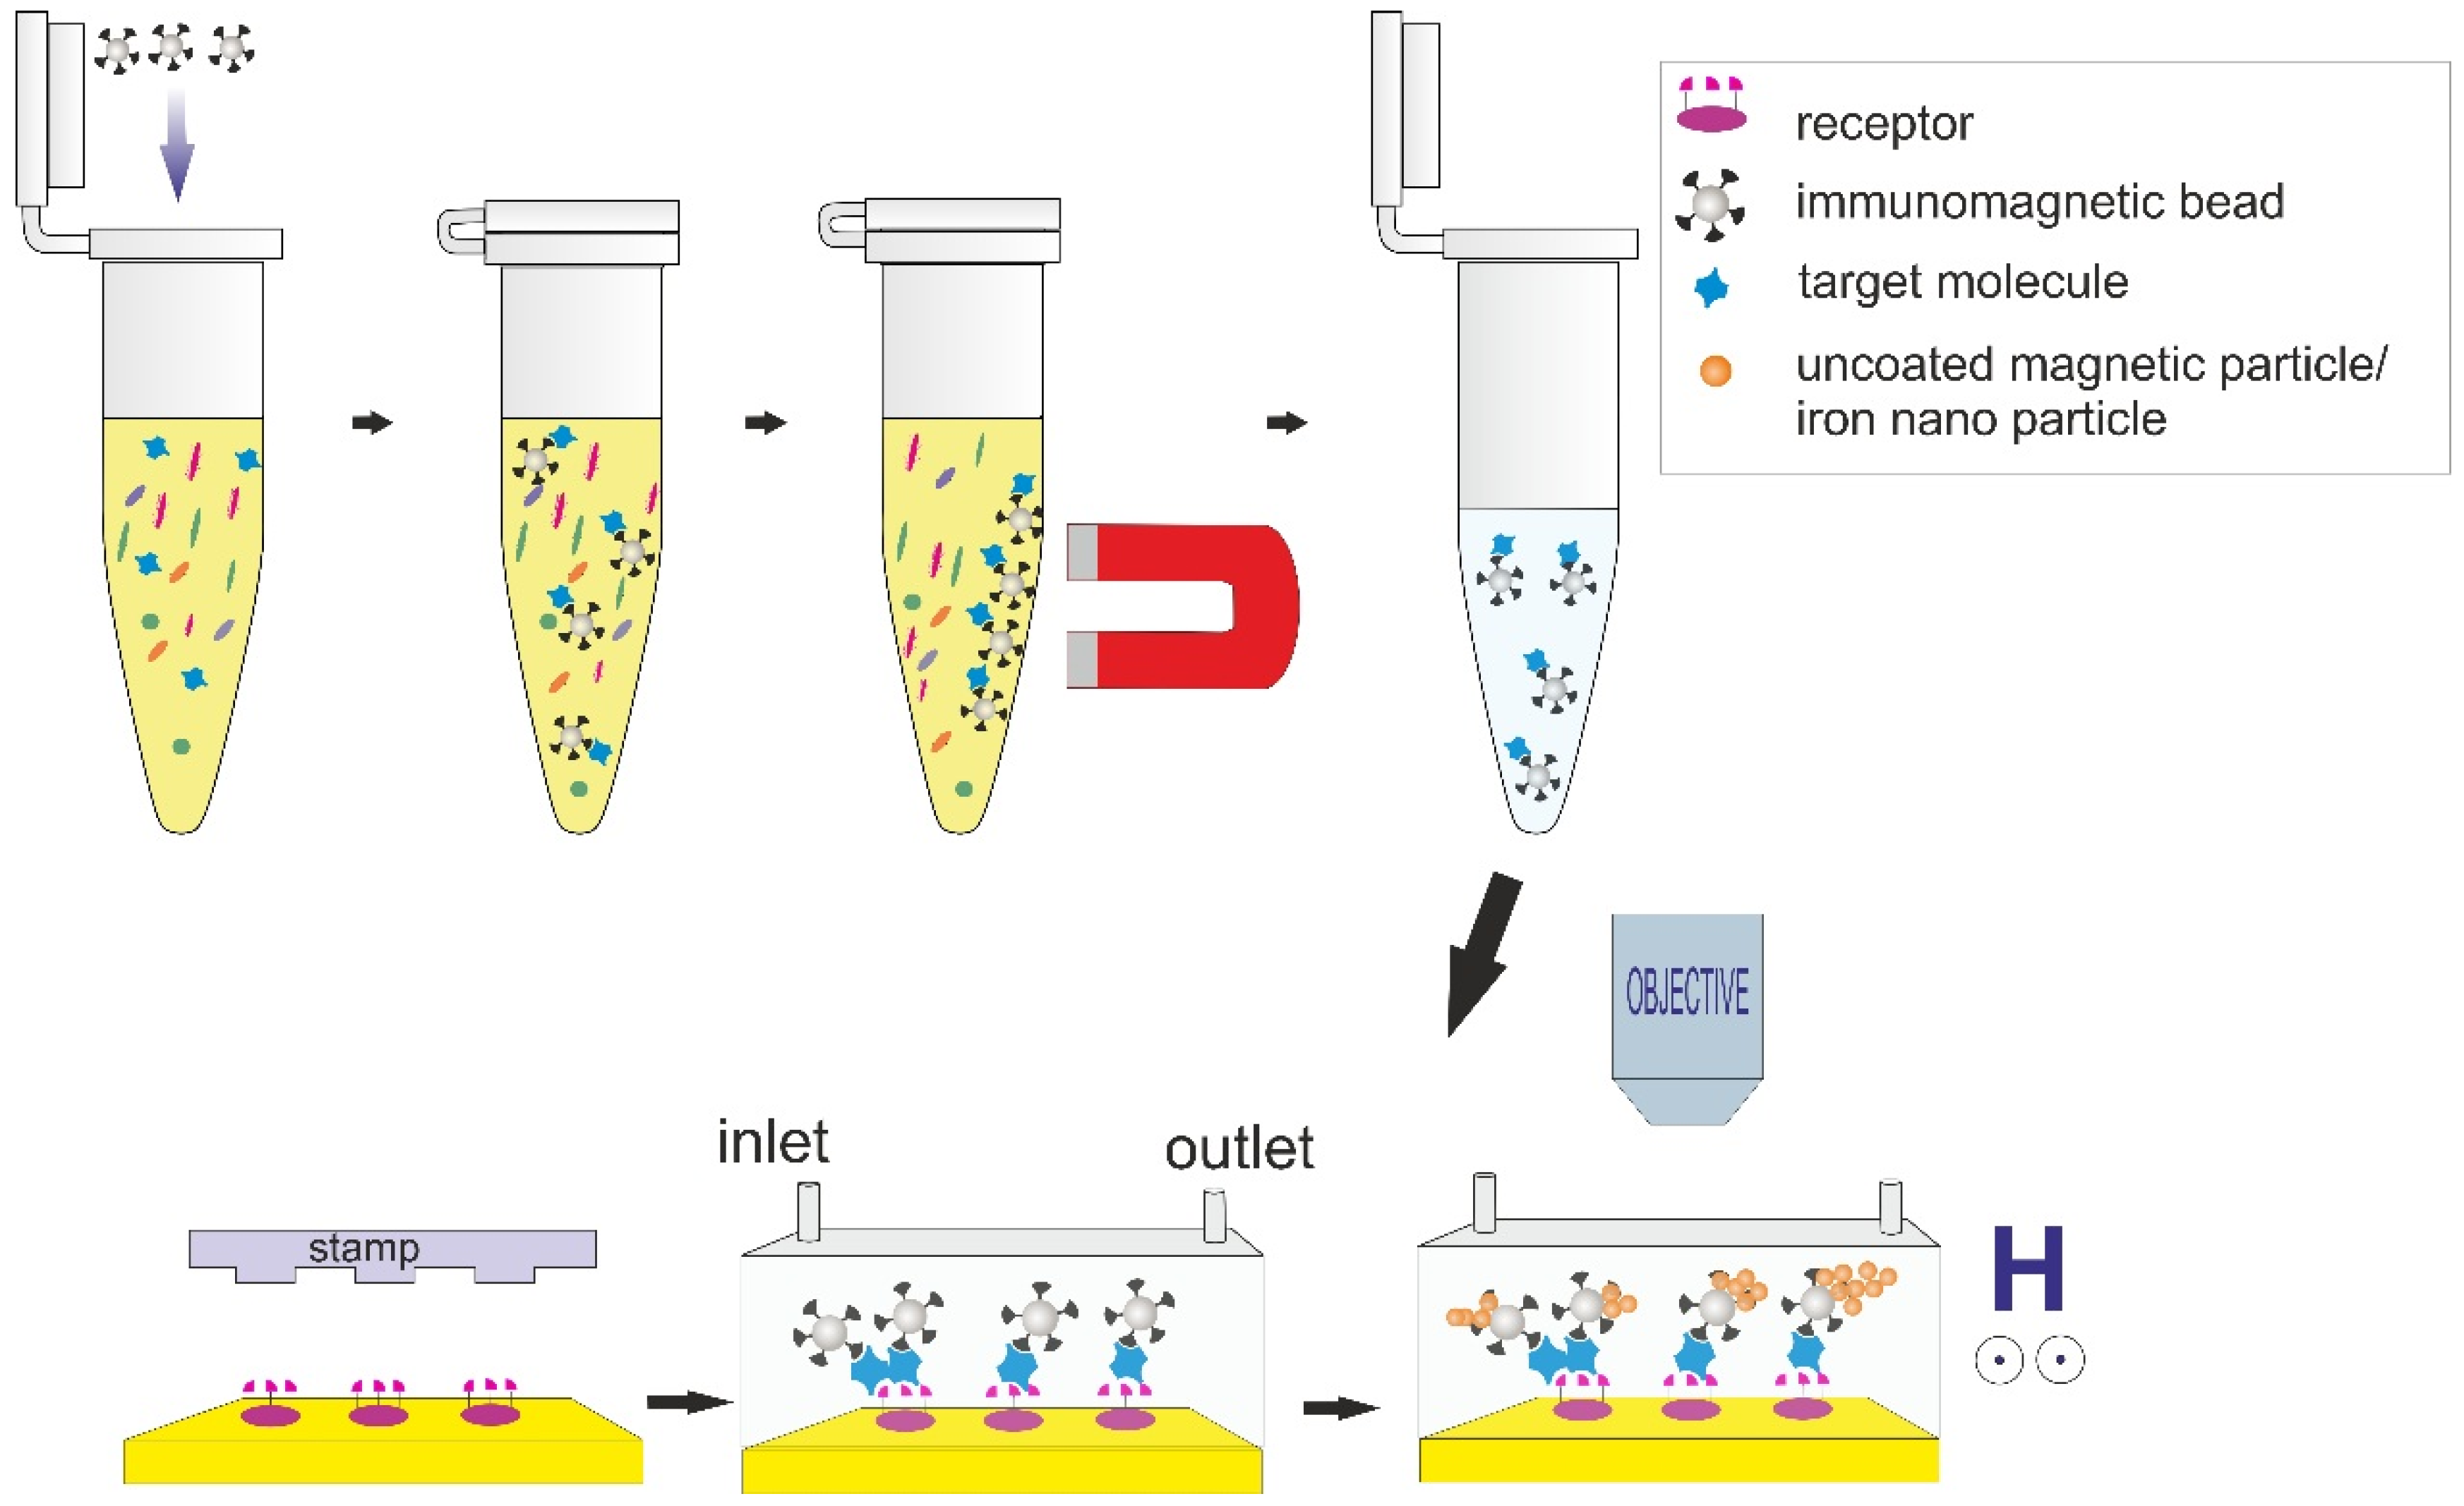
2.1.3. Second Set of Experiments: Detection of Streptavidin (Target Capture, Separation, Sandwich Assay Formation, and then Magnetic Signal Amplification)

The purpose of the second set of experiments was to perform a complete biosensing, including target capture, separation, and immobilization steps, followed by signal amplification and quantification from recorded images. In the first set of experiments, streptavidin-coated magnetic beads were directly bound to surface receptors without any target molecule. In the second set of experiments, biotin-coated magnetic beads were first captured and separated streptavidin, then formed a sandwich assay with the surface receptors (BBSA). Figure 2 illustrates the steps followed for the complete biosensing experiment. Different concentrations (0.1 μM, 1 μM, and 100 μM) of 25 μL of streptavidin were prepared and kept in micro-centrifuge tubes. Then, 35 μL of 100 mg/mL biotin-coated magnetic beads (Chemicell) were added to tubes to capture and separate streptavidin. The mixture was then vortexed for 40 min at 400 rpm. The micro-centrifuge tube was then placed in the magnetic separator and left to stand until all the beads were attracted at one side of the tube and the solution was clear. The supernatant was then pipetted away, and the remaining streptavidin-loaded magnetic beads were washed vigorously twice. The gold chips with the BBSA pattern were incubated with the streptavidin-loaded magnetic particles for 20 min. The same cleaning, amplification, and imaging procedures were followed as explained in the first step.

2.1.4. Quantification Methods
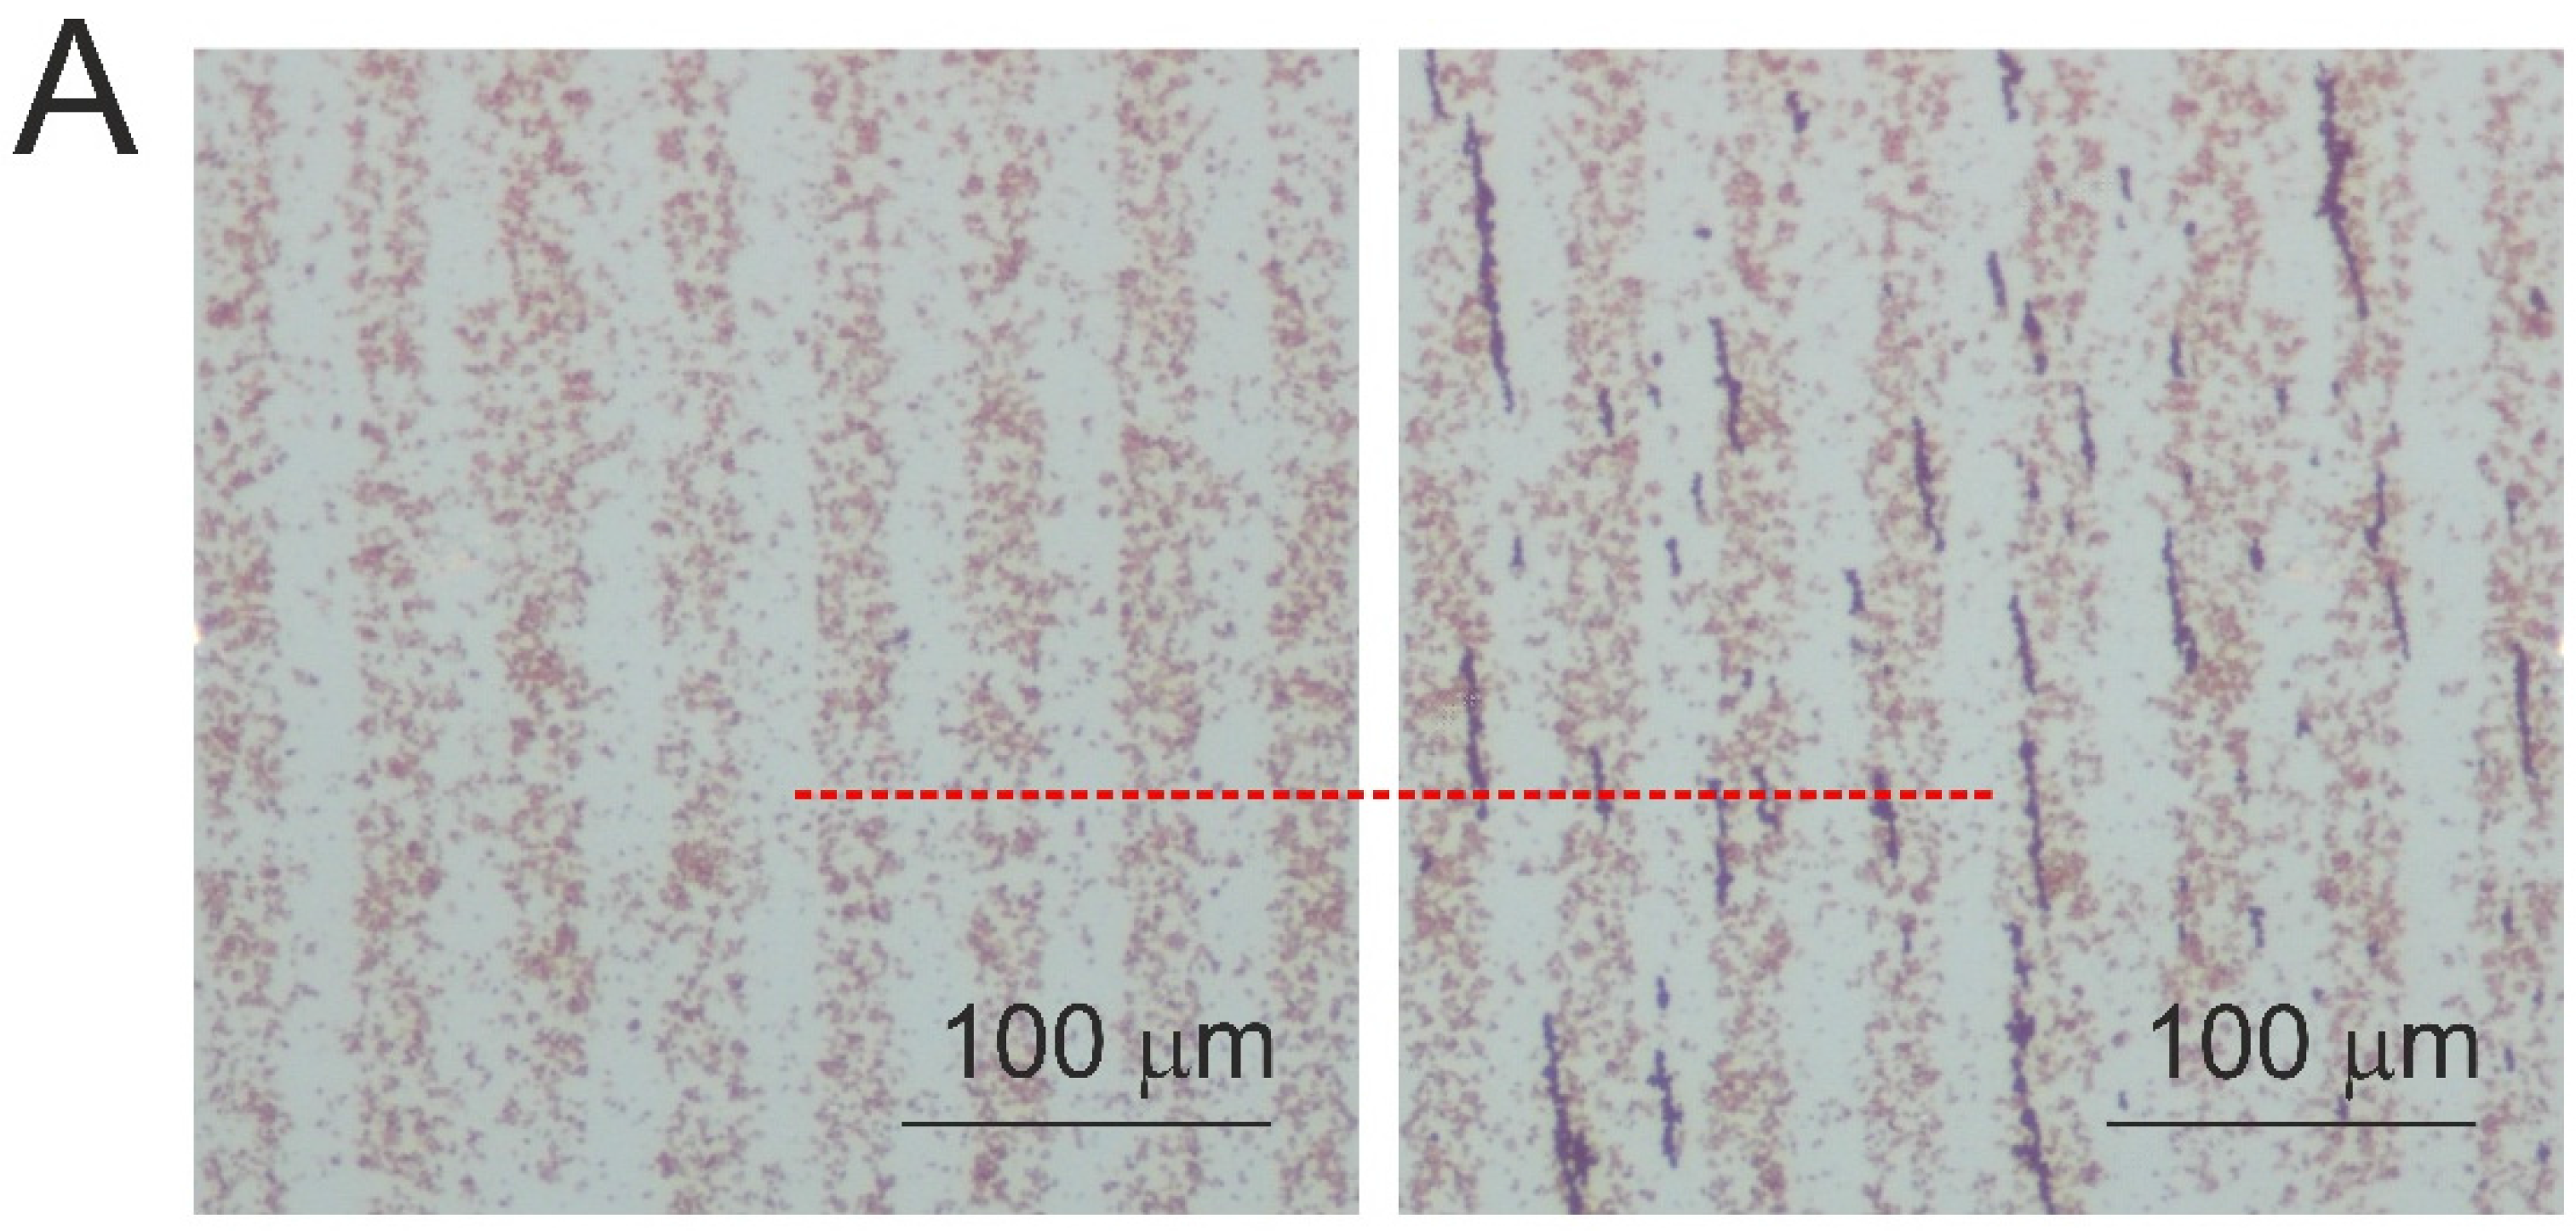
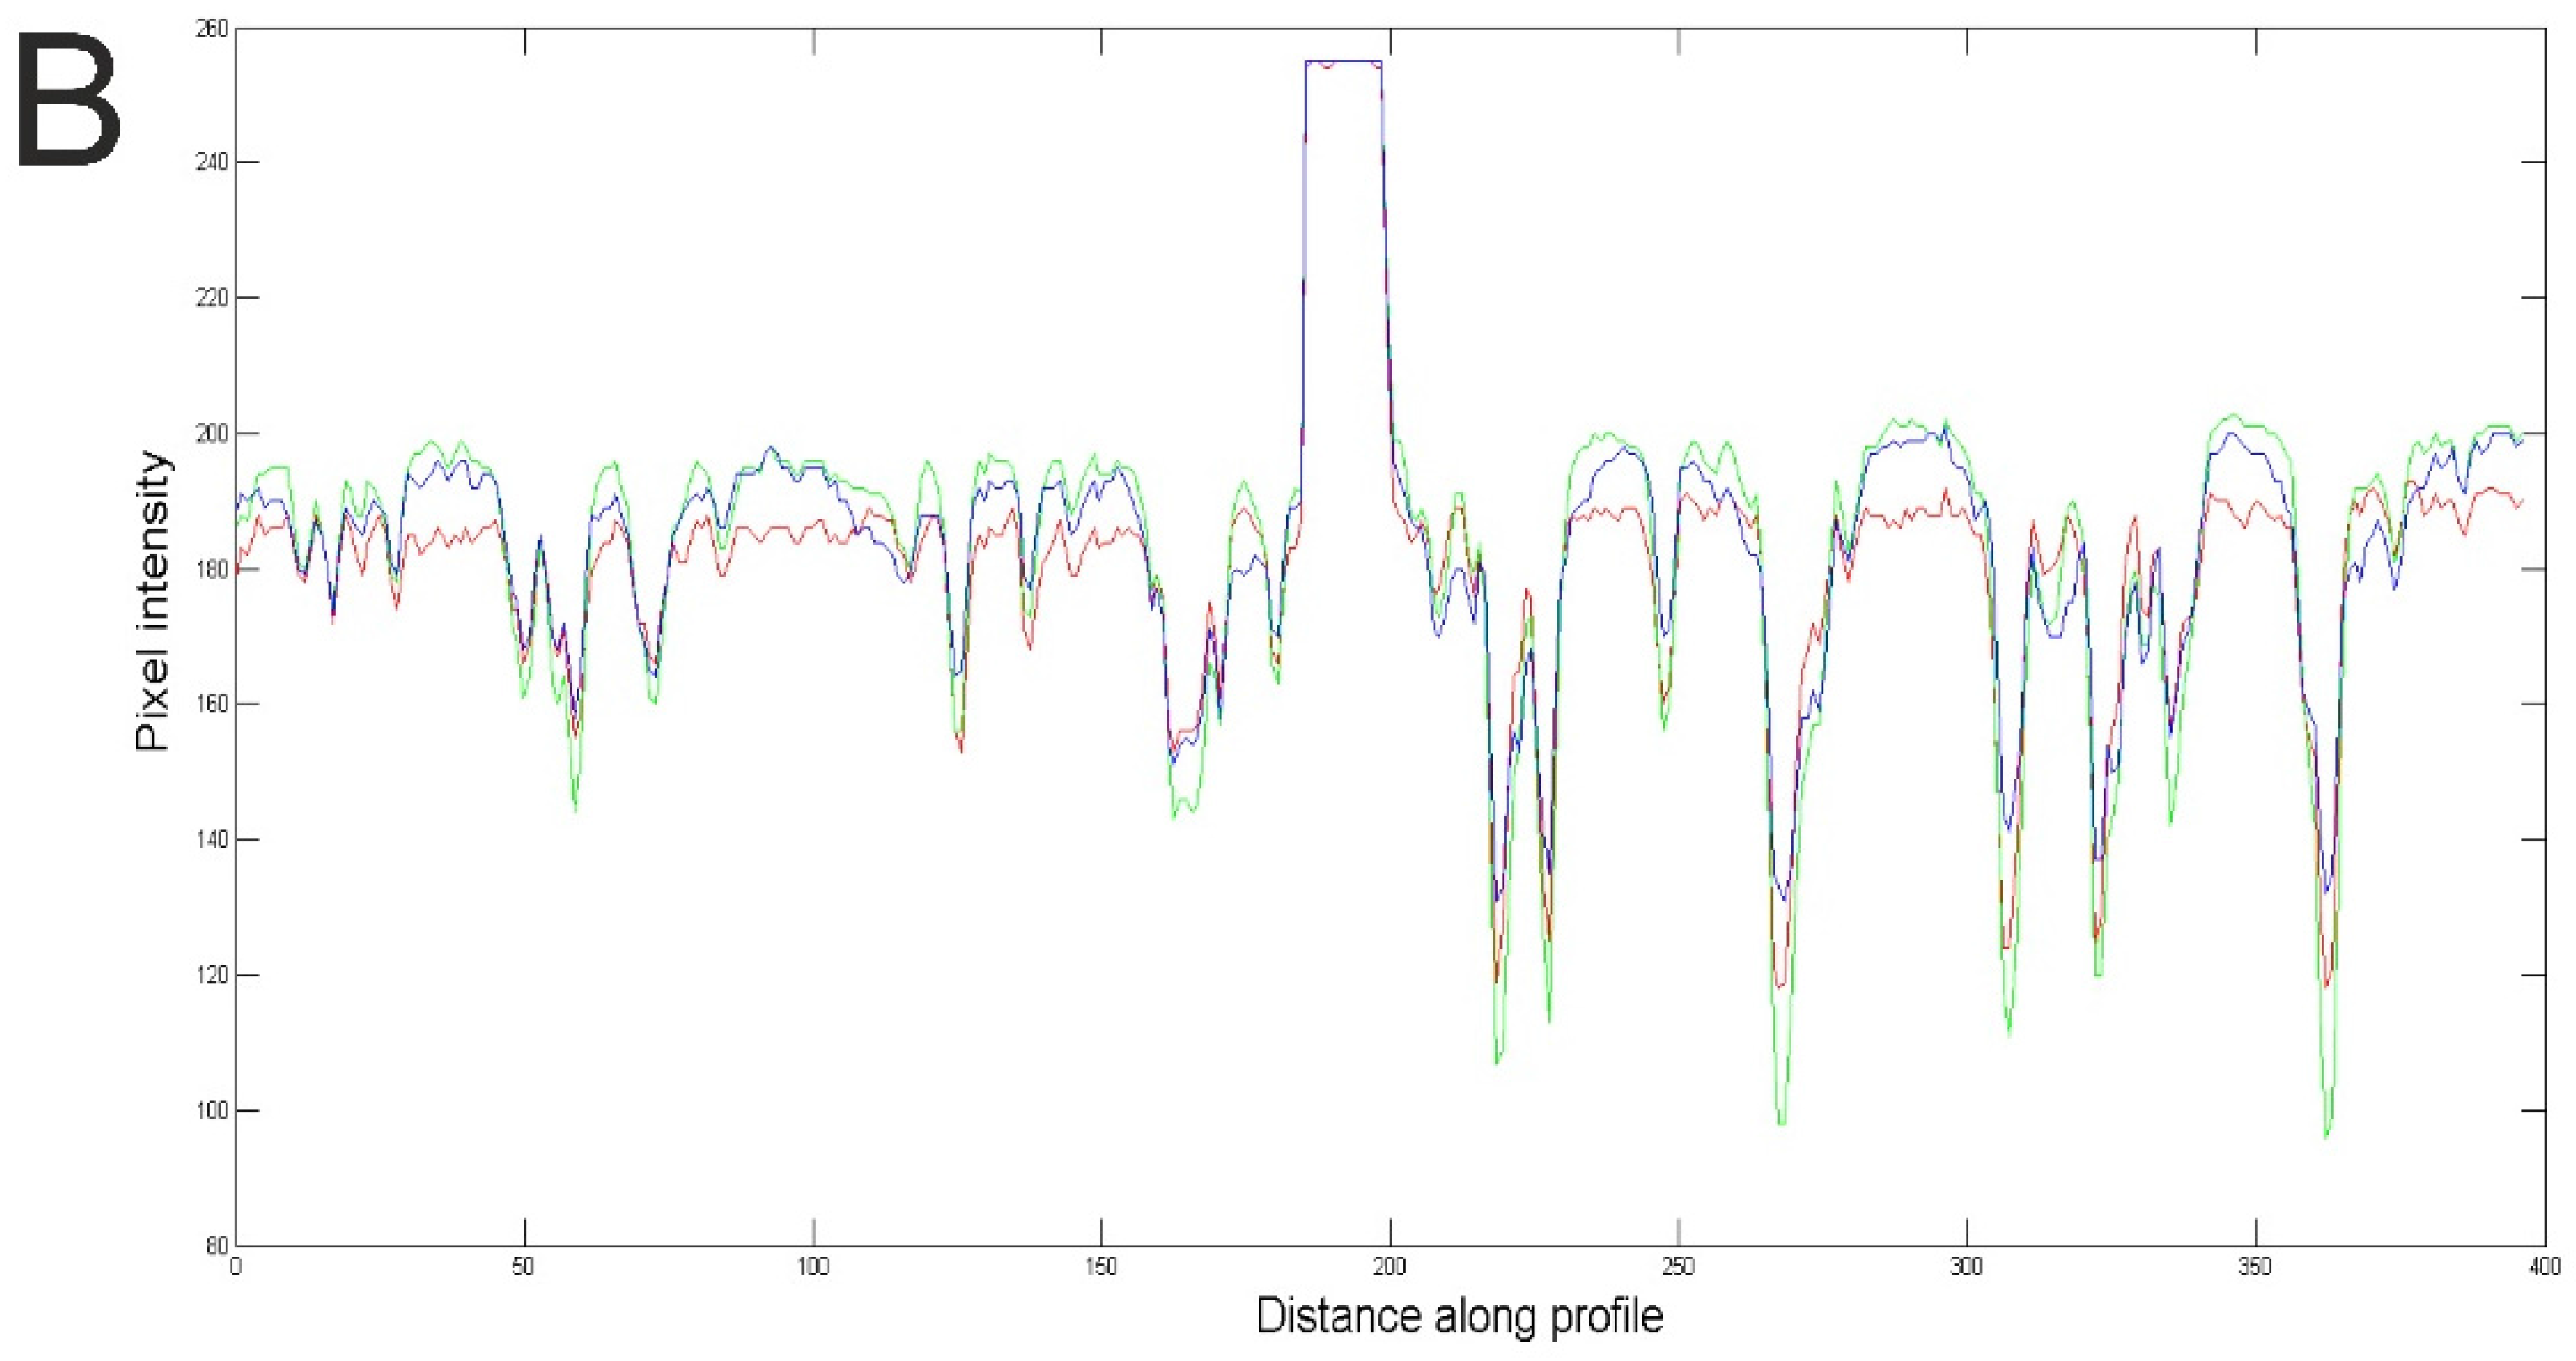
To quantify the signal amplification based on the magnetic dipole–dipole interaction and accumulation, both grey scale and color images were investigated. The recorded images were analyzed using an in-house Matlab (version R14, The Mathworks Inc., Natick, MA, USA) code and ImageJ software (version 1.51e, U.S. National Institutes of Health, Bethesda, MD, USA) [23].
To calculate the pixel area, color images were first converted to grey scale, and by applying dynamic threshold, the background and magnetic particles were assigned to white or black colors. The number of pixels for the magnetic particles in the overall image was counted both for before applying the amplification and after applying the amplification. Having a periodic pattern on the chip (alternating PDMS pattern) enabled differential measurements, defined as the difference between the pixel area of the printed lines and the non-printed lines. Differential measurements provided information about specific and non-specific interactions occurring on the surface.
Δ PN = PN P PN C ,
where PNP is the pixel number of printed area, PNC is the pixel number of the non-printed/control area, and ΔPN is the difference.
The contrast-to-noise ratio (CNR) is widely used in medical image processing to detect differences between two regions in a recorded image, and is defined as [24]
C N R = | μ object μ background | σ background ,
where σbackground is the standard deviation of pixel values in the background, μobject is the mean pixel value of the object, and μbackground is the mean pixel value of the background. Accumulation of iron nano particles around the base beads changed the color intensities, and CNR was calculated to quantify these variations in the color images. Our experiments revealed that the intensity of green color change was higher than changes in the intensity of red and blue colors (Figure 3); for that reason, the green color values in each pixel was used to calculate the CNR for before and after signal amplification for various concentrations.
After the optimization of experimental parameters, all measurements were performed six times to ensure reproducibility and repeatability. From a recorded image, measurements are performed on four different areas approximately defining quadrants of the center point.

3. Results

The purpose of the first set of experiments was to compare the CNR and number of pixel calculations to determine which method to use for the complete biosensing experiments. For that reason, the gold chips were examined, and images were recorded using an optical microscope (Nikon). Figure 4 shows some examples of the gold chips before and after the signal amplification was applied. The different concentrations of streptavidin-coated beads (base beads) were added on the gold chips, and the same amount of iron nano particles was injected into the microfluidic chamber (Figure 4). The number of pixels and CNR values were calculated from the images recorded before and after the injection of iron nano particles. These experiments reveal that the amount of iron nano particles accumulated around the base beads depends on the number of base beads present on the gold surface. As the concentration of base beads was increased, the amount of nano particles that accumulated around the base beads also increased.
By optimizing the flow parameters, concentrations, and magnetic field strength, the magnetic accumulation can be controlled and used to amplify the CNR. Minimum six-fold, and maximum nine-fold CNR amplifications were calculated from the recorded images (Figure 4A). However, calculating the number of pixels for before and after the amplification step revealed only one or two-fold amplification (Figure 4B).
Calculating CNR as a quantification method resulted in higher amplification ratios compared to calculating the pixel area of the beads on the surface. In light of the first set of experiments, calculating the CNR was the preferred quantification method for the streptavidin detection experiments.
For the second set of experiments, streptavidin was chosen as the target molecule, and biotin-coated magnetic particles were used as the capture agents. Figure 5 shows some examples of the gold chips for the streptavidin detection experiments. After the images were recorded, they were processed to calculate the CNR. Figure 5 demonstrates the dependence of CNR on the target concentration. As a result of streptavidin detection experiments based on magnetic dipole–dipole interaction and accumulation, a minimum eight-fold amplification in CNR was recorded.
The exact same procedure was followed for the control experiments, except no streptavidin was added to the mixture tubes. Biotin-coated magnetic beads did not significantly bind to BBSA-functionalized gold chips, and patterns were not formed as expected (Figure 5A). After adding the same amount of iron nano particles, due to the magnetic field, some iron nano particles accumulated around each other and were not washed away. For the 0 streptavidin case, CNR was measured as 24, and the distribution of iron nano particles on the gold surface was random. In order to show the impact of base beads on the distribution of iron nano particles, the number of iron nano particles on the printed lines and non-printed lines were counted using image-processing tools (Matlab code and ImageJ). For the 0 nM streptavidin case, the average difference in the number of pixels between the printed and non-printed lines was ΔPN = 69, whereas the average difference ΔPN was above 1500 for the 100 nM concentration (Figure 5B).

4. Discussion and Conclusions

In this paper, we described a new method of integrating magnetic particles and image processing for the detection of biomolecules. The micrometer-sized magnetic beads used in this study had two important functions: (1) as agents of immunomagnetic capture and separation; and (2) acting as base beads on a chip to attract added magnetic particles under an applied magnetic field. The PDMS stamp formed alternating lines of probe molecules on the surface, and these alternating lines allowed differential measurements on the same chip.
It is known that immunomagnetic diffractometry for the detection of various important biomolecules related to diseases has shown potential as a simple and sensitive method [22,25]. In this paper, we demonstrated that the magnetic accumulation-based signal amplification method can be easily integrated with the existing immunomagnetic diffractometry methods. Simply applying an external magnetic field and introducing magnetic particles as an additional step would result in six-fold signal enhancement. As a comparison, in our previous work [16], in order to reach four-to-five-fold signal amplification on a chip, temperature control, extra biomolecules, and extra time were needed. The magnetic accumulation-based signal amplification method does not require expensive fluorescent and radioactive labels or time-consuming multiple signal enhancement steps. It is rapid, easy to implement, and inexpensive.
There are several signal transduction methods used in biosensors. In this manuscript, we showed that image processing could be considered as a signal readout method for point-of-care devices. We calculated pixel areas and intensity values (CNR) to quantify the amount of micro and nano particle accumulation on the chip. This signal readout method can be considered as an alternative to laser-based methods, where a laser beam illuminates the diffraction gratings and spots of varying intensities are formed from the reflected light. An optical setup including photo detectors and lenses together with a voltage filter/amplifier are needed to measure the intensity of the spots [26]. Such a laser based measurement method is sensitive but bulky. Cell phone cameras and processing powers are improving from day-to-day, and as a result, cellphone microscopes are becoming popular to acquire images [27]. New strategies have been developed to utilize the improved hardware and software features of cell phones to use them for microscopy [28,29]. Using images to calculate CNR for quantification shows that it is possible to use mobile devices as signal read out devices for the chips having diffraction gratings. The CNR measurements reveal that added iron nano particles accumulate around the base beads and act as contrast agents to enhance the signal. This signal enhancement on the chip has the potential to be integrated with simpler signal readout systems such as cellphone microscopy [30], and thus can be used in devices for point-of-care diagnostics. Figure 5 shows an image of the control experiment where 0 nM streptavidin was used, and biotin-coated magnetic beads were washed away from the surface. However, even though there was not a significant amount of base beads, some of the added iron nano particles for signal amplification were present on the surface due to the applied external magnetic field, resulting in an offset CNR value of 24. Few iron nano particles were distributed randomly on the surface along the magnetic field lines. In order to show the impact of base beads on the distribution of iron nano particles, a differential measurement was performed by calculating the ΔPN (Figure 5B bottom). As a result of the PDMS alternating pattern, the differential measurement showed a clear difference between the control and sensing concentrations. Even though the CNR offset value (24) for the control experiment was lower than the CNR value (40 for 100 mM of streptavidin) and results in a clear difference, the ΔPN calculations also revealed that iron nano particles do not present on the surface just because of the external magnetic field, but iron nano particles interact with the base beads and accumulate specifically on the printed patterns.
In this work, we demonstrated streptavidin detection and signal amplification in the range of 0.1–100 μM. After obtaining the calibration curve (e.g., Figure 5B), the unknown target concentration can be determined by measuring the CNR and finding the corresponding concentration. However, we were limited to the use of magnetic particles that are commercially available and not specially optimized for signal enhancement. In our companion work [21], we investigated the impact of parameters on the amount of accumulation. Based on our experiments, we believe that it is possible to design and synthesize magnetic particles whose magnetic content and size are optimized for both target capture and signal amplification purposes. Such custom-made magnetic particles can yield higher amplification ratios, and can result in an improvement of the minimum detectable signal. Our next goal is to implement the technique to detect biologically significant targets such as serum markers or bacteria and improve the detection limit.

Supplementary Materials

The following are available online at www.mdpi.com/2076-3417/6/12/394/s1, Video S1: Magnetic accumulation of uncoated iron nano particles around the surface immobilized coated magnetic particles (dipole-dipole interaction under an external magnetic field).

Acknowledgments

Authors acknowledge The Scientific and Technological Research Council of Turkey (TÜBİTAK) (Project No.: 114E886) and Abdullah Gül University Scientific Research Program (AGU BAP) (2015-11) for financial support. Authors thank to Cagri Savran and Chun-Li Chang from Purdue University for the fabrication of PDMS stamps and Omary Mzava acknowledges TÜBİTAK for the scholarship (2215).

Author Contributions

K.İ. conceived and designed the experiments; O.M. performed the experiments; K.İ. and O.M. analyzed the data; K.İ. wrote the paper.

Conflicts of Interest

The authors declare no conflict of interest.

References

  1. İçöz, K.; Savran, C. Nanomechanical biosensing with immunomagnetic separation. Appl. Phys. Lett. 2010, 97. [Google Scholar] [CrossRef]
  2. Icoz, K.; Iverson, B.D.; Savran, C. Noise analysis and sensitivity enhancement in immunomagnetic nanomechanical biosensors. Appl. Phys. Lett. 2008, 93. [Google Scholar] [CrossRef]
  3. Janssen, X.J.A.; van IJzendoorn, L.J.; Prins, M.W.J. On-chip manipulation and detection of magnetic particles for functional biosensors. Biosens. Bioelectron. 2008, 23, 833–838. [Google Scholar] [CrossRef] [PubMed]
  4. Inglis, D.W.; Riehn, R.; Austin, R.H.; Sturm, J.C. Continuous microfluidic immunomagnetic cell separation. Appl. Phys. Lett. 2004, 85, 5093–5095. [Google Scholar] [CrossRef]
  5. Earhart, C.M.; Hughes, C.E.; Gaster, R.S.; Ooi, C.C.; Wilson, R.J.; Zhou, L.Y.; Humke, E.W.; Xu, L.; Wong, D.J.; Willingham, S.B.; et al. Isolation and mutational analysis of circulating tumor cells from lung cancer patients with magnetic sifters and biochips. Lab Chip 2014, 14, 78–88. [Google Scholar] [CrossRef] [PubMed]
  6. Chang, C.; Jalal, S.I.; Huang, W.; Mahmood, A.; Matei, D.E.; Savran, C.A. High-throughput immunomagnetic cell detection using a microaperture chip system. 2014, 14, 3008–3013. [Google Scholar] [CrossRef]
  7. Zborowski, M.; Chalmers, J.J. Rare cell separation and analysis by magnetic sorting. Anal. Chem. 2011, 83, 8050–8056. [Google Scholar] [CrossRef] [PubMed]
  8. Forbes, T.P.; Forry, S.P. Microfluidic magnetophoretic separations of immunomagnetically labeled rare mammalian cells. Lab Chip 2012, 12, 1471–1479. [Google Scholar] [CrossRef] [PubMed]
  9. Nath, P.; Moore, L.R.; Zborowski, M.; Roy, S.; Fleischman, A. A method to obtain uniform magnetic-field energy density gradient distribution using discrete pole pieces for a microelectromechanical-system- based magnetic cell separator. J. Appl. Phys. 2006, 99, 2004–2007. [Google Scholar] [CrossRef]
  10. Choi, J.-W.; Oh, K.W.; Thomas, J.H.; Heineman, W.R.; Halsall, H.B.; Nevin, J.H.; Helmicki, A.J.; Henderson, H.T.; Ahn, C.H. An integrated microfluidic biochemical detection system for protein analysis with magnetic bead-based sampling capabilities. Lab Chip 2002, 2, 27–30. [Google Scholar] [CrossRef] [PubMed]
  11. Yu, D.; Ruangchaithaweesuk, S.; Yao, L.; Xu, S. Detecting molecules and cells labeled with magnetic particles using an atomic magnetometer. J. Nanopart. Res. 2012, 14. [Google Scholar] [CrossRef]
  12. Hao, L.; Aßmann, C.; Gallop, J.C.; Cox, D.; Ruede, F.; Kazakova, O.; Josephs-Franks, P.; Drung, D.; Schurig, T. Detection of single magnetic nanobead with a nano-superconducting quantum interference device. Appl. Phys. Lett. 2011, 98. [Google Scholar] [CrossRef] [Green Version]
  13. Rife, J.C.; Miller, M.M.; Sheehan, P.E.; Tamanaha, C.R.; Tondra, M.; Whitman, L.J. Design and performance of GMR sensors for the detection of magnetic microbeads in biosensors. Sens. Actuators A Phys. 2003, 107, 209–218. [Google Scholar] [CrossRef]
  14. Huang, H.-T.; Ger, T.-R.; Lin, Y.-H.; Wei, Z.-H. Single cell detection using a magnetic zigzag nanowire biosensor. Lab Chip 2013, 13, 3098–3104. [Google Scholar] [CrossRef] [PubMed]
  15. Besse, P.-A.; Boero, G.; Demierre, M.; Pott, V.; Popovic, R. Detection of a single magnetic microbead using a miniaturized silicon Hall sensor. Appl. Phys. Lett. 2002, 80. [Google Scholar] [CrossRef]
  16. Lee, J.; Icoz, K.; Roberts, A.; Ellington, A.D.; Savran, C.A. Diffractometric detection of proteins using microbead-based rolling circle amplification. Anal. Chem. 2010, 82, 197–202. [Google Scholar] [CrossRef] [PubMed]
  17. Cooper, R.M.; Leslie, D.C.; Domansky, K.; Jain, A.; Yung, C.; Cho, M.; Workman, S.; Super, M.; Ingber, D.E. A microdevice for rapid optical detection of magnetically captured rare blood pathogens. Lab Chip 2014, 14, 182–188. [Google Scholar] [CrossRef] [PubMed]
  18. Mai, T.D.; Pereiro, I.; Hiraoui, M.; Viovy, J.-L.; Descroix, S.; Taverna, M.; Smadja, C. Magneto-immunocapture with on-bead fluorescent labeling of amyloid-β peptides: Towards a microfluidized-bed-based operation. Analyst 2015, 140, 5891–5900. [Google Scholar] [CrossRef] [PubMed]
  19. Fan, A.; Lau, C.; Lu, J. Magnetic bead-based chemiluminescent metal immunoassay with a colloidal gold label. Anal. Chem. 2005, 77, 3238–3242. [Google Scholar] [CrossRef] [PubMed]
  20. Malhotra, R.; Patel, V.; Chikkaveeraiah, B.V.; Munge, B.S.; Cheong, S.C.; Zain, R.B.; Abraham, M.T.; Dey, D.K.; Gutkind, J.S.; Rusling, J.F. Ultrasensitive detection of cancer biomarkers in the clinic by use of a nanostructured microfluidic array. Anal. Chem. 2012, 84, 6249–6255. [Google Scholar] [CrossRef] [PubMed]
  21. Mzava, O.; Taş, Z.; İçöz, K. Magnetic micro/nanoparticle flocculation-based signal amplification for biosensing. Int. J. Nanomed. 2016, 11, 2619–2631. [Google Scholar]
  22. Acharya, G.; Chang, C.L.; Doorneweerd, D.D.; Vlashi, E.; Henne, W.A.; Hartmann, L.C.; Low, P.S.; Savran, C.A. Immunomagnetic diffractometry for detection of diagnostic serum markers. J. Am. Chem. Soc. 2007, 129, 15824–15829. [Google Scholar] [CrossRef] [PubMed]
  23. ImageJ. Available online: https://imagej.nih.gov/ij/ (accessed on 23 September 2016).
  24. Gomi, T. Dual-energy subtraction X-ray digital tomosynthesis: Basic physical evaluation. Open J. Med. Imaging 2012, 2, 111–117. [Google Scholar] [CrossRef]
  25. Acharya, G.; Chang, C.L.; Holland, D.P.; Thompson, D.H.; Savran, C.A. Rapid detection of S-adenosyl homocysteine using self-assembled optical diffraction gratings. Angew. Chem. Int. Ed. 2008, 47, 1051–1053. [Google Scholar] [CrossRef] [PubMed]
  26. Chang, C.L.; Acharya, G.; Savran, C.A. In situ assembled diffraction grating for biomolecular detection. Appl. Phys. Lett. 2007, 90. [Google Scholar] [CrossRef]
  27. Arpa, A.; Wetzstein, G.; Lanman, D.; Raskar, R. Single lens off-chip cellphone microscopy. In IEEE Computer Society Conference on Computer Vision and Pattern Recognition Workshops; IEEE: Piscataway, NJ, USA, 2012; pp. 23–28. [Google Scholar]
  28. Seo, S.; Su, T.-W.; Tseng, D.K.; Erlinger, A.; Ozcan, A. Lensfree holographic imaging for on-chip cytometry and diagnostics. Lab Chip 2009, 9, 777–787. [Google Scholar] [CrossRef] [PubMed]
  29. Smith, Z.J.; Chu, K.; Espenson, A.R.; Rahimzadeh, M.; Gryshuk, A.; Molinaro, M.; Dwyre, D.M.; Lane, S.; Matthews, D.; Wachsmann-Hogiu, S. Cell-phone-based platform for biomedical device development and education applications. PLoS ONE 2011, 6. [Google Scholar] [CrossRef] [PubMed]
  30. İçöz, K. Image processing and cell phone microscopy to analyze the immunomagnetic beads on micro-contact printed gratings. Appl. Sci. 2016, 6. [Google Scholar] [CrossRef]
Figure 1. Schematic of the first set of experiments: iron nano particle accumulation around immobilized base beads. (a) Picture of the microfluidic chamber including gold chip inside and permanent magnets; (b) Picture of the measurement setup; (c) Illustration of the immobilization of immunomagnetic beads on gold chip and accumulation of iron nano particles.
Applsci 06 00394 g001
Figure 2. Schematic of the complete biosensing experiments: streptavidin was used as the target molecule, biotin-coated beads captured and separated the target, signal amplification occurred in the microfluidic chamber using iron nano particles.
Applsci 06 00394 g002
Figure 3. Impact of iron nano particles. (A) Optical micrographs of the gold surface before and after magnetic signal amplification; (B) Pixel intensity changes along the red reference line for red, green, and blue colors.
Applsci 06 00394 g003aApplsci 06 00394 g003b
Figure 4. (A) Optical micrographs of some of the gold surface before and after magnetic signal amplification; (B) The contrast-to-noise ratio (CNR) and calculated number of pixels of the images in (A) for the corresponding concentrations in the range of 0.0335–6.7 mg/mL. Values are mean ± standard error of the mean.
Applsci 06 00394 g004
Figure 5. (A) Optical micrographs of some of the gold chips for streptavidin detection before and after magnetic signal amplification; (B) The calculated CNR and ΔPN using the images in (A). Values are mean ± standard error of the mean.
Applsci 06 00394 g005

