
Novel Predictive Model of the Debonding Strength for Masonry Members Retrofitted with FRP


Abstract
:1. Introduction
2. Shear Strength Contribution of FRP
3. Overview of Genetic Programming
4. Results and Discussion
5. Conclusions
Acknowledgments
Author Contributions
Conflicts of Interest
References
- Maruccio, C. Numerical Analysis of FRP Strengthened Masonry Structures. Ph.D. Thesis, University of Minho, Portugal and Sapienza University of Rome, Rome, Italy, 2010. [Google Scholar]
- Brencich, A.; Gambarotta, L. Mechanical response of solid clay brickwork under eccentric loading. Part ii: Cfrp reinforced masonry. Mater. Struct. 2005, 38, 267–273. [Google Scholar] [CrossRef]
- Grande, E.; Milani, G.; Sacco, E. Modelling and analysis of FRP-strengthened masonry panels. Eng. Struct. 2008, 30, 1842–1860. [Google Scholar] [CrossRef]
- Grande, E.; Imbimbo, M.; Sacco, E. Bond behaviour of CFRP laminates glued on clay bricks: Experimental and numerical study. Compos. Part B: Eng. 2011, 42, 330–340. [Google Scholar] [CrossRef]
- Marfia, S.; Sacco, E. Modeling of reinforced masonry elements. Int. J. Solids Struct. 2001, 38, 4177–4198. [Google Scholar] [CrossRef]
- Albert, M.; Elwi, A.; Cheng, J. Strengthening of unreinforced masonry walls using FRPs. J. Compos. Constr. 2001, 5, 76–84. [Google Scholar] [CrossRef]
- Bajpai, K.; Kuthinh, D. Bending performance of masonry walls strengthened with near-surface mountedFRP bars. In Proceedings of the 9th North American Masonry Conference, Clemson, SC, USA, 1–4 June 2003.
- Carney, P.; Myers, J.J. Shear and flexural strengthening of masonry infill walls with FRP for extreme out-of-plane loading. In Architectural Engineering; ASCE: Austin, TX, USA, 2003. [Google Scholar]
- Galati, N.; Tumialan, G.; Nanni, A. Strengthening with FRP bars of urm walls subject to out-of-plane loads. Constr. Build. Mater. 2006, 20, 101–110. [Google Scholar] [CrossRef]
- Hamoush, S.A.; McGinley, M.W.; Mlakar, P.; Scott, D.; Murray, K. Out-of-plane strengthening of masonry walls with reinforced composites. J. Compos. Constr. 2001, 5, 139–145. [Google Scholar] [CrossRef]
- Kuzik, M.; Elwi, A.; Cheng, J. Cyclic flexure tests of masonry walls reinforced with glass fiber reinforced polymer sheets. J. Compos. Constr. 2003, 7, 20–30. [Google Scholar] [CrossRef]
- Lunn, D.S. Behavior and Modeling of Infill Masonry Walls Strengthened with FRP Using Various end Anchorage. Ph.D. Thesis, North Carolina State University, Raleigh, NC, USA, 2013. [Google Scholar]
- Patoary, M.K.H.; Tan, K.H. Blast resistance of prototype in-build masonry walls strengthened with FRP systems. In Proceedings of the 6th International Symposium on FRP Reinforcement for Concrete Structures, Singapore, Singapore, 8–10 July 2003.
- Roca, P.; Araiza, G. Shear response of brick masonry small assemblages strengthened with bonded FRP laminates for in-plane reinforcement. Constr. Build. Mater. 2010, 24, 1372–1384. [Google Scholar] [CrossRef]
- Velazquez-Dimas, J.I.; Ehsani, M.R. Modeling out-of-plane behavior of urm walls retrofitted with fiber composites. J. Compos. Constr. 2000, 4, 172–181. [Google Scholar] [CrossRef]
- Fam, A.Z.; Rizkalla, S.H.; Tadros, G. Behavior of CFRP for prestressing and shear reinforcements of concrete highway bridges. ACI Struct. J. 1997, 94, 77–86. [Google Scholar]
- Kolsch, H. Carbon fiber cement matrix (cfcm) overlay system for masonry strengthening. J. Compos. Constr. 1998, 2, 105–109. [Google Scholar] [CrossRef]
- Triantafillou, T.C. Strengthening of masonry structures using epoxy-bonded FRP laminates. J. Compos. Constr. 1998, 2, 96–104. [Google Scholar] [CrossRef]
- Al-Salloum, Y.A.; Almusallam, T.H. Load capacity of concrete masonry block walls strengthened with epoxy-bonded gfrp sheets. J. Compos. Mater. 2005, 39, 1719–1745. [Google Scholar] [CrossRef]
- Wang, Q.; Chai, Z.; Huang, Y.; Huang, Y.; Yang, Y.; Zhang, Y. Seismic shear capacity of brick masonry wall reinforced by GFRP. Asian J. Civil Eng. 2006, 7, 563–580. [Google Scholar]
- Stratford, T.; Pascale, G.; Manfroni, O.; Bonfiglioli, B. Shear strengthening masonry panels with sheet glass-fiber reinforced polymer. J. Compos. Constr. 2004, 8, 434–443. [Google Scholar] [CrossRef]
- Accardi, M.; Cucchiara, C.; La Mendola, L. Bond behavior between cfrp strips and calcarenite stone. In Proceedings of the 6th International Conference on Fracture Mechanics of Concrete and Concrete Structures, Catania, Italy, 17–22 June 2007; pp. 1203–1211.
- Milani, G.; Rotunno, T.; Sacco, E.; Tralli, A. Failure load of FRP strengthened masonry walls: Experimental results and numerical models. Struct. Durab. Health Monit. 2006, 2, 29–50. [Google Scholar]
- Mansouri, I.; Kisi, O. Prediction of debonding strength for masonry elements retrofitted with FRP composites using neuro fuzzy and neural network approaches. Compos. Part B: Eng. 2015, 70, 247–255. [Google Scholar] [CrossRef]
- Sharma, B. Debonding Failure of Fiber Reinforced Polymers. Master’s Thesis, University of Hawaii at Manoa, Honolulu, HI, USA, 2006. [Google Scholar]
- Koza, J.R. Genetic Programming: On the Programming of Computers by Means of Natural Selection; MIT Press: Cambridge, MA, USA, 1992. [Google Scholar]
- Abdellahi, M.; Heidari, J.; Bahmanpour, M. A new predictive model for the bond strength of FRP-to-concrete composite joints. Struct. Concr. 2014, 15, 509–521. [Google Scholar] [CrossRef]
- Kara, I.F. Prediction of shear strength of FRP-reinforced concrete beams without stirrups based on genetic programming. Adv. Eng. Softw. 2011, 42, 295–304. [Google Scholar] [CrossRef]
- Chen, L.; Kou, C.-H.; Ma, S.-W. Prediction of slump flow of high-performance concrete via parallel hyper-cubic gene-expression programming. Eng. Appl. Artif. Intell. 2014, 34, 66–74. [Google Scholar] [CrossRef]
- Cevik, A. Modeling strength enhancement of FRP confined concrete cylinders using soft computing. Expert Syst. Appl. 2011, 38, 5662–5673. [Google Scholar] [CrossRef]
- Mansouri, I.; Gholampour, A.; Kisi, O.; Ozbakkaloglu, T. Evaluation of peak and residual conditions of actively confined concrete using neuro-fuzzy and neural computing techniques. Neural Comput. Appl. 2016, 1–16. [Google Scholar] [CrossRef]
- Güneyisi, E.M.; D’Aniello, M.; Landolfo, R.; Mermerdaş, K. A novel formulation of the flexural overstrength factor for steel beams. J. Construct. Steel Res. 2013, 90, 60–71. [Google Scholar] [CrossRef]
- Gandomi, A.H.; Babanajad, S.K.; Alavi, A.H.; Farnam, Y. Novel approach to strength modeling of concrete under triaxial compression. J. Mater. Civil Eng. 2012, 24, 1132–1143. [Google Scholar] [CrossRef]
- Aytek, A.; Kişi, Ö. A genetic programming approach to suspended sediment modelling. J. Hydrol. 2008, 351, 288–298. [Google Scholar] [CrossRef]
- Azamathulla, H.M.; Ghani, A.A. Genetic programming to predict river pipeline scour. J. Pipeline Syst. Eng. Pract. 2010, 1, 127–132. [Google Scholar] [CrossRef]
- Shiri, J.; Kişi, Ö. Comparison of genetic programming with neuro-fuzzy systems for predicting short-term water table depth fluctuations. Comput. Geosci. 2011, 37, 1692–1701. [Google Scholar] [CrossRef]
- Azamathulla, H.M.; Ghani, A.A.; Zakaria, N.A.; Guven, A. Genetic programming to predict bridge pier scour. J. Hydraul. Eng. 2010, 136, 165–169. [Google Scholar] [CrossRef]
- Shiri, J.; Kişi, Ö.; Landeras, G.; López, J.J.; Nazemi, A.H.; Stuyt, L.C.P.M. Daily reference evapotranspiration modeling by using genetic programming approach in the basque country (northern spain). J. Hydrol. 2012, 414–415, 302–316. [Google Scholar] [CrossRef]
- Gandomi, A.H.; Alavi, A.H.; Mirzahosseini, M.R.; Nejad, F.M. Nonlinear genetic-based models for prediction of flow number of asphalt mixtures. J. Mater. Civil Eng. 2011, 23, 248–263. [Google Scholar] [CrossRef]
- Chen, J.F.; Teng, J.G. Anchorage strength models for FRP and steel plates bonded to concrete. J. Struct. Eng. 2001, 127, 784–791. [Google Scholar] [CrossRef]
- Sayed-Ahmed, E.Y.; Bakay, R.; Shrive, N.G. Bond strength of FRP laminates to concrete: State-of-the-art review. Electron. J. Struct. Eng. 2009, 9, 45–61. [Google Scholar]
- D’Antino, T.; Pellegrino, C. Bond between FRP composites and concrete: Assessment of design procedures and analytical models. Compos. Part B: Eng. 2014, 60, 440–456. [Google Scholar] [CrossRef]
- Willis, C.R.; Yang, Q.; Seracino, R.; Griffith, M.C. Bond behaviour of FRP-to-clay brick masonry joints. Eng. Struct. 2009, 31, 2580–2587. [Google Scholar] [CrossRef]
- Kashyap, J.; Willis, C.R.; Griffith, M.C.; Ingham, J.M.; Masia, M.J. Debonding resistance of FRP-to-clay brick masonry joints. Eng. Struct. 2012, 41, 186–198. [Google Scholar] [CrossRef]
- Khalifa, A.; Gold, W.J.; Nanni, A.; M.I., A.A. Contribution of externally bonded FRP to shear capacity of rc flexural members. J. Compos. Constr. 1998, 2, 195–202. [Google Scholar] [CrossRef]
- Laura De Lorenzis, B.M.; Antonio, N. Bond of fiber-reinforced polymer laminates to concrete. Mater. J. 2001, 98, 256–264. [Google Scholar]
- Dai, J.; Ueda, T.; Sato, Y. Development of the nonlinear bond stress–slip model of fiber reinforced plastics sheet–concrete interfaces with a simple method. J. Compos. Constr. 2005, 9, 52–62. [Google Scholar] [CrossRef]
- Holland, J.H. Adaptation in Natural and Artificial Systems; University of Michigan Press: Ann Arbor, MI, USA, 1975. [Google Scholar]
- Azamathulla, H.M.; Ahmad, Z.; Ghani, A.Ab. Computation of discharge through side sluice gate using gene-expression programming. Irrig. Drain. 2013, 62, 115–119. [Google Scholar] [CrossRef]
- Ferreira, C. Gene expression programming in problem solving. In Soft Computing and Industry: Recent Applications; Roy, R., Köppen, M., Ovaska, S., Furuhashi, T., Hoffmann, F., Eds.; Springer: London, UK, 2002; pp. 635–653. [Google Scholar]
- Turco, V.N.; Galati, L.; De Lorenzis Modena, C.; Nanni, A. Bond between near surface mounted FRP rods and masonry in structural strengthening. 2003, pp. 209–217. Available online: http://rb2c.mst.edu/media/research/rb2c/documents/BNSM.pdf (accessed on 2 November 2016).
- Liu, Y.; Dawe, J.; McInerney, J. Behaviour of gfrp sheets bonded to masonry walls. In Proceedings of the International Symposium on Bond Behaviour of FRP in Structures, BBFS 2005, Hong kong, China, 2005; pp. 473–480.
- Camli, U.S.; Binici, B. Strength of carbon fiber reinforced polymers bonded to concrete and masonry. Constr. Build. Mater. 2007, 21, 1431–1446. [Google Scholar] [CrossRef]
- Xia, S.; Oehlers, D. Debonding mechanisms in FRP plated unreinforced masonry under out-of-plane loading. Adv. Struct. Eng. 2006, 9, 619–637. [Google Scholar] [CrossRef]
- Konthesingha, K.M.C.; Masia, M.J.; Petersen, R.B.; Page, A.W. Bond behaviour of nsm FRP strips to modern clay brick masonry prisms under cyclic loading. In Proceedings of the 11th Canadian Masonry Symposium, Toronto, Canada, 31 May–3 June 2009.
- Lam, C. Finite element study of bond-slip behaviour of cfrp and gfrp laminates on brick masonry. Master’s Thesis, Universitat Politècnica de Catalunya, Barcelona, Spain, 2009. [Google Scholar]
- Petersen, R.B.; Masia, M.J.; Seracino, R. Bond behavior of near-surface mounted FRP strips bonded to modern clay brick masonry prisms: Influence of strip orientation and compression perpendicular to the strip. J. Compos. Constr. 2009, 13, 169–178. [Google Scholar] [CrossRef]
- Oliveira, D.V.; Basilio, I.; Loureņo, P.B. Experimental bond behavior of FRP sheets glued on brick masonry. J. Compos. Constr. 2011, 15, 32–41. [Google Scholar] [CrossRef]
- La Mendola, L.; Failla, A.; Cucchiara, C.; Accardi, M. Debonding phenomena in CFRP strengthened calcarenite masonry walls and vaults. Adv. Struct. Eng. 2009, 12, 745–760. [Google Scholar] [CrossRef]
- Gandomi, A.H.; Alavi, A.H.; Kazemi, S.; Gandomi, M. Formulation of shear strength of slender rc beams using gene expression programming, part i: Without shear reinforcement. Autom. Constr. 2014, 42, 112–121. [Google Scholar] [CrossRef]


| Model | Equation (Units: N, mm) | References |
|---|---|---|
| Tanaka | [40] | |
| Sato | [41] | |
| Iso | [41] | |
| Yang | [41] | |
| Neubauer | [42] | |
| Willis | [43] | |
| Kashyap | [44] | |
| Maeda | [40] | |
| Khalifa | [45] | |
| De Lorenzis | [46] | |
| Van Gemert | [42] | |
| Dai | [47] | |
| Accardi | [22] |
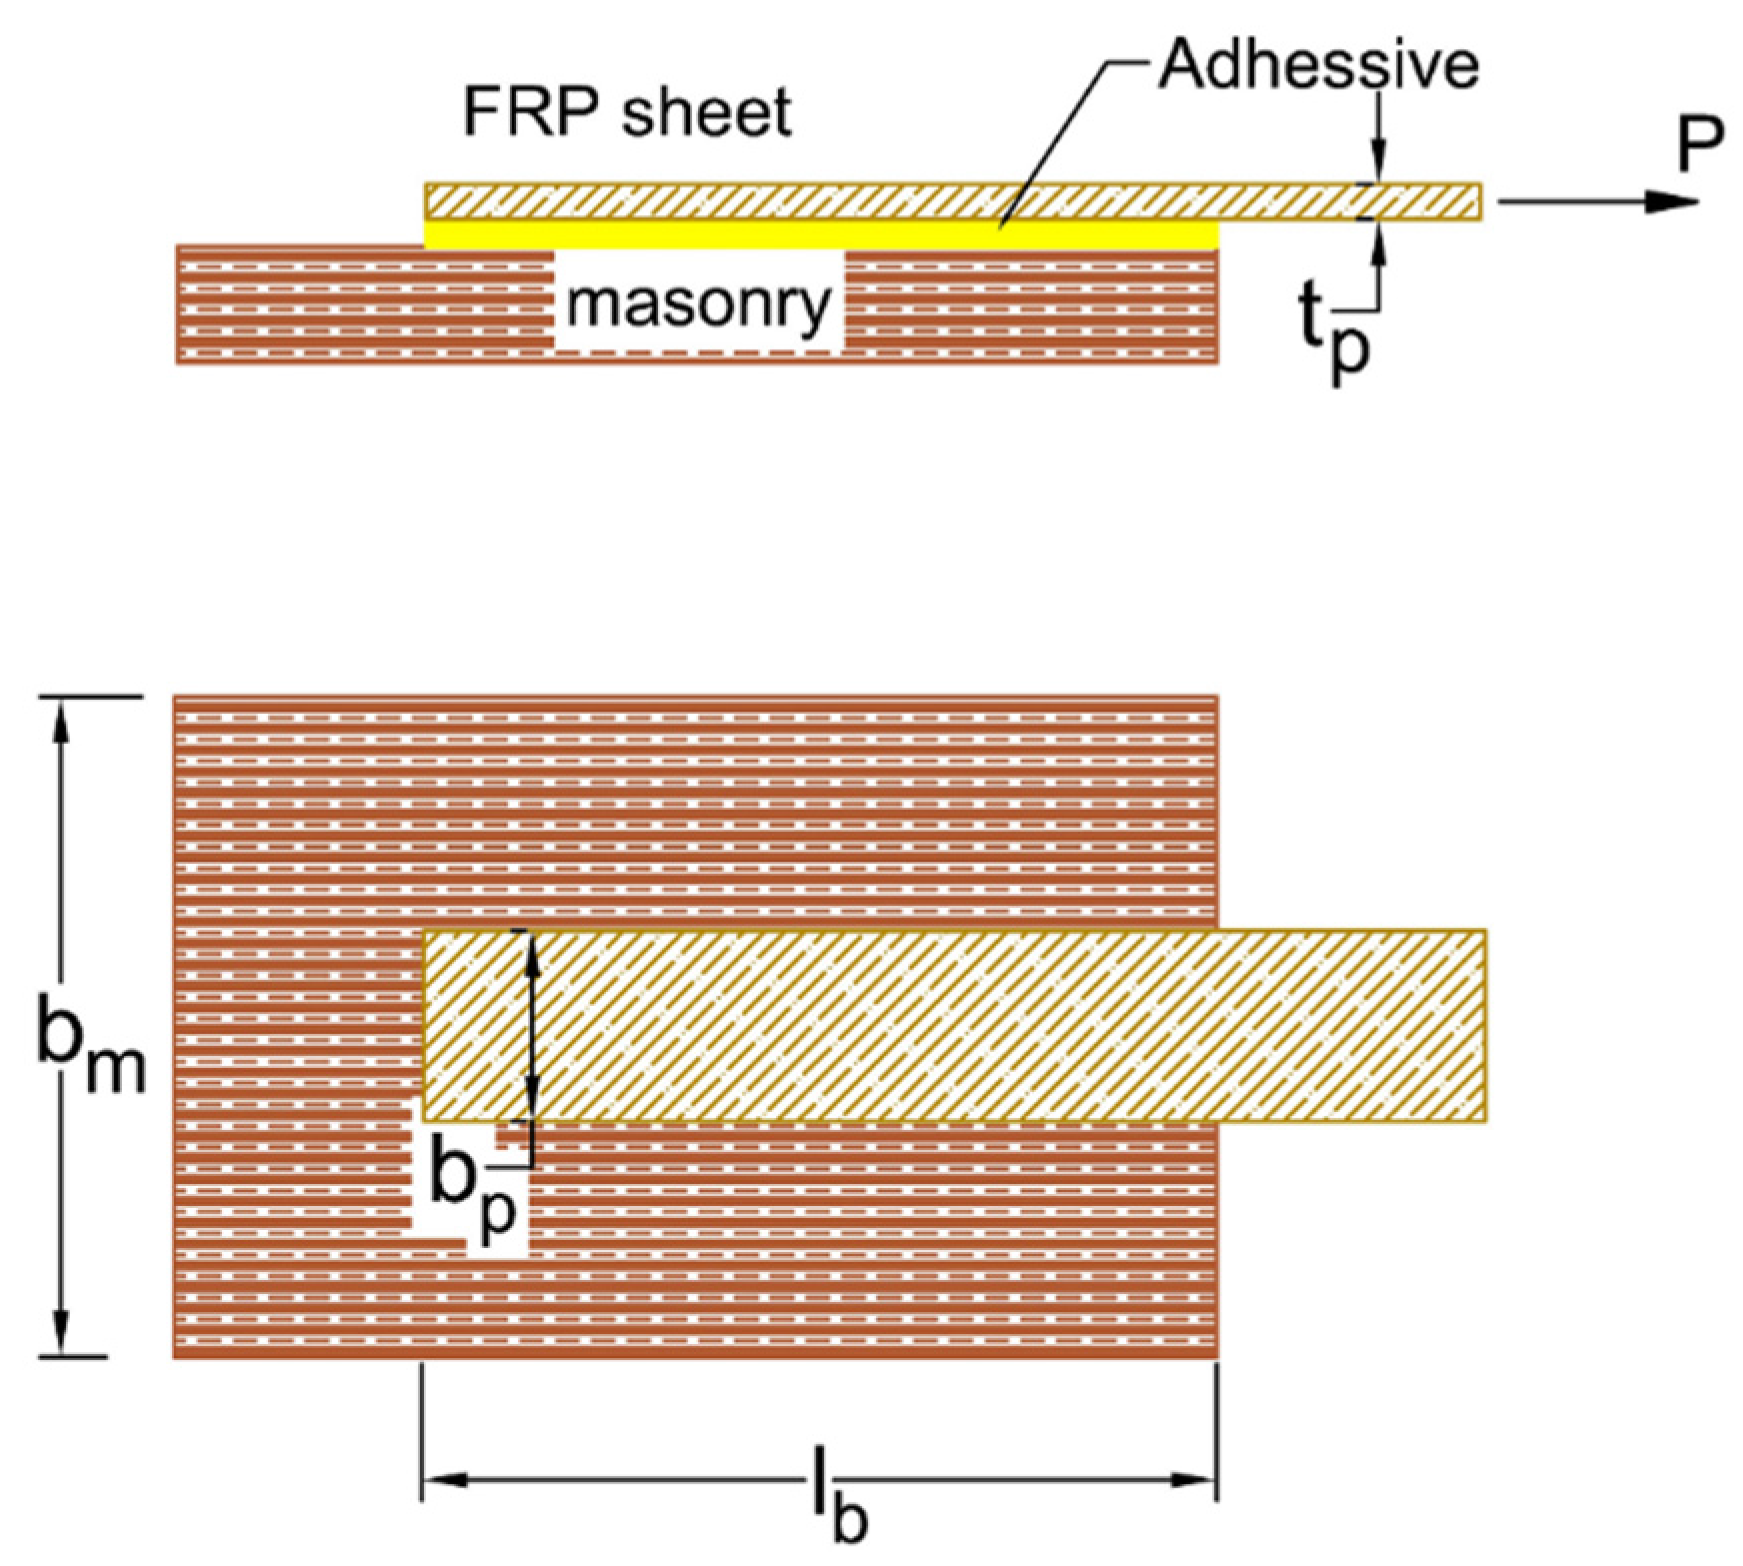
| References | No. | tp (mm) | Ep (GPa) | bp (mm) | lb (mm) | bm (mm) | fut (MPa) | Pmax (kN) |
|---|---|---|---|---|---|---|---|---|
| [51] | 1 | 6.35 | 40.8 | 6.35 | 254 | 230 | 1.93 | 19.17 |
| 2 | 6.35 | 40.8 | 6.35 | 381 | 230 | 1.93 | 18.55 | |
| [52] | 3 | 1 | 22.3 | 25 | 50 | 400 | 2.05 | 4.88 |
| 4 | 1 | 22.3 | 25 | 50 | 400 | 2.05 | 5.63 | |
| 5 | 1 | 22.3 | 25 | 50 | 400 | 2.05 | 4.25 | |
| 6 | 1 | 22.3 | 25 | 50 | 400 | 2.05 | 3.75 | |
| 7 | 1 | 22.3 | 25 | 50 | 400 | 2.05 | 5.13 | |
| 8 | 1 | 22.3 | 25 | 75 | 400 | 2.05 | 5.81 | |
| 9 | 1 | 22.3 | 25 | 75 | 400 | 2.05 | 5.44 | |
| 10 | 1 | 22.3 | 25 | 75 | 400 | 2.05 | 6.38 | |
| 11 | 1 | 22.3 | 25 | 75 | 400 | 2.05 | 3.94 | |
| 12 | 1 | 22.3 | 25 | 75 | 400 | 2.05 | 7.13 | |
| 13 | 1 | 22.3 | 25 | 100 | 400 | 2.05 | 4.75 | |
| 14 | 1 | 22.3 | 25 | 100 | 400 | 2.05 | 5 | |
| 15 | 1 | 22.3 | 25 | 100 | 400 | 2.05 | 6.5 | |
| 16 | 1 | 22.3 | 25 | 100 | 400 | 2.05 | 7.25 | |
| 17 | 1 | 22.3 | 25 | 100 | 400 | 2.05 | 7.25 | |
| 18 | 1 | 22.3 | 25 | 100 | 400 | 2.05 | 8.5 | |
| 19 | 1 | 22.3 | 25 | 50 | 200 | 2.73 | 9.25 | |
| 20 | 1 | 22.3 | 25 | 50 | 200 | 2.73 | 7.38 | |
| 21 | 1 | 22.3 | 25 | 50 | 200 | 2.73 | 8.63 | |
| 22 | 1 | 22.3 | 25 | 50 | 200 | 2.73 | 6.88 | |
| 23 | 1 | 22.3 | 25 | 75 | 200 | 2.73 | 10.69 | |
| 24 | 1 | 22.3 | 25 | 75 | 200 | 2.73 | 8.44 | |
| 25 | 1 | 22.3 | 25 | 75 | 200 | 2.73 | 9.38 | |
| 26 | 1 | 22.3 | 25 | 75 | 200 | 2.73 | 9.56 | |
| 27 | 1 | 22.3 | 25 | 75 | 200 | 2.73 | 8.25 | |
| 28 | 1 | 22.3 | 25 | 100 | 200 | 2.73 | 8.5 | |
| 29 | 1 | 22.3 | 25 | 100 | 200 | 2.73 | 10 | |
| 30 | 1 | 22.3 | 25 | 100 | 200 | 2.73 | 10 | |
| 31 | 1 | 22.3 | 25 | 100 | 200 | 2.73 | 9 | |
| 32 | 1 | 22.3 | 25 | 100 | 200 | 2.73 | 10 | |
| 33 | 1 | 22.3 | 25 | 100 | 400 | 2.05 | 5.58 | |
| 34 | 1 | 22.3 | 25 | 100 | 200 | 2.73 | 9.4 | |
| [53] | 35 | 1 | 61 | 25 | 125 | 280 | 1.3 | 4.06 |
| 36 | 1 | 61 | 50 | 100 | 280 | 1.3 | 5.9 | |
| 37 | 1 | 61 | 50 | 125 | 280 | 1.3 | 5.14 | |
| [54] | 38 | 1.2 | 165 | 50 | 210 | 230 | 2.75 | 25.25 |
| 39 | 1.2 | 165 | 50 | 280 | 230 | 2.75 | 28.4 | |
| [55] | 40 | 2.8 | 207 | 15 | 355 | 230 | 3.57 | 61.6 |
| 41 | 2.8 | 207 | 15 | 355 | 230 | 3.57 | 65.24 | |
| 42 | 2.8 | 207 | 15 | 355 | 230 | 3.57 | 63.53 | |
| 43 | 2.8 | 207 | 15 | 355 | 230 | 3.57 | 66.52 | |
| [56] | 44 | 0.17 | 230 | 50 | 200 | 250 | 3.35 | 15.94 |
| 45 | 0.17 | 230 | 50 | 200 | 250 | 3.35 | 17.12 | |
| 46 | 0.17 | 230 | 50 | 200 | 250 | 3.35 | 17.66 | |
| 47 | 0.17 | 230 | 50 | 200 | 250 | 3.35 | 19.61 | |
| 48 | 0.17 | 230 | 50 | 200 | 250 | 3.35 | 20.15 | |
| 49 | 0.23 | 65 | 50 | 200 | 250 | 3.35 | 11.69 | |
| 50 | 0.23 | 65 | 50 | 200 | 250 | 3.35 | 13.97 | |
| 51 | 0.23 | 65 | 50 | 200 | 250 | 3.35 | 13.65 | |
| 52 | 0.23 | 65 | 50 | 200 | 250 | 3.35 | 13.2 | |
| 53 | 0.23 | 65 | 50 | 200 | 250 | 3.35 | 14.18 | |
| [57] | 54 | 2.8 | 207 | 15 | 336 | 230 | 3.57 | 83.45 |
| 55 | 2.8 | 207 | 15 | 336 | 230 | 3.57 | 71.09 | |
| 56 | 2.8 | 207 | 15 | 336 | 230 | 3.57 | 81.48 | |
| 57 | 2.8 | 207 | 15 | 336 | 230 | 3.57 | 70.36 | |
| 58 | 2.8 | 207 | 15 | 336 | 230 | 3.57 | 59.41 | |
| 59 | 2.8 | 207 | 15 | 336 | 230 | 3.57 | 63.88 | |
| 60 | 2.8 | 207 | 15 | 336 | 230 | 3.57 | 69.41 | |
| 61 | 2.8 | 207 | 15 | 336 | 230 | 3.57 | 84.5 | |
| [43] | 62 | 1.2 | 162 | 15 | 241 | 230 | 3.55 | 46.8 |
| 63 | 1.2 | 162 | 15 | 328 | 230 | 3.55 | 44 | |
| 64 | 1.2 | 162 | 15 | 328 | 230 | 3.55 | 38.3 | |
| 65 | 1.2 | 162 | 15 | 334 | 230 | 3.55 | 46.7 | |
| 66 | 1.2 | 162 | 20 | 328 | 230 | 3.55 | 50 | |
| 67 | 1.2 | 162 | 20 | 328 | 230 | 3.55 | 51.2 | |
| 68 | 2 | 65 | 50 | 420 | 230 | 3.55 | 22.1 | |
| 69 | 2 | 65 | 50 | 395 | 230 | 3.55 | 21.5 | |
| 70 | 2 | 65 | 50 | 419 | 230 | 3.55 | 21.9 | |
| 71 | 2 | 65 | 50 | 396 | 230 | 3.55 | 18.1 | |
| 72 | 2 | 65 | 50 | 394 | 230 | 3.55 | 24.7 | |
| 73 | 2 | 65 | 50 | 393 | 230 | 3.55 | 24.3 | |
| 74 | 0.62 | 73 | 50 | 386 | 230 | 3.55 | 19.9 | |
| 75 | 0.62 | 73 | 50 | 386 | 230 | 3.55 | 18.6 | |
| 76 | 1.2 | 162 | 50 | 140 | 230 | 3.55 | 26.8 | |
| 77 | 1.2 | 162 | 50 | 210 | 230 | 3.55 | 24.9 | |
| 78 | 1.2 | 162 | 50 | 280 | 230 | 3.55 | 28.4 | |
| 79 | 0.15 | 80.2 | 25 | 150 | 235 | 1.57 | 3.48 | |
| 80 | 0.15 | 80.2 | 25 | 150 | 235 | 1.57 | 4.81 | |
| [58] | 81 | 0.15 | 80.2 | 25 | 150 | 235 | 1.57 | 4.69 |
| 82 | 0.15 | 80.2 | 25 | 150 | 235 | 1.57 | 4.64 | |
| 83 | 0.15 | 80.2 | 25 | 100 | 235 | 1.57 | 3.66 | |
| 84 | 0.15 | 80.2 | 25 | 100 | 235 | 1.57 | 3.17 | |
| 85 | 0.15 | 80.2 | 25 | 100 | 235 | 1.57 | 2.85 | |
| 86 | 0.15 | 80.2 | 25 | 100 | 235 | 1.57 | 3.68 | |
| 87 | 0.15 | 80.2 | 25 | 100 | 235 | 1.57 | 3.79 | |
| 88 | 0.15 | 80.2 | 25 | 200 | 235 | 1.57 | 4.48 | |
| 89 | 0.15 | 80.2 | 25 | 200 | 235 | 1.57 | 5.06 | |
| 90 | 0.15 | 80.2 | 25 | 150 | 235 | 1.57 | 5.27 | |
| 91 | 0.15 | 80.2 | 25 | 150 | 235 | 1.57 | 4.2 | |
| 92 | 0.15 | 80.2 | 25 | 150 | 235 | 1.57 | 4.89 | |
| 93 | 0.15 | 80.2 | 25 | 150 | 235 | 1.57 | 5.6 | |
| 94 | 0.15 | 80.2 | 25 | 150 | 235 | 1.57 | 4.34 | |
| 95 | 0.15 | 80.2 | 25 | 150 | 235 | 1.57 | 5.49 | |
| 96 | 0.15 | 80.2 | 25 | 150 | 235 | 1.57 | 3.52 | |
| 97 | 0.15 | 80.2 | 25 | 150 | 235 | 1.57 | 4.83 | |
| 98 | 0.15 | 80.2 | 25 | 150 | 235 | 1.57 | 4.53 | |
| 99 | 0.15 | 80.2 | 25 | 150 | 235 | 1.57 | 5.46 | |
| 100 | 0.15 | 80.2 | 25 | 150 | 235 | 1.57 | 4.55 | |
| 101 | 0.15 | 80.2 | 25 | 150 | 235 | 1.57 | 3.73 | |
| 102 | 0.15 | 80.2 | 25 | 150 | 235 | 1.57 | 3.82 | |
| 103 | 0.15 | 80.2 | 25 | 150 | 235 | 1.57 | 4.54 | |
| 104 | 0.15 | 80.2 | 25 | 150 | 235 | 1.57 | 4.06 | |
| 105 | 0.12 | 216 | 25 | 150 | 235 | 1.57 | 4.78 | |
| 106 | 0.12 | 216 | 25 | 150 | 235 | 1.57 | 4.29 | |
| 107 | 0.12 | 216 | 25 | 150 | 235 | 1.57 | 4.02 | |
| 108 | 0.12 | 216 | 25 | 150 | 235 | 1.57 | 4.33 | |
| 109 | 0.12 | 216 | 25 | 150 | 235 | 1.57 | 4.26 | |
| [59] | 110 | 0.13 | 230 | 50 | 150 | 740 | 1.0236 | 5.04 |
| 111 | 0.13 | 230 | 50 | 150 | 740 | 0.80901 | 3.92 | |
| 112 | 0.13 | 230 | 50 | 150 | 740 | 0.780739 | 4.66 | |
| 113 | 0.13 | 230 | 50 | 150 | 740 | 0.897877 | 4.28 | |
| 114 | 0.13 | 230 | 50 | 150 | 740 | 1.077087 | 4.73 | |
| 115 | 0.13 | 230 | 50 | 150 | 740 | 1.107941 | 4.83 | |
| 116 | 0.13 | 230 | 50 | 150 | 740 | 0.991539 | 3.89 | |
| 117 | 0.13 | 230 | 50 | 150 | 740 | 0.99578 | 4.01 | |
| 118 | 0.13 | 230 | 50 | 150 | 740 | 0.905664 | 4.2 | |
| 119 | 0.13 | 230 | 50 | 100 | 740 | 1.091337 | 4.93 | |
| 120 | 0.13 | 230 | 50 | 100 | 740 | 0.901 | 4.25 | |
| 121 | 0.13 | 230 | 50 | 100 | 740 | 0.981574 | 4.43 | |
| 122 | 0.13 | 230 | 50 | 100 | 740 | 1.03723 | 4.61 | |
| 123 | 0.13 | 230 | 50 | 100 | 740 | 0.943638 | 4.07 | |
| 124 | 0.13 | 230 | 50 | 100 | 740 | 1.002807 | 3.28 | |
| 125 | 0.13 | 230 | 50 | 100 | 740 | 1.012564 | 4.65 | |
| 126 | 0.13 | 230 | 50 | 100 | 740 | 0.96425 | 3.35 | |
| 127 | 0.13 | 230 | 50 | 50 | 740 | 0.921042 | 2.28 | |
| 128 | 0.13 | 230 | 50 | 50 | 740 | 1.048007 | 2.31 | |
| 129 | 0.13 | 230 | 50 | 50 | 740 | 1.353317 | 4.73 | |
| 130 | 0.13 | 230 | 50 | 50 | 740 | 0.914922 | 2.22 | |
| 131 | 0.13 | 230 | 50 | 50 | 740 | 0.954 | 2.33 | |
| 132 | 0.13 | 230 | 50 | 50 | 740 | 0.970059 | 2.2 | |
| 133 | 0.13 | 230 | 50 | 50 | 740 | 1.079692 | 2.13 | |
| 134 | 0.13 | 230 | 50 | 50 | 740 | 0.890021 | 3.51 |
| bm (mm) | bp (mm) | Ep (GPa) | fut (MPa) | lb (mm) | tp (mm) | Pmax (kN) | |
|---|---|---|---|---|---|---|---|
| Training data | |||||||
| Mean | 224.90 | 23.98 | 126.49 | 2.11 | 162.76 | 133.98 | 16.52 |
| Standard deviation | 79.72 | 15.43 | 82.62 | 1.22 | 108.89 | 285.37 | 21.37 |
| Min. value | 50.00 | 0.78 | 22.30 | 0.13 | 50.00 | 0.12 | 2.20 |
| Max. value | 400.00 | 50.00 | 230.00 | 3.57 | 420.00 | 740.00 | 84.50 |
| Testing data | |||||||
| Mean | 237.50 | 22.63 | 103.76 | 1.96 | 154.79 | 153.43 | 13.01 |
| Standard deviation | 100.80 | 16.07 | 84.95 | 1.17 | 122.95 | 303.16 | 15.33 |
| Min. value | 50.00 | 0.81 | 22.30 | 0.13 | 50.00 | 0.15 | 2.13 |
| Max. value | 400.00 | 50.00 | 230.00 | 3.57 | 396.00 | 740.00 | 70.36 |
| Number of chromosomes | 30 | One point recombination rate | 0.3 |
| Head size | 8 | Two point recombination rate | 0.3 |
| Number of genes | 3 | Gene recombination rate | 0.1 |
| Linking function | addition | Gene transposition rate | 0.1 |
| Fitness function error type | RRSE | Insertion sequence transposition rate | 0.1 |
| Mutation rate | 0.044 | Root insertion sequence transposition | 0.1 |
| Inversion rate | 0.1 | - | - |
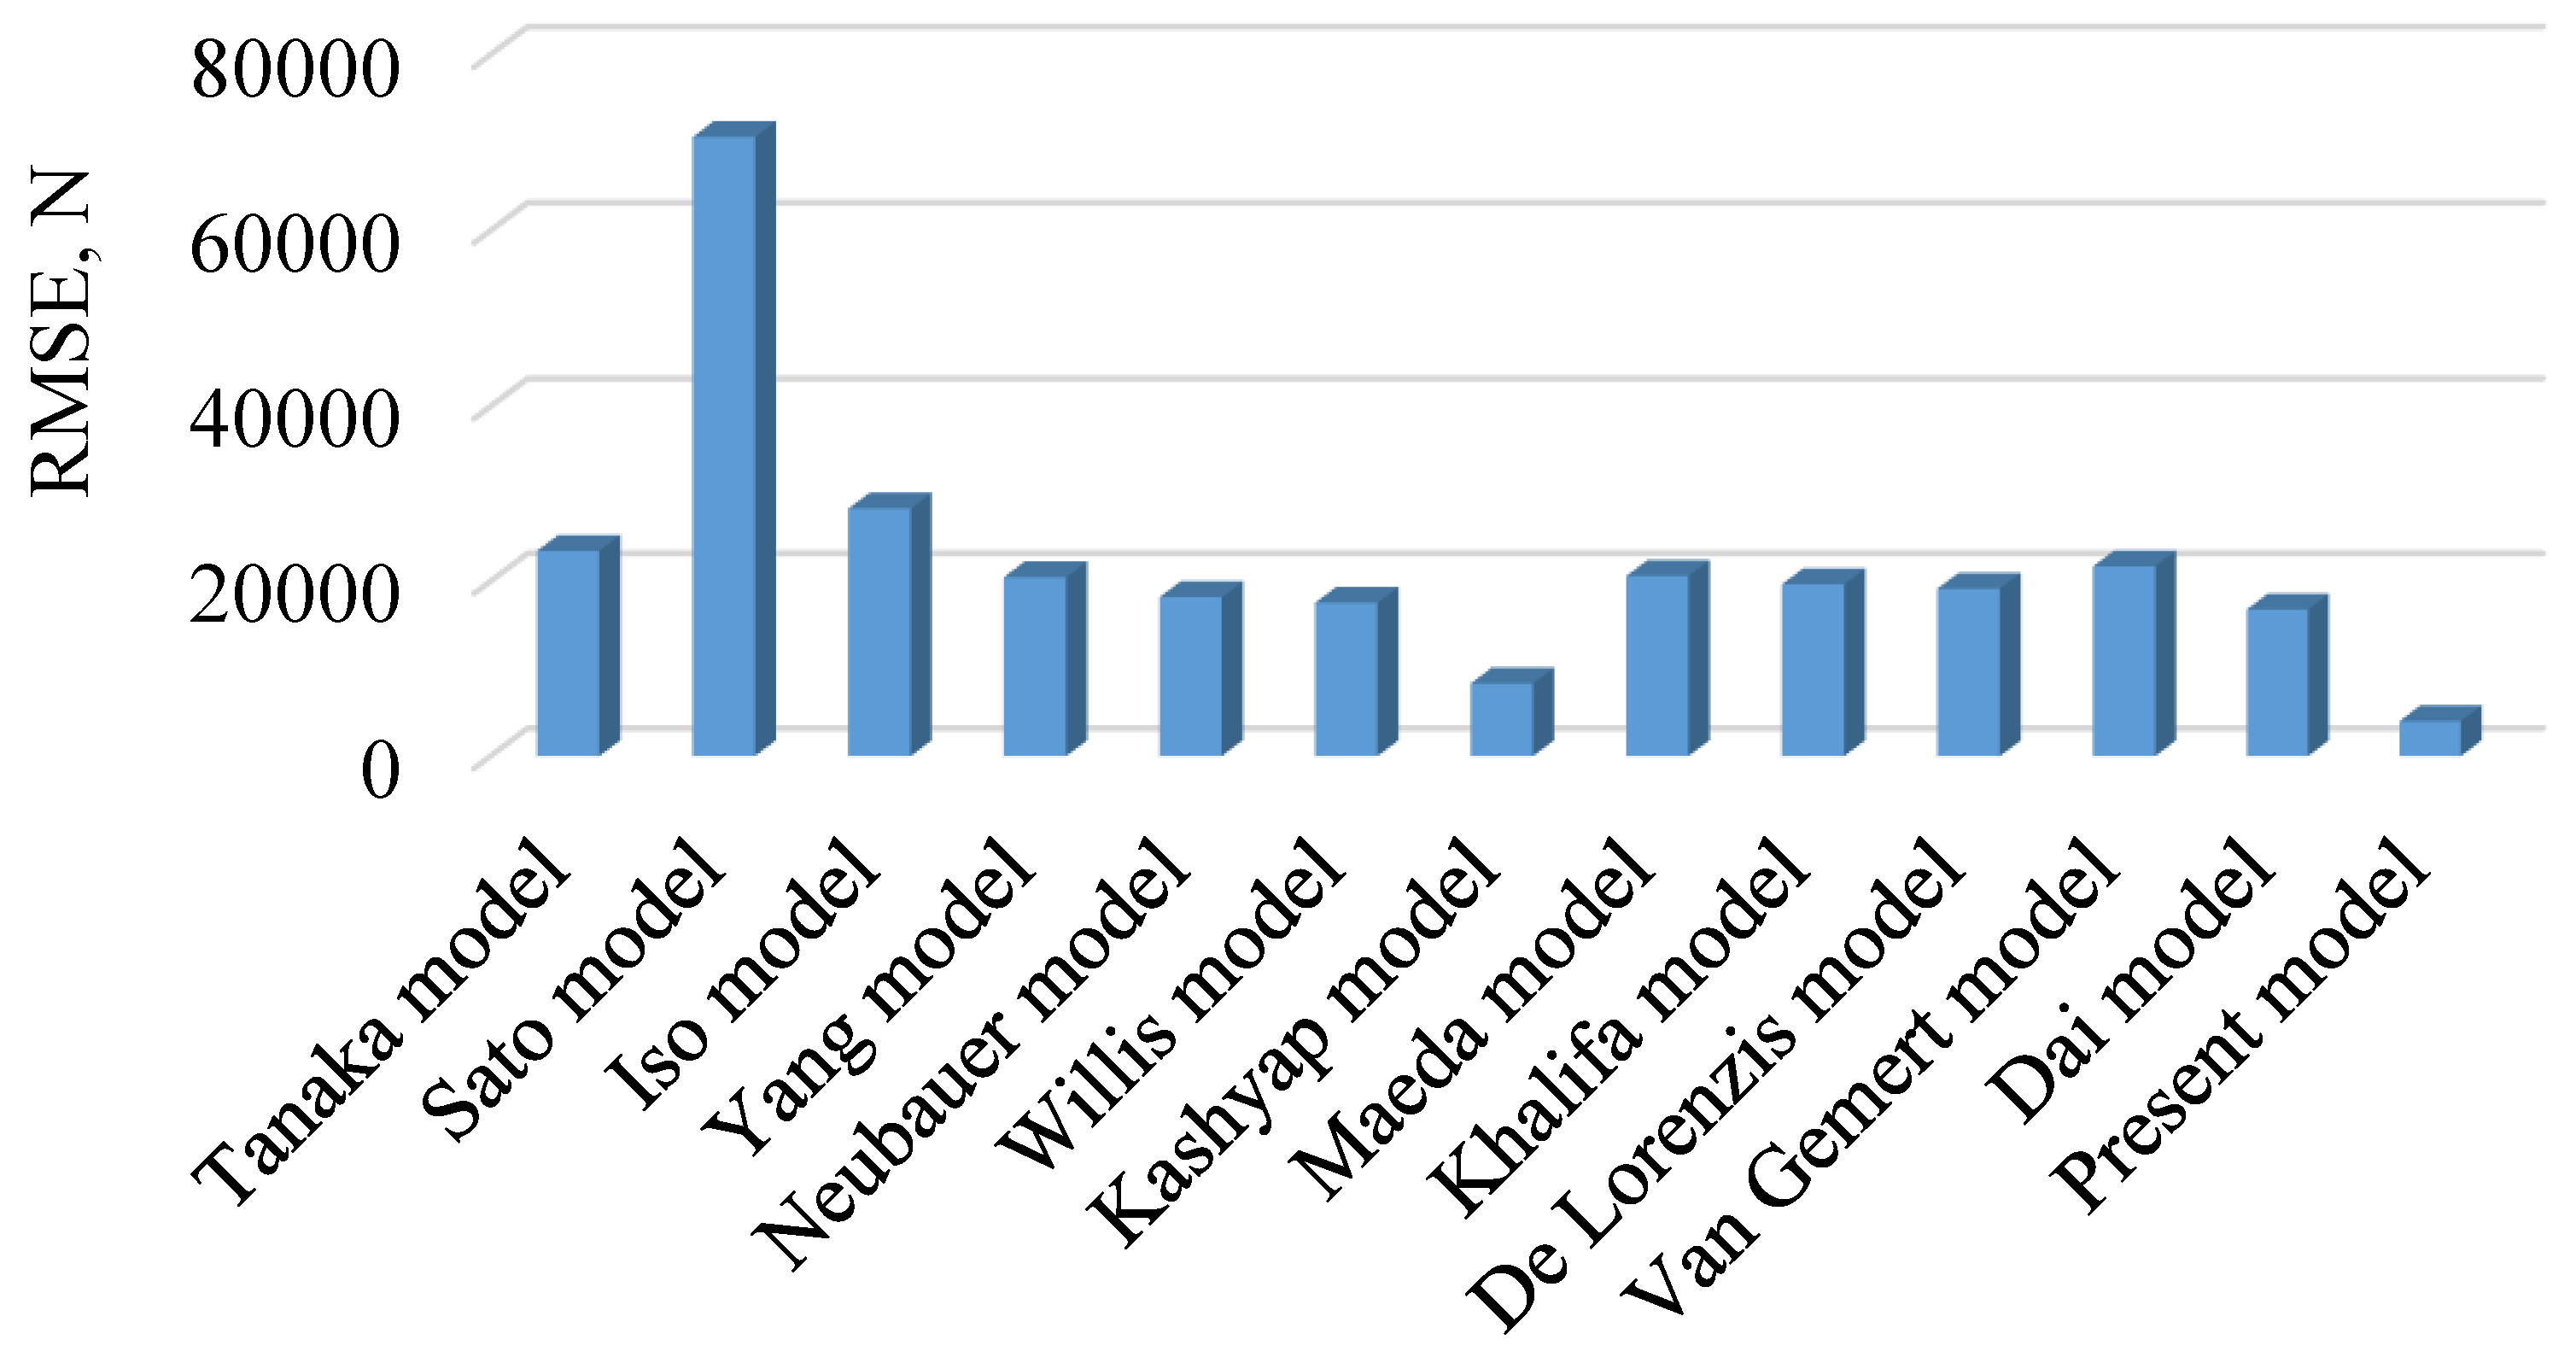
| Model | Training Data | Test Data | ||
|---|---|---|---|---|
| R2 | RMSE (root mean square errors) | R2 | RMSE | |
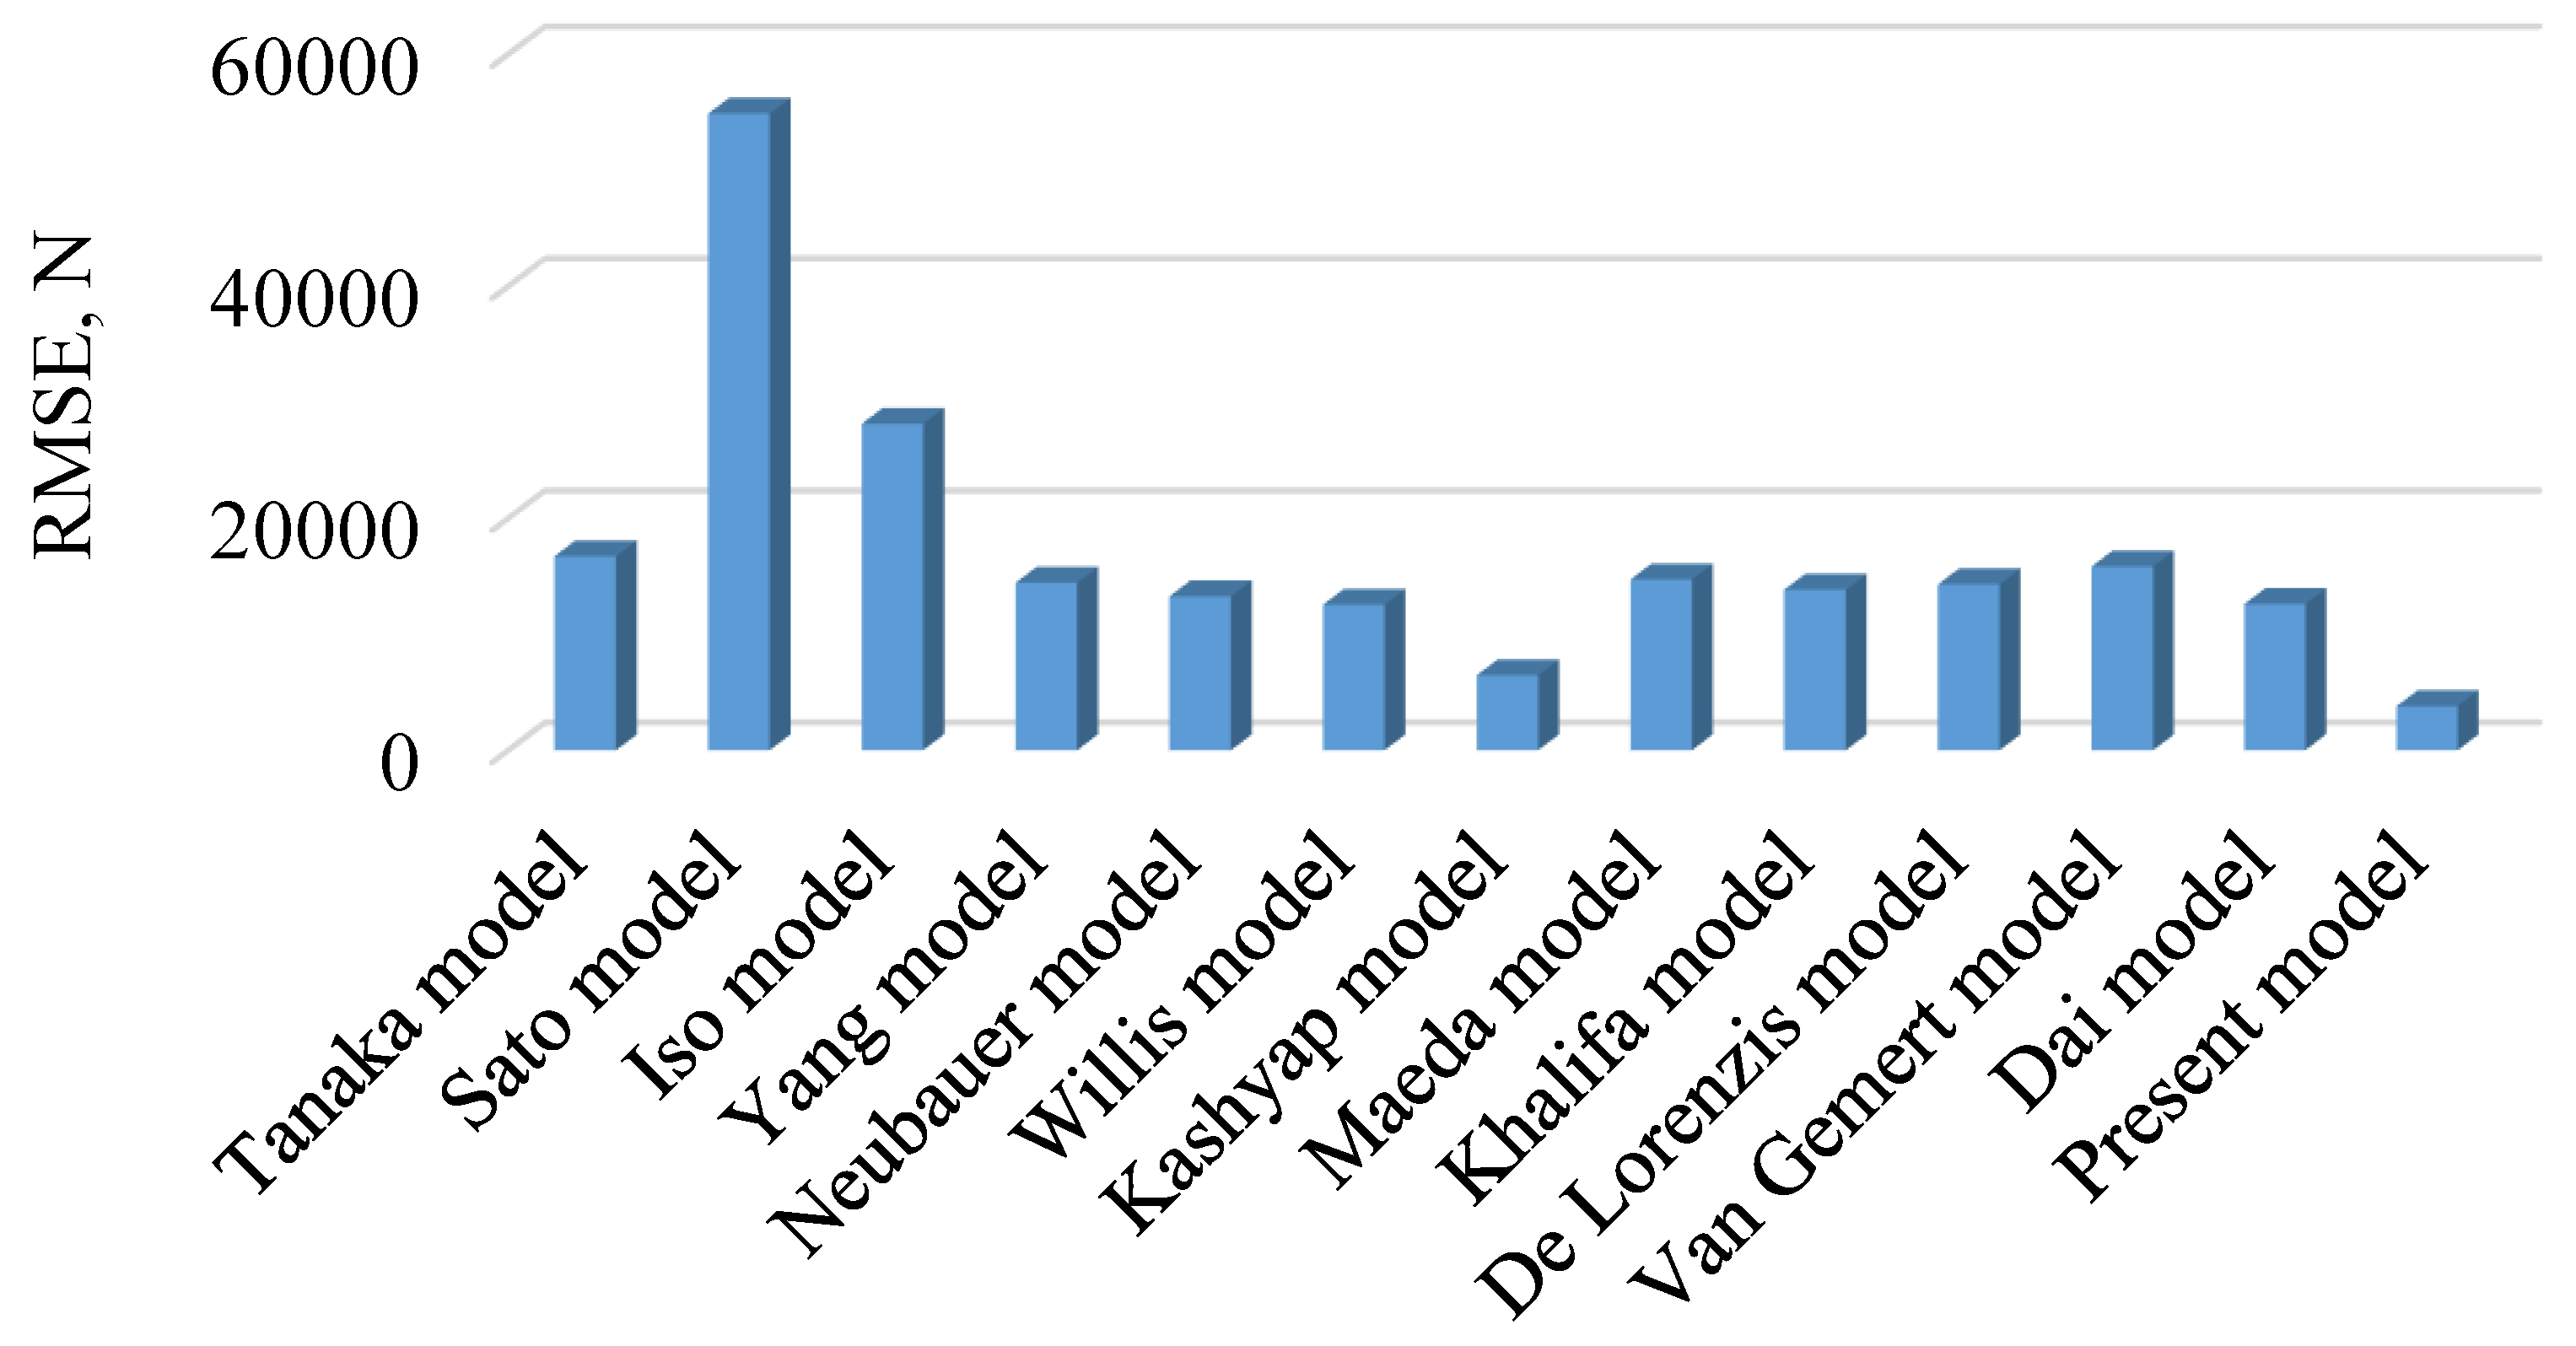
| Tanaka model | 0.1722 | 23,485.3 | 0.1088 | 16,711.0 |
| Sato model | 0.8445 | 70,656.6 | 0.6723 | 54,877.9 |
| Iso model | 0.0783 | 28,333.3 | 0.1179 | 28,139.8 |
| Yang model | 0.4974 | 20,474.6 | 0.2124 | 14,444.9 |
| Neubauer model | 0.4014 | 18,200.2 | 0.3190 | 13,263.4 |
| Willis model | 0.6045 | 17,555.1 | 0.4898 | 12,535.5 |
| Kashyap model | 0.9189 | 8309.8 | 0.8841 | 6471.9 |
| Maeda model | 0.2132 | 20,622.8 | 0.1624 | 14,723.3 |
| Khalifa model | 0.3209 | 19,669.1 | 0.2833 | 13,847.4 |
| De Lorenzis model | 0.2988 | 19,160.5 | 0.2168 | 14,304.8 |
| Van Gemert model | 0.0827 | 21,723.1 | 0.1204 | 15,851.3 |
| Dai model | 0.5013 | 16,790.5 | 0.3837 | 12,609.5 |
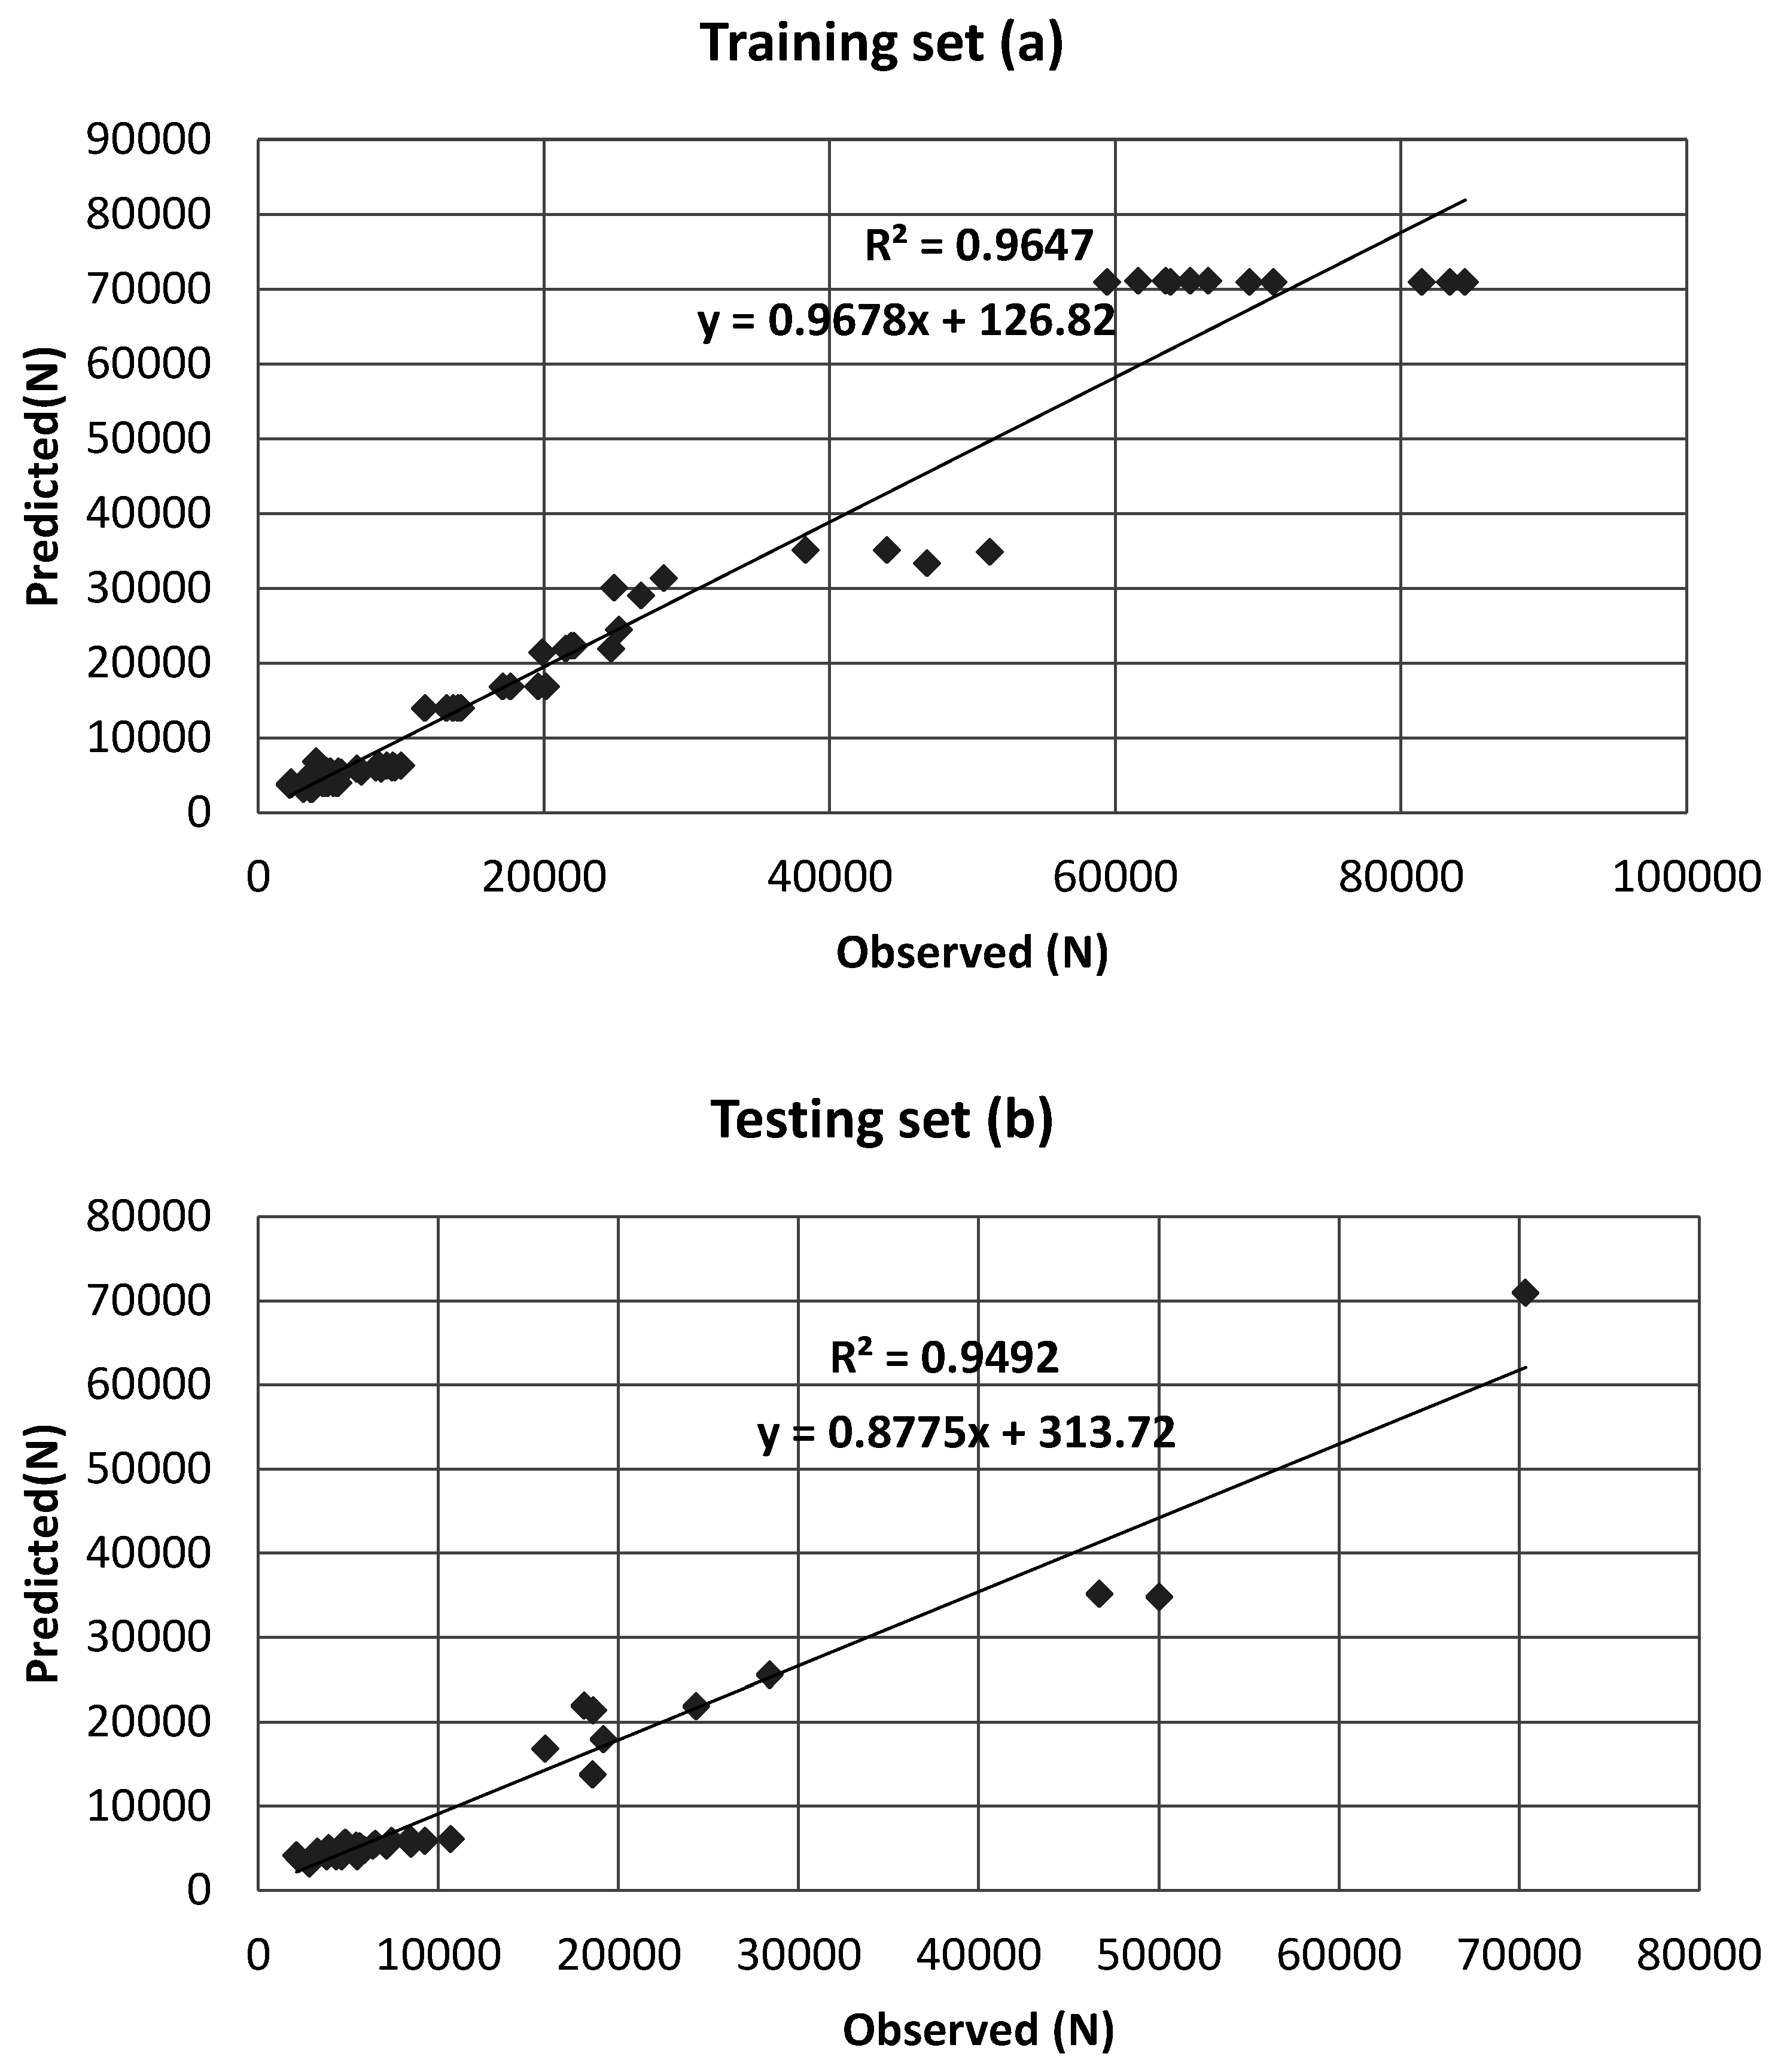
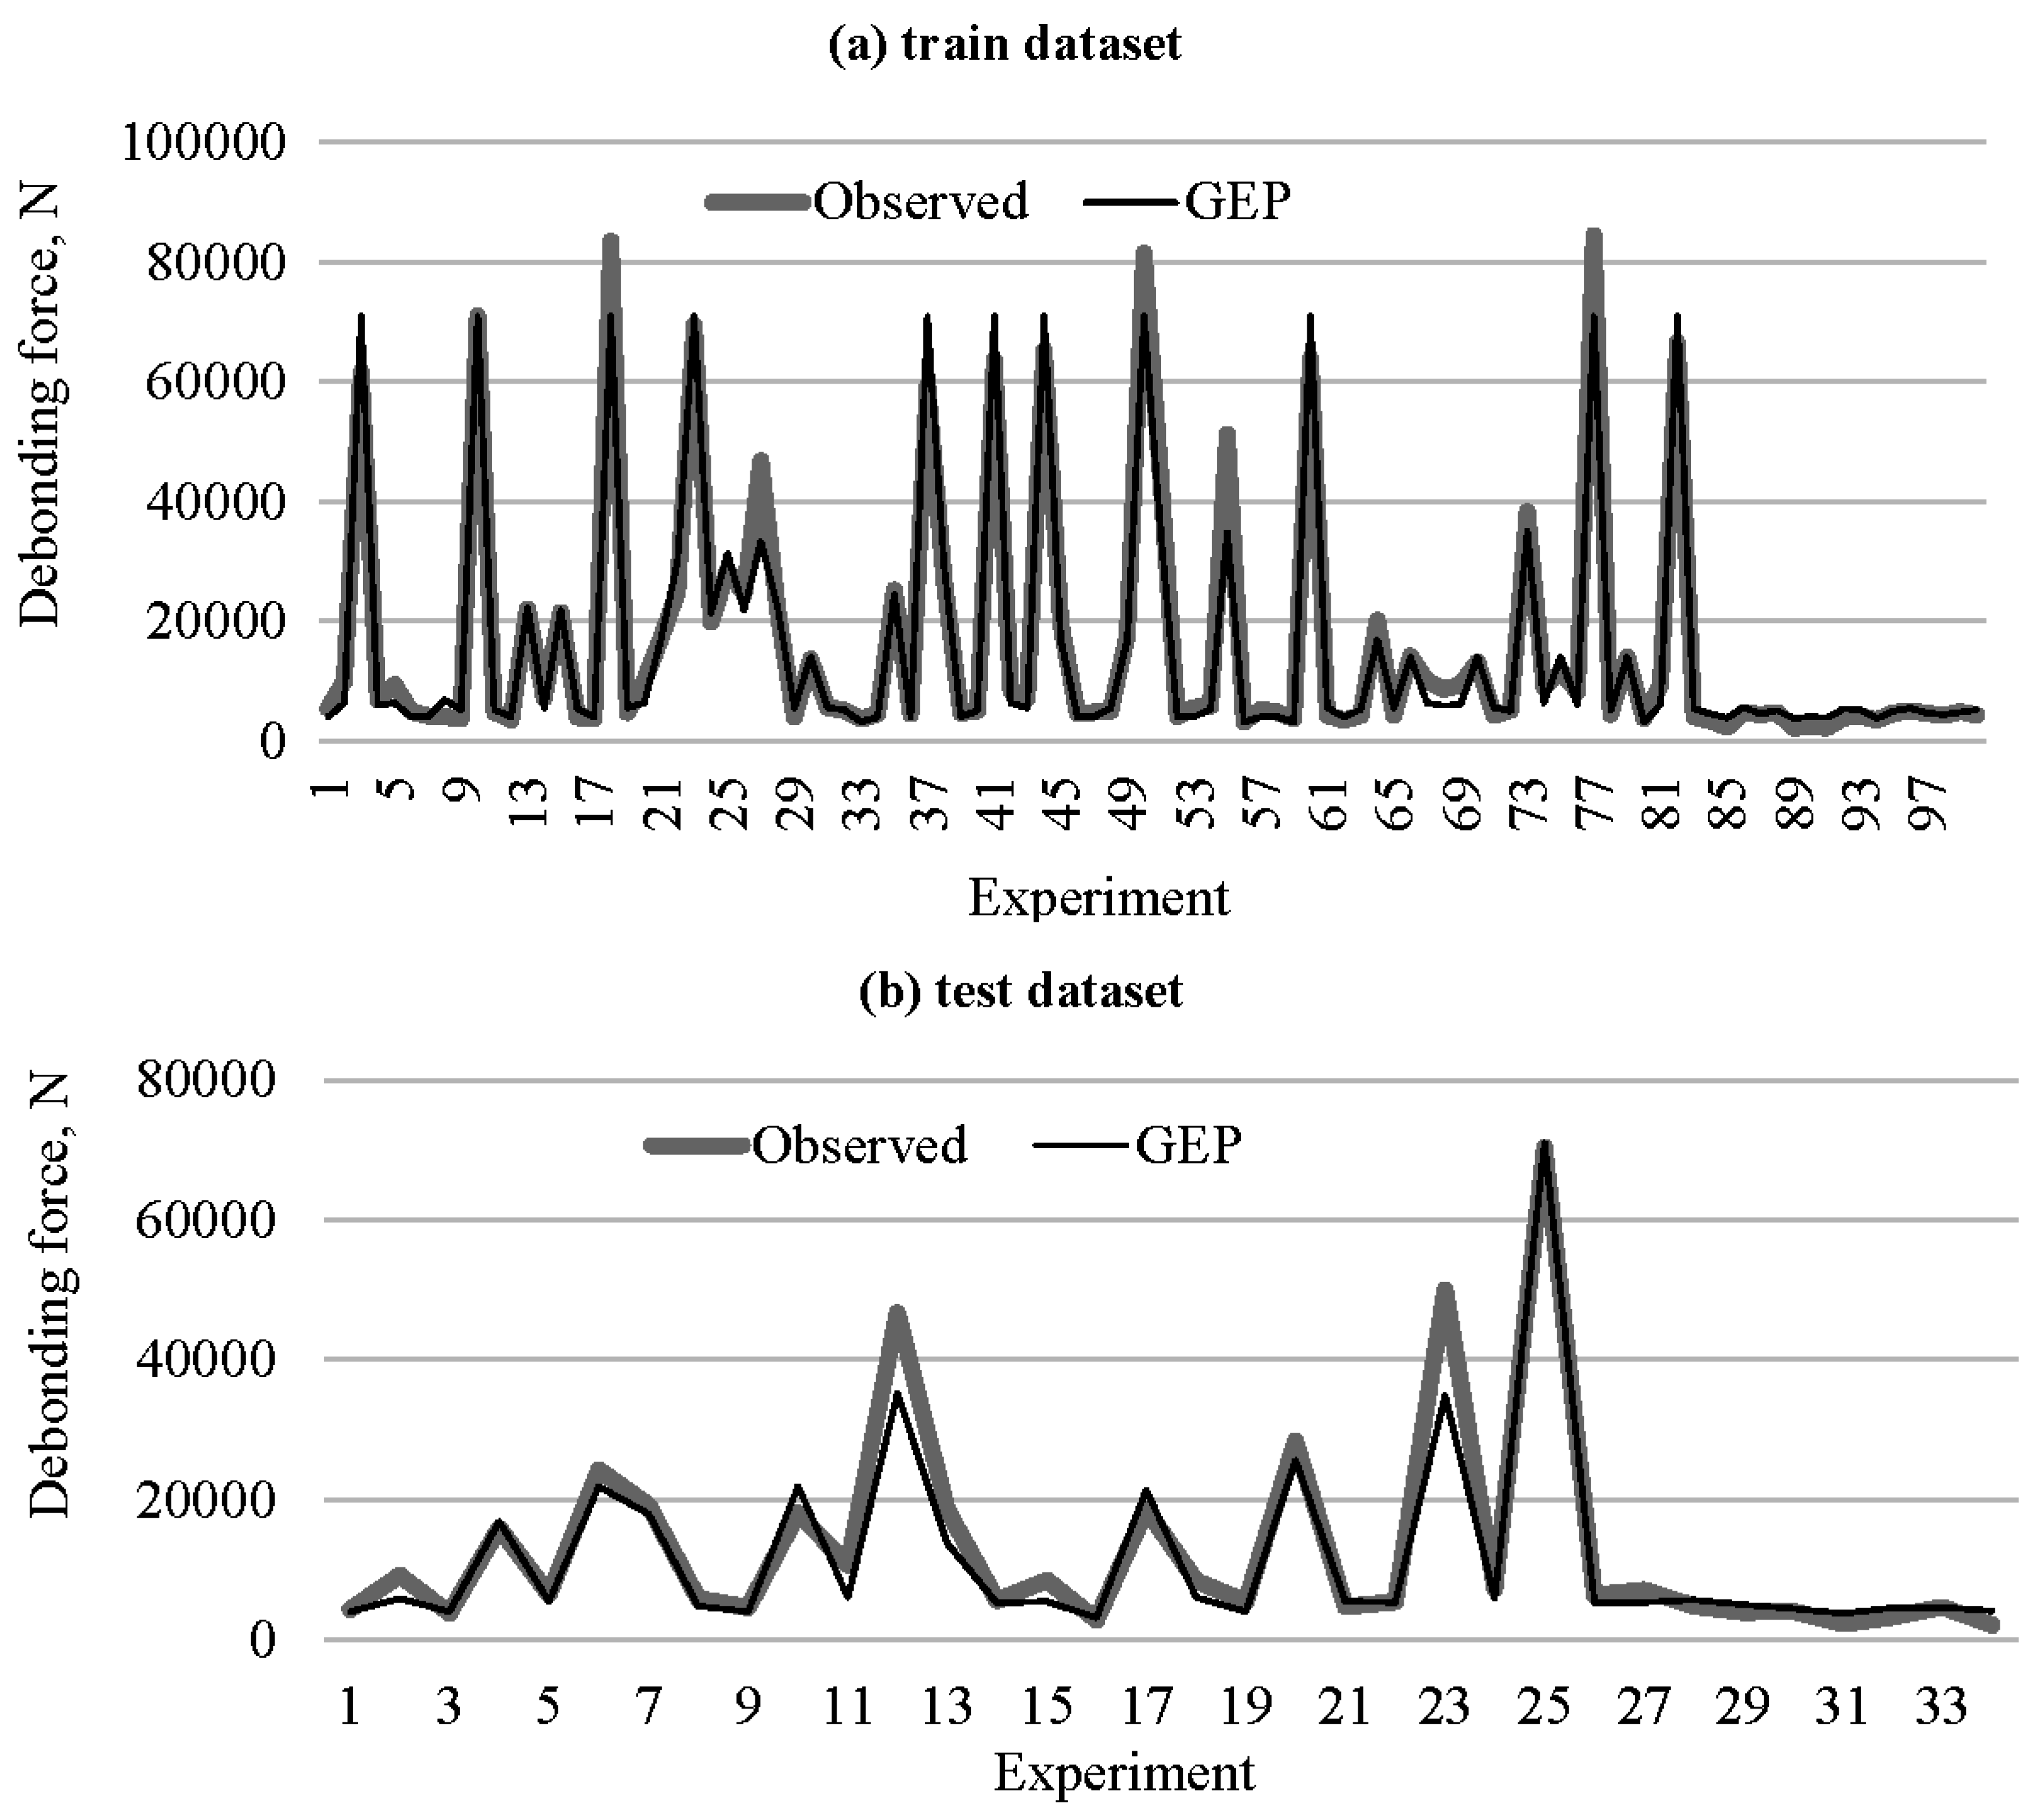
| Present model | 0.9647 | 4013.1 | 0.9492 | 3801.7 |
© 2016 by the authors; licensee MDPI, Basel, Switzerland. This article is an open access article distributed under the terms and conditions of the Creative Commons Attribution (CC-BY) license (http://creativecommons.org/licenses/by/4.0/).
Share and Cite
Mansouri, I.; Hu, J.W.; Kisi, O. Novel Predictive Model of the Debonding Strength for Masonry Members Retrofitted with FRP. Appl. Sci. 2016, 6, 337. https://doi.org/10.3390/app6110337
Mansouri I, Hu JW, Kisi O. Novel Predictive Model of the Debonding Strength for Masonry Members Retrofitted with FRP. Applied Sciences. 2016; 6(11):337. https://doi.org/10.3390/app6110337
Chicago/Turabian StyleMansouri, Iman, Jong Wan Hu, and Ozgur Kisi. 2016. "Novel Predictive Model of the Debonding Strength for Masonry Members Retrofitted with FRP" Applied Sciences 6, no. 11: 337. https://doi.org/10.3390/app6110337