1. Introduction
Optical fibers are widely applied in various sensing systems, owing to the excellent properties, such as small dimensions, flexibility, embeddability, high temperature endurance, dielectric nature, immunity to corrosion, as compared with traditional sensors, and being light weight [
1]. Optical fiber sensors have been developed to measure a variety of physical quantities such as strain, temperature and vibration. Smart structures which integrate both sensors and actuators have the ability to sense environmental changes within or around the structure and are able to interpret and react to these changes. Optical fiber sensors have enabled the implementation of smart structure systems [
2] by (1) providing sensors that are small enough to be integrated directly into materials; (2) enabling sensors to be multiplexed in substantial numbers along a single line; (3) providing electrical isolation and immunity to electromagnetic interference; and (4) supporting the high bandwidth necessary for large numbers of high performance sensors. A number of optical fiber-based sensor systems have been proposed for structural health monitoring; two sensor designs tend to predominate, namely fiber Bragg gratings (FBGs) and interferometric sensors. The sensing principle of FBGs is based on tracking Bragg peak shift due to the changes of environmental conditions, in particular, both strain and temperature in the grating region. FBG sensors have received considerable attention in recent years as powerful strain measurement tools [
3]. They have been employed in a variety of engineering applications involving solidification strain measurement in photocurable resin [
4], thin film stress measurement during the deposition [
5], monitoring the residual strain in thermoplastic composites [
6], and estimating the dynamic structural displacements in a cantilever beam [
7]. Interferometric type optical fiber sensors are based on the phenomenon of optical interference between two identical light waves. The light waves in one of these fibers is used as reference signal, where the second arm acts as the sensing arm of the interferometer. They have the advantages of high sensitively and high spatial resolution. Based on single mode optical fibers, the three most widely employed interferometric configurations are: Mach-Zehnder [
8], Michelson [
9] with a two-arm interferometer and Fabry-Pérot [
10,
11,
12] with a single arm interferometer.
Fiber optic sensors are considered one of the most promising methods for monitoring of process-induced residual strains. Karalekas [
13] employed an FBG sensor to measure the residual strains in photocurable resins. He found that the resin experienced a non-uniform compressive strain due to the photo-polymer solidification. Maccioni
et al. [
14] investigated the effect of the cladding diameter on the strain measurement. They reported that the longitudinal force F is proportional to the outer surface of the optical fiber,
i.e., F ∝ cladding diameter. The strain of the optical fiber induced by the longitudinal force is equal to
where the cross section area A is proportional to the square of the cladding diameter. Thus, the strain sensitivity of the optical fiber sensor is inverse proportional to the cladding diameter.
Optical fibers can be either embedded or surface bonded to the host structure. The capability of an optical fiber sensor to monitor the strain in a structure depends on the bonding characteristics which includes the bonding length, cladding diameter, adhesive and protective coating. As a sensor, it is expected that the strains between the optical fiber and host structure are the same. However, due to the existence of the adhesive layer and protective coating, part of the energy is converted into shear deformation. Thus, the strain of the optical fiber is different from that of the host structure. Lau
et al. [
15] developed a simple model to calculate the percentage of strain applied to the host structure actually transferred to the embedded fiber optic sensor. Zhou
et al. [
16] investigated the influence of coating and adhesive on the strain transmission of embedded fiber optic sensors. Wan
et al. [
17] investigated the influence of four geometric parameters of the adhesive, side width, top thickness, bonded length and bottom thickness, on the strain of the optical fiber. Most of the existing works that have studied the strain transfer between the optical fiber and host material have focused on the embedded optical fiber. In this investigation, the fiber optic sensor is surface bonded on the host structure. Previous work [
18] developed a theoretical model to predict the strain transfer between the host structure and surface bonded optical fiber. Present work employed the theoretical model to study the effects of the adhesive and bonding length on the optical fiber strain sensor. Experimental tests were conducted to verify the theoretical model. A series of experimental tests is performed to evaluate the influences of the adhesive and the bonding length on the strain transferred from the host structure to the optical fiber.
2. Strain Analysis of Surface Bonded Optical Fiber
When the optical fiber is used as a sensor to monitor the strain or stress in a structure, the capability of measurement depends on the bonding characteristics between the optical fiber and host structure. The measuring sensitivity of the optical fiber sensor is affected by the protective coating, adhesive layer, and bonding length. In this investigation, the optical fiber is surface bonded on the host structure while the external loads (stress or strain) are applied on the host structure only. In fact, the deformation of optical fiber induced by the host structure is transferred via the adhesive layer and protective coating. The deformation of the optical fiber induces the change of the optical signal transmission since the stress or strain is directly applied to the host structure other than the optical fiber, so that the strain or stress in the optical fiber is subjected to shearing at the interface between the optical fiber and the adhesive. The analytical model is shown in
Figure 1 with cylindrical optical fiber and coating on the top and the host material under the bottom, with adhesive in between. Host material is subjected to far field strain. In this work, the transformation of the strains between the host structure and surface bonded optical fiber sensor was derived based on the following assumptions: (1) all interfaces are perfectly bonded
i.e., displacement continuity along the interfaces; and (2) the adhesive and protective coating are subjected to shear deformation only. This assumption is reasonable since the Young’s moduli of the adhesive and protective coating are significantly smaller than host structure and optical fiber. Her and Tsai [
18] have derived the analytical solution basing on the shear lag model to predict the optical fiber strain induced by the host material as follows:
where
, and
are Young’s moduli of the host material and optical fiber, respectively;
and
are the shear moduli of the adhesive and coating, respectively;
and
are the radii of the optical fiber and coating, respectively; h is the thickness of the host material;
is half of the surface bonded length;
is the strain applied to the host material;
b is the gap between the adhesive and optical fiber as shown in
Figure 1; and
and
s denote the bonding length ranging from
to
.
Figure 1.
Analytical model of surface bonded optical fiber [
16].
Figure 1.
Analytical model of surface bonded optical fiber [
16].
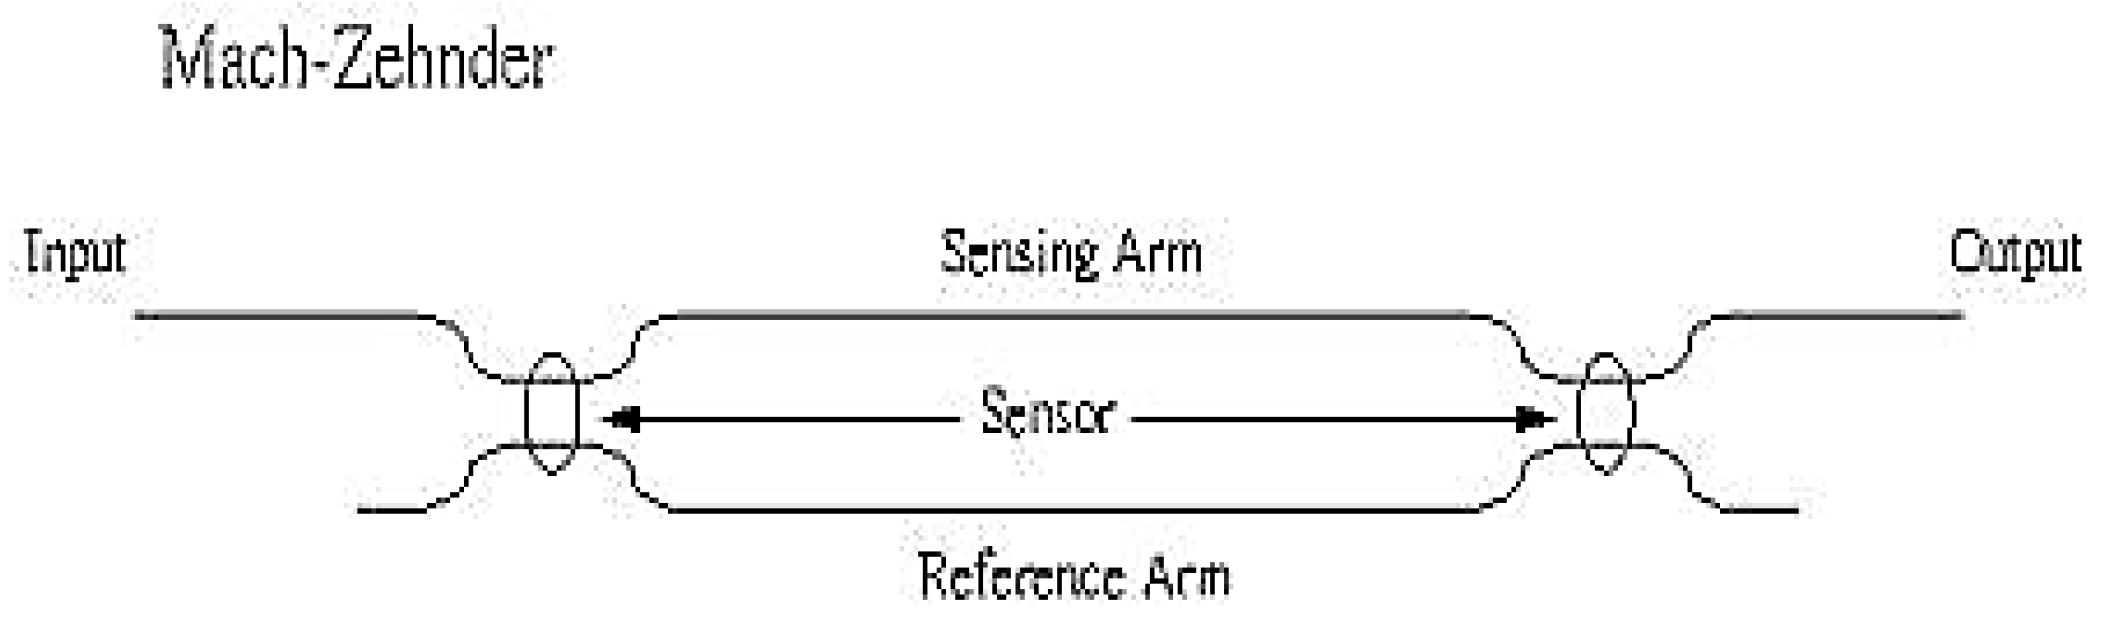
3. Mach-Zehnder Interferometric Sensor
Interferometric sensors have received much attention due to their high sensitivity and high spatial resolution. The Mach-Zehnder optical fiber sensor is perhaps the best known because it was developed first. This interferometer acts in the classic sense by optically interfering the light propagating in the reference and sensing fibers. A schematic diagram of a Mach-Zehnder interferometer is shown in
Figure 2. It consists of two 2 × 2 couplers at the input and output. The excitation is applied to the sensing fiber, resulting in optical path difference between the reference and sensing fibers.
Figure 2.
Mach-Zehnder interferometer.
Figure 2.
Mach-Zehnder interferometer.
The light intensity of the output of the Mach–Zehnder interferometer can be expressed as [
19]
where
is the optical phase shift,
is the refractive index of the optical fiber,
is optical wavelength,
is the Poisson’s ratio,
and
are the Pockel’s constants,
is the strain of the optical fiber. Since the terms in front of the integral sign of
are constants for any given optical fiber system, the total optical phase shift
is proportional to the integral of the optical fiber strain. Thus, by measuring the total optical phase shift, the integral of the optical fiber strain can be easily obtained as follows:
The light intensity shown in Equation (2) is a cosine function of the optical phase shift. As the optical phase shift
, the light intensity goes through a complete cycle. The corresponding integral of the strain is
The integral of the strain in Equation (4) represents the total change of the length of the sensing fiber, which is surface bonded on the host material. Thus, the average strain transferred to the surface bonded optical fiber for one complete cycle of light intensity,
i.e., per fringe can be obtained
The total average strain in the surface bonded optical fiber can be calculated by counting the number of fringes as follows.
where
m is an integer denoted as the number of fringes. Thus, the experimental result of the average strain of the surface bonded optical fiber using the Mach-Zehnder interferometric technique can be determined from Equation (6). The maximum experimental error is equal to the strain transferred to the optical fiber per fringe as shown in Equation (5).
Theoretical prediction of the average strain of the surface bonded optical fiber can be deduced from Equation (1) as
The coefficients of strain transfer between the optical fiber and host material for the experimental measurement
and theoretical prediction
are defined as follows:
where
denotes the average strain of the host material along the bonding length.
4. Experimental Test Results and Discussions
Uniaxial tensile tests were conducted to investigate the strain response measured by the surface bonded optical fiber sensor. A bare single mode optical fiber (Model No: SMF130V, Prime Optical Fiber Corporation, Taiwan) is bonded on the front surface of the central area of the specimen as the sensing fiber of the Mach–Zehnder interferometer. The test specimen is made of aluminum with dimensions of length 100 mm, width 12.5 mm and thickness 5 mm. A strain gauge is bonded on the back surface of the specimen to measure the strain
of the host material induced by the tensile test. The material properties of the optical fiber, protective coating and host structure are shown in
Table 1. The outer radii of the optical fiber and coating are
and
, respectively; the thickness of the host structure
. The index of refraction and Pockel’s constants [
20] are
, respectively. The wavelength of the light emitted from the laser diode to the optic fiber is
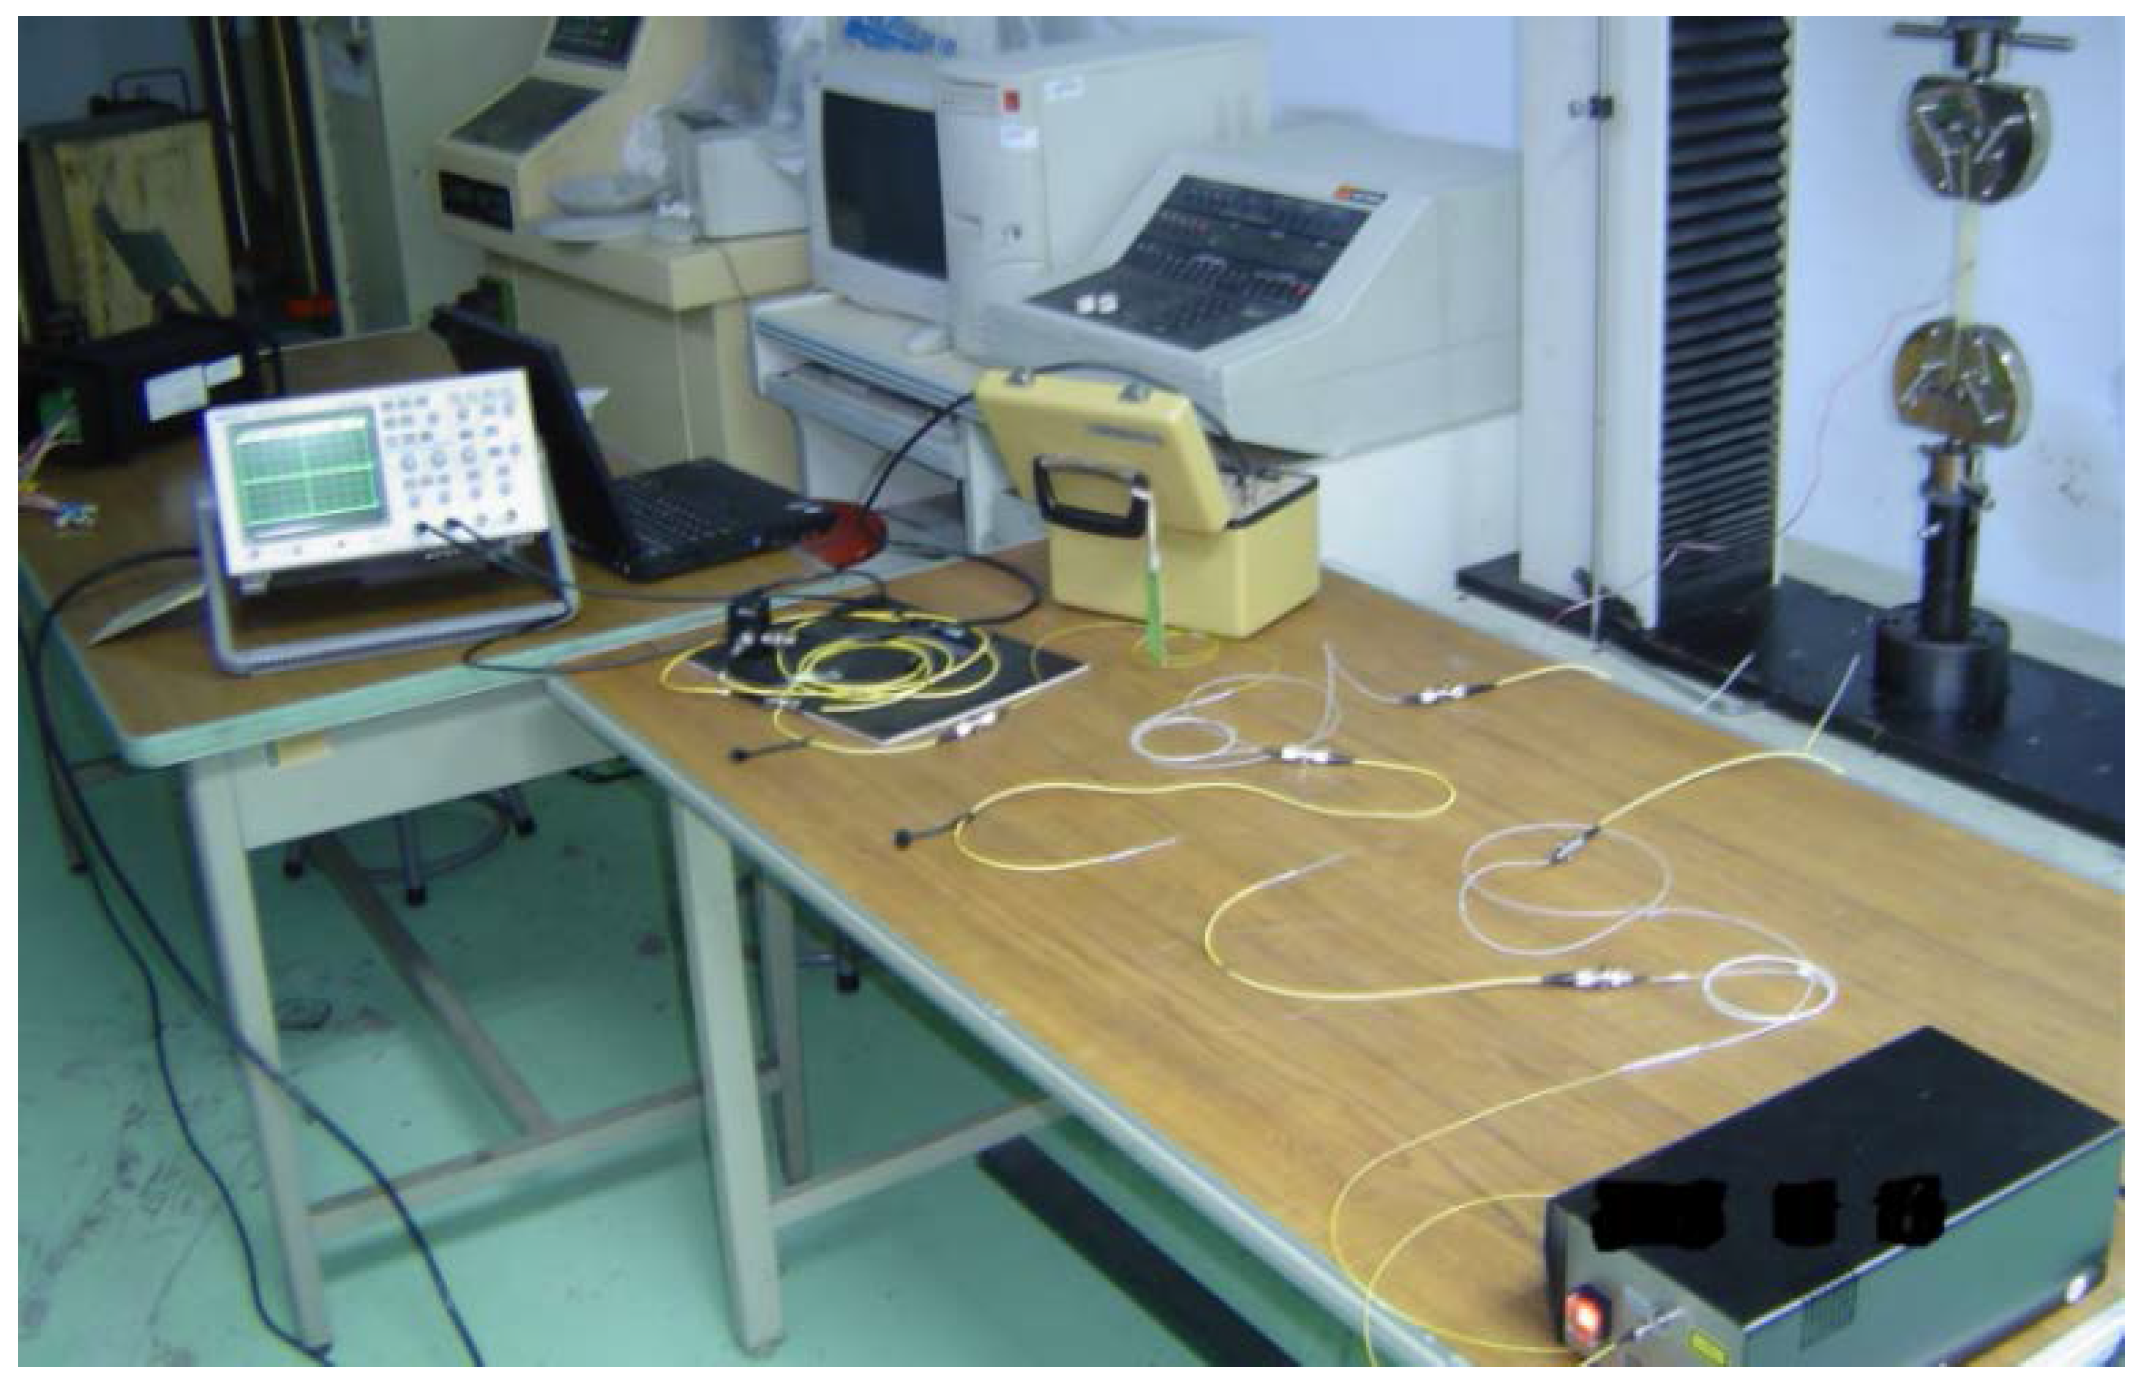
. The experimental setup is shown in
Figure 3.
Table 1.
Material properties.
Table 1.
Material properties.
| Material | Host Material | Coating | Optical Fiber |
|---|
| Young’s modulus (GPa) | 72 | 0.0067 | 72 |
| Poisson’s ratio | 0.3 | 0.49 | 0.17 |
Figure 3.
Experimental setup of the tensile test measured by Mach–Zehnder interferometry.
Figure 3.
Experimental setup of the tensile test measured by Mach–Zehnder interferometry.
The length of the surface bonded optical fiber is varied from
= 50 mm to 120 mm, with increments of 10 mm in the experimental test to investigate the effect of the bonding length on the optical fiber strain. Three different adhesives, namely epoxy (Model No. 6670, Giuloo Chemicals Co. Ltd., Taiwan), acrylate (Model No. IPS66-GAL, Industrial Polychemical Service Corporation, GA, USA) and M-coat A (Vishay Precision Group, Inc., NC, USA), were used to investigate the influence of the adhesive on the optical fiber strain. The material properties of these three different adhesives are listed in
Table 2.
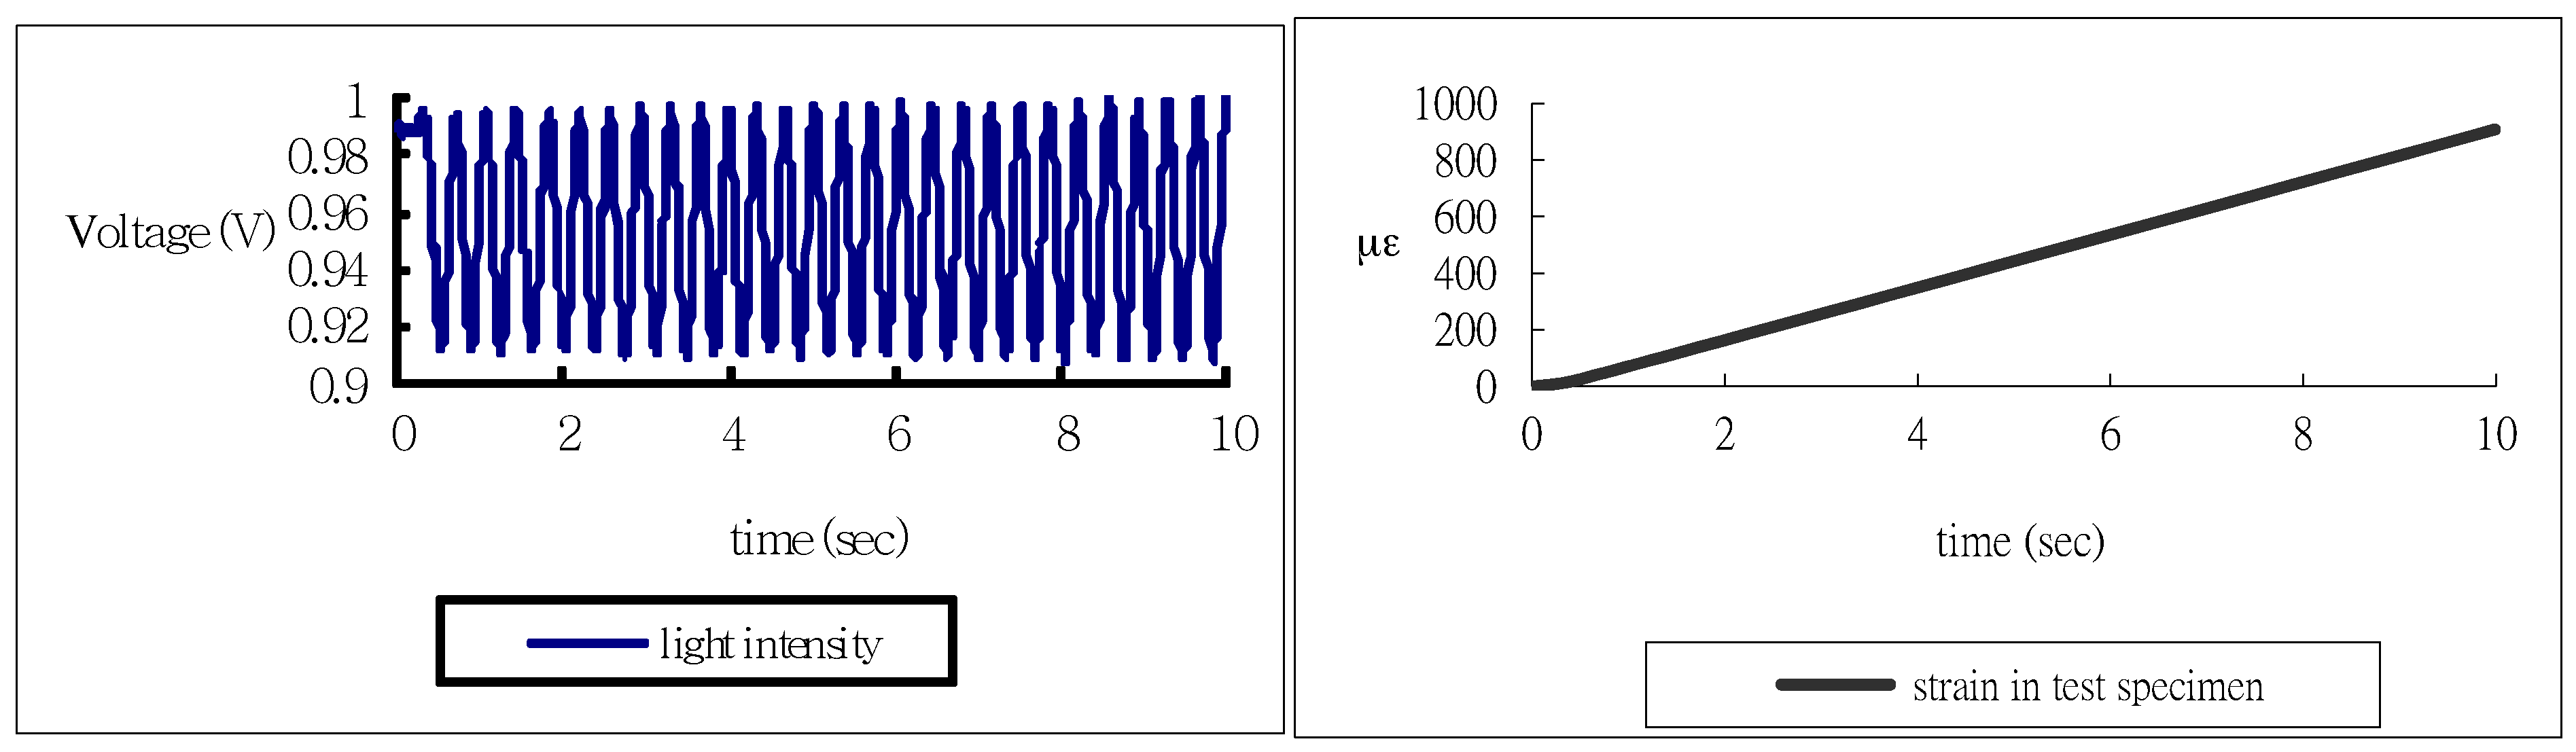
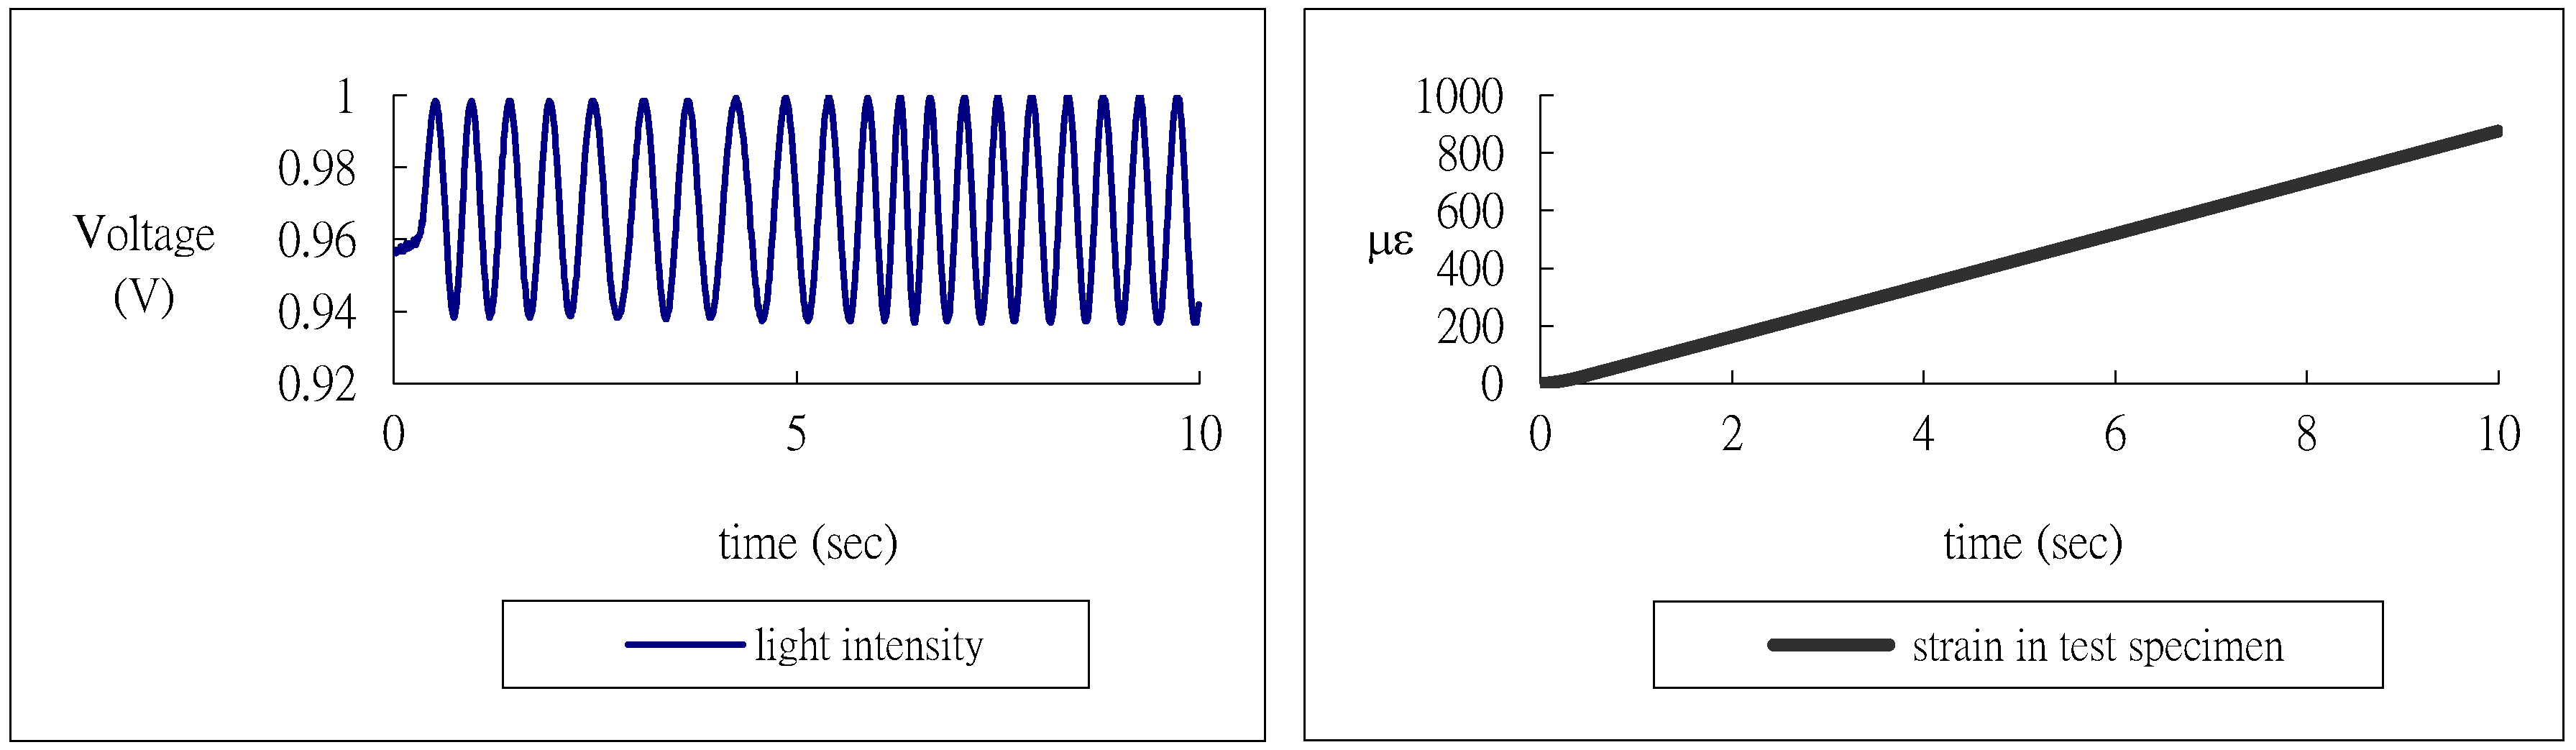
Figure 4 shows the results of the strain in the test specimen measured by the strain gauge and the light intensity of the Mach-Zehnder interferometer for epoxy adhesive with bonding length of 60 mm. In the case of acrylate and M-coat, the experimental results are shown in
Figure 5 and
Figure 6, respectively.
Table 2.
Material properties of three different adhesives.
Table 2.
Material properties of three different adhesives.
| Adhesive | Epoxy | Acrylate | M-Coat |
|---|
| Young’s modulus MPa | 2000 | 2 | 2.43 |
| Shear modulus MPa | 714 | 0.671 | 0.815 |
Figure 4.
Light intensity of Mach-Zehnder interferometer and strain of test specimen measured by strain gauge for epoxy adhesive with bonding length 60 mm.
Figure 4.
Light intensity of Mach-Zehnder interferometer and strain of test specimen measured by strain gauge for epoxy adhesive with bonding length 60 mm.
Figure 5.
Light intensity of Mach-Zehnder interferometer and strain of test specimen measured by strain gauge for acrylate adhesive with bonding length 60 mm.
Figure 5.
Light intensity of Mach-Zehnder interferometer and strain of test specimen measured by strain gauge for acrylate adhesive with bonding length 60 mm.
Figure 6.
Light intensity of Mach-Zehnder interferometer and strain of test specimen measured by strain gauge for M-coat adhesive with bonding length 60 mm.
Figure 6.
Light intensity of Mach-Zehnder interferometer and strain of test specimen measured by strain gauge for M-coat adhesive with bonding length 60 mm.
It appears that the number of light intensity cycles increases with the increase of the adhesive modulus, while the loading conditions including the end loads and loading rate remain the same. Counting the number of fringes from
Figure 4,
Figure 5 and
Figure 6 and then substituting into Equation (6) yields the experimental result of the average strain of the optical fiber. Theoretical prediction of the average optical fiber strain is obtained by substituting the strain
ε0 of the test specimen into Equation (7).
Table 3,
Table 4 and
Table 5 show the results of the average optical fiber strain for various bonding lengths attained by experimental measurement and theoretical prediction with epoxy, acrylate and M-coat adhesives, respectively. Good agreement is achieved between the theoretical calculation Equation (7) and the experimental measurement Equation (6) with a difference of less than 8%.
Table 3.
Average strain of the optical fiber obtained by the experimental measurement Equation (6) and theoretical calculation Equation (7) with epoxy adhesive.
Table 3.
Average strain of the optical fiber obtained by the experimental measurement Equation (6) and theoretical calculation Equation (7) with epoxy adhesive.
| Bonded Length () | Host Material Strain (με) | Experimental Measurement Equation (6) of Optical Fiber Strain (με) | Theoretical Calculation Equation (7) of Optical Fiber Strain (με) | Difference between Equations (6) and (7) (%) |
|---|
| 5 cm | 891 | 499 | 541 | 7.76 |
| 6 cm | 931 | 578 | 622 | 7.07 |
| 7 cm | 902 | 622 | 646 | 3.71 |
| 8 cm | 912 | 745 | 688 | 8.29 |
| 9 cm | 953 | 742 | 738 | 0.54 |
| 10 cm | 950 | 742 | 763 | 2.75 |
| 11 cm | 940 | 753 | 769 | 2.08 |
| 12 cm | 951 | 779 | 788 | 1.14 |
Table 4.
Average strain of the optical fiber obtained by the experimental measurement Equation (6) and theoretical calculation Equation (7) with acrylate adhesive.
Table 4.
Average strain of the optical fiber obtained by the experimental measurement Equation (6) and theoretical calculation Equation (7) with acrylate adhesive.
| Bonded Length () | Host Material Strain (με) | Experimental Measurement Equation (6) of Optical Fiber Strain (με) | Theoretical Calculation Equation (7) of Optical Fiber Strain (με) | Difference between Equations (6) and (7) (%) |
|---|
| 5 cm | 874 | 355 | 389 | 8.74 |
| 6 cm | 925 | 457 | 473 | 3.38 |
| 7 cm | 869 | 479 | 500 | 4.20 |
| 8 cm | 909 | 573 | 564 | 1.60 |
| 9 cm | 934 | 632 | 618 | 2.27 |
| 10 cm | 859 | 593 | 604 | 1.82 |
| 11 cm | 850 | 605 | 629 | 3.82 |
| 12 cm | 955 | 695 | 708 | 1.84 |
Table 5.
Average strain of the optical fiber obtained by the experimental measurement Equation (6) and theoretical calculation Equation (7) with M-coat adhesive.
Table 5.
Average strain of the optical fiber obtained by the experimental measurement Equation (6) and theoretical calculation Equation (7) with M-coat adhesive.
| Bonded Length () | Host Material Strain (με) | Experimental Measurement Equation (6) of Optical Fiber Strain (με) | Theoretical Calculation Equation (7) of Optical Fiber Strain (με) | Difference between Equations (6) and (7) (%) |
|---|
| 5 cm | 1827 | 799 | 835 | 4.31 |
| 6 cm | 1711 | 872 | 911 | 4.28 |
| 7 cm | 1654 | 983 | 979 | 0.41 |
| 8 cm | 1715 | 1083 | 1097 | 1.28 |
| 9 cm | 1598 | 1106 | 1082 | 2.22 |
| 10 cm | 1727 | 1241 | 1224 | 1.39 |
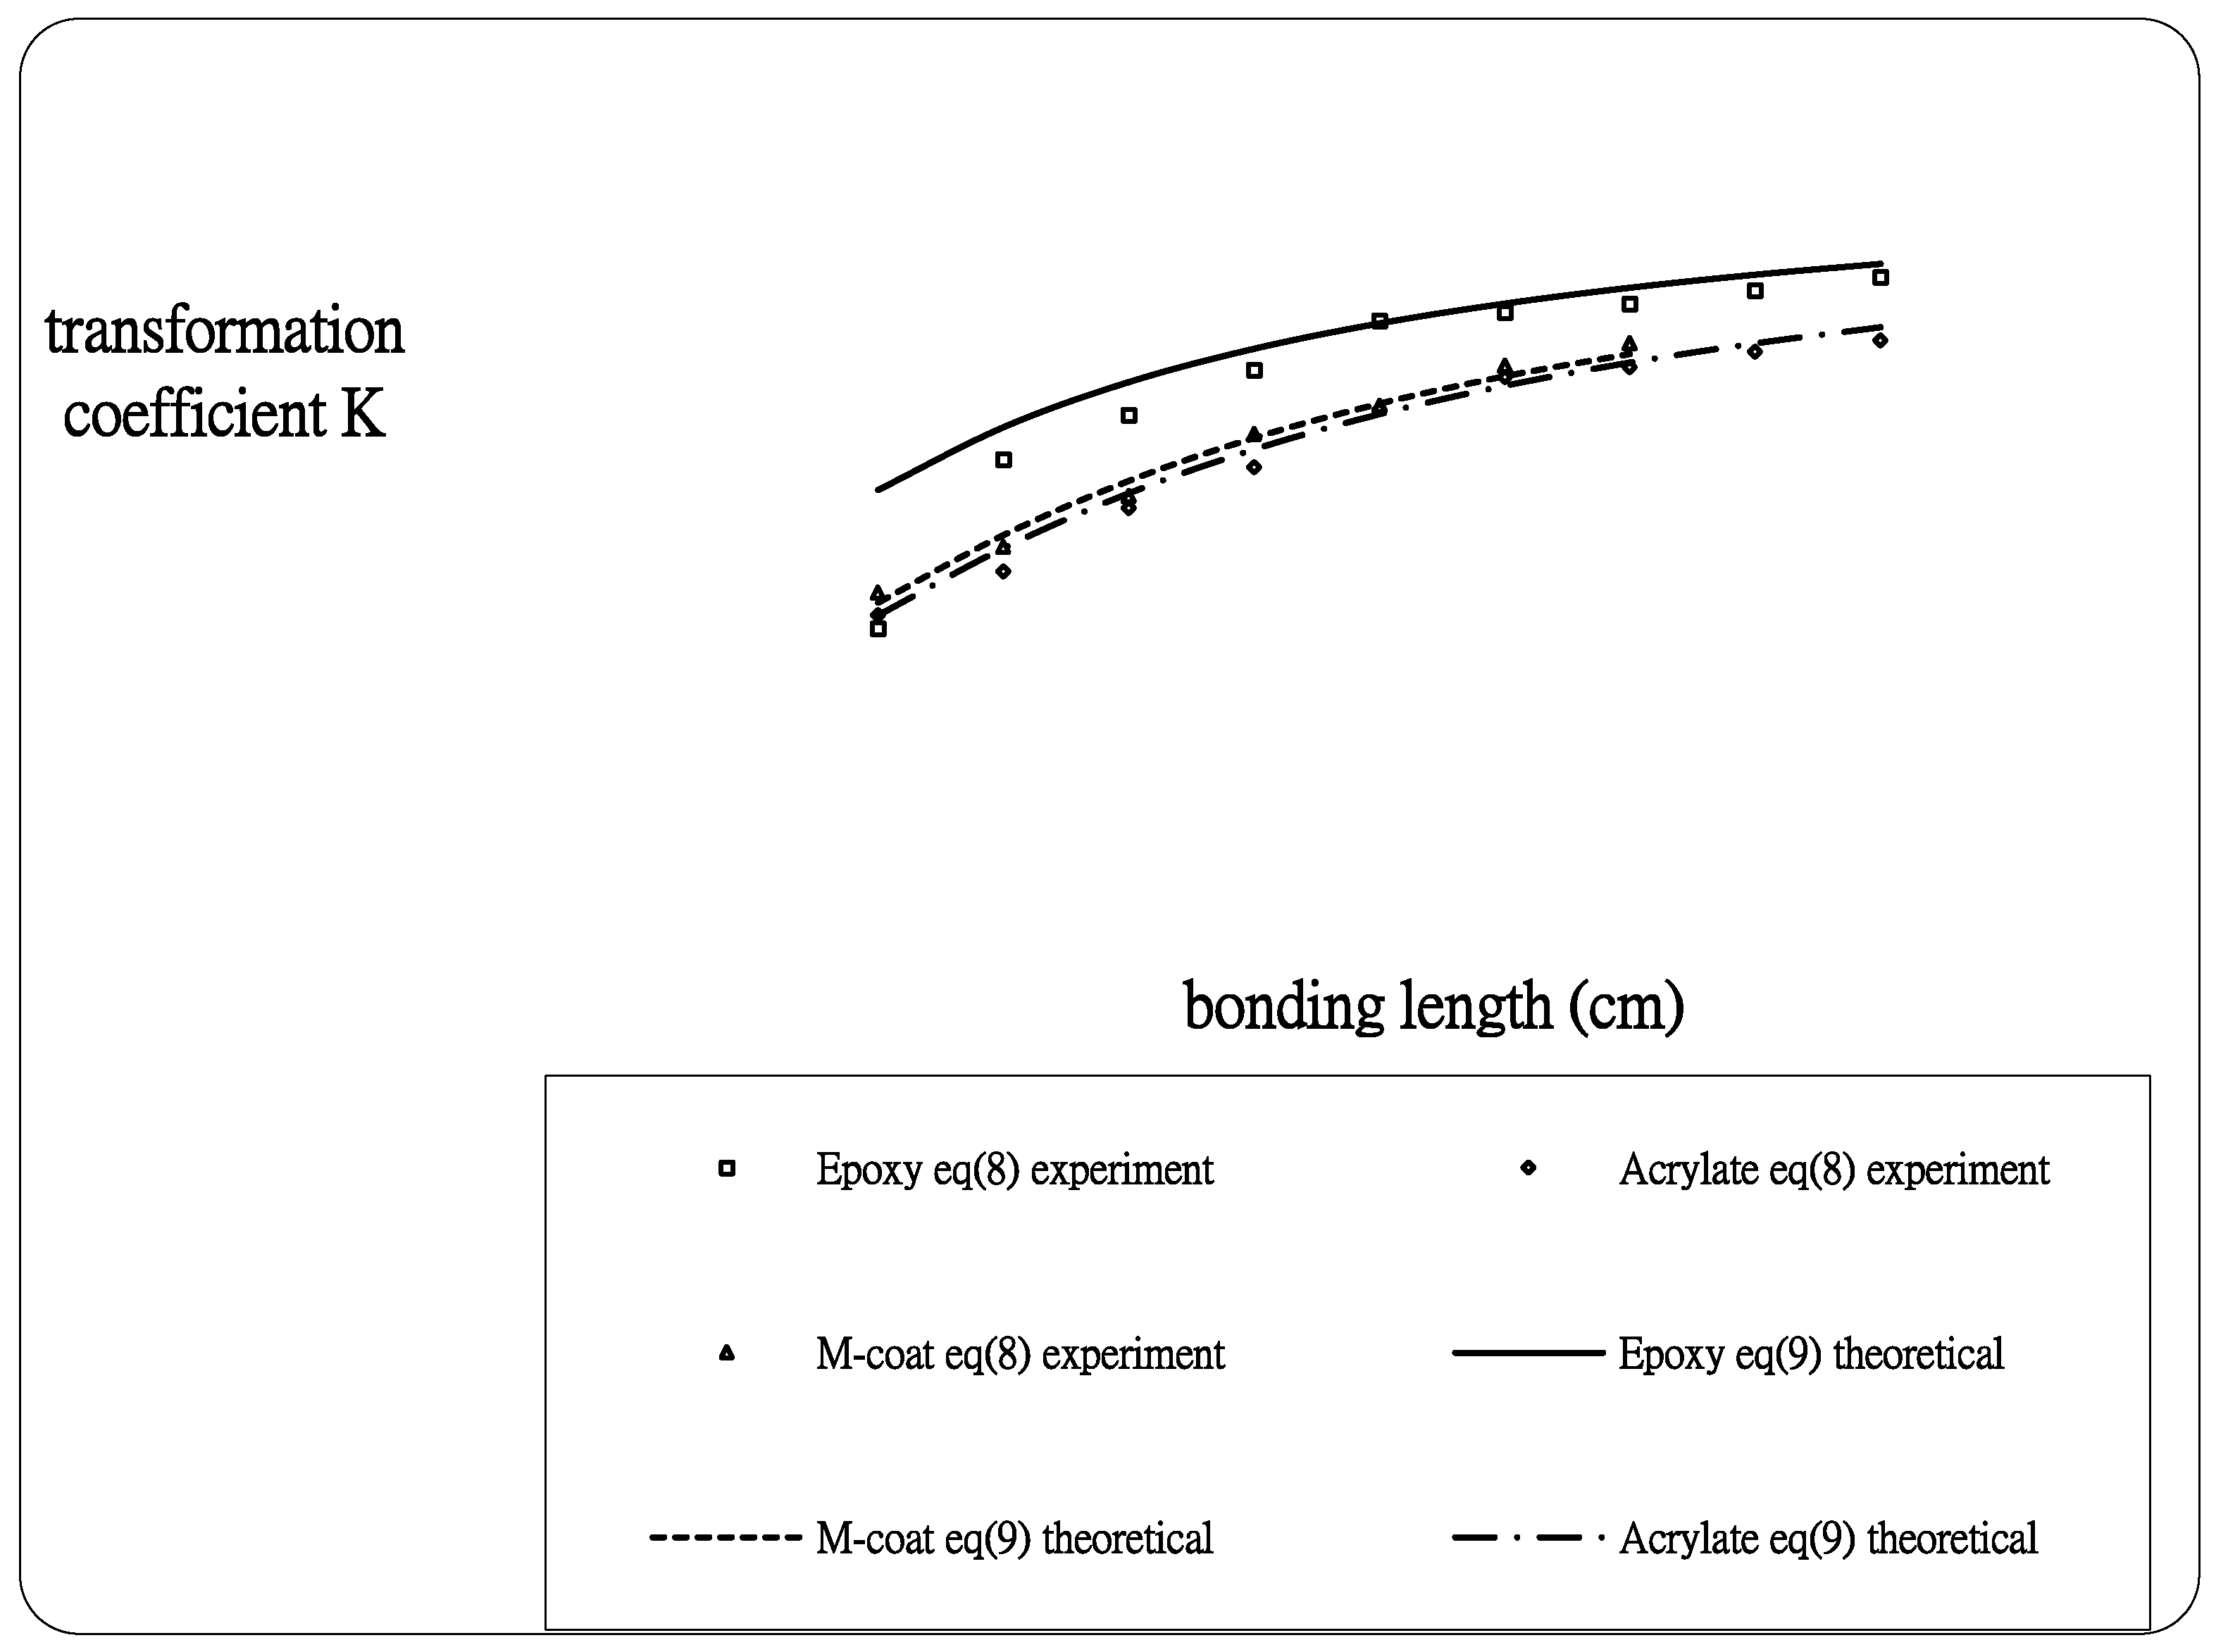
The coefficient of strain transfer between the optical fiber and host material can be obtained by utilizing Equation (8) for experimental measurement and Equation (9) for theoretical prediction.
Figure 7 shows the results of the coefficient of strain transfer
versus the bonding length for epoxy, acrylate and M-code adhesives. From
Table 3,
Table 4 and
Table 5 and
Figure 7, the optical fiber strain is not the same as that in the host material. The longer the bonding length the larger the coefficient of strain transfer,
i.e., more strain is transferred to the optical fiber. The coefficient of strain transfer increases with the increase of the adhesive modulus. The influence of the adhesive on the strain transfer rate between the optical fiber and host material is investigated experimentally in this section. The experimental results for the general strain transfer trend related to the bonding length and adhesive agree well with the theoretical predictions.
Figure 7.
Coefficient of strain transfer versus bonding length for three different adhesives obtained by experimental measurement Equation (8) and theoretical prediction Equation (9).
Figure 7.
Coefficient of strain transfer versus bonding length for three different adhesives obtained by experimental measurement Equation (8) and theoretical prediction Equation (9).


