3.1. Blue-Violet Femtosecond Pulse Generation by a GaInN MLLD
By varying the intracavity GVD, the ultrashort optical pulses from the GaInN MLLD changed drastically [
10,
11]. A typical intensity autocorrelation trace for output optical pulses from the MLLD with a negative intracavity GVD is shown as the blue trace in
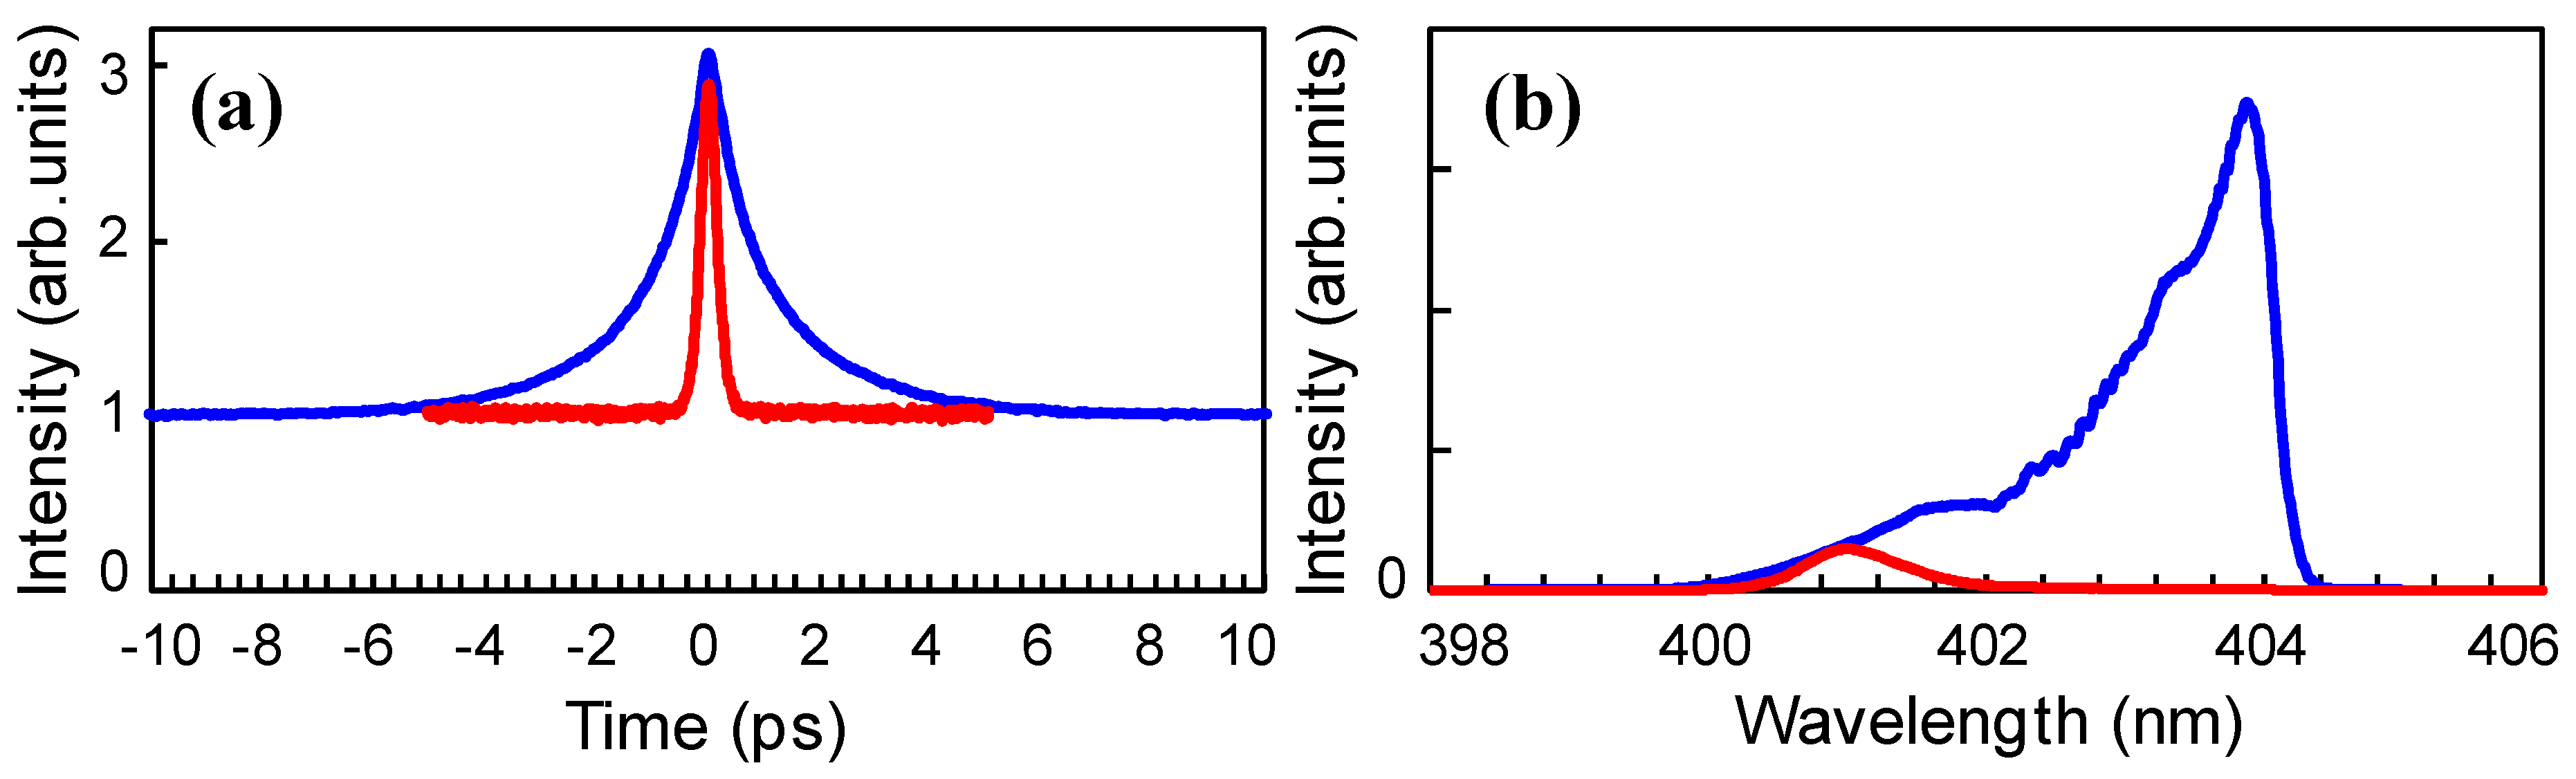
Figure 2a. The gain current was 140 mA and the reverse bias voltage applied to the SA section was 6.0 V. The average output power was about 12 mW and the pulse repetition rate was about 1 GHz. The intracavity GVD was estimated to be −0.058 ps
2 using the geometrical parameters of the dispersion-compensation optics. The blue trace in
Figure 2b shows the corresponding optical spectrum. As reported previously, femtosecond optical pulses were obtained by extracting the short wavelength components of the optical spectrum.
Figure 2a also shows an intensity autocorrelation trace for the optical pulses after the bandpass (BPF) filter (red trace). The spectral bandwidth of the BPF was 1.3 nm and the output beam was passed through the BPF twice in order to suppress the intense spectral components at longer wavelength. The resulting spectral width was 0.8 nm and the pulse duration was 210 fs, assuming a sech
2 function pulse shape. The time-bandwidth product was estimated to be 0.35, close to that of a Fourier transform limited pulse. The shortest pulse duration of 200 fs was obtained using another BPF of different spectral width [
10]. The spectral components at the short wavelength edge of the optical spectrum were almost free from chirp. The average power after the BPF was about 0.8 mW. The pulse peak power was estimated to be about 4 W. The femtosecond pulse components were less than 10% of the total output power of the GaInN MLLD.
Figure 2.
(a) Intensity autocorrelation traces for optical pulses from a GaInN MLLD with negative intracavity GVD measured without a bandpass filter (blue trace), and with a bandpass filter (red trace); (b) Corresponding optical spectra without a bandpass filter (blue trace), and with a bandpass filter (red trace).
3.2. Cross-Correlation Measurements of the Optical Pulses from a GaInN MLLD
The autocorrelation trace in
Figure 2a shows that the output optical pulses from the GaInN MLLD without spectral filtering cannot be reproduced using either sech
2 or Gaussian function. The fact that the corresponding optical spectrum shown in
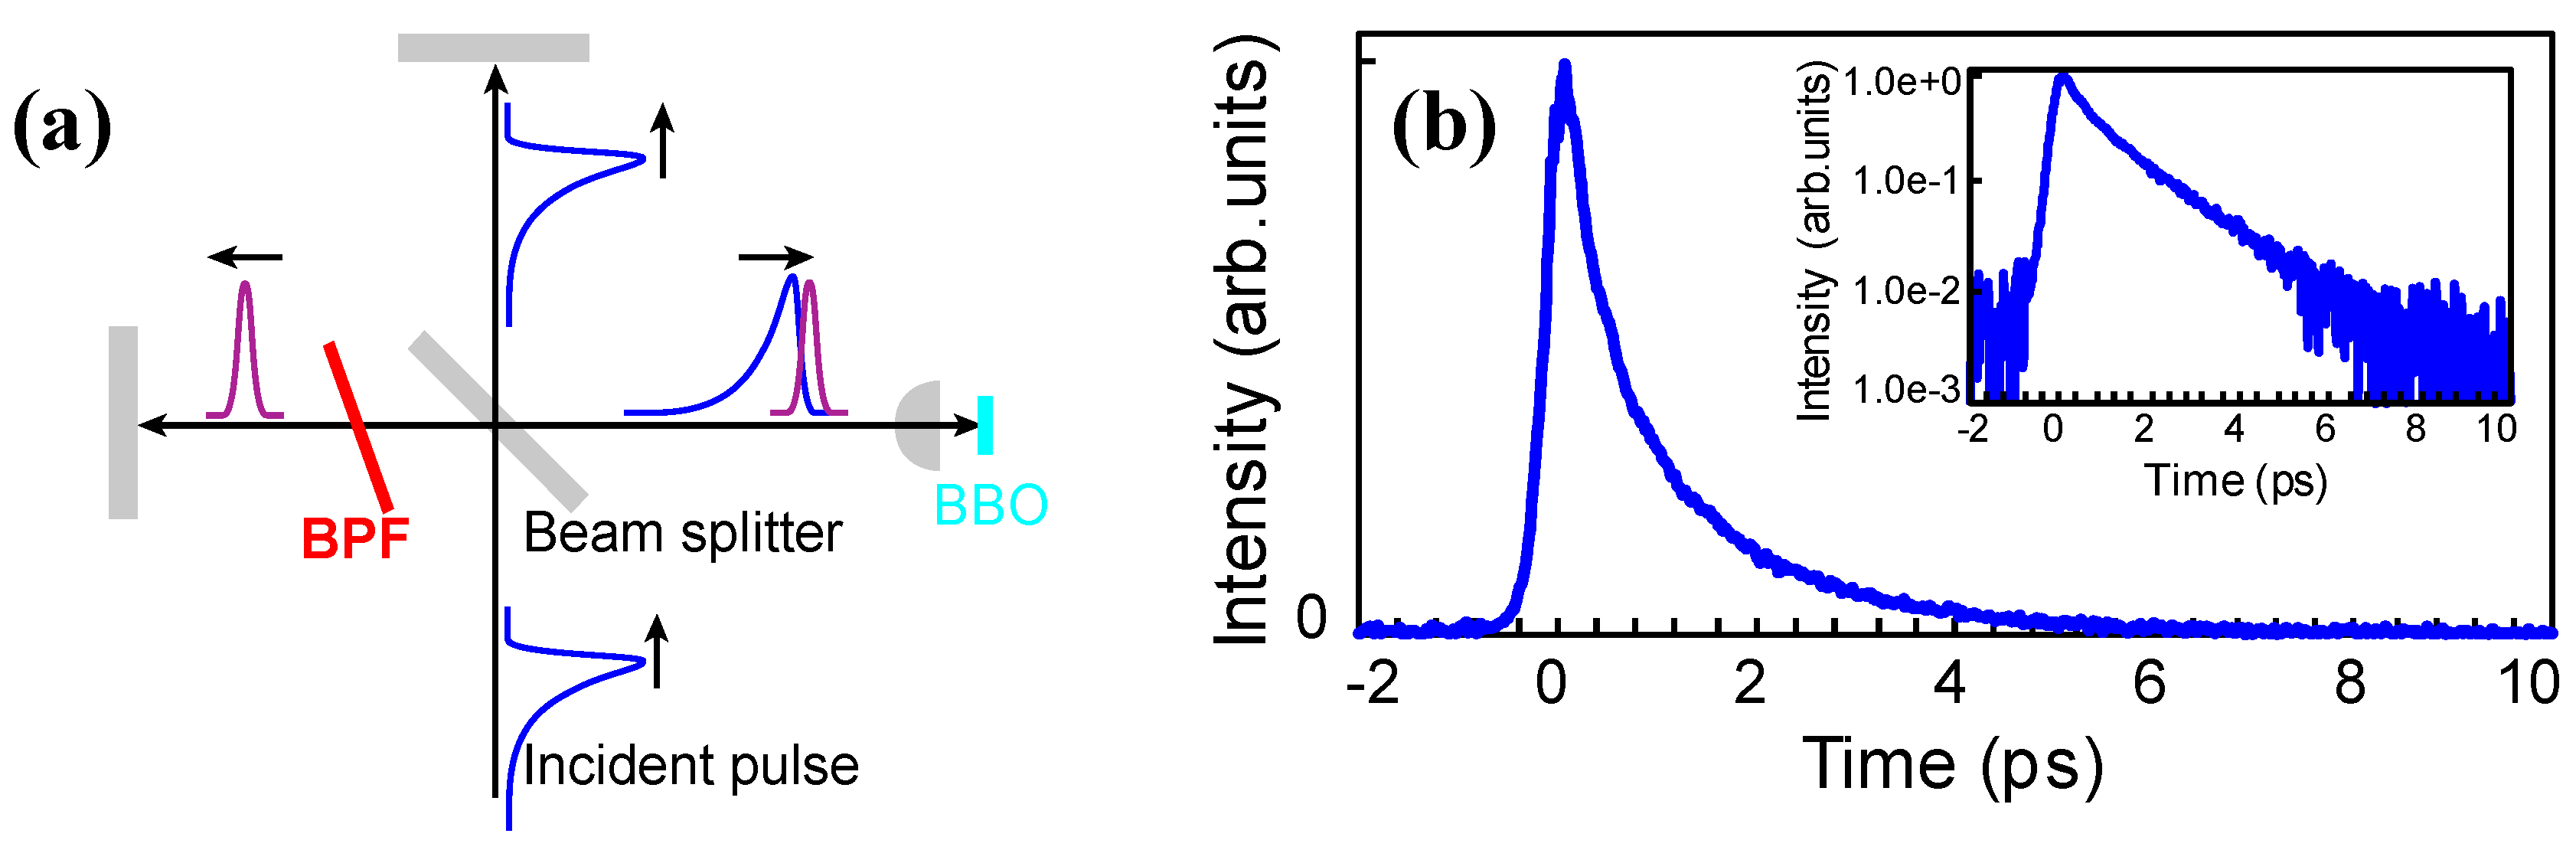
Figure 2b is highly asymmetric suggests that the pulse shape was asymmetric in time. However, the intensity autocorrelation measurement provides only a symmetric time trace. In order to investigate the pulse characteristics, we used a cross-correlation technique. Since the femtosecond optical pulses were obtained by extracting the short wavelength edge of the optical spectrum, we can obtain cross-correlation signals between the direct optical output from the MLLD and the femtosecond optical pulses by inserting a BPF into one of the arms of the Michelson interferometer in the intensity autocorrelation setup, as shown in
Figure 3a [
10].
Figure 3b shows an example of cross correlation of the output optical pulses. The leading edge of the optical pulse is as steep as a few hundred femtoseconds while the trailing edge shows exponential decay on a picosecond scale. This cross-correlation trace is consistent with the intensity autocorrelation trace without spectral filtering shown in
Figure 2a.
Figure 3.
(a) Schematic representation of cross-correlation measurement. BPF: Bandpass filter, BBO: β-BaB2O4 crystal; (b) Cross-correlation measurement trace. Inset: Cross-correlation trace in logarithmic intensity scale.
Figure 3.
(a) Schematic representation of cross-correlation measurement. BPF: Bandpass filter, BBO: β-BaB2O4 crystal; (b) Cross-correlation measurement trace. Inset: Cross-correlation trace in logarithmic intensity scale.
We carried out further cross-correlation measurements in order to determine the time delay between spectral components at different wavelengths. We inserted another BPF into the other interferometer arm for this purpose, as shown in
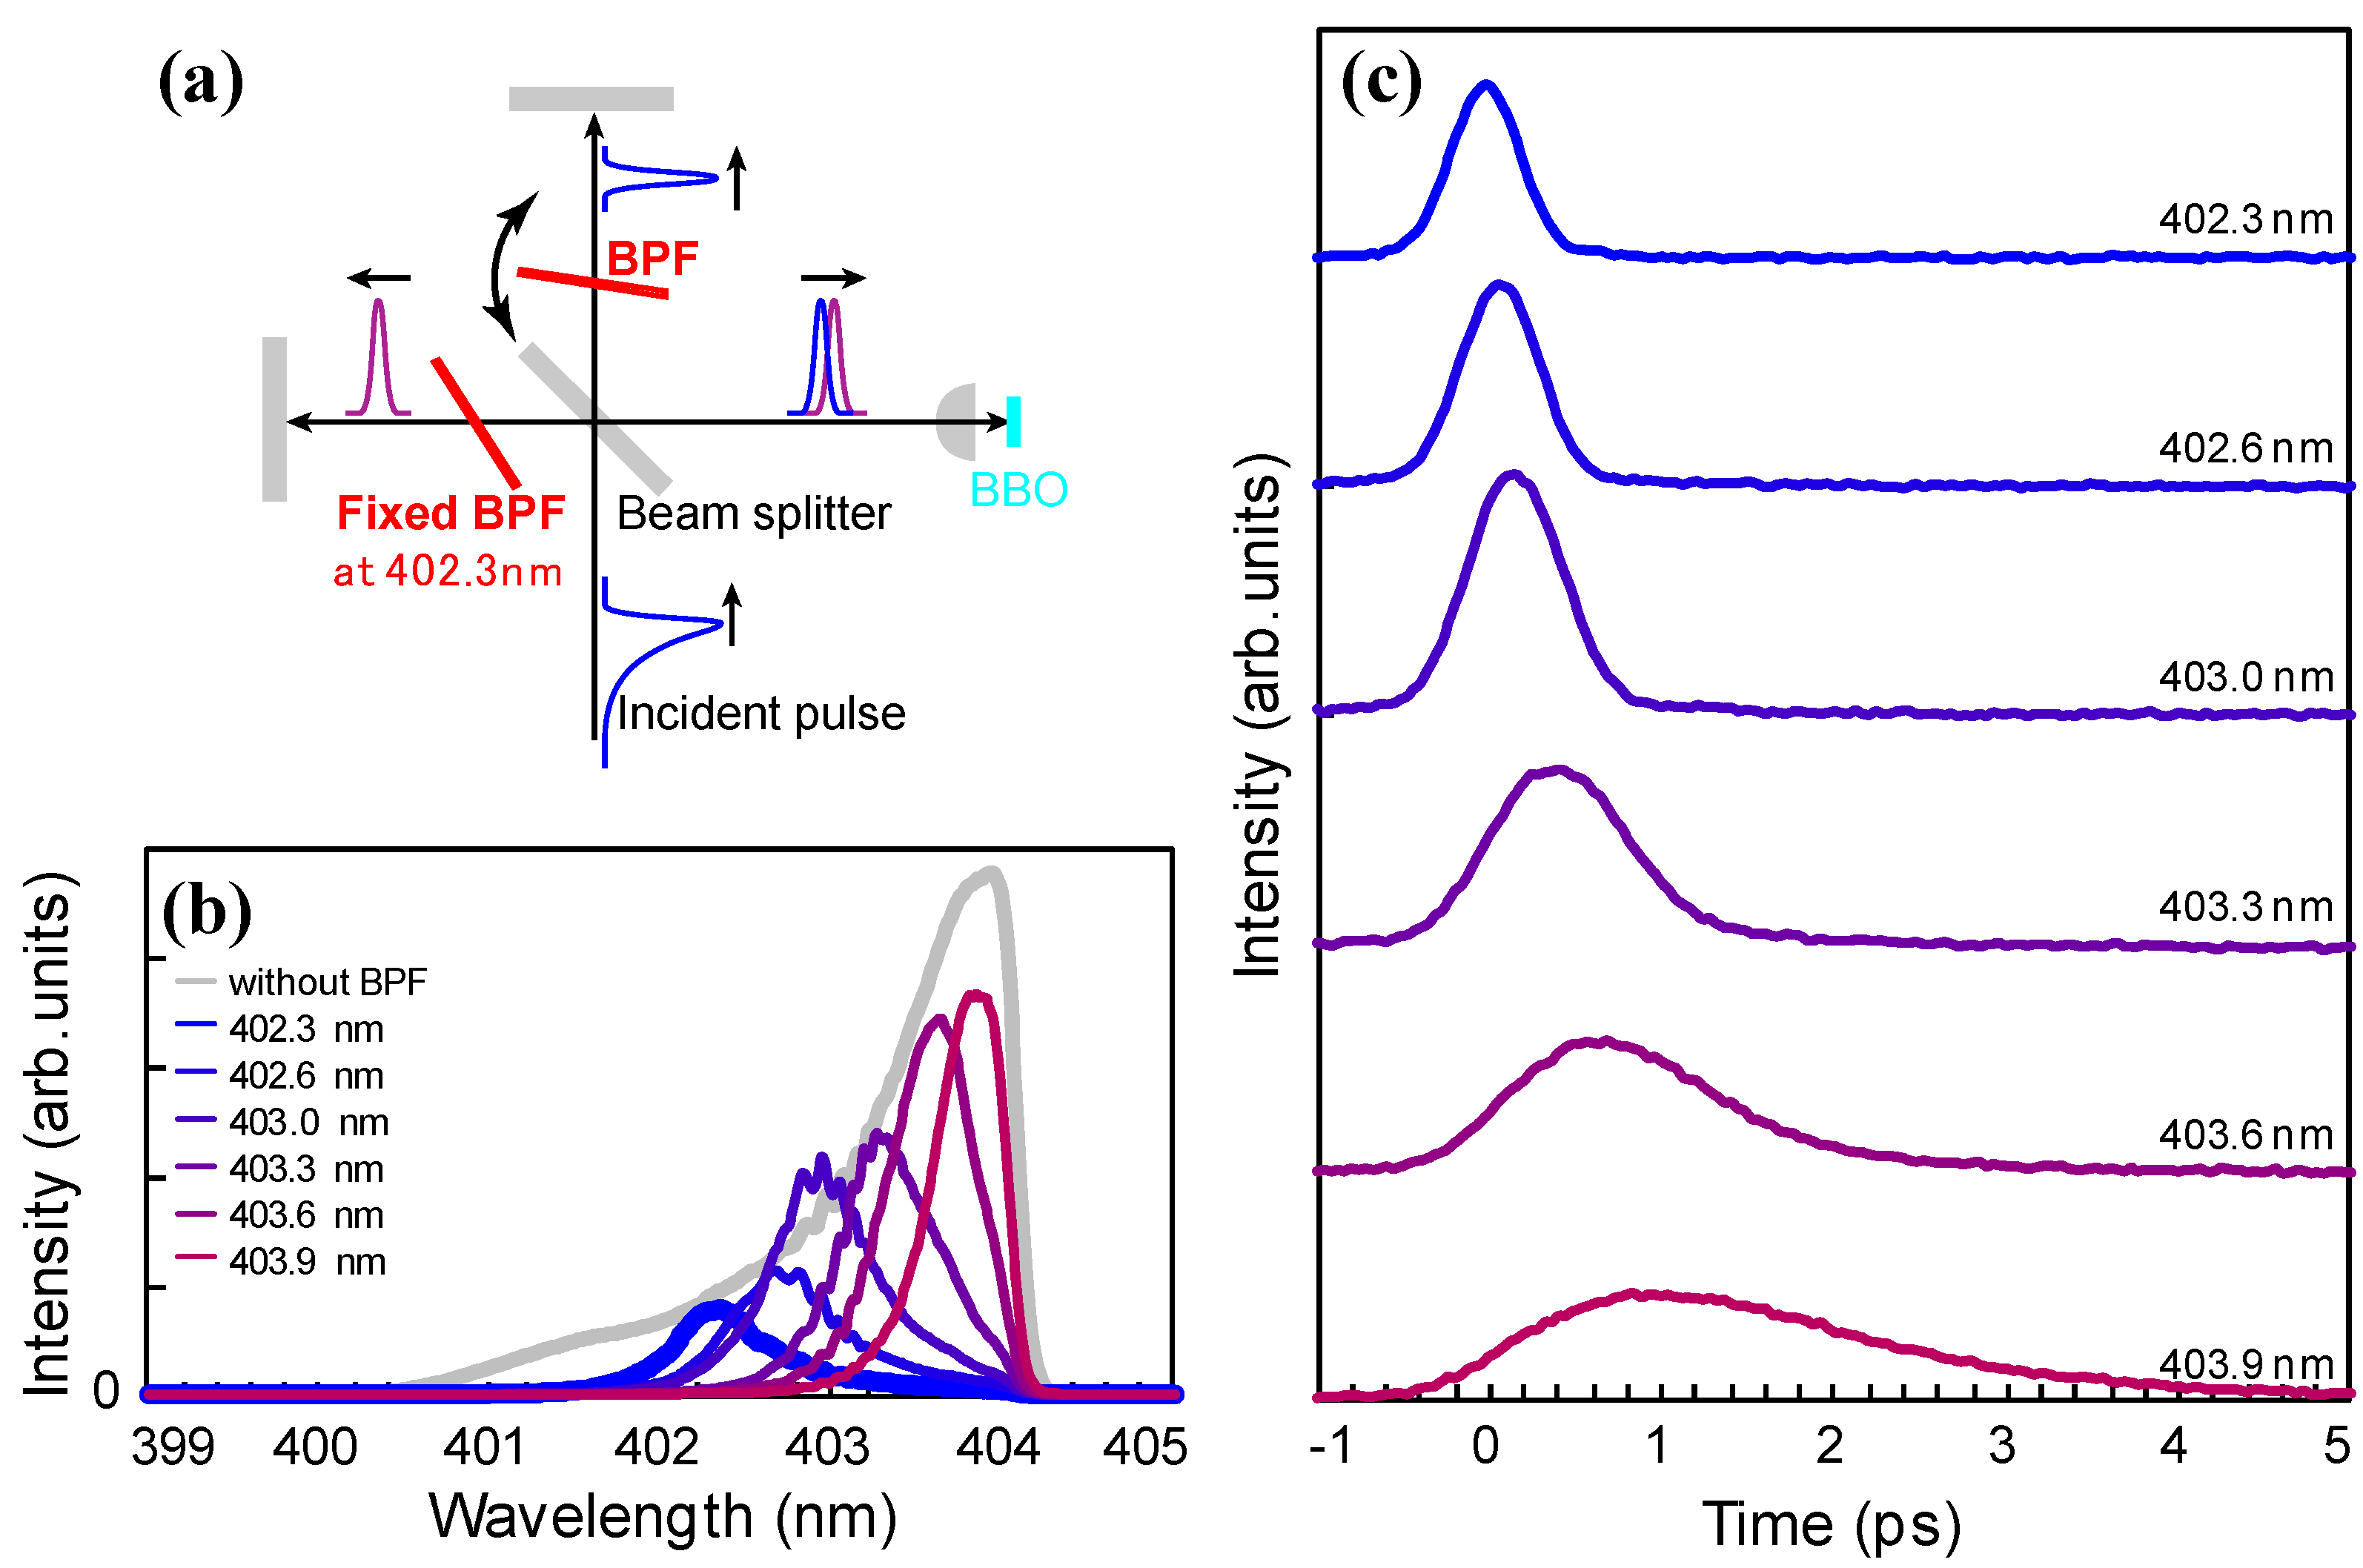
Figure 4a. The incidence angle for one BPF was fixed to pass a spectral component at a particular wavelength, whereas that for the other BPF was varied to extract spectral components at different wavelengths.
Figure 4b shows the spectral components used for the cross-correlation analysis. These spectra were measured by introducing the optical pulses before the β-BBO crystal into the optical spectrum analyzer.
Figure 4c shows the cross correlation between the spectral component at 402.3 nm and those at other wavelengths.
The peaks in the cross-correlation traces are seen to be more delayed and the traces become broader as the wavelength increases. The peak intensity of the traces slightly increases from 402.3 nm to 403.0 nm with the increase in the corresponding spectral components because the cross-correlation traces are not much broadened. For the spectral components longer than 403.3 nm, however, the peak intensity of the cross-correlation traces decreases despite the increase in the intensity of the corresponding spectral components. This is due to the broadening of the cross-correlation traces.
Figure 4.
(
a) Schematic representation of cross-correlation measurement setup to measure the correlation between spectral components at different wavelengths; (
b) Spectra for cross-correlation measurement. The thick blue trace is the spectrum after the fixed BPF. The additional traces are spectra after the other BPF at different transmission wavelength. The gray trace represents the entire spectrum before the BPF. The wavelength is different from
Figure 2b since the MLLD configuration is not the same; (
c) Cross-correlation signals between the fixed spectral component at 402.3 nm and other spectral components.
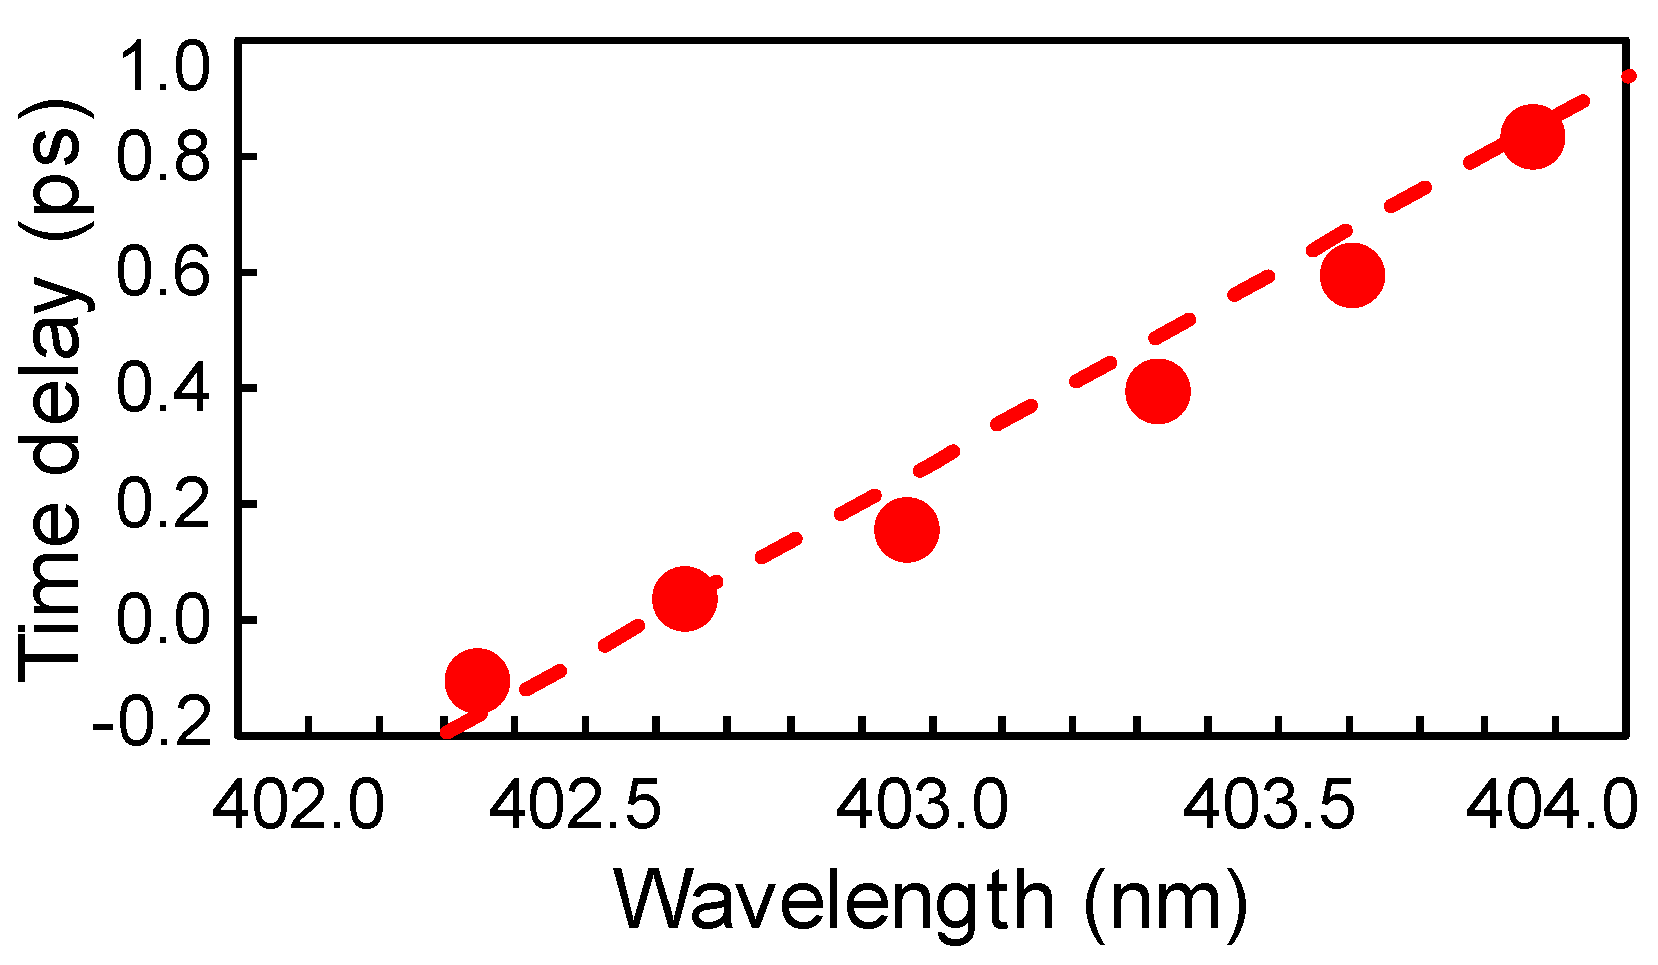
Figure 5 shows the time delay of the cross-correlation peaks as a function of the wavelength. The dashed line in the figure represents the group delay due to the intracavity dispersion-compensation optics. The time delay of the cross-correlation peaks is mainly determined by the intracavity GVD. Thus, the exponential decay of the trailing edge of the optical pulses can be attributed to the time delay and to pulse broadening of the spectral components at longer wavelengths.
Figure 5.
Delay between the spectral components measured in the cross-correlation signal shown in
Figure 4c as a function of the wavelength. The dashed line represents the time delay introduced by the intracavity dispersion-compensation optics.
Figure 5.
Delay between the spectral components measured in the cross-correlation signal shown in
Figure 4c as a function of the wavelength. The dashed line represents the time delay introduced by the intracavity dispersion-compensation optics.
3.3. Spectrally-Resolved Intensity Autocorrelation Measurements
The cross-correlation results show that the picosecond-order exponential decay of the optical pulses can be attributed to the group delay due to the dispersion compensation optics, and to pulse broadening. However, the broadening of the cross-correlation trace cannot be explained only by the effects of the dispersion-compensation optics. Thus, we measured intensity autocorrelations for different spectral components with a spectral bandwidth narrower than that in our previous report [
11].
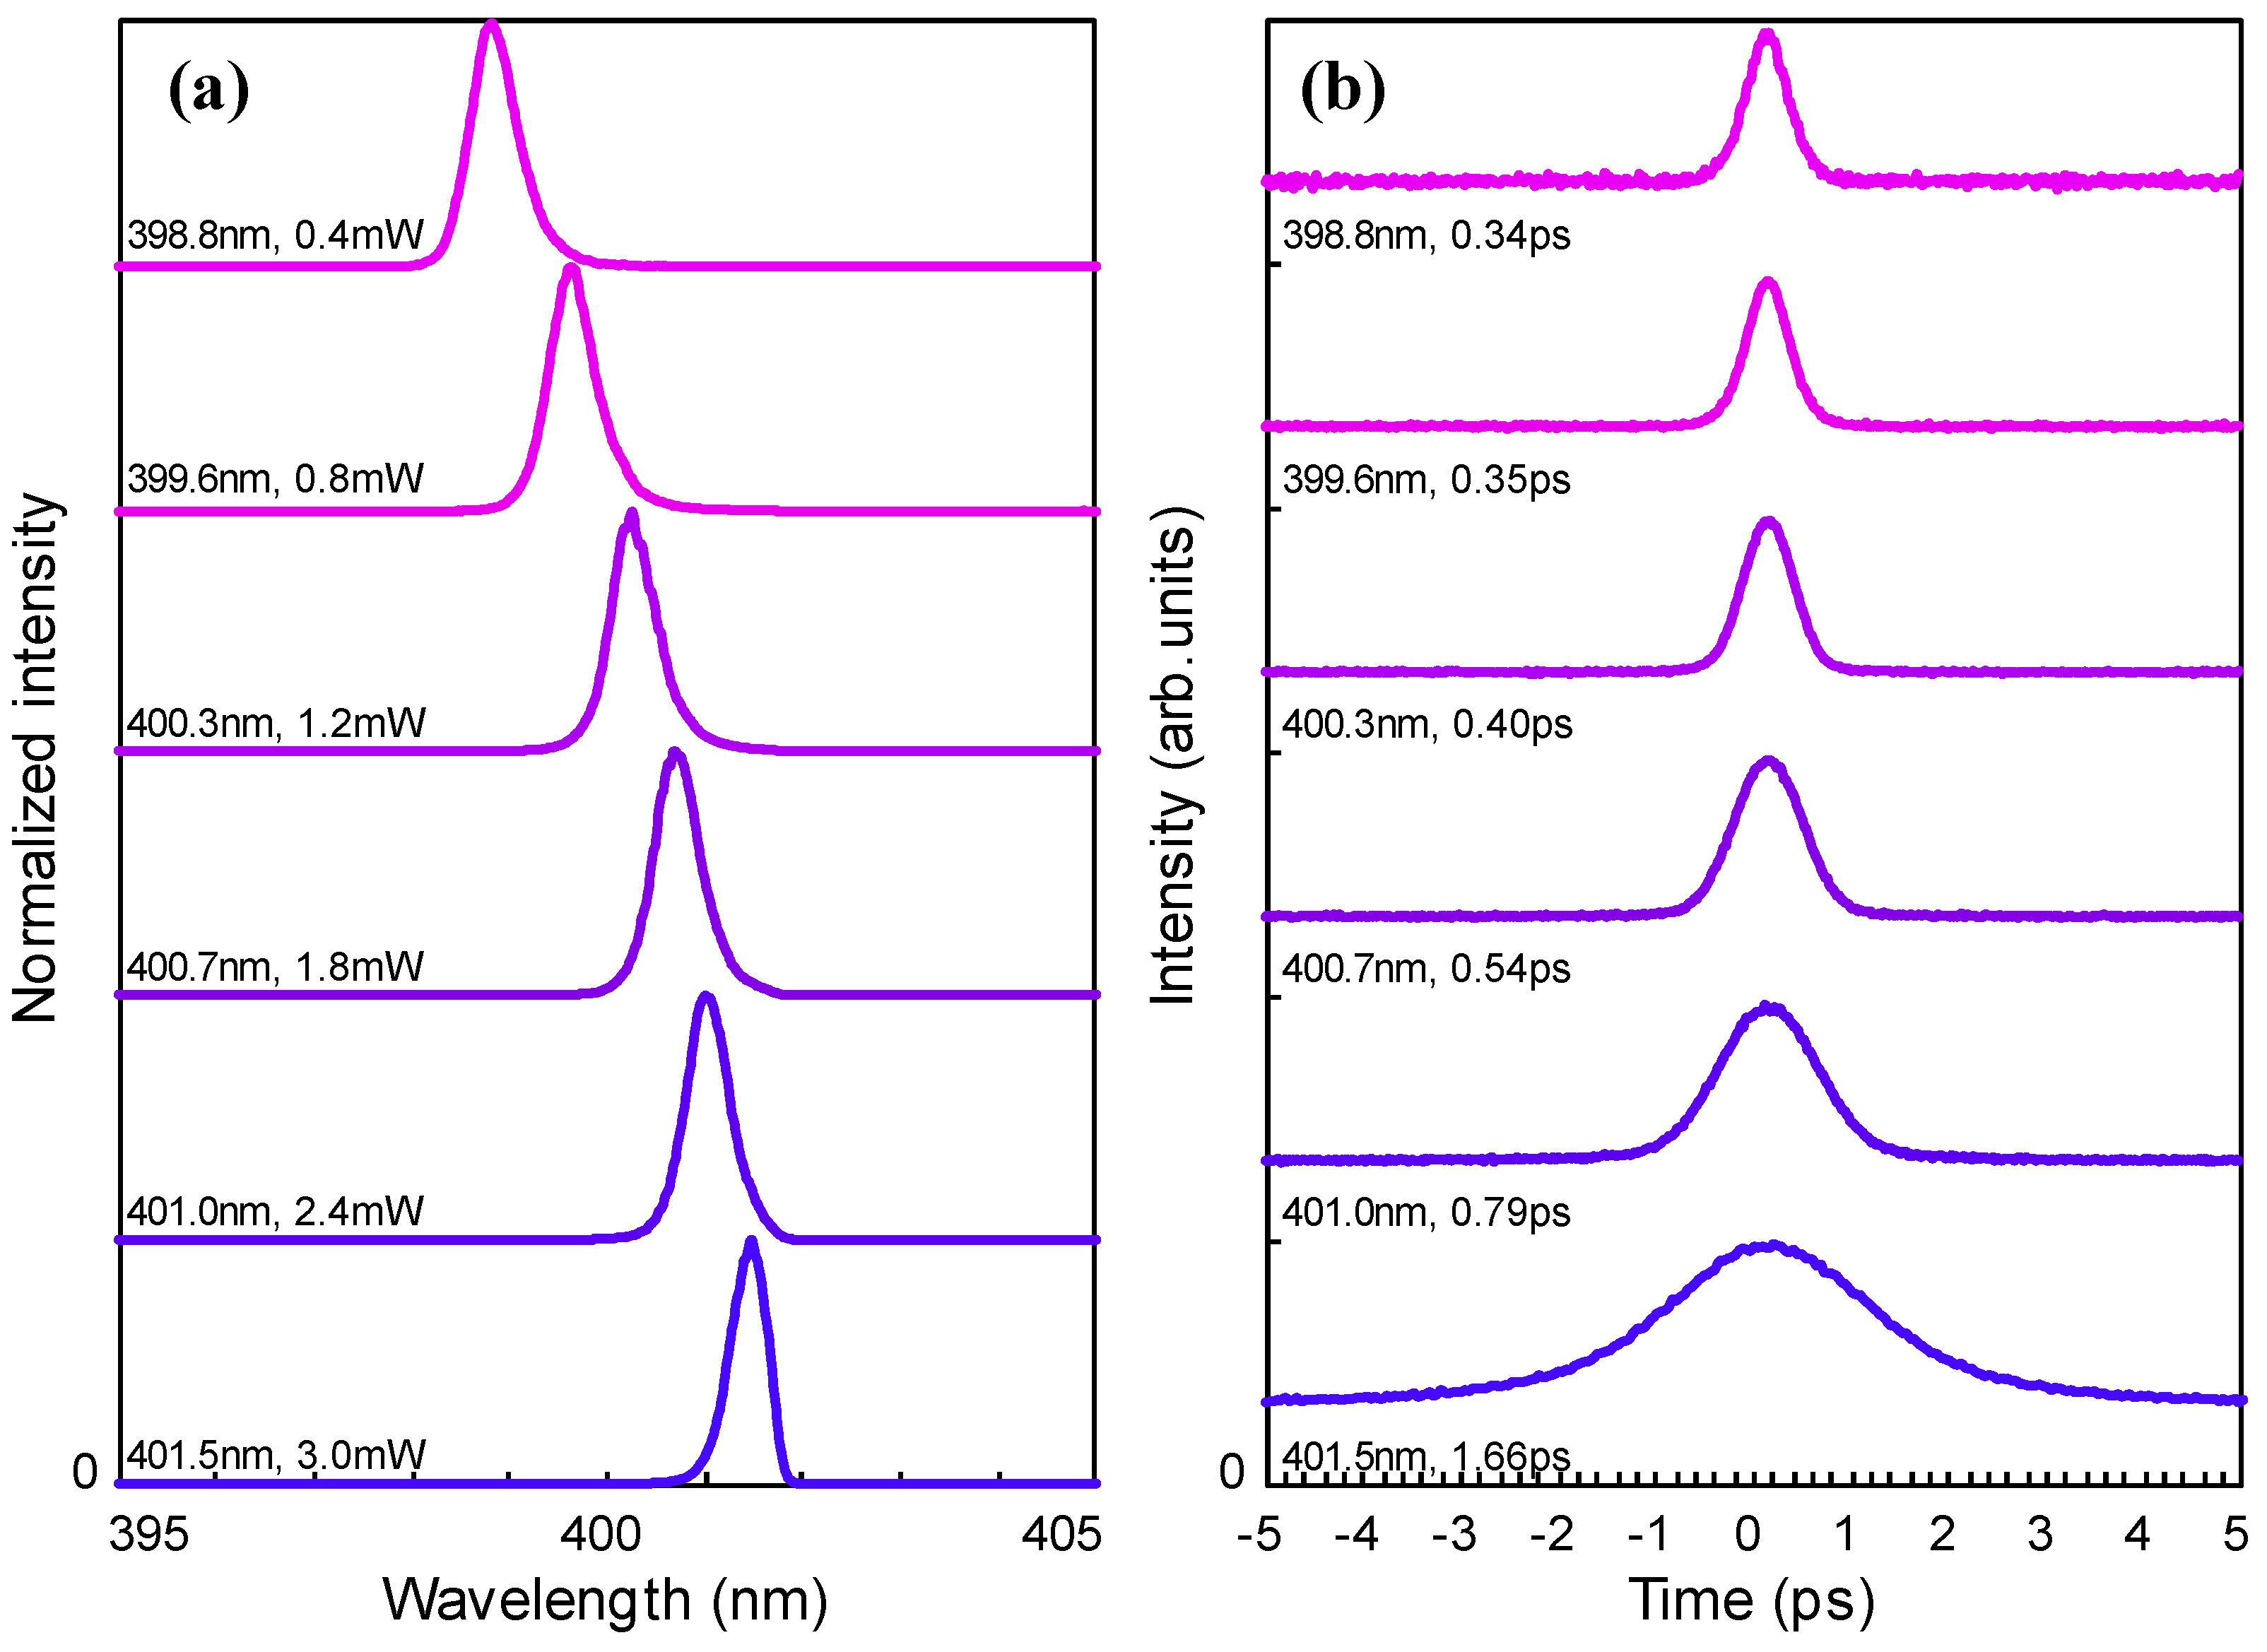
Figure 6 shows optical spectra measured after the BPF, where the different transmission wavelength was changed by varying the incidence angle. The figure also shows the corresponding autocorrelation traces. As the cross-correlation traces in
Figure 4c become broader with the increase in the wavelength, the pulse duration in
Figure 6b increases with increasing transmission wavelength. The typical peak power of the optical pulses after the BPF was about 1.2 W at 398.8 nm, 3.0 W at 400.3 nm and 3.0 W at 401.0 nm. The resulting time-bandwidth product is plotted in
Figure 7 as a function of wavelength. At wavelengths of about 399–400 nm, the time-bandwidth product is about 0.4, close to the Fourier-transform limited value, but it increases rapidly at wavelengths longer than 400 nm. The femtosecond optical pulses shown in
Figure 2a obtained by spectral filtering correspond to the spectral region with the minimum time-bandwidth products.
Figure 6.
(a) Spectral components after the BPF with different transmission wavelengths and average power after the BPF; (b) Intensity autocorrelation traces corresponding to the spectral components after the BPF with pulse durations assuming sech2 pulse shape.
Figure 6.
(a) Spectral components after the BPF with different transmission wavelengths and average power after the BPF; (b) Intensity autocorrelation traces corresponding to the spectral components after the BPF with pulse durations assuming sech2 pulse shape.
Figure 7.
Time-bandwidth product of the optical pulses shown in
Figure 6 as a function of the peak wavelength of the spectral components. Gray trace: the entire spectrum after the GaInN MLLD without the BPF.
Figure 7.
Time-bandwidth product of the optical pulses shown in
Figure 6 as a function of the peak wavelength of the spectral components. Gray trace: the entire spectrum after the GaInN MLLD without the BPF.
3.4. Discussions
The time-bandwidth products in
Figure 7 show that in the short wavelength region of the optical spectrum, there is a balance between optical nonlinearity and the negative intracavity GVD. In semiconductors, nonlinear optical effects are associated with photons with energies either below or above the band-gap energy. The former are instantaneous nonlinearities such as the Kerr effect. In semiconductor laser diodes, the cladding layers are transparent at the lasing wavelength so that the Kerr nonlinearity can occur. However, the nonlinear refractive index of GaN for photons with energies just below the band-gap energy has been reported to be large but negative [
16]. This is due to the large two-photon absorption coefficient for photons close to the band-gap energy [
17]. Therefore, a negative nonlinear refractive index is expected in the cladding layers, so that we consider that the instantaneous optical nonlinearity cannot balance the negative intracavity GVD in the GaInN MLLD.
The other type of optical nonlinearity to be considered is saturation in the GaInN BS-LD. In the SA and gain sections, saturation leads to the opposite sign of change in the refractive index. In the gain section, the refractive index increases with decreasing carrier density during pulse propagation. In contrast, in the SA section, the refractive index decreases as the absorption saturates [
18]. Because the frequency shift increases with the degree of absorption saturation [
19], this can balance the negative intracavity GVD. In the model of the saturation dynamics [
19], the nonzero phase-relaxation time of the SA, T
2, was not included assuming that pulse durations were longer than T
2. The carrier-carrier scattering time in GaN is reported to be less than 15 fs [
20], so that the saturation dynamics in the SA can be applied to explain the frequency shift. From
Figure 7, the width of the spectral region with the minimum time-bandwidth product is as large as about 2 THz. Since the absorption coefficient for the GaInN active layer has been reported to be larger than that for other semiconductors, the large frequency shift can be inherent to GaN-based materials [
12].
After the steep leading edge is formed, the gain saturation can mainly contribute to the trailing edge of the optical pulses. Since gain saturation is accompanied by carrier depletion, the refractive index increases. The temporal change in the gain is characterized by the carrier lifetime and the carrier depletion due to the stimulated emission [
21]. The optical pulses from the GaInN MLLD are considered to be much shorter than the sub-ns carrier lifetime, so that the trailing edge is formed by the spectral components that are red-shifted due to the gain saturation and are delayed due to the negative intracavity GVD. This can be a reason why the peak position in
Figure 5 follows the time delay of the dispersion compensation optics. Temporal-broadening of the spectral components is more significant at longer wavelengths, as shown in
Figure 6, due to the accumulation of these effects. This broadening behavior can also explain the asymmetric shape of the optical spectrum in
Figure 2b. The spectrally-resolved autocorrelation traces in
Figure 6 do not show coherence spikes, so the entire spectrum is coherent. This is consistent with the signal-to-noise ratio of greater than 60 dB for the RF spectrum shown in
Figure 4b of Reference [
10].
In our previous reports, we speculated that the femtosecond pulse generation mechanism involved soliton mode-locking, because the femtosecond optical pulses were produced by a GaInN MLLD with a negative intracavity GVD and an SA with slow absorption recovery [
10,
11]. Based on the above analysis, pulse formation in a dispersion-compensated GaInN MLLD can be explained in terms of the saturation dynamics of the gain and SA section in the GaInN BS-LD. Thus, a soliton-like pulse formation mechanism may be involved due to the upward frequency shift of the SA. Paschotta
et al. reported pulse formation due to soliton-like mode locking in an external-cavity surface-emitting semiconductor laser [
22]. They considered the positive intracavity dispersion and nonlinear changes in the refractive index of the gain medium and the SA. In the case of a GaInN MLLD, the pulse formation mechanism is similar, but absorption saturation can be the dominant cause of the frequency shift that balances the negative intracavity GVD. The large saturation effects in the SA and gain sections are associated with the high density of states in GaN-based semiconductors.

