Article

Imaging of Volume Phase Gratings in a Photosensitive Polymer, Recorded in Transmission and Reflection Geometry

1
Technische Universität Berlin, Strasse des 17. Juni 135, 10623 Berlin, Germany
2
Pankstrasse 12, 13127 Berlin, Germany
*
Author to whom correspondence should be addressed.
Appl. Sci. 2014, 4(1), 19-27; https://doi.org/10.3390/app4010019
Submission received: 30 November 2013 / Revised: 15 January 2014 / Accepted: 24 January 2014 / Published: 20 February 2014
(This article belongs to the Special Issue Optical Memory)

Abstract

:
Volume phase gratings, recorded in a photosensitive polymer by two-beam interference exposure, are studied by means of optical microscopy. Transmission gratings and reflection gratings, with periods in the order of 10 μm down to 130 nm, were investigated. Mapping of holograms by means of imaging in sectional view is introduced to study reflection-type gratings, evading the resolution limit of classical optical microscopy. In addition, this technique is applied to examine so-called parasitic gratings, arising from interference from the incident reference beam and the reflected signal beam. The appearance and possible avoidance of such unintentionally recorded secondary structures is discussed.

Graphical Abstract

1. Introduction

Photosensitive polymers are highly attractive media for photonic applications, such as holographic memory, 3D imaging and waveguides [1,2,3,4,5], as well as for future applications in optical sensing, for photonic circuits and integrated optics [5,6,7,8]. The underlying mechanism of hologram formation in polymers is attributed to a photo-induced change of the refractive index [9,10].
Due to the great demand for advanced systems, many efforts are made to characterize and optimize functionally tailored material systems, as well as respective recording techniques [9,10,11,12,13]. With regard to a descriptive representation of spatial characteristics, this particularly applies to the visual depiction of recorded sub-micrometer structures. However, imaging of volume phase gratings poses a considerable challenge with respect to image contrast and resolution [7]. On the one hand this can be traced back to the small refractive index contrast to be depicted, which is typically in the order of 10−3 [10,14]. On the other hand it is of course attributed to the small size of the micro- and nanostructures.
In general, the choice of methods for imaging is determined by the specific property which is contributing to the contrast of the image. This is, in the case of volume phase gratings, assigned to the characteristic physico-chemical feature, constituting the grating by means of a periodic modulation. In addition, the dimension, orientation and geometry of the structure are connected with geometry and resolution of the imaging technique. In view of the significance of the imaging task, the pros and cons of possible techniques, such as optical microscopy, electron microscopy and atomic force microscopy, must be considered. Special forms of light microscopy, such as confocal laser scanning, have been applied, in which the signal contrast is assumedly attributed to the remaining fluorescence of the photoinitiation system [15]. In this context, it must be stressed that it is usually inappropriate to apply fluorescent or dyes as contrast agents to achieve higher image contrast in low-contrast volume hologram scenes. The reason for this is that agglomeration of the contrast media along the grating planes, e.g., by means of diffusion, is prerequisite to achieve the desired effect, which cannot be ensured. But to achieve contrast in electron microscopy, conductive species are necessarily required, such as in the case of incorporated nanoparticles [14,16]. As a consequence, transmission electron microscopy (TEM) is used to evaluate the degree of nanoparticle assembly [11,14,17]. Scanning force microscopy (SFM) may be applied additionally, to map surface modulations [13,14]. Nanocomposite materials are also the subject of investigations by luminescence microscopy [11]. However, mapping of nanoparticles yields only a limited description of lattice structures, not necessarily identical with the phase grating of interest, which is linked to the diffractive properties. In fact, it has been demonstrated that photoinsensitive nanoparticles experience counterdiffusion during grating buildup [18]. Finally, the imaging task is becoming increasingly complex without conductive species and a fortiori taking account of the three-dimensionality of volume phase gratings. However, it is the third dimension in particular to which the specific applicability of volume holograms can be attributed [19,20].
Obviously, imaging of phase gratings becomes more difficult, the smaller the amplitude and the period of the associated refractive index profile, which is generally the case for reflection gratings, especially in the presence of so-called parasitic gratings. The designation parasitic grating refers to structures recorded unintentionally, which result in a reduction of the dynamic range and are therefore undesirable. However, in view of the etymological origin of the term parasitic (from Greek παρά- (para) “beside, by” and σῖτος (sitos) “wheat, feeding”) this is misleading. In order to objectify the designation, providing an unambiguous allocation, we propose the term secondary gratings instead. Without judging in terms of purpose, this designation refers to the chronological order of grating formation or, more precisely, to the successive initiation, and will be used within this paper. Hereby two different types of secondary gratings must be differentiated. On the one hand, noise gratings, arising from scattered light interfering with the incident beams [14]. On the other hand, secondary gratings of inverse recording geometry, diffracting a part of the probing light into a characteristic direction [19]. To differentiate such characteristic secondary gratings from noise gratings, we use the term uni-directional secondary gratings, providing an additional description in view of the diffractive properties, as opposed to the multi-directional propagation of waves in case of noise gratings.
In this paper we show microscopic images of transmission and reflection gratings as well as of uni-directional secondary gratings. Several possibilities are discussed as to how to avoid secondary gratings. Techniques are presented on how to analyze respective structures with regard to the spatial characteristics in the sub-micrometer range.

2. Experimental Section

Two-beam interference exposure was applied to generate one-dimensional volume phase gratings in photosensitive polymer. Free-surface epoxy-based polymer samples are used, provided by micro resist technology [7]. Thickness of the photosensitive layer is 200 μm. Collimated recording beams (λ = 405 nm) are s-polarized and 2 mm in diameter. For further details on the recording process and the specific material characteristics see [7,10]. The angle between reference and signal beam (Θ) determines the grating period Λ according to Equation (1), where n is the refractive index of the recording media.
Applsci 04 00019 i001
Either transmission or reflection type gratings are generated, depending on the orientation of the polymer sample relative to the recording beams. This is illustrated in Figure 1. Figure 1 also takes into account uni-directional secondary gratings, generated as a consequence of interference between the reference wave and the reflected signal wave.
Figure 1. Recording geometries for transmission grating (TG) and reflection grating (RG). Wave vectors of reference wave (R) and signal wave (S) are displayed. The reflected signal wave (S') forms a secondary grating (RG') by interference with the reference wave.
Applsci 04 00019 g001
Microscopic imaging is accomplished via classical optical microscopy (at ZELMI, Berlin Institute of Technology, Germany). In spite of the resolution limit of conventional optical microscopy, which does not allow resolving structures in the sub micrometer range, imaging of reflection gratings is nevertheless accomplished. For this purpose, imaging in sectional view was implemented, which takes advantage of the fact, that the reflection grating planes are nearly parallel to the focus plane of the microscope. Figure 2 illustrates the principle of imaging in sectional view. In general, i.e., unless perfect normal incidence of reference as well as signal beam is guaranteed, the reflection grating planes are tilted slightly relative to the sample surface. As a result, a sectional grating appears in the image plane. The slant angle φ determines the period of the sectional grating Λs according to Equation (2).
Applsci 04 00019 i002
Figure 2. Schematic diagram of imaging in sectional view. Tilted reflection-type grating with period Λ appears in the image plane as sectional grating with periodicity Λs.
Applsci 04 00019 g002

3. Results and Discussion

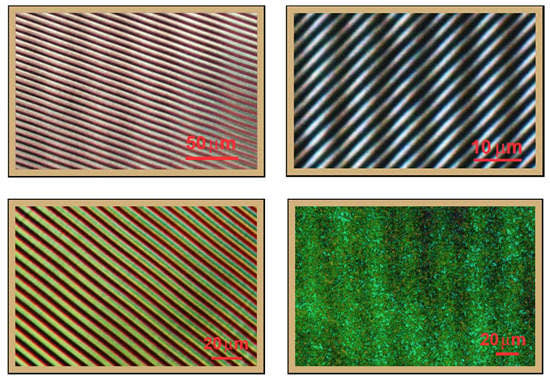
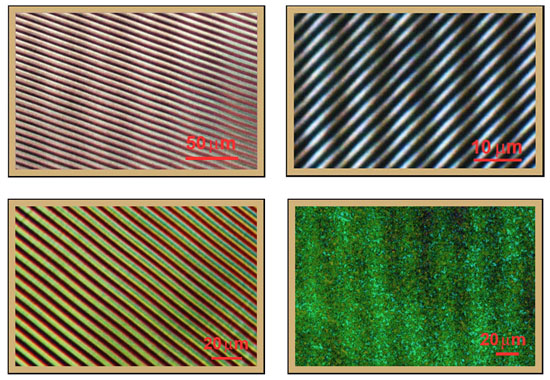
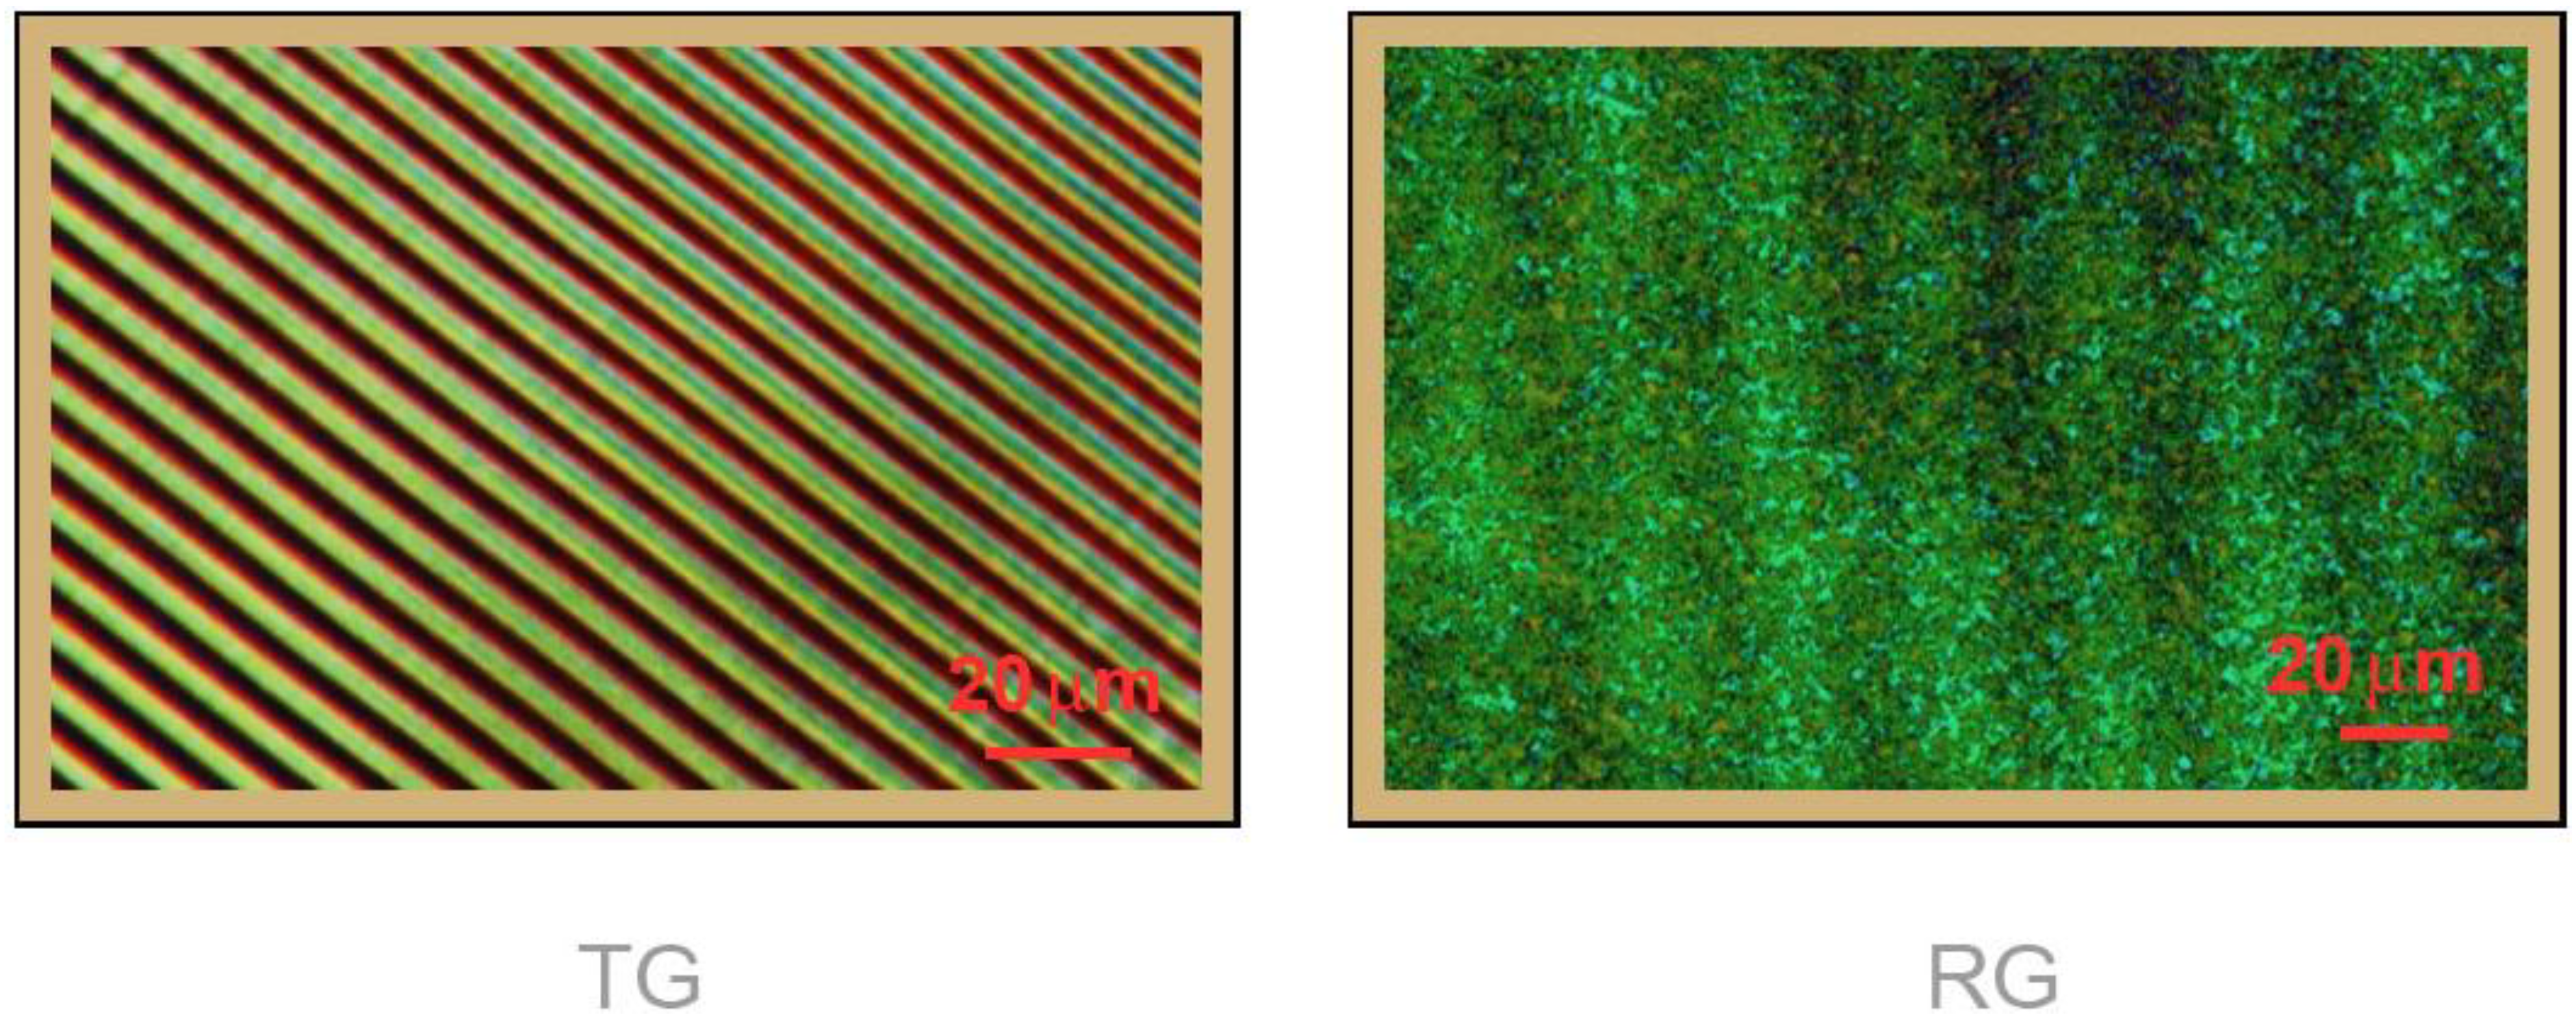
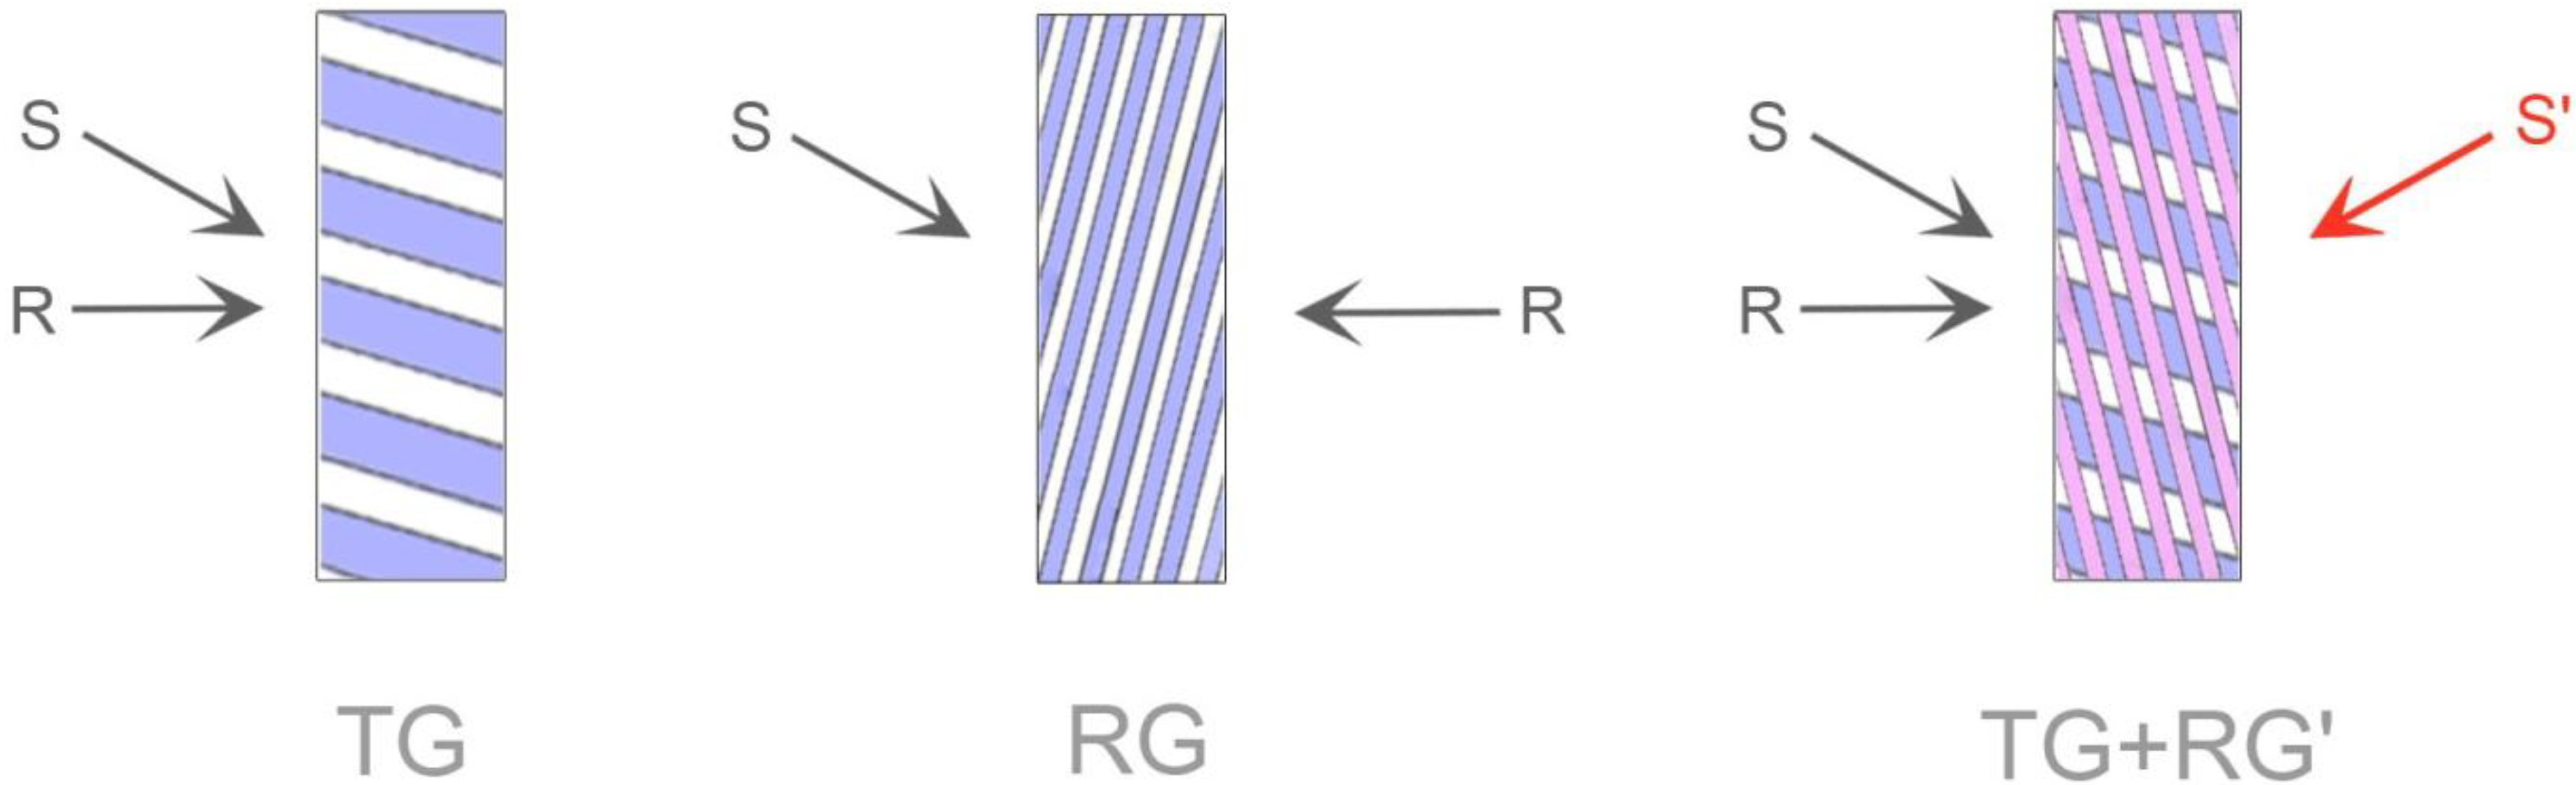
3.1. Secondary Reflection Gratings in Transmission Recording Geometry

The appearance of secondary gratings is determined by several intrinsic, as well as extrinsic factors or rather by material specific properties as well as recording parameters. Starting point for estimation in general is the visibility V of the interference pattern, inducing the modulated change of the refractive index,
Applsci 04 00019 i003
in which IR and IS are the intensities of reference and signal wave. A high visibility is accompanied by optimal interference contrast and consequently ensures ideal conditions for grating formation. This is the case if V = 1, i.e., in the event of equal intensities of reference and signal beam. In the particular case of uni-directional secondary gratings (e.g., RG' in Figure 1) IR refers to the intensity of the recording beam and IS’ is determined by the reflectance r of the back surface of the sample, which can be calculated by Fresnel’s formula. In general the reflected wave is much weaker than the incident wave (IS' << IR). This results in low visibility V and consequently unfavorable conditions for hologram generation. Nevertheless, secondary gratings can be observed and are shown in Figure 3.
Figure 3. Microscopic images of transmission gratings (diagonal lines) and secondary reflection gratings (vertical lines) for different recording geometries. Transmission grating periods Λ are 7.6 μm (left side) and 2.3 μm (right side) and sectional grating periods Λs are 42 μm (left side) and 9 μm (right side), respectively.
Applsci 04 00019 g003

3.2. The Avoidance of Secondary Gratings

There are several possibilities to avoid the appearance of secondary gratings. The most generic approach is to use antireflection coating on the substrate to attenuate reflection of the recording waves. A more sophisticated way exploits the correlation between recording geometry and grating period, described by Equation (1). Accordingly the grating period Λ converges to infinity if the angle between the recording beams is approaching zero. As a consequence, no secondary transmission grating should arise in case of symmetric exposure geometry. As can be seen from Figure 1 this technique cannot be applied to avoid parasitic reflection gratings. Even in case of a perfectly unslanted transmission grating secondary reflection gratings may arise, namely with the smallest possible period Λ = 130 nm. Another possibility to avoid secondary transmission gratings is to apply a single beam exposure. In this case the incident beam forms a reflection grating with its own reflection. This technique was applied in case of the reflection grating shown in Figure 4 (right side). In this event the grating period is determined by the incidence angle of the recording beam only. According to the suboptimal visibility of the interference pattern (see Equation (3)) false-color display was used to improve the visibility of the grating in the microscopic image.
The possibilities mentioned above particularly apply to uni-directional secondary gratings and are expected to show only little effect on noise gratings. Caused by scattered light, such multi-directional secondary gratings may only be affected by means of addressing the material response. A corresponding approach is to apply short exposure time. A minimum deposited energy density is needed to trigger material response [7]. If the scattered or reflected waves, potentially forming secondary gratings, exhibit sufficiently low intensity the corresponding exposure dose falls short of the threshold. This connection is capable to explain the observation that secondary gratings do not appear if the exposure is stopped at an early stage [19]. The transmission grating without secondary reflection grating, shown in Figure 4 (left side), likewise corresponds to a small exposure dose (200 mJ/cm²).
Figure 4. Microscopic images (false-color display) of transmission grating (TG) and reflection grating (RG) without secondary gratings. Grating periods are Λ = 7 μm (TG) and Λs = 32 μm (RG), respectively.
Applsci 04 00019 g004
To take full advantage of the correlation described by Equation (2), two of the parameters {Λ, Λs, φ} are required, yielding a complete description of the spatial hologram characteristics. In case of the single beam exposure discussed above, Λs = 32 μm was read from the image (Figure 4, right). This corresponds to Λ = 130 nm and a slant angle of φ = 0.25°. However, in the more general case of two-beam exposure the determination of the respective slant angle appears to be less trivial.

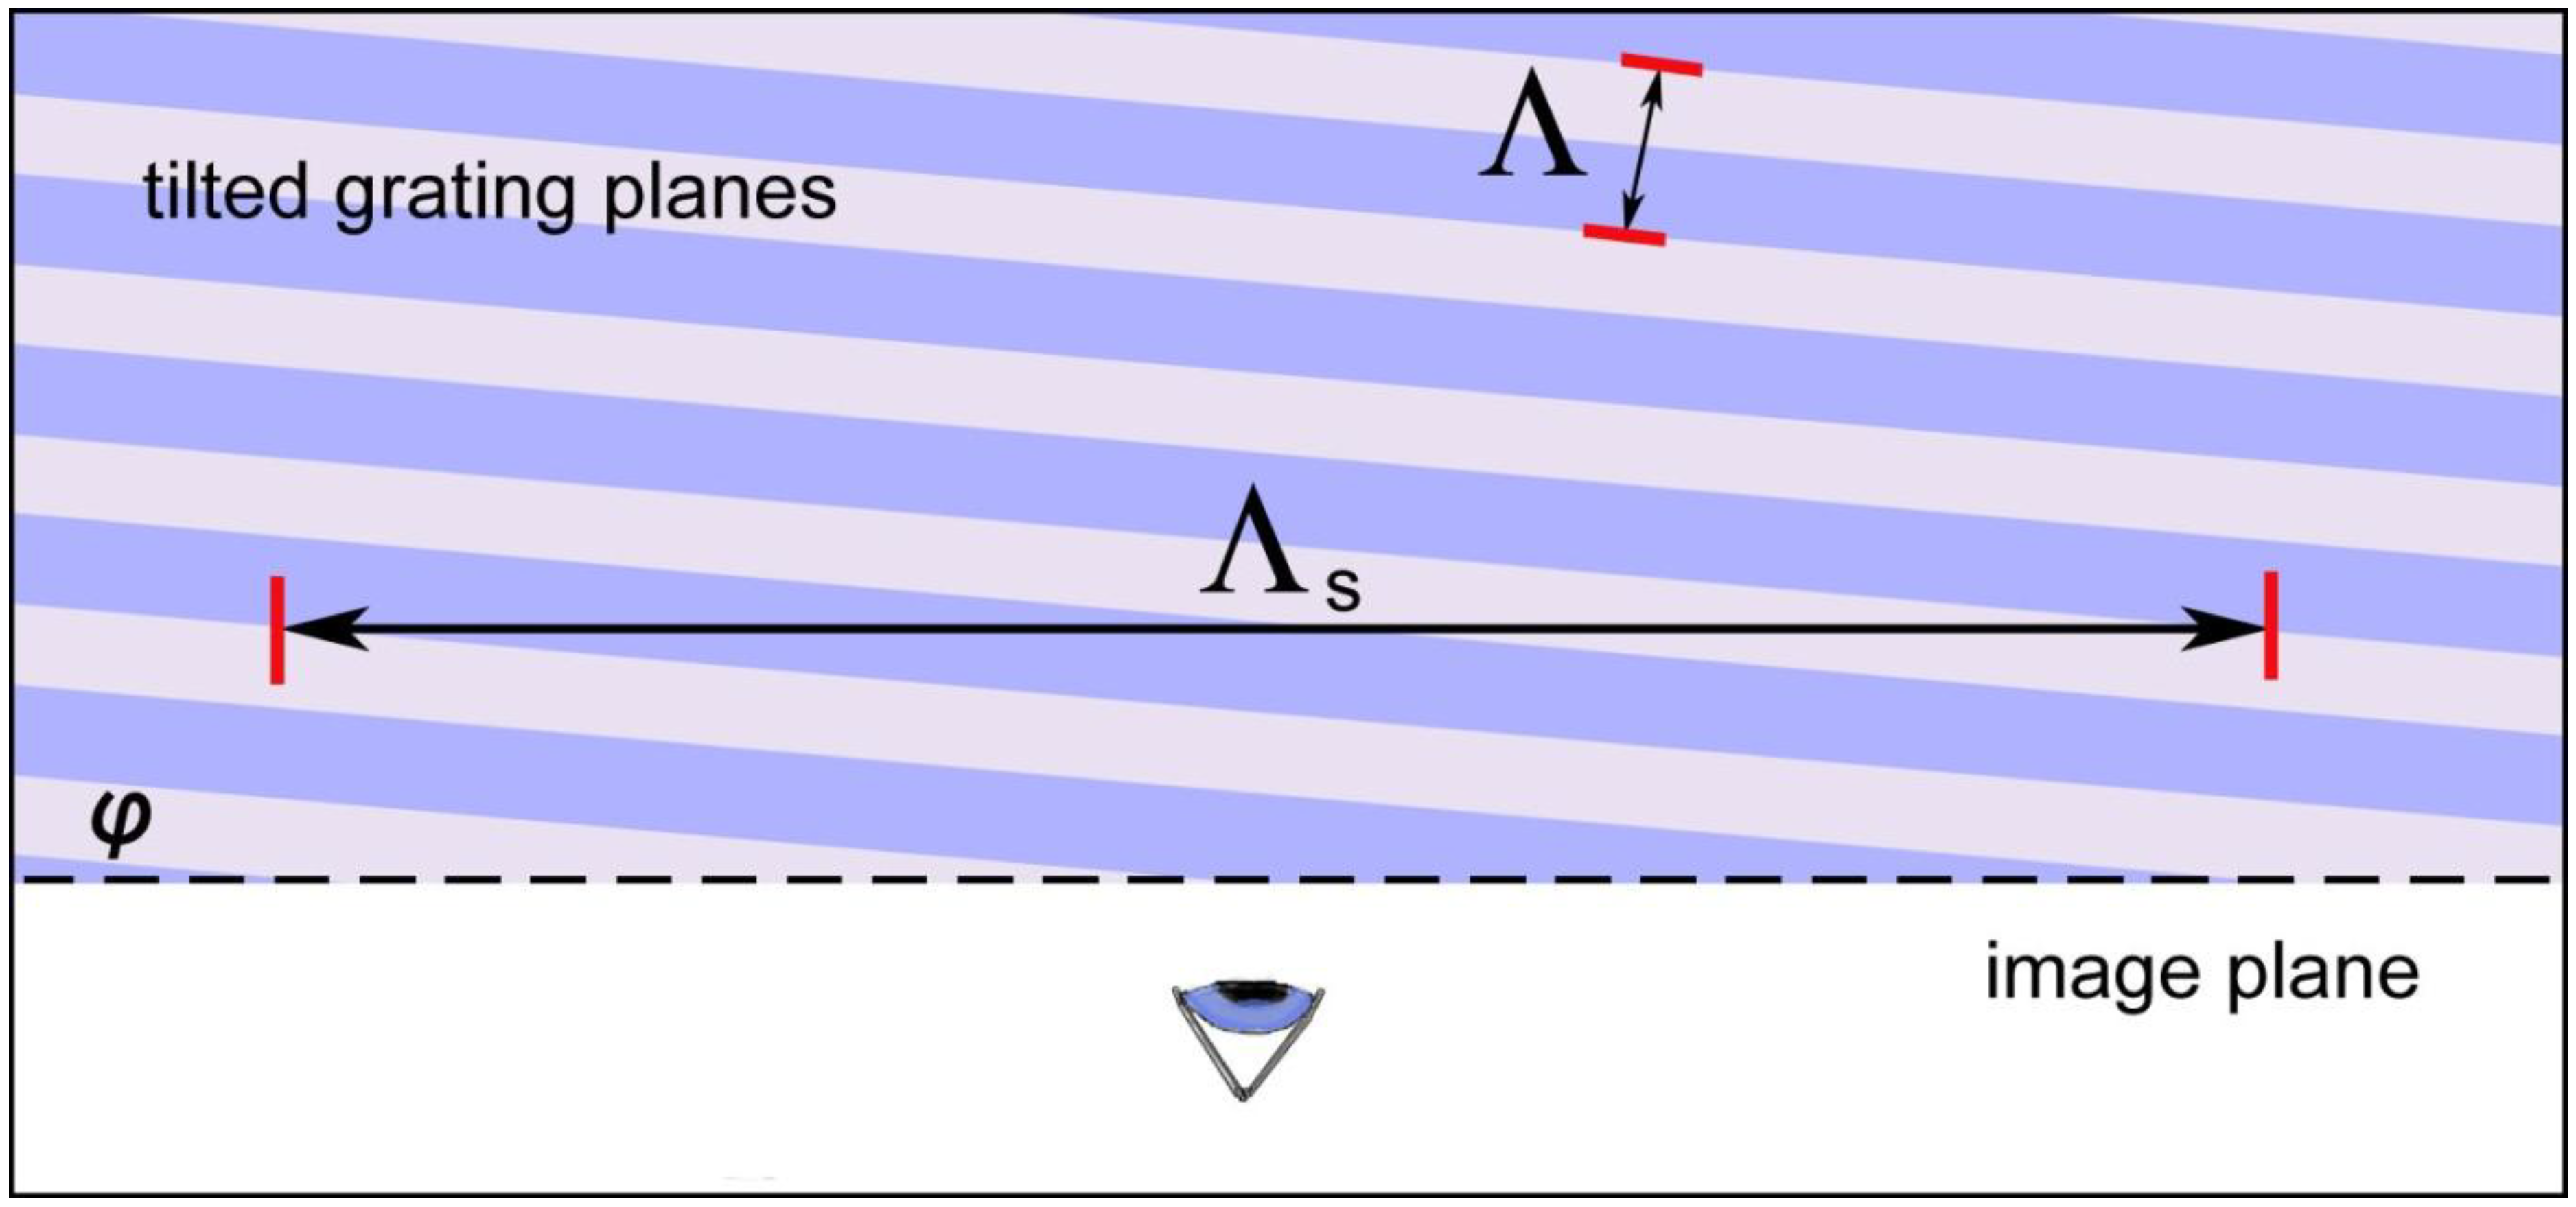
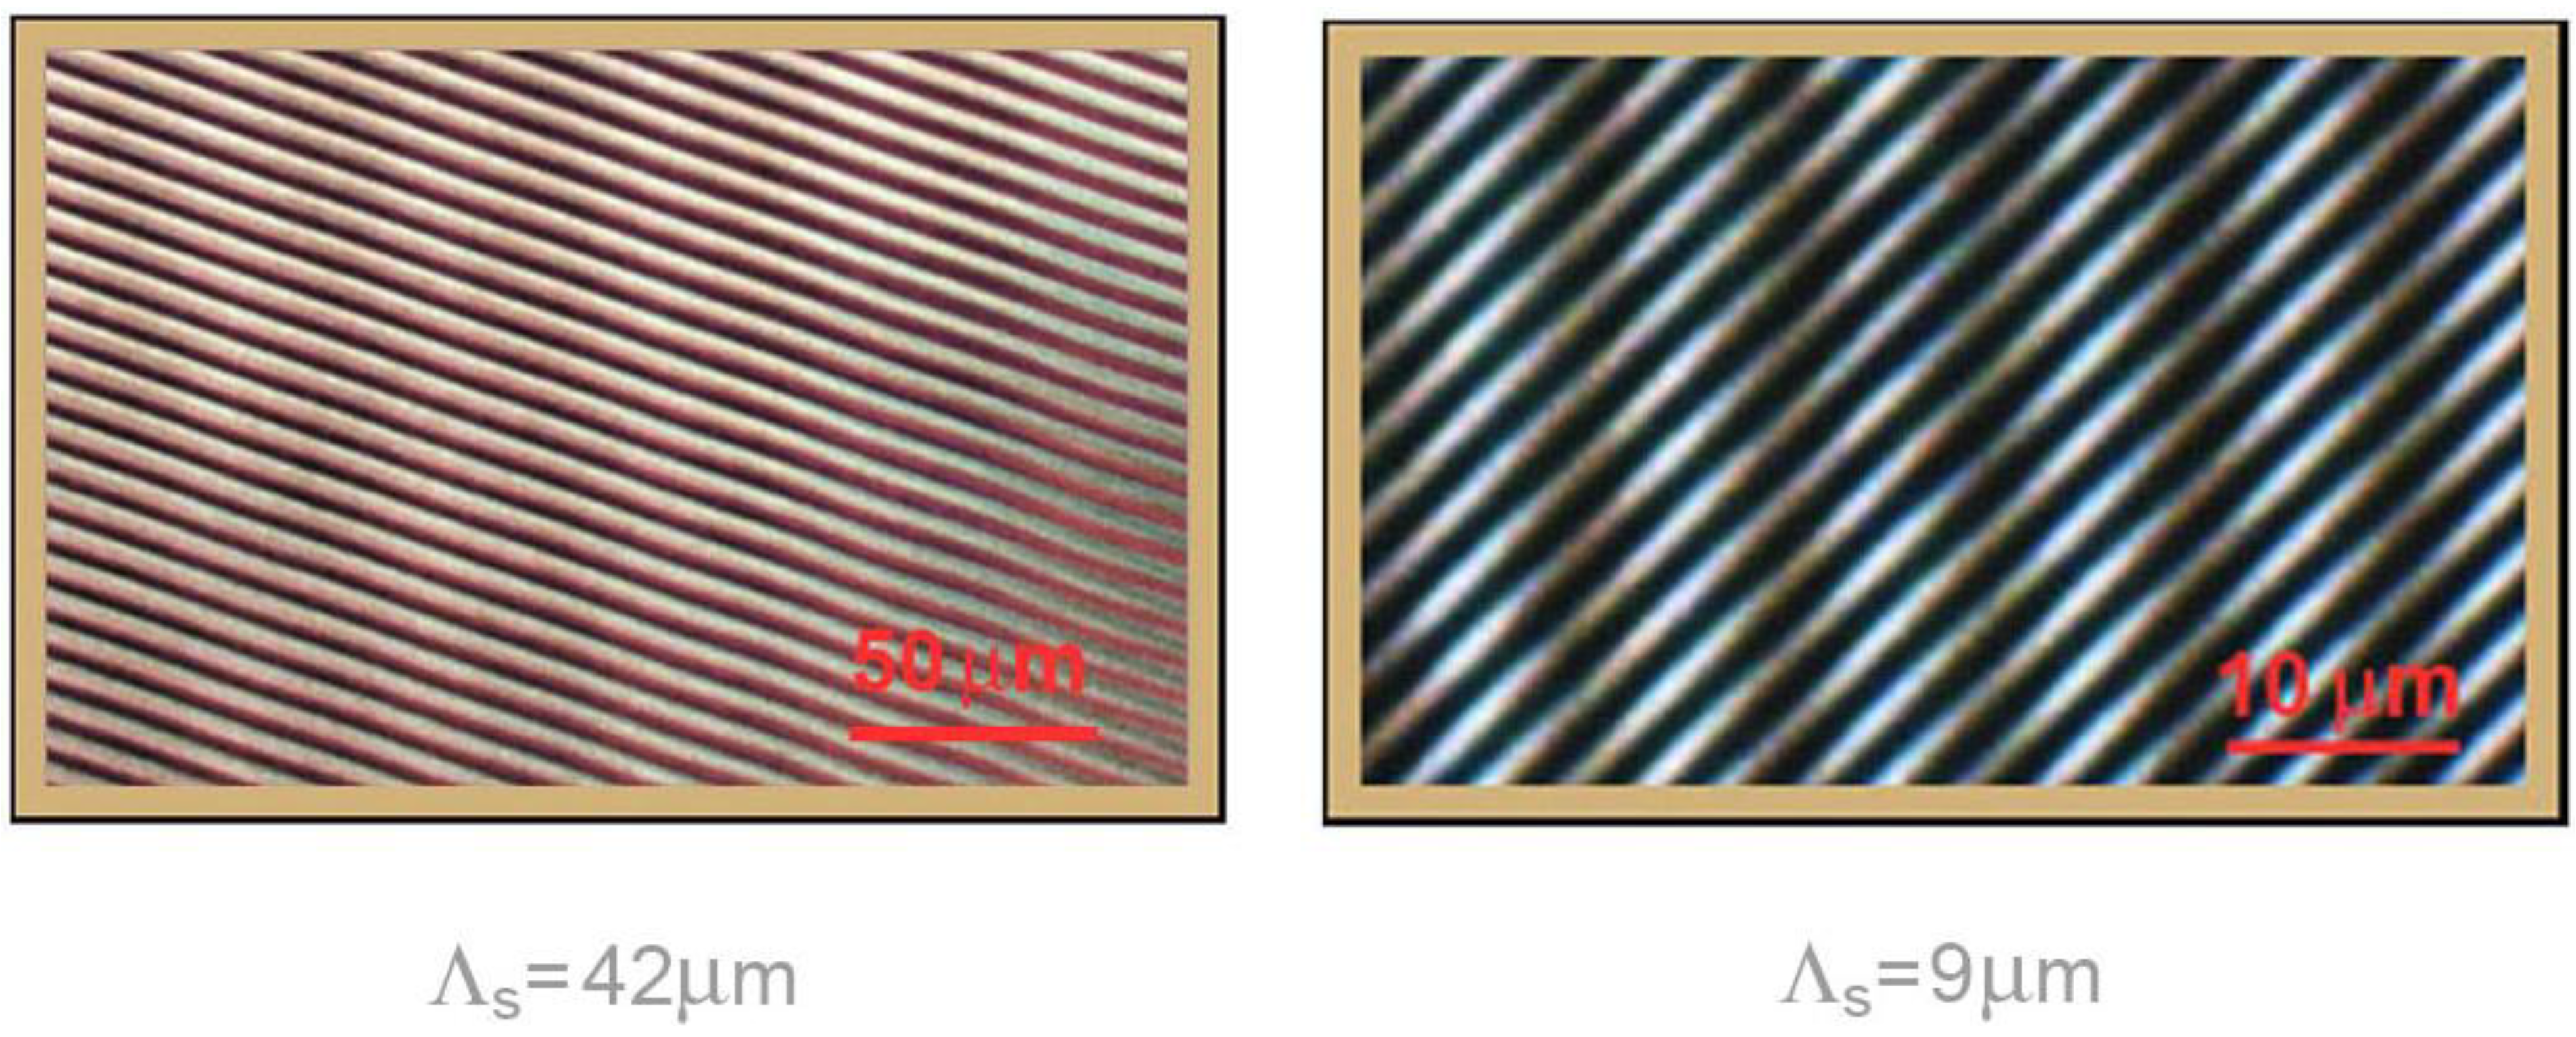
3.3. Refined Analysis of Spatial Characteristics

Beyond the rather qualitative description of reflection gratings on the basis of corresponding sectional gratings, imaging in sectional view allows refined analysis of spatial hologram characteristics as well. The parameter of interest is the reflection grating period, which ranges between 0.5 μm and 130 nm, depending on the recording geometry (see Equation (1)). However, this is out of the range of light-microscopic resolution. Nevertheless, imaging in sectional view offers a possibility to determine Λ without the need to apply more complex methods. We propose an appropriate approach, which takes advantage of the fact, that the focus plane determines the sectional plane, as illustrated in Figure 2. This results, on the one hand, in a specific side effect of imaging in sectional view, according to which the stripes are moving along the sectional-grating vector if the focus plane is altered or adjusted [7]. On the other hand, a gradual tilt of the sample, which entails tuning of the slant angle φ, results in an alternation of the sectional grating period Λs according to Equation (2). In case of continuous tuning across the angular range, the sectional grating period is expected to describe the curve Λs(φ), shown in Figure 5. Hereby Λs converges to infinity if φ approaches zero.
To determine the grating period of the corresponding reflection grating, the symmetry of the Λs(φ)-curve can be utilized. Regardless of the actual tilt of the reflection grating in the polymer sample, the axis of symmetry, i.e., the case φ = 0 can be located by means of sampling the Λs(φ)-curve for φ → 0+ and φ → 0. Having located the symmetry axis, the absolute position of the grating is known, φ can be quantified and Λ can be calculated from Equation (2).
Figure 5. Sectional grating period, depending on the slant angle φ, calculated according to Equation (2). Circles refer to the two cases already described in Figure 3.
Applsci 04 00019 g005

4. Conclusions

We have demonstrated imaging of volume phase gratings in a photosensitive polymer by means of optical microscopy. Appropriate alternative imaging techniques were discussed, with reference to the specific advantages and disadvantages concerning applicability to volume phase holograms. Light microscopic images of transmission gratings and reflection gratings as well as of secondary gratings of inverse geometry, also known as parasitic gratings, are shown. The appearance and possible avoidance of such unintentionally recorded gratings is discussed. Imaging in sectional view was implemented to render reflection gratings visible and to study secondary gratings with periods in the sub-micrometer range. In spite of the fact that this is out of the resolution range of optical microscopy, techniques are described and proposed by which the reflection grating period can be quantified.

Acknowledgments

We acknowledge support by the co:bios foundation. We thank microresist technology GmbH for providing the photopolymer samples. Microscopic recordings are provided by the Zentraleinrichtung Elektronenmikroskopie (ZELMI).

Conflicts of Interest

The authors declare no conflict of interest.

References

  1. Trentler, T.J.; Boyd, J.E.; Colvin, V.L. Epoxy resin-photopolymer composites for volume holography. Chem. Mater. 2000, 12, 1431–1438. [Google Scholar] [CrossRef]
  2. Trout, T.J.; Schmieg, J.J.; Gambogi, W.J.; Weber, A.M. Optical photopolymers: Design and applications. Adv. Mater. 1998, 10, 1219–1224. [Google Scholar] [CrossRef]
  3. Hagen, R.; Bieringer, T. Photoaddressable polymers for optical data storage. Adv. Mater. 2001, 13, 1805–1810. [Google Scholar] [CrossRef]
  4. Ma, H.; Jen, A.K.Y.; Dalton, L.R. Polymer-based optical waveguides: Materials, processing, and devices. Adv. Mater. 2002, 14, 1339–1365. [Google Scholar] [CrossRef]
  5. Baylor, M.; Cerjan, B.; Pfiefer, C.; Boyne, R.; Couch, C.; Cramer, N.; Bowman, C.; McLeod, R. Monolithic integration of optical waveguide and fluidic channel structures in a thiol-ene/methacrylate photopolymer. Opt. Mater. Express 2012, 2, 1548–1555. [Google Scholar] [CrossRef]
  6. De Sio, L.; Ferjani, S.; Strangi, G.; Umeton, C.; Bartolino, R. Universal soft matter template for photonic applications. Soft Matter 2011, 7, 3739–3743. [Google Scholar] [CrossRef]
  7. Sabel, T.; Orlic, S.; Pfeiffer, K.; Ostrzinski, U.; Grützner, G. Free-surface photopolymerizable recording material for volume holography. Opt. Mater. Express 2013, 3, 329–338. [Google Scholar] [CrossRef]
  8. Orlic, S.; Bernstein, F.; Kratz, C.; Schlösser, A. Optical transfer function of three-dimensional photonic crystals by volume holographic recording. Appl. Phys. Lett. 2013, 103, 041106. [Google Scholar] [CrossRef]
  9. Guo, J.; Gleeson, M.R.; Sheridan, J.T. A review of the optimisation of photopolymer materials for holographic data storage. Phys. Res. Int. 2012, 2012, 803439. [Google Scholar] [CrossRef]
  10. Sabel, T.; Zschocher, M. Transition of refractive index contrast in course of grating growth. Sci. Rep. 2013, 3, 2552. [Google Scholar] [CrossRef]
  11. Sakhno, O.V.; Goldenberg, L.M.; Smirnova, T.N.; Stumpe, J. Holographic patterning of organic-inorganic photopolymerizable nanocomposites. Proc. SPIE 2009, 7487. [Google Scholar] [CrossRef]
  12. Sabel, T.; Zschocher, M. Dynamic Bragg angle shift in the course of volume hologram formation. Mater. Res. Lett. 2013, 2, 76–81. [Google Scholar] [CrossRef]
  13. Castagna, R.; Milner, A.; Zyss, J.; Prior, Y. Nanoscale Poling of Polymer Films. Adv. Mater. 2013, 25, 2234–2238. [Google Scholar] [CrossRef]
  14. Del Monte, F.; Martínez, O.; Rodrigo, J.A.; Calvo, M.L.; Cheben, P. A Volume Holographic Sol-gel material with large enhancement of dynamic range by incorporation of high refractive index species. Adv. Mater. 2006, 18, 2014–2017. [Google Scholar] [CrossRef]
  15. Orlic, S.; Müller, C.; Schlösser, A. All-optical fabrication of three-dimensional photonic crystals in photopolymers by multiplex-exposure holographic recording. Appl. Phys. Lett. 2011, 99. [Google Scholar] [CrossRef]
  16. Smirnova, T.N.; Kokhtych, L.M.; Kutsenko, A.S.; Sakhno, O.V.; Stumpe, J. The fabrication of periodic polymer/silver nanoparticle structures: In situ reduction of silver nanoparticles from precursor spatially distributed in polymer using holographic exposure. Nanotechnology 2009, 20, 405301. [Google Scholar] [CrossRef]
  17. Juhl, A.T.; Busbee, J.D.; Koval, J.J.; Natarajan, L.V.; Tondiglia, V.P.; Vaia, R.A.; Bunning, T.J.; Braun, P.V. Holographically directed assembly of polymer nanocomposites. ACS Nano 2010, 4, 5953–5961. [Google Scholar] [CrossRef]
  18. Suzuki, N.; Tomita, Y. Real-time phase-shift measurement during formation of a volume holographic grating in nanoparticle-dispersed photopolymers. Appl. Phys. Lett. 2006, 88, 011105. [Google Scholar] [CrossRef]
  19. Criante, L.; Castagna, R.; Vita, F.; Lucchetta, D.E.; Simoni, F. Nanocomposite polymeric materials for high density optical storage. J. Opt. A Pure Appl. Opt. 2009, 11, 024011. [Google Scholar] [CrossRef]
  20. Lourtioz, J.-M. Photonic crystals: Writing 3D photonic structures with light. Nat. Mater. 2004, 3, 427–428. [Google Scholar] [CrossRef]

