<?xml version="1.0" encoding="UTF-8"?>
<!DOCTYPE article PUBLIC "-//NLM//DTD Journal Publishing DTD v2.3 20070202//EN" "journalpublishing.dtd">
<article xmlns:mml="http://www.w3.org/1998/Math/MathML" xmlns:xlink="http://www.w3.org/1999/xlink" xml:lang="en" article-type="research-article">
  <front>
    <journal-meta>
      <journal-id journal-id-type="publisher-id">applsci</journal-id>
      <journal-title>Applied Sciences</journal-title>
      <abbrev-journal-title abbrev-type="publisher">Appl. Sci.</abbrev-journal-title>
      <abbrev-journal-title abbrev-type="pubmed">Appl. Sci.</abbrev-journal-title>
      <issn pub-type="epub">2076-3417</issn>
      <publisher>
        <publisher-name>MDPI</publisher-name>
      </publisher>
    </journal-meta>
    <article-meta>
      <article-id pub-id-type="doi">10.3390/app2040726</article-id>
      <article-id pub-id-type="publisher-id">applsci-02-00726</article-id>
      <article-categories>
        <subj-group>
          <subject>Article</subject>
        </subj-group>
      </article-categories>
      <title-group>
        <article-title>Feasibility Study of Energy Storage Systems in Wind/Diesel Applications Using the HOMER Model</article-title>
      </title-group>
      
      <contrib-group>
        <contrib contrib-type="author">
          <name>
            <surname>Stiel</surname>
            <given-names>Andrew</given-names>
          </name>
        </contrib>
        <contrib contrib-type="author">
          <name>
            <surname>Skyllas-Kazacos</surname>
            <given-names>Maria</given-names>
          </name>
          <xref rid="c1-applsci-02-00726" ref-type="corresp">*</xref>
        </contrib>
      </contrib-group>
     <aff id="af1-applsci-02-00726">School of Chemical Sciences and Engineering, University of New South Wales, Sydney, NSW, 2052, Australia</aff>
      <author-notes>
        <corresp id="c1-applsci-02-00726"><label>*</label> Author  to whom correspondence should be addressed; Email: <email>m.kazacos@unsw.edu.au</email>.   </corresp>
      </author-notes>
      <pub-date pub-type="epub">
        <day>18</day>
        <month>10</month>
        <year>2012</year>
      </pub-date>
      <pub-date pub-type="collection"><month>12</month>
        <year>2012</year>
      </pub-date>
      <volume>2</volume>
      <issue>4</issue>
      <fpage>726</fpage>
      <lpage>737</lpage>
      <history>
        <date date-type="received">
          <day>27</day>
          <month>08</month>
          <year>2012</year>
        </date>
        <date date-type="rev-recd">
          <day>24</day>
          <month>09</month>
          <year>2012</year>
        </date>
        <date date-type="accepted">
          <day>25</day>
          <month>09</month>
          <year>2012</year>
        </date>
      </history>
      <permissions>
        <copyright-statement>©  2012 by the authors; licensee MDPI, Basel, Switzerland.</copyright-statement>
        <copyright-year>2012</copyright-year>
        <license xmlns:xlink="http://www.w3.org/1999/xlink" license-type="open-access" xlink:href="http://creativecommons.org/licenses/by/3.0/">
          <p>This article is an open-access article distributed under the terms and conditions of the Creative Commons Attribution license (http://creativecommons.org/licenses/by/3.0/).</p>
        </license>
      </permissions>
      <abstract>
        <p>With an increased focus on solutions to the ensuing “climate crisis”, the need for energy storage systems is becoming increasingly important as a means to increase the penetration of renewable technologies such as wind energy. The Vanadium Redox Battery is one such energy storage system showing considerable potential owing to its flexibility in power output and capacity, high efficiency and long operating life. This study models the use of the Vanadium Redox Battery as an integration technology in realistic large-scale remote wind/diesel power systems using the HOMER Micropower Optimization Model computer program developed by the US National Renewable Energy Laboratory. Results from this modelling demonstrate the significant financial and environmental benefits to be gained in installing energy storage in a wind farm. The storage system considered here was a Vanadium Redox Battery.</p>
      </abstract>
      <kwd-group>
        <kwd>energy storage</kwd>
        <kwd>vanadium battery</kwd>
        <kwd>wind energy storage</kwd>
        <kwd>simulation</kwd>
      </kwd-group>
    </article-meta>
  </front>
  <body>
    <sec sec-type="intro">
      <title>1. Introduction</title>
      <p>Wind turbines have already seen widespread use in both grid-connected and remote electricity generation. Large grid-connected wind farms are currently in operation and in development all over the world. The major economic and practical drawback of wind energy is its intermittent nature. Wind energy demands not only that the wind is blowing, but also depends on cut-in and cut out wind speeds—the wind speeds at which generation begins and is stopped to avoid damage respectively. Despite careful consideration given to site selection in order to ensure a relatively stable wind source and strength, the wind and its strength still cannot be guaranteed. This has a number of implications. Firstly, wind turbines have an average production of only about 33% [<xref ref-type="bibr" rid="B1-applsci-02-00726">1</xref>] of their rated power meaning wind farms need to be oversized in order to accommodate reduced wind speeds, greatly increasing capital costs. Secondly, wind power is afforded only limited grid penetration before grid instabilities can occur. At or below the limit of penetration a cut out in wind can be compensated for elsewhere on the grid, but above the limit of penetration the grid is too reliant on wind, so without some means of storage can be very vulnerable to power shortages. Thirdly, for non-grid connected systems, an additional power source such as a diesel generator or a means of storage is required.</p>
      <p>
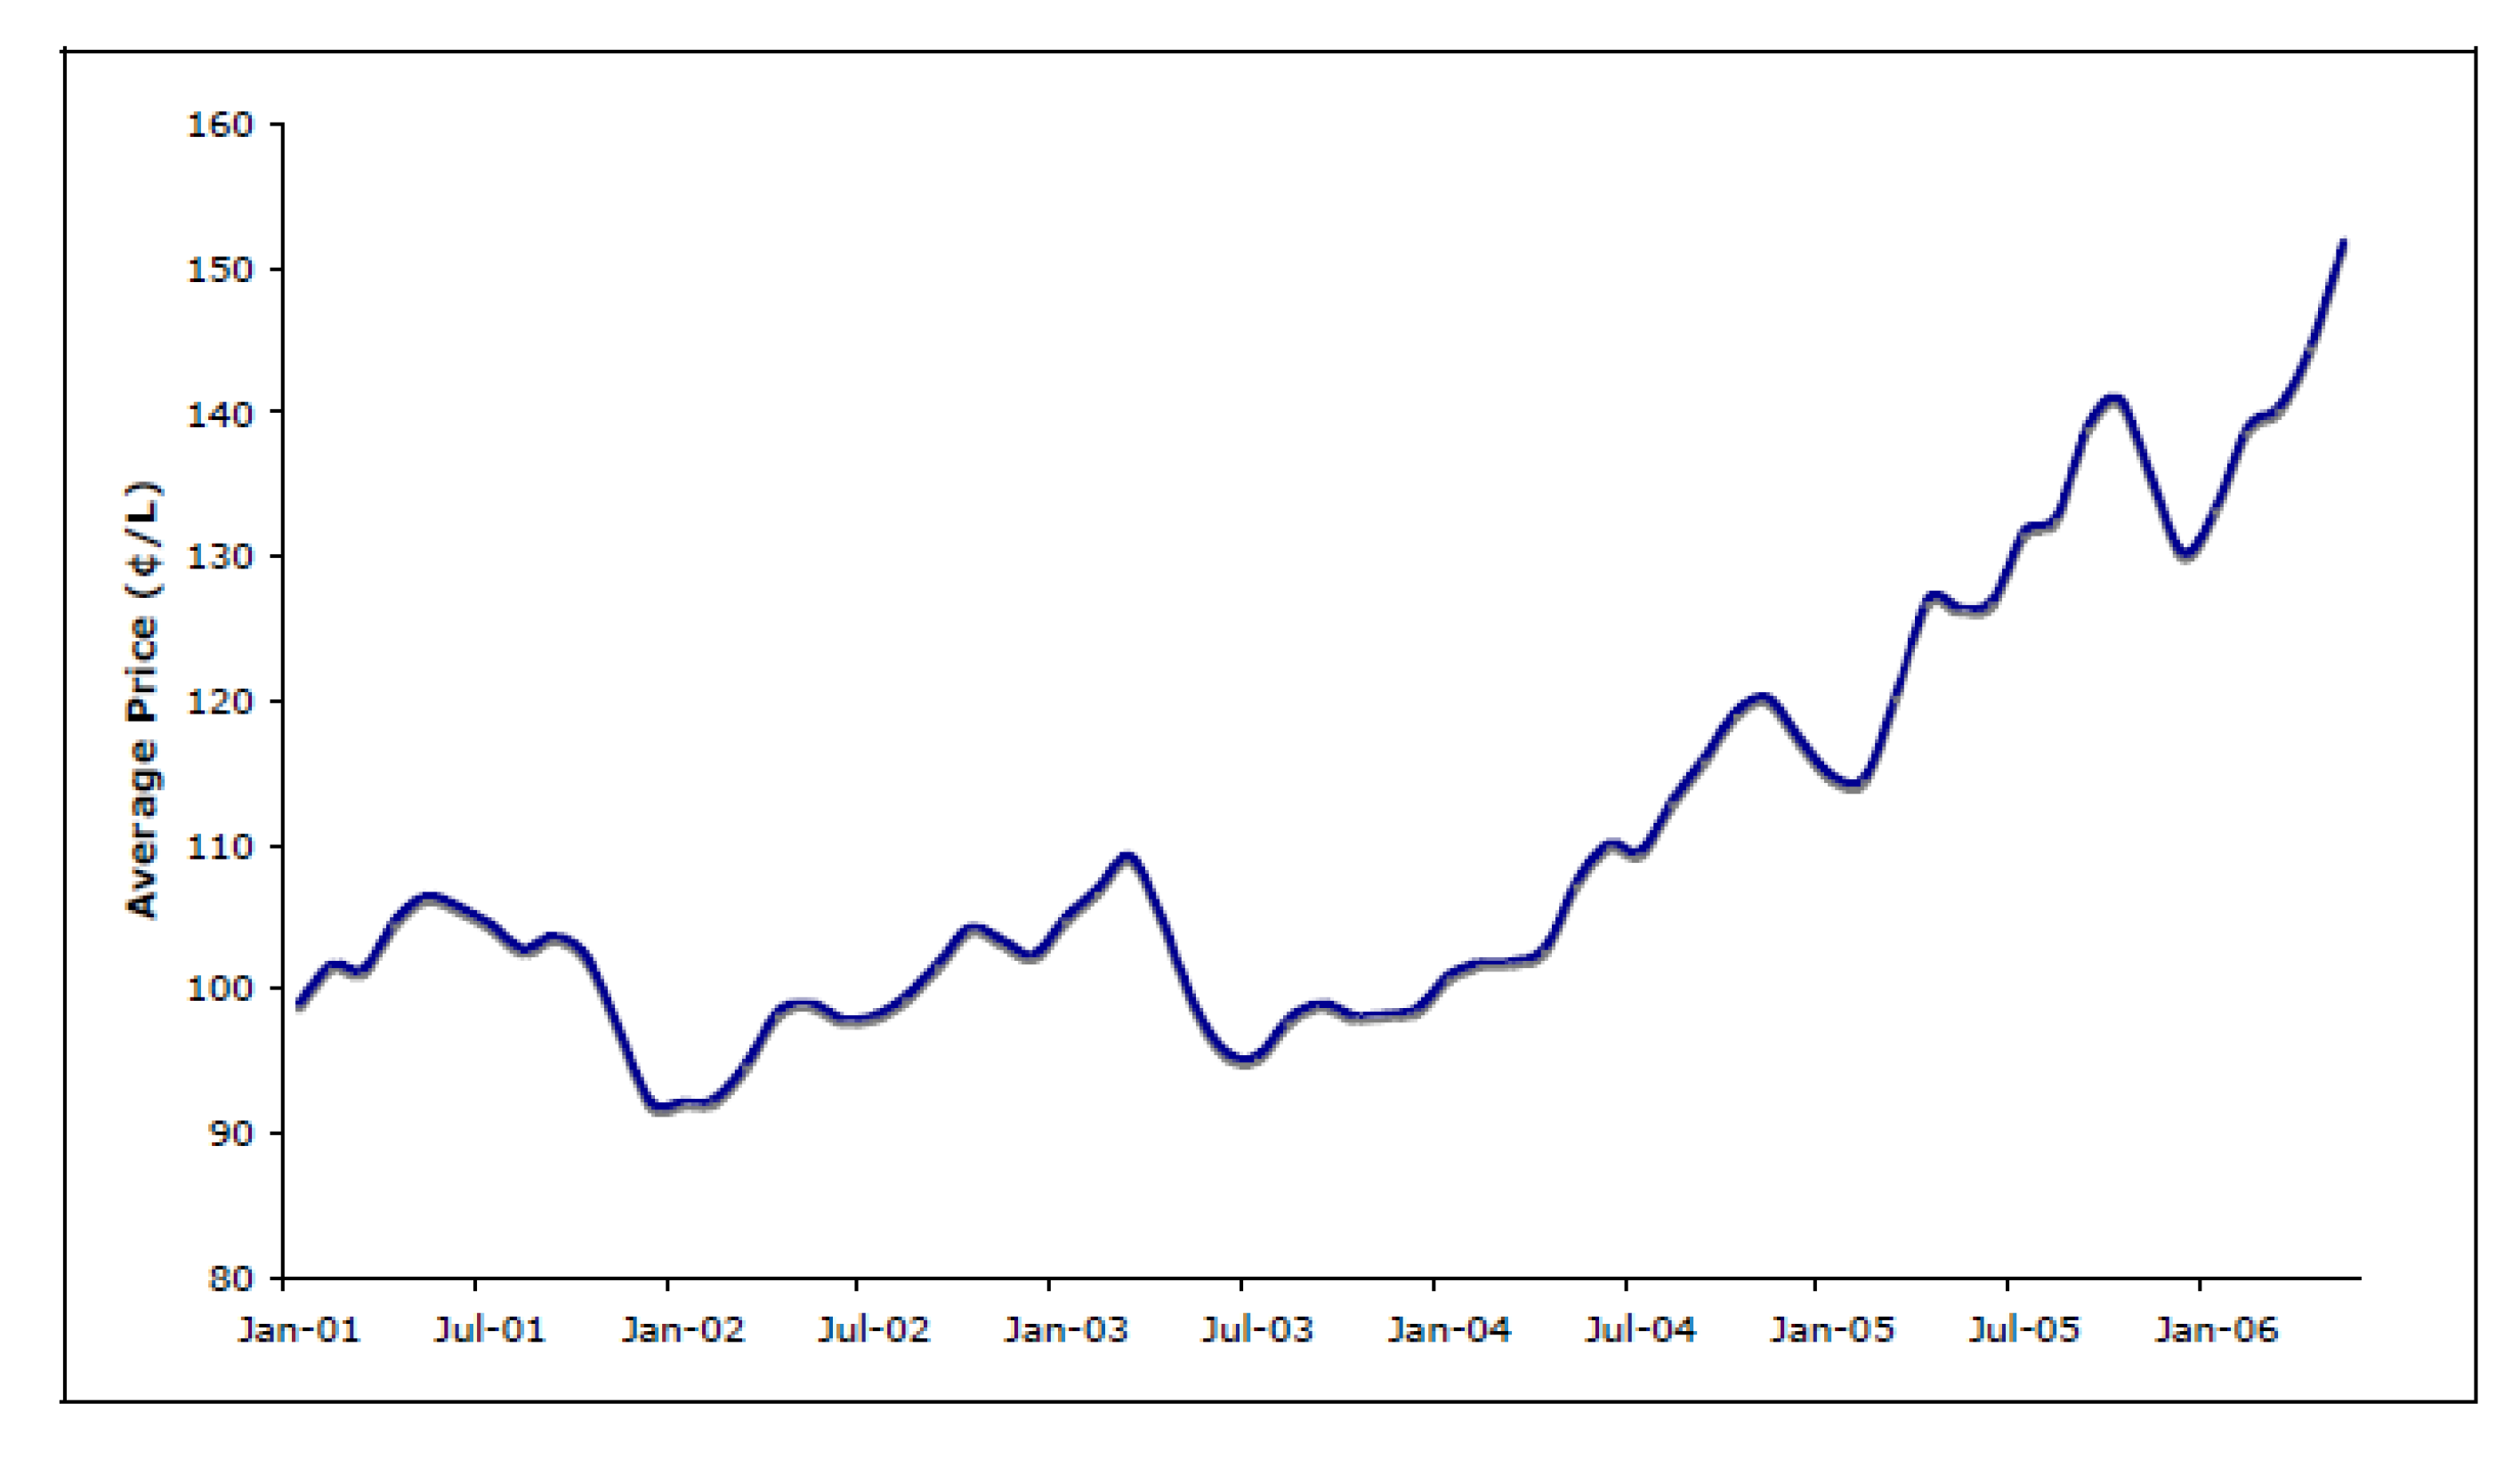
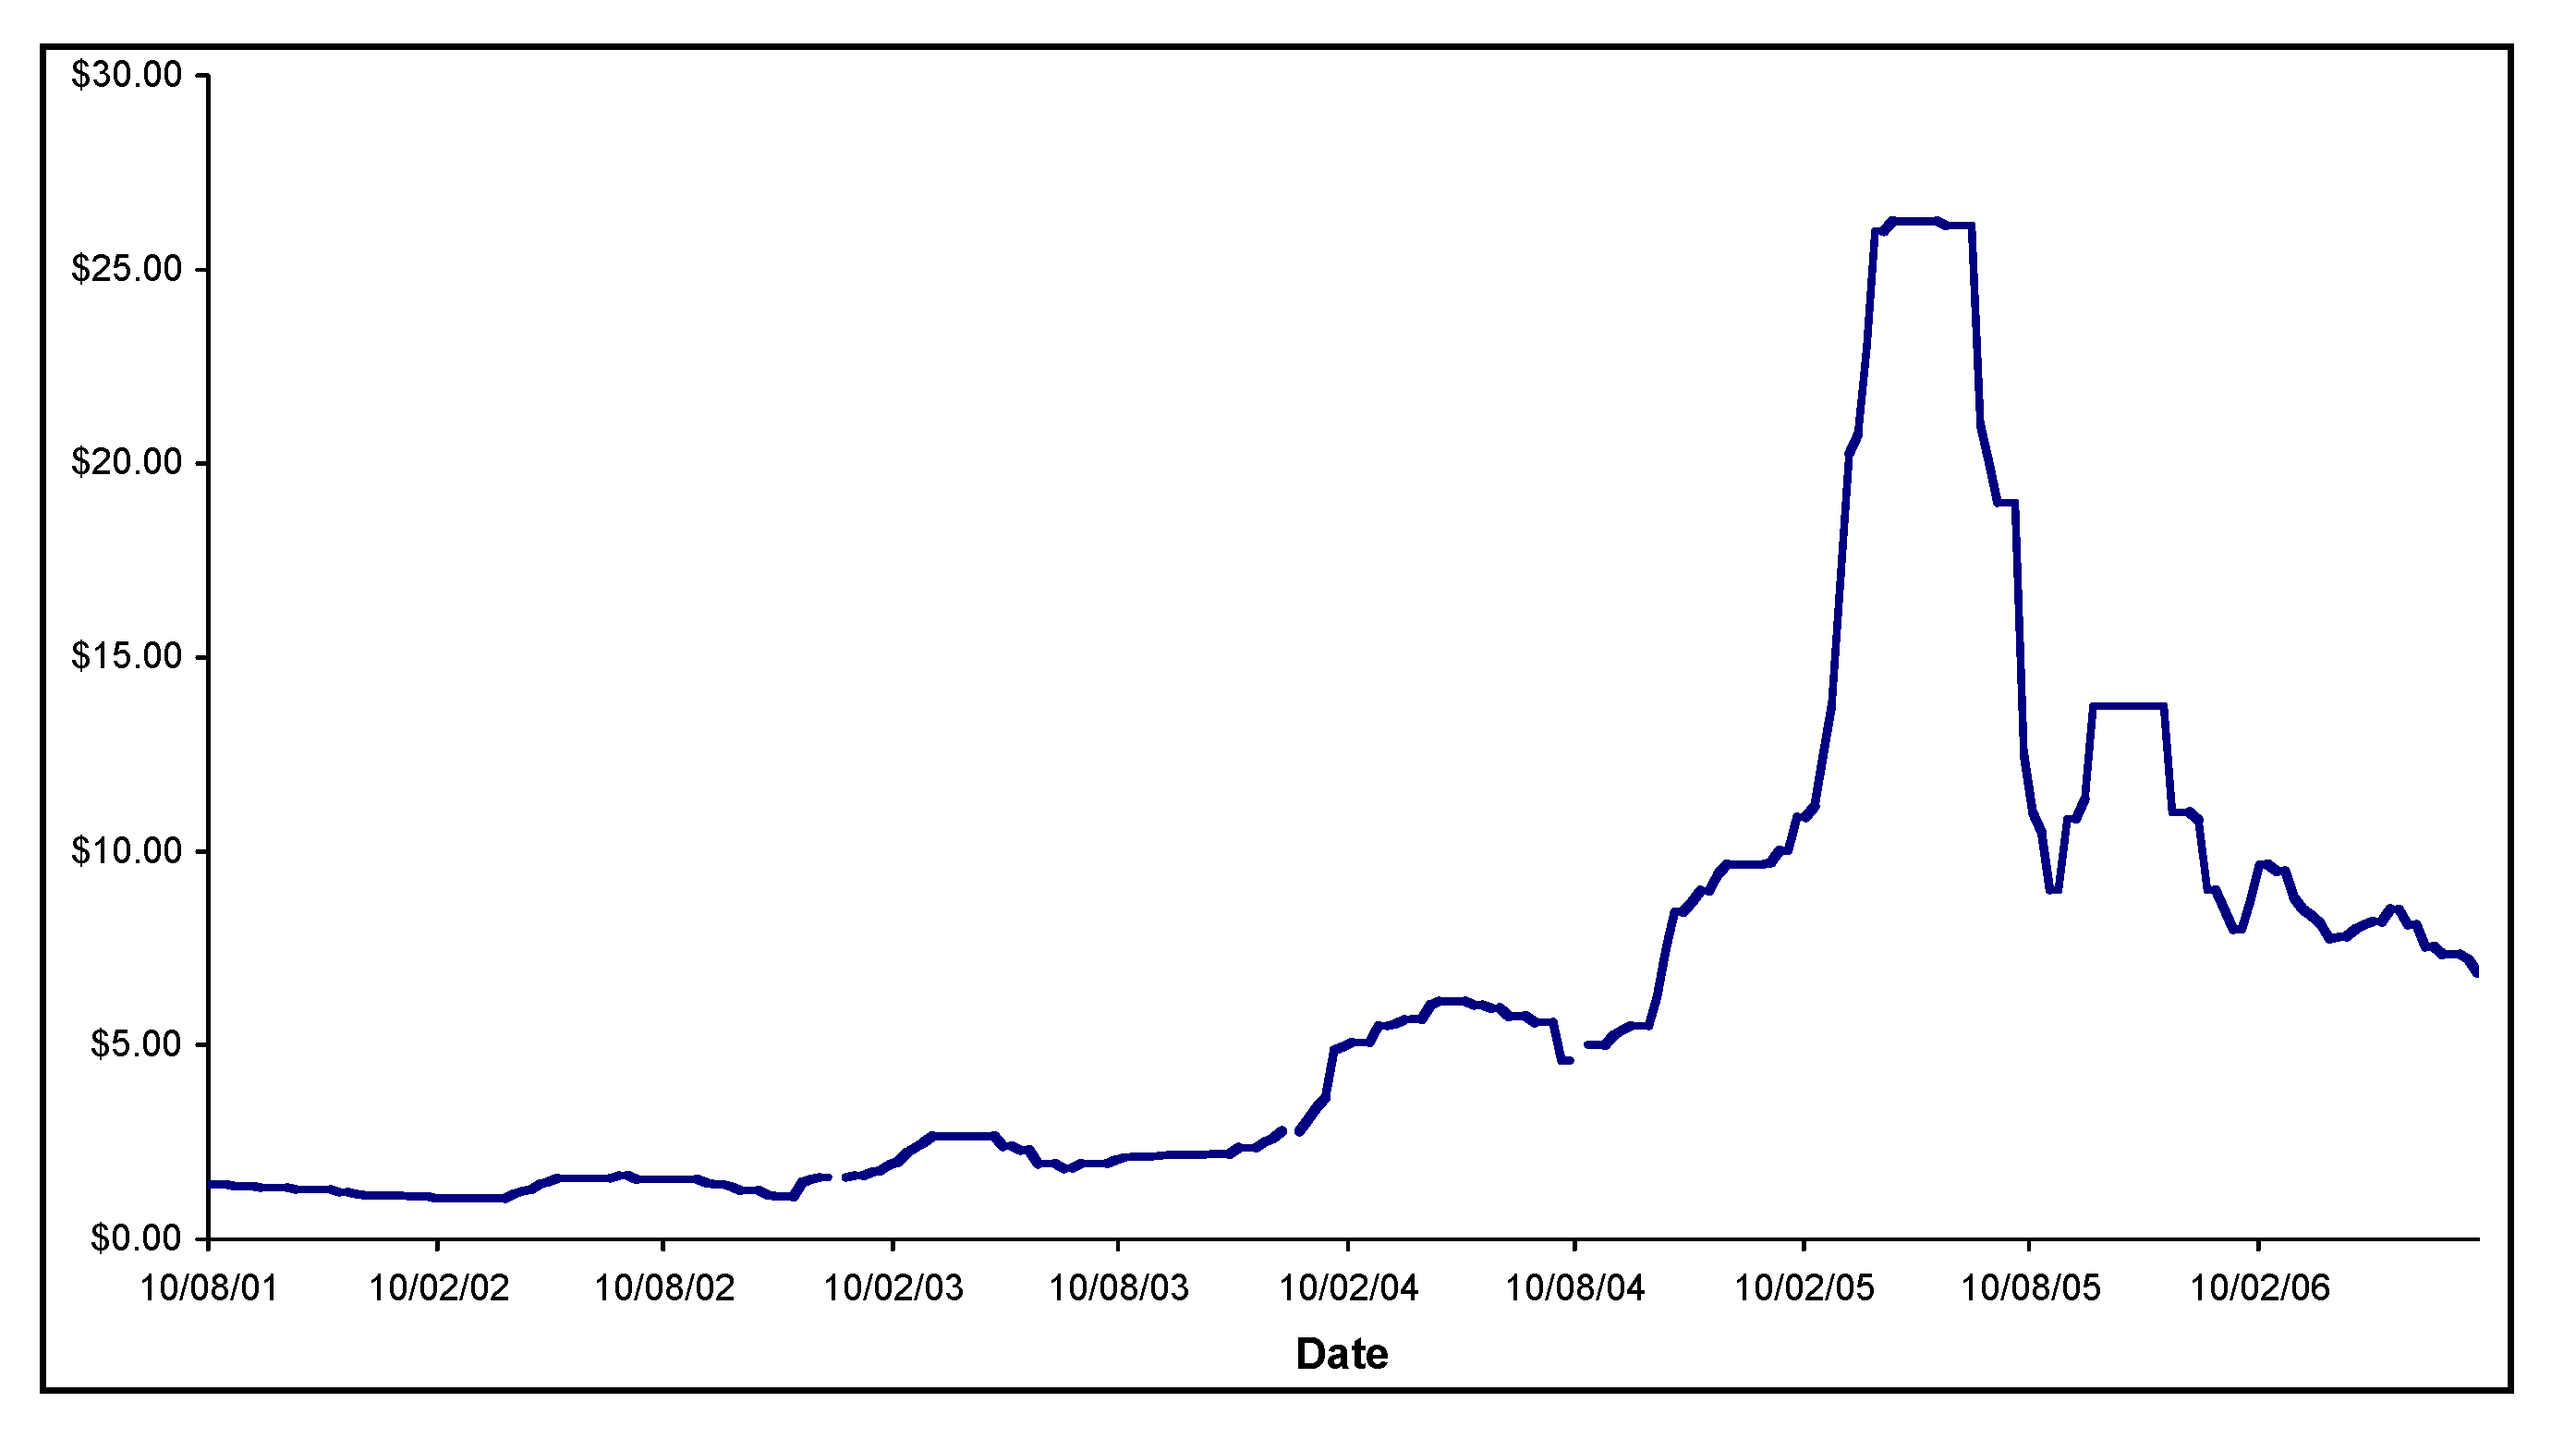
Power generation systems in remote areas typically rely on diesel generators and as such are susceptible to the upward trend in the price of diesel. In order to overcome this, many remote communities are installing wind turbines to reduce their dependence on diesel. The use of an electrochemical energy storage system as an integration technology can potentially further increase the renewable penetration of these wind/diesel systems and in doing so offer long-term tangible monetary and environmental benefits. </p>
      <p>There are several types of electrochemical energy storage technologies currently in existence, from lithium ion batteries to lead-acid batteries. Redox flow cells are another type of battery that exhibits excellent potential for use as energy storage devices due to a number of desirable properties. Redox flow cells employ a half-cell arrangement and utilise electrolytes with different electrochemical potential to store and discharge energy. Flow cells have significant benefits over other batteries including a long operating life, lower capital and operating costs and greater capacity due to the separation of energy and power rating. </p>
      <p>The Vanadium Redox Battery (VRB) [<xref ref-type="bibr" rid="B2-applsci-02-00726">2</xref>,<xref ref-type="bibr" rid="B3-applsci-02-00726">3</xref>,<xref ref-type="bibr" rid="B4-applsci-02-00726">4</xref>,<xref ref-type="bibr" rid="B5-applsci-02-00726">5</xref>], pioneered at the University of New South Wales (UNSW) is proving to have the desired properties required for successful energy storage. Currently two types of VRB are in differing stages of development. The Generation 1 VRB, also referred to as the All-Vanadium Redox Flow Battery, employs a V<sup>2+</sup>/V<sup>3+</sup> redox couple in the negative half-cell and a VO<sup>2+</sup>/VO<sub>2</sub><sup>+</sup> redox couple in the positive. In contrast, the Generation 2 VRB utilises Br<sup>−</sup>/ClBr<sub>2</sub> or Cl<sup>−</sup>/BrCl<sub>2</sub><sup>−</sup> and VBr<sub>2</sub>/VBr<sub>3</sub> redox couples in the negative and positive half-cells respectively [<xref ref-type="bibr" rid="B6-applsci-02-00726">6</xref>,<xref ref-type="bibr" rid="B7-applsci-02-00726">7</xref>].</p>
      <p>The distinguishing feature of both types of VRB over other flow cells is that the VRB employs a single vanadium electrolyte on both sides of the cell. This eliminates the problem of cross-contamination inherent in other types of redox flow batteries, gives an indefinite electrolyte life, reduces maintenance costs and results in excellent storage properties. </p>
      <p>The Generation 1 VRB has already seen extensive field testing and demonstration in a range of energy storage applications, with several VRB wind storage systems currently installed in Japan and Australia. In 2003 a 200 kW/800 kWh VRB was installed on King Island, Australia to store energy for a wind diesel grid thereby reducing diesel fuel consumption on the island. In 2005, Sumitomo Electric Industries (SEI), Japan, installed a 4 MW/6 MWh VRB wind energy storage system on the Japanese island of Hokkaido, this being one of close to 20 VRB installations completed by SEI since 1997. Although a number of VRB systems are in operation for renewable energy storage around the world, however, little information has been published on the economics or greenhouse gas abatement potential of VRB integration into renewable energy systems. The economics and emissions savings that can be achieved are clearly linked to the local conditions of wind speed and wind variability, load profile, diesel fuel costs (for wind-diesel systems) as well as VRB system capital costs. While the capital costs of the existing VRB installations have been relatively high due to the low production capacity currently available, recent developments in low cost membranes and stack components by V-Fuel Pty Ltd in Australia, promise to allow significant cost reductions, allowing the necessary energy storage cost targets to be achieved in the short-term. </p>
      <p>This study seeks to investigate the practical use of a VRB by way of computer modelling to analyse its effectiveness in terms of both cost and emissions savings in realistic remote wind/diesel power systems.</p>
      <p>The HOMER Micropower Optimization Model developed by the US National Renewable Energy Laboratory was used to model the use of a VRB in typical remote wind/diesel systems.</p>
    </sec>
    <sec>
      <title>2. The HOMER Micropower Optimization Model</title>
      <sec>
        <title>2.1. About HOMER (Version 2.2 Beta) [<xref ref-type="bibr" rid="B8-applsci-02-00726">8</xref>]</title>
        <p>HOMER is a computer simulation program designed by the National Renewable Energy Laboratory (NREL) in the United States. Coined as the Optimisation Model for Distributed Power, HOMER allows the modelling of both grid and non-grid connected power systems consisting of conventional and renewable technologies. The program considers the economic and technical feasibility of desired power systems and delivers comprehensive reports covering a range of subjects from the net present capital cost of the system to the renewable penetration.</p>
        <p>HOMER is a very sophisticated program having been constantly developed and updated since its beginnings in February 2000. Now in its sixth year, HOMER (Version 2.2 beta) is used by thousands around the world as the basis from which to begin designing simple power systems. It allows the input of renewable resources such as wind speeds, battery data, demand load data, capital and operation and maintenance (O&amp;M) costs among others, as well as sensitivity analyses modelling the impact on the system to variations in any input.</p>
      </sec>
      <sec>
        <title>2.2. Assumptions within HOMER</title>
        <p>HOMER performs simulation calculations on an hourly basis, for each of the 8,760 h in a year. The calculations are based on energy balances and compare the thermal and electrical energy both provided and demanded by the system. Based on these calculations, HOMER determines the optimum system configuration as well as an analysis of the system cost. For systems that include batteries and/or fuel powered generators, HOMER determines for each hour whether to charge or discharge batteries and whether to run the generator.</p>
        <p>
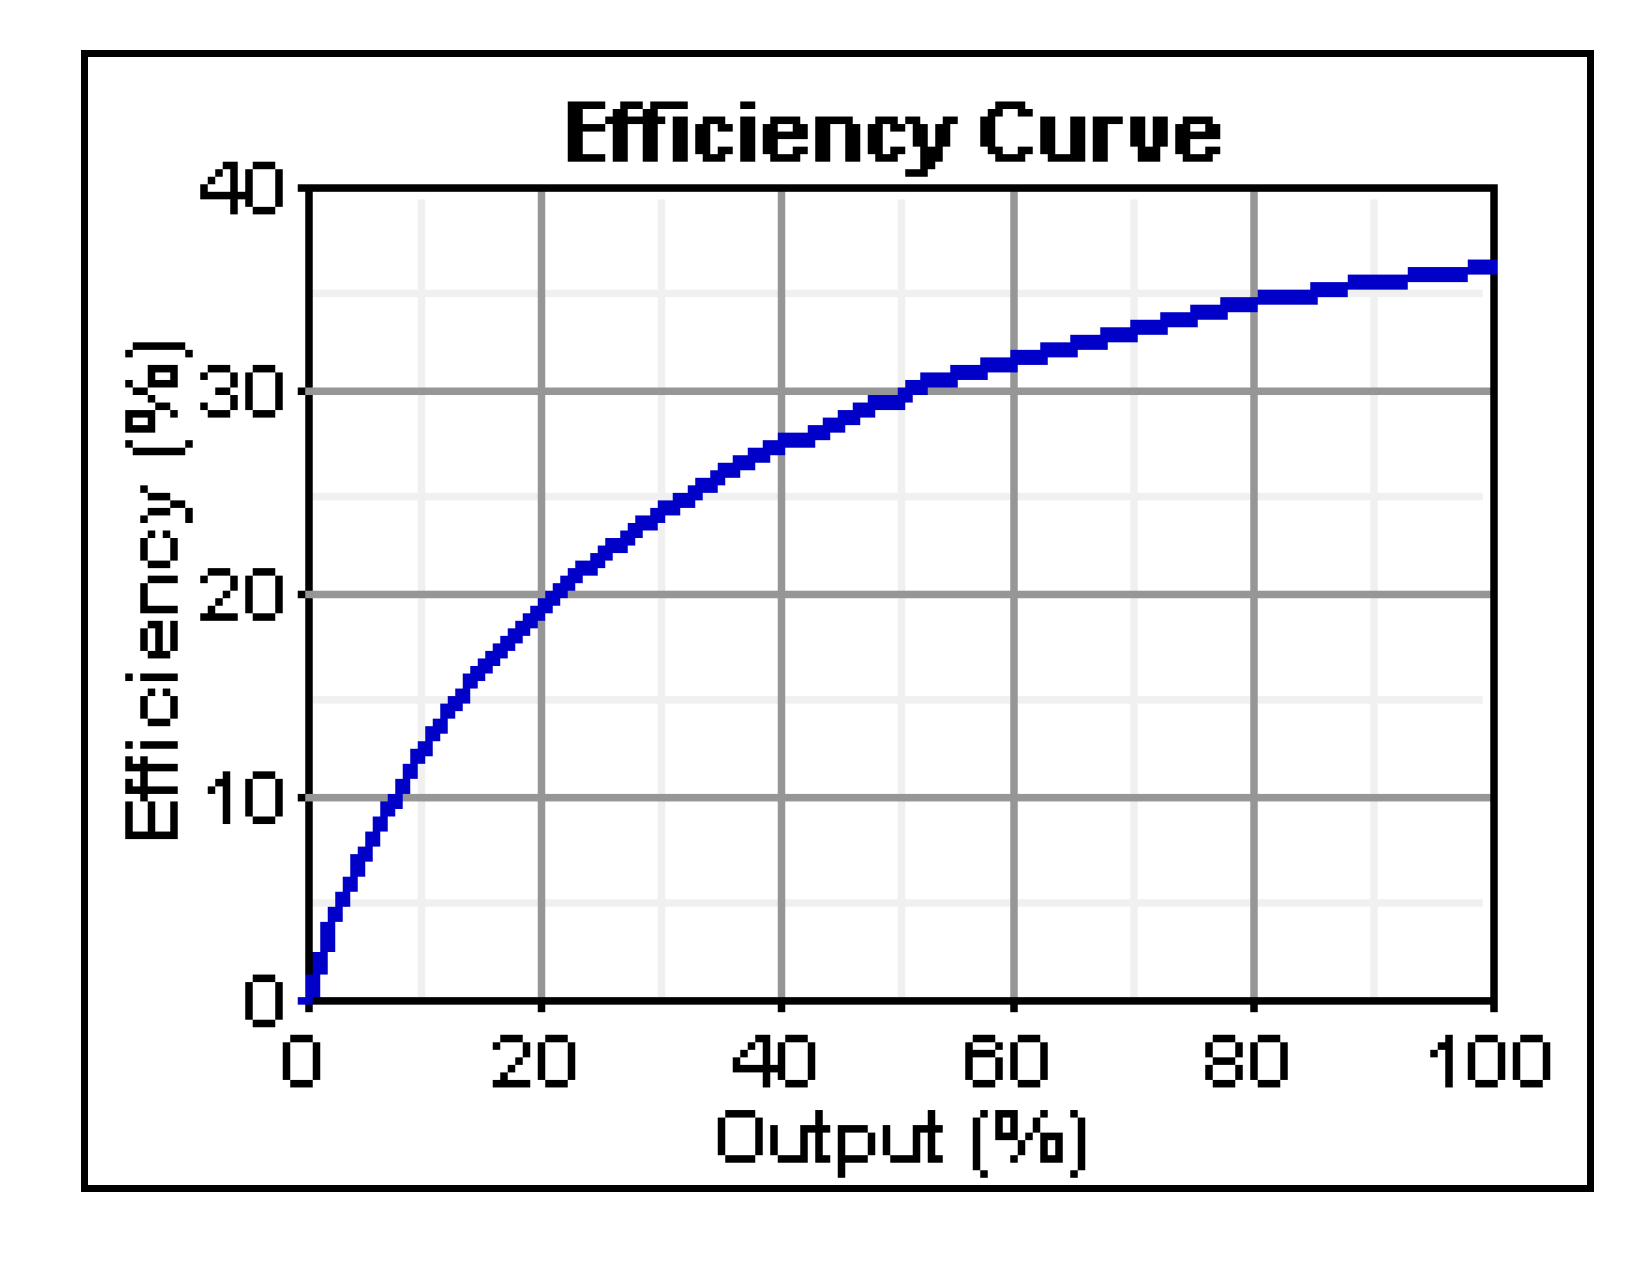
The most significant assumption made by HOMER relates to the round trip efficiency. The round trip efficiency of the battery is assumed to be constant over the load and power range and over the lifetime of the battery. In reality, the round trip efficiency (energy efficiency) of the cell will vary depending on the power drawn from the battery and the surrounding temperature, among other factors. Other assumed constants include the nominal voltage, the capacity curve, the lifetime curve and the minimum state of charge of the battery [<xref ref-type="bibr" rid="B9-applsci-02-00726">9</xref>].</p>
        <p>In calculating the total net present costs and annualised costs of the system, HOMER assumes a project lifetime of 25 years with an interest rate of 6% per annum.</p>
        <p>For more detailed information on assumptions and algorithms within HOMER see the article entitled <italic>Micropower System Modelling with HOMER</italic> by Lambert <italic>et al.</italic> [<xref ref-type="bibr" rid="B9-applsci-02-00726">9</xref>].</p>
      </sec>
    </sec>
    <sec>
      <title>3. System Inputs</title>
      <sec>
        <title>3.1. Wind Resource</title>
        <p>Actual wind data was used for the wind resource input for HOMER. Hourly wind speeds provided by V-Fuel Pty Ltd from an undisclosed source over the 2004 calendar year were used and are summarised by month in <xref ref-type="fig" rid="applsci-02-00726-f001">Figure 1</xref>. The wind speeds were recorded at an elevation of 46 m and have an annual average speed of 9.63 m/s.</p>
        <fig id="applsci-02-00726-f001" position="anchor">
          <label>Figure 1</label>
          <caption>
            <p>HOMER wind resource used in simulation.</p>
          </caption>
          <graphic xmlns:xlink="http://www.w3.org/1999/xlink" xlink:href="applsci-02-00726-g001.tif"/>
        </fig>
      </sec>
      <sec>
        <title>3.2. Primary Load Data</title>
        <p>The load data used was taken from the Australian National Electricity Market Management Company (NEMMCO) website [<xref ref-type="bibr" rid="B10-applsci-02-00726">10</xref>]. Historical demand data from the last eight years is accessible to the public from this website. In this case, hourly data from 2004 for NSW was used and scaled to achieve a 1 MW peak load for the purposes of representing a typical load size for a wind/diesel/battery system. Scaling the data down is still representative of a typical load as the hourly, daily and seasonal trends are maintained. In this case, the scaled annual average daily load is 15,806 kWh/day. <xref ref-type="fig" rid="applsci-02-00726-f002">Figure 2</xref> graphically summarizes the average daily demand data.</p>
        <fig id="applsci-02-00726-f002" position="anchor">
          <label>Figure 2</label>
          <caption>
            <p>HOMER load data (average daily profile) used in simulation.</p>
          </caption>
          <graphic xmlns:xlink="http://www.w3.org/1999/xlink" xlink:href="applsci-02-00726-g002.tif"/>
        </fig>
      </sec>
      <sec>
        <title>3.3. Fuhrländer 250 AC Wind Turbine [<xref ref-type="bibr" rid="B11-applsci-02-00726">11</xref>]</title>
        <p>HOMER has the data for a number of manufacturers of wind turbines and their sizes already built into the program. For this simulation, the Fuhrländer 250 wind turbine was chosen for the size of its rated output (250 kW). A wind turbine of this size is typical for a wind/diesel/battery system with a 1 MW peak load. HOMER was directed to consider up to eight wind turbines. The Fuhrländer 250 turbine has an expected lifetime of 15 years, a hub height of 25 m and a power curve as shown in <xref ref-type="fig" rid="applsci-02-00726-f003">Figure 3</xref>.</p>
        <fig id="applsci-02-00726-f003" position="anchor">
          <label>Figure 3</label>
          <caption>
            <p>Fuhrländer 250 power curve.</p>
          </caption>
          <graphic xmlns:xlink="http://www.w3.org/1999/xlink" xlink:href="applsci-02-00726-g003.tif"/>
        </fig>
      </sec>
      <sec>
        <title>3.4. Diesel Generators</title>
        <p>HOMER has the data for generic diesel generators built in. For this system, two diesel generators were considered of either 300, 600 or 1,000 kW rated power output. The generators are assumed to have an operating lifetime of 15,000 h with a minimum load ratio of 30%. The efficiency curve relating the fuel consumption to the power output for the generators is included as <xref ref-type="fig" rid="applsci-02-00726-f004">Figure 4</xref>.</p>
        <fig id="applsci-02-00726-f004" position="anchor">
          <label>Figure 4</label>
          <caption>
            <p>Diesel generator efficiency curve.</p>
          </caption>
          <graphic xmlns:xlink="http://www.w3.org/1999/xlink" xlink:href="applsci-02-00726-g004.tif"/>
        </fig>
        <p>The efficiency curve above demonstrates two aspects of diesel power generation. Firstly, in general, efficiency is very low. Operating at a peak of around 35% efficiency, most of the energy supplied to a diesel generator is wasted. Secondly, there is a marked reduction in efficiency with a reduction in power output. For this reason, a constraint is placed on the system within HOMER to limit the minimal power output of the diesel generators to 30% of their overall capacity.</p>
        <p>The base price of diesel used in the simulations was $1.50/L and is based on <xref ref-type="fig" rid="applsci-02-00726-f005">Figure 5</xref> depicting the 5-year historical trend in the price of diesel in a remote part of Western Australia.</p>
        <fig id="applsci-02-00726-f005" position="anchor">
          <label>Figure 5</label>
          <caption>
            <p>Price of diesel in the mid-west region, western Australia [<xref ref-type="bibr" rid="B12-applsci-02-00726">12</xref>].</p>
          </caption>
          <graphic xmlns:xlink="http://www.w3.org/1999/xlink" xlink:href="applsci-02-00726-g005.tif"/>
        </fig>
        <p>It is important to note that HOMER assumes the price of diesel to remain constant over the 25-year life of the project. As <xref ref-type="fig" rid="applsci-02-00726-f005">Figure 5</xref> indicates, this is a very conservative assumption for the purposes of calculating fuel costs.</p>
      </sec>
      <sec>
        <title>3.5. Vanadium Redox Battery</title>
        <p>The VRB round trip efficiency was assumed to be 80% for this system. This is a realistic assumption based on significant research during the battery’s development [<xref ref-type="bibr" rid="B2-applsci-02-00726">2</xref>,<xref ref-type="bibr" rid="B3-applsci-02-00726">3</xref>,<xref ref-type="bibr" rid="B4-applsci-02-00726">4</xref>,<xref ref-type="bibr" rid="B5-applsci-02-00726">5</xref>]. In each case the cell stack is assumed to have a lifetime of 20 years and the electrolyte a lifetime of 50 years, based on figures provided by V-Fuel Pty Ltd. The simulation considered between 400 kW and 1,200 kW rated power batteries with between 8,000 kWh and 20,000 kWh of storage. The price of vanadium pentoxide on world commodity markets is shown in <xref ref-type="fig" rid="applsci-02-00726-f006">Figure 6</xref> and forms the basis for the $300/kWh cost of the electrolyte system (although substantial electrolyte cost reductions would be possible if vanadium production capacities were to increase in the future).</p>
        <fig id="applsci-02-00726-f006" position="anchor">
          <label>Figure 6</label>
          <caption>
            <p>Vanadium pentoxide prices, 10 August 2001–4 August 2006 [<xref ref-type="bibr" rid="B13-applsci-02-00726">13</xref>].</p>
          </caption>
          <graphic xmlns:xlink="http://www.w3.org/1999/xlink" xlink:href="applsci-02-00726-g006.tif"/>
        </fig>
      </sec>
      <sec>
        <title>3.6. Cost Data</title>
        <p>The following typical costs data (<xref ref-type="table" rid="applsci-02-00726-t001">Table 1</xref>) was adapted from a table within a report prepared for the Australian Greenhouse Office entitled <italic>Assessment of Diesel Use in Remote Area Power Supply</italic>.</p>
        <table-wrap id="applsci-02-00726-t001" position="float">
          <object-id pub-id-type="pii">applsci-02-00726-t001_Table 1</object-id>
          <label>Table 1</label>
          <caption>
            <p>Cost data for renewable technology options (1999) [<xref ref-type="bibr" rid="B14-applsci-02-00726">14</xref>].</p>
          </caption>
          <table>
         
            <tbody>
              <tr>
                <td rowspan="3" align="left" valign="middle">
                  <bold>Technology Options</bold>
                </td>
                <td colspan="2" align="center" valign="middle">
                  <bold>Typical Costs (1999)</bold>
                </td>
              </tr>
              <tr style="border-top: solid thin">
                <td align="center" valign="middle">Capital [$/W]</td>
                <td align="center" valign="middle">O&amp;M [$/kWh]</td>
              </tr>
              <tr>
                <td align="center" valign="middle">low–high</td>
                <td align="center" valign="middle">low–high</td>
              </tr>
              <tr style="border-top: solid thin">
                <td align="left" valign="middle">V-Fuel Redox battery (&gt;50 kW) °</td>
                <td align="left" valign="middle">0.50–0.78 *</td>
                <td align="left" valign="middle">&lt;0.01</td>
              </tr>
              <tr>
                <td align="left" valign="middle">Wind power (&gt;60 kW)</td>
                <td align="left" valign="middle">1.80–2.80</td>
                <td align="left" valign="middle">&lt;&lt;0.01</td>
              </tr>
              <tr>
                <td align="left" valign="middle">Diesel Generators (100-500 KW)</td>
                <td align="left" valign="middle">0.20–0.30</td>
                <td align="left" valign="middle">0.22–0.25</td>
              </tr>
            </tbody>
          </table>
          <table-wrap-foot>
          <fn>
          <p>° V-Fuel battery costs provided by V-Fuel (2006); * Based on $500/kW for 1 h of storage and $780/kW for 4 h of storage.</p>
          </fn>
          </table-wrap-foot>
        </table-wrap>
        
        <p>As the above data is based on typical costs in 1999, it was adjusted for inflation (Data was adjusted using the inflation calculator on the Reserve Bank of Australia website) [<xref ref-type="bibr" rid="B15-applsci-02-00726">15</xref>] and presented in <xref ref-type="table" rid="applsci-02-00726-t002">Table 2</xref>.</p>
        <table-wrap id="applsci-02-00726-t002" position="float">
          <object-id pub-id-type="pii">applsci-02-00726-t002_Table 2</object-id>
          <label>Table 2</label>
          <caption>
            <p>Cost data for renewable technology (adjusted for inflation 2005).</p>
          </caption>
          <table>
           
            <tbody>
              <tr>
                <td rowspan="3" align="left" valign="middle">
                  <bold>Technology Options</bold>
                </td>
                <td colspan="2" align="center" valign="middle">
                  <bold>Typical Costs (2005)</bold>
                </td>
              </tr>
              <tr style="border-top: solid thin">
                <td align="center" valign="middle">Capital [$/W]</td>
                <td align="center" valign="middle">O&amp;M [$/kWh]</td>
              </tr>
              <tr>
                <td align="center" valign="middle">low–high</td>
                <td align="center" valign="middle">low–high</td>
              </tr>
              <tr style="border-top: solid thin">
                <td align="left" valign="middle">V-Fuel Redox battery (&gt;50 kW)</td>
                <td align="left" valign="middle">0.61–0.95</td>
                <td align="left" valign="middle">&lt;0.01</td>
              </tr>
              <tr>
                <td align="left" valign="middle">Wind Power (&gt;60 kW)</td>
                <td align="left" valign="middle">2.18–3.40</td>
                <td align="left" valign="middle">&lt;&lt;0.01</td>
              </tr>
              <tr>
                <td align="left" valign="middle">Diesel generators (100 – 500 kW)</td>
                <td align="left" valign="middle">0.24–0.36</td>
                <td align="left" valign="middle">0.27–0.30</td>
              </tr>
            </tbody>
          </table>
        </table-wrap>
        <p>Using the above data, the appropriate capital and operation and maintenance costs were entered into HOMER. In each case the high cost figure was used to take into account the additional costs incurred in implementing such a system in a remote area and so that a worst-case cost scenario simulation is run. Included below is a summary of the cost data entered into HOMER (<xref ref-type="table" rid="applsci-02-00726-t003">Table 3</xref>).</p>
        <table-wrap id="applsci-02-00726-t003" position="float">
          <object-id pub-id-type="pii">applsci-02-00726-t003_Table 3</object-id>
          <label>Table 3</label>
          <caption>
            <p>HOMER cost input data.</p>
          </caption>
          <table>
            <thead>
              <tr>
                <th rowspan="2" align="center" valign="middle" style="border-right: solid thin">Component</th>
                <th colspan="3" align="center" valign="middle" style="border-right: solid thin">Component Costs</th>
                <th colspan="3" align="center" valign="middle">VRB Electrolyte Costs</th>
              </tr>
              <tr style="border-top: solid thin">
                <th align="left" valign="middle">Capital</th>
                <th align="left" valign="middle">Replacement</th>
                <th align="left" valign="middle" style="border-right: solid thin">O&amp;M</th>
                <th align="left" valign="middle">Capital</th>
                <th align="left" valign="middle">Replacement</th>
                <th align="left" valign="middle">Variable O&amp;M</th>
              </tr>
            </thead>
            <tbody>
              <tr style="border-top: solid thin">
                <td align="left" valign="middle" style="border-right: solid thin">Diesel Generator</td>
                <td align="left" valign="middle">$360/kW</td>
                <td align="left" valign="middle">$360/kW</td>
                <td align="left" valign="middle" style="border-right: solid thin">$0.30/h</td>
                <td align="left" valign="middle">-</td>
                <td align="left" valign="middle">-</td>
                <td align="left" valign="middle">-</td>
              </tr>
              <tr>
                <td align="left" valign="middle" style="border-right: solid thin">Fuhrländer 250 Wind Turbine</td>
                <td align="left" valign="middle">$850,000</td>
                <td align="left" valign="middle">$850,000</td>
                <td align="left" valign="middle" style="border-right: solid thin">$21,900/year</td>
                <td align="left" valign="middle">-</td>
                <td align="left" valign="middle">-</td>
                <td align="left" valign="middle">-</td>
              </tr>
              <tr>
                <td align="left" valign="middle" style="border-right: solid thin">VRB</td>
                <td align="left" valign="middle">$650/kW</td>
                <td align="left" valign="middle">$650/kW</td>
                <td align="left" valign="middle" style="border-right: solid thin">$40.63/kW</td>
                <td align="left" valign="middle">$300/kWh</td>
                <td align="left" valign="middle">$300/kWh</td>
                <td align="left" valign="middle">$0.01/kWh</td>
              </tr>
              <tr>
                <td align="left" valign="middle" style="border-right: solid thin">Converter</td>
                <td align="left" valign="middle">$900/kW</td>
                <td align="left" valign="middle">$900/kW</td>
                <td align="left" valign="middle" style="border-right: solid thin">0</td>
                <td align="left" valign="middle">-</td>
                <td align="left" valign="middle">-</td>
                <td align="left" valign="middle">-</td>
              </tr>
            </tbody>
          </table>
        </table-wrap>
      </sec>
    </sec>
    <sec>
      <title>4. Simulation Results</title>
      <sec>
        <title>4.1. Optimal System Architecture</title>
        <p>Results from the simulation suggest significant environmental and financial benefits are to be gained in installing a VRB as an integration technology for remote wind/diesel power systems. HOMER calculated the following optimal system architecture from the input data (<xref ref-type="table" rid="applsci-02-00726-t004">Table 4</xref>):</p>
        <table-wrap id="applsci-02-00726-t004" position="float">
          <object-id pub-id-type="pii">applsci-02-00726-t004_Table 4</object-id>
          <label>Table 4</label>
          <caption>
            <p>Optimal system architecture.</p>
          </caption>
          <table>
            <thead>
              <tr>
                <th align="left" valign="middle">Component</th>
                <th align="left" valign="middle">Size</th>
              </tr>
            </thead>
            <tbody>
              <tr>
                <td align="left" valign="middle">Wind Turbine</td>
                <td align="left" valign="middle">7 × 250 kW</td>
              </tr>
              <tr>
                <td align="left" valign="middle">Diesel Generator #1</td>
                <td align="left" valign="middle">300 kW</td>
              </tr>
              <tr>
                <td align="left" valign="middle">Diesel Generator #2</td>
                <td align="left" valign="middle">600 kW</td>
              </tr>
              <tr>
                <td align="left" valign="middle">Vanadium Redox Battery</td>
                <td align="left" valign="middle">1,000 kW</td>
              </tr>
              <tr>
                <td align="left" valign="middle">VRB Electrolyte Storage</td>
                <td align="left" valign="middle">18,000 kWh</td>
              </tr>
              <tr>
                <td align="left" valign="middle">Converter</td>
                <td align="left" valign="middle">800 kW</td>
              </tr>
            </tbody>
          </table>
        </table-wrap>
        <p>As can be seen, the rated power output of the optimal VRB (1,000 kW) matches the peak load of the system suggesting favourable use of the VRB over the alternative of supplementing wind power with diesel generation. Furthermore, the very large optimal storage capacity of 18,000 kWh also suggests HOMER favours the use of the VRB over the diesel generators in times of minimal wind turbine output.</p>
        <p>Good use is made of the VRB throughout the year, especially in times of little or no wind. <xref ref-type="fig" rid="applsci-02-00726-f007">Figure 7</xref>–<xref ref-type="fig" rid="applsci-02-00726-f009">Figure 9</xref> indicate the output of power from the wind and VRB for each month of the calendar year. As is evident from the diagrams, in times of little or no wind power output, the VRB is used, demonstrated by the low state-of-charge (SOC) at these times. The frequency histogram (<xref ref-type="fig" rid="applsci-02-00726-f009">Figure 9</xref>) demonstrates that the VRB is in a minimal state of charge for approximately 12% of the year and a high SOC for about 45% of the year, suggesting there is still potential for more VRB use; an important consideration given the intermittency of wind power and the potential variations in wind output from year to year.</p>
        <fig id="applsci-02-00726-f007" position="anchor">
          <label>Figure 7</label>
          <caption>
            <p>Daily wind turbine power output over a 12 month period.</p>
          </caption>
          <graphic xmlns:xlink="http://www.w3.org/1999/xlink" xlink:href="applsci-02-00726-g007.tif"/>
        </fig>
        <fig id="applsci-02-00726-f008" position="anchor">
          <label>Figure 8</label>
          <caption>
            <p>Vanadium Redox Battery (VRB) state of charge variations over a twelve month period.</p>
          </caption>
          <graphic xmlns:xlink="http://www.w3.org/1999/xlink" xlink:href="applsci-02-00726-g008.tif"/>
        </fig>
        <fig id="applsci-02-00726-f009" position="anchor">
          <label>Figure 9</label>
          <caption>
            <p>VRB state-of-charge frequency histogram.</p>
          </caption>
          <graphic xmlns:xlink="http://www.w3.org/1999/xlink" xlink:href="applsci-02-00726-g009.tif"/>
        </fig>
        <p>A significant reduction in the use of the diesel generators and the reliance on diesel fuel is observed with the inclusion of a VRB in the wind/diesel system. This is made evident by a comparison of identical systems with and without a VRB installed. <xref ref-type="fig" rid="applsci-02-00726-f010">Figure 10</xref> and <xref ref-type="fig" rid="applsci-02-00726-f011">Figure 11</xref> graphically displayed the use of the 600 kW diesel generator in these systems.</p>
        <fig id="applsci-02-00726-f010" position="anchor">
          <label>Figure 10</label>
          <caption>
            <p>600 kW diesel generator use in wind/diesel/VRB system over 12 month period.</p>
          </caption>
          <graphic xmlns:xlink="http://www.w3.org/1999/xlink" xlink:href="applsci-02-00726-g010.tif"/>
        </fig>
        <fig id="applsci-02-00726-f011" position="anchor">
          <label>Figure 11</label>
          <caption>
            <p>600 kW diesel generator use in wind/diesel system without VRB storage.</p>
          </caption>
          <graphic xmlns:xlink="http://www.w3.org/1999/xlink" xlink:href="applsci-02-00726-g011.tif"/>
        </fig>
        <p>As these figures demonstrate, there is far greater reliance on the diesel generators in the absence of a VRB. With the inclusion of a VRB the role of the diesel generators shift from the primary base source of power to a necessary supplement in the event of sustained periods of little or no wind.</p>
      </sec>
      <sec>
        <title>4.2. System Cost Analysis</title>
        <p>An examination of the breakdown of system costs gives further indication as to why HOMER favours the use of the VRB over diesel generators. <xref ref-type="table" rid="applsci-02-00726-t005">Table 5</xref> summarises the system costs as calculated by HOMER.</p>
        <table-wrap id="applsci-02-00726-t005" position="float">
          <object-id pub-id-type="pii">applsci-02-00726-t005_Table 5</object-id>
          <label>Table 5</label>
          <caption>
            <p>Cost breakdown.</p>
          </caption>
          <table>
            
            <tbody>
              <tr>
                <td rowspan="2" align="left" valign="middle">
                  <bold>Component</bold>
                </td>
                <td align="left" valign="middle">
                  <bold>Initial Capital</bold>
                </td>
                <td align="left" valign="middle">
                  <bold>Annualized Capital</bold>
                </td>
                <td align="left" valign="middle">
                  <bold>Annualized Replacement</bold>
                </td>
                <td align="left" valign="middle">
                  <bold>Annual O&amp;M</bold>
                </td>
                <td align="left" valign="middle">
                  <bold>Annual Fuel</bold>
                </td>
                <td align="left" valign="middle">
                  <bold>Total Annualized</bold>
                </td>
              </tr>
              <tr style="border-top: solid thin">
                <td align="left" valign="middle">($)</td>
                <td align="left" valign="middle">($/year)</td>
                <td align="left" valign="middle">($/year)</td>
                <td align="left" valign="middle">($/year)</td>
                <td align="left" valign="middle">($/year)</td>
                <td align="left" valign="middle">($/year)</td>
              </tr>
              <tr style="border-top: solid thin">
                <td align="left" valign="middle">Fuhrländer 250</td>
                <td align="left" valign="middle">5,950,000</td>
                <td align="left" valign="middle">465,449</td>
                <td align="left" valign="middle">158,066</td>
                <td align="left" valign="middle">153,300</td>
                <td align="left" valign="middle">0</td>
                <td align="left" valign="middle">776,815</td>
              </tr>
              <tr>
                <td align="left" valign="middle">Diesel #1</td>
                <td align="left" valign="middle">108,000</td>
                <td align="left" valign="middle">8,448</td>
                <td align="left" valign="middle">638</td>
                <td align="left" valign="middle">61,290</td>
                <td align="left" valign="middle">69,240</td>
                <td align="left" valign="middle">139,616</td>
              </tr>
              <tr>
                <td align="left" valign="middle">Diesel #2</td>
                <td align="left" valign="middle">216,000</td>
                <td align="left" valign="middle">16,897</td>
                <td align="left" valign="middle">2,094</td>
                <td align="left" valign="middle">132,300</td>
                <td align="left" valign="middle">122,387</td>
                <td align="left" valign="middle">273,677</td>
              </tr>
              <tr>
                <td align="left" valign="middle">Battery</td>
                <td align="left" valign="middle">6,050,000</td>
                <td align="left" valign="middle">473,272</td>
                <td align="left" valign="middle">−42,243</td>
                <td align="left" valign="middle">11,270</td>
                <td align="left" valign="middle">0</td>
                <td align="left" valign="middle">442,298</td>
              </tr>
              <tr>
                <td align="left" valign="middle">Converter</td>
                <td align="left" valign="middle">720,000</td>
                <td align="left" valign="middle">56,323</td>
                <td align="left" valign="middle">19,127</td>
                <td align="left" valign="middle">0</td>
                <td align="left" valign="middle">0</td>
                <td align="left" valign="middle">75,451</td>
              </tr>
              <tr>
                <td align="left" valign="middle">Totals</td>
                <td align="left" valign="middle">13,044,000</td>
                <td align="left" valign="middle">1,020,389</td>
                <td align="left" valign="middle">137,682</td>
                <td align="left" valign="middle">358,160</td>
                <td align="left" valign="middle">191,626</td>
                <td align="left" valign="middle">1,707,857</td>
              </tr>
            </tbody>
          </table>
        </table-wrap>
        <p>The figures presented in <xref ref-type="table" rid="applsci-02-00726-t005">Table 5</xref> are calculated by HOMER assuming a 25-year project lifetime. The total net present cost (NPC) at the end of the 25-year project is $21,832,144 giving a levelized cost of energy of 29.6 ¢/kWh. Although the 1 MW/18 MWh VRB has a high initial capital cost of $6.05 million, the total annualized cost is comparable to the two diesel generators, despite this high initial capital cost.</p>
        <p>It is in the cost of diesel and the operating and maintenance costs that the VRB distinguishes it from the diesel generators. The VRB has relatively low annual operating and maintenance (O&amp;M) costs with the added benefits of a negative annualized replacement (owing to the long life of the electrolyte) and the lifetime fuel source effectively covered in the initial capital cost. In contrast, the diesel generators have higher O&amp;M costs with the disadvantage of being dependent on an increasingly expensive fuel source. It is for these reasons that HOMER favours the use of a VRB to diesel generators. To further illustrate this point, cost data from the comparison between identical wind/diesel systems with and without a VRB installed is included in <xref ref-type="table" rid="applsci-02-00726-t006">Table 6</xref>.</p>
        <table-wrap id="applsci-02-00726-t006" position="float">
          <object-id pub-id-type="pii">applsci-02-00726-t006_Table 6</object-id>
          <label>Table 6</label>
          <caption>
            <p>Comparison of identical wind/diesel systems with and without a VRB.</p>
          </caption>
          <table>
            <thead>
              <tr>
                <th align="left" valign="middle"> </th>
                <th align="left" valign="middle">Wind/Diesel/VRB System</th>
                <th align="left" valign="middle">Wind/Diesel System</th>
              </tr>
            </thead>
            <tbody>
              <tr>
                <td align="left" valign="middle">
                  <bold>Renewable Penetration</bold>
                </td>
                <td align="left" valign="middle">96.2%</td>
                <td align="left" valign="middle">85.7%</td>
              </tr>
              <tr>
                <td align="left" valign="middle">
                  <bold>Total NPC</bold>
                </td>
                <td align="left" valign="middle">$21,832,144</td>
                <td align="left" valign="middle">$33,731,252</td>
              </tr>
              <tr>
                <td align="left" valign="middle">
                  <bold>Levelized Cost of Energy</bold>
                </td>
                <td align="left" valign="middle">29.6 ¢/kWh</td>
                <td align="left" valign="middle">45.7 ¢/kWh</td>
              </tr>
              <tr>
                <td align="left" valign="middle">
                  <bold>Annual Diesel Fuel Costs</bold>
                </td>
                <td align="left" valign="middle">$191,626</td>
                <td align="left" valign="middle">$844,456</td>
              </tr>
              <tr>
                <td align="left" valign="middle">
                  <bold>Carbon Emissions</bold>
                </td>
                <td align="left" valign="middle">315,384 kg/year</td>
                <td align="left" valign="middle">1,389,831 kg/year</td>
              </tr>
            </tbody>
          </table>
        </table-wrap>
        <p>As <xref ref-type="table" rid="applsci-02-00726-t006">Table 6</xref> indicates, considerable financial and environmental benefits are to be gained in installing a VRB in this system. An improvement of over 10% renewable penetration is achieved with the use of a VRB. This equates to $11.9 million in savings over the 25-year life of the project and over 1,000 tonnes per year reduction in carbon emissions. The consumer is afforded a 16.1 ¢/kWh break in the cost of electricity. Furthermore, the wind/diesel system has far more financial exposure to the rising price of diesel. With the inevitable increase in the cost of diesel fuel, the cost differences between the two systems are realistically expected to be even greater.</p>
      </sec>
    </sec>
    <sec sec-type="conclusions">
      <title>5. Conclusions</title>
      <p>This study used the HOMER Micropower Optimization Model program to evaluate the feasibility of the Vanadium Redox Battery in realistic remote wind/diesel power systems. These models indicated considerable financial and environmental benefits could be gained in installing a VRB. HOMER favoured the use of a VRB over diesel generators owing to its low operating and maintenance costs and independence from an increasingly expensive fuel source like diesel. Simulated wind/diesel systems servicing a 1 MW peak demand with a 1,000 kW rated power and 18,000 kWh capacity VRB installed observed a 10% increase in renewable penetration, $11.9 million saving in costs over the 25-year life of the project and a 1,000 tonne annual reduction in carbon emissions.</p>
    </sec>
  </body>
  <back>
    <ref-list>
      <title>References</title>
      <ref id="B1-applsci-02-00726">
        <label>1.</label>
        <citation citation-type="book">
          <person-group person-group-type="author">
            <name>
              <surname>Roberts</surname>
              <given-names>P.</given-names>
            </name>
          </person-group>
          <source>The End of Oil—The Decline of the Petroleum Economy and the Rise of a New Energy Order</source>
          <publisher-name>Bloomsbury Publishing</publisher-name>
          <publisher-loc>London, UK</publisher-loc>
          <year>2004</year>
        </citation>
      </ref>
      <ref id="B2-applsci-02-00726">
        <label>2.</label>
        <citation citation-type="patent">
          <person-group person-group-type="author">
            <name>
              <surname>Skyllas-Kazacos</surname>
              <given-names>M.</given-names>
            </name>
            <name>
              <surname>Robins</surname>
              <given-names>R.G.</given-names>
            </name>
          </person-group>
          <article-title>All-Vanadium Redox Battery</article-title>
          <source>U.S. Patent</source>
          <patent>4,786,567</patent>
          <year>1986</year>
          <comment>Australian Patent 575247, 1986; Japan Patent 2724817, 1986.</comment>
         </citation>
      </ref>
      <ref id="B3-applsci-02-00726">
        <label>3.</label>
        <citation citation-type="journal">
          <person-group person-group-type="author">
            <name>
              <surname>Skyllas-Kazacos</surname>
              <given-names>M.</given-names>
            </name>
            <name>
              <surname>Kasherman</surname>
              <given-names>D.</given-names>
            </name>
            <name>
              <surname>Hong</surname>
              <given-names>R.</given-names>
            </name>
            <name>
              <surname>Kazacos</surname>
              <given-names>M.</given-names>
            </name>
          </person-group>
          <article-title>Characteristics and performance of 1 kW vanadium redox battery</article-title>
          <source>J. Power Sources</source>
          <year>1991</year>
          <volume>35</volume>
          <fpage>399</fpage>
          <lpage>404</lpage>
          <pub-id pub-id-type="doi">10.1016/0378-7753(91)80058-6</pub-id>
        </citation>
      </ref>
      <ref id="B4-applsci-02-00726">
        <label>4.</label>
        <citation citation-type="confproc">
          <person-group person-group-type="author">
            <name>
              <surname>Largent</surname>
              <given-names>R.</given-names>
            </name>
            <name>
              <surname>Skyllas-Kazacos</surname>
              <given-names>M.</given-names>
            </name>
            <name>
              <surname>Chieng</surname>
              <given-names>J.</given-names>
            </name>
          </person-group>
          <article-title>Improved PV System Performance Using Vanadium Batteries</article-title>
          <source>Proceedings of 23rd IEEE Photovoltaic Specialists Conference</source>
          <conf-loc>Louisville, KY, USA</conf-loc>
          <conf-date>10–14 May 1993</conf-date>
        </citation>
      </ref>
      <ref id="B5-applsci-02-00726">
        <label>5.</label>
        <citation citation-type="book">
          <person-group person-group-type="author">
            <name>
              <surname>Skyllas-Kazacos</surname>
              <given-names>M.</given-names>
            </name>
          </person-group>
          <article-title>An Historical Overview of the UNSW Vanadium Redox Battery Development</article-title>
          <source>Vanadium—Geology, Processing and Applications, COM2002</source>
          <person-group person-group-type="editor">
            <name>
              <surname>Taner</surname>
              <given-names>M.</given-names>
            </name>
            <name>
              <surname>Riveros</surname>
              <given-names>P.</given-names>
            </name>
            <name>
              <surname>Dutrizac</surname>
              <given-names>J.</given-names>
            </name>
            <name>
              <surname>Gattrell</surname>
              <given-names>M.</given-names>
            </name>
            <name>
              <surname>Perron</surname>
              <given-names>L.</given-names>
            </name>
          </person-group>
          <publisher-name>MetSoc</publisher-name>
          <publisher-loc>Montreal, Canada</publisher-loc>
          <year>2002</year>
          <month>August</month>
          <day>11-14</day>
        </citation>
      </ref>
      <ref id="B6-applsci-02-00726">
        <label>6.</label>
        <citation citation-type="journal">
          <person-group person-group-type="author">
            <name>
              <surname>Skyllas-Kazacos</surname>
              <given-names>M.</given-names>
            </name>
          </person-group>
          <article-title>Novel vanadium chloride/polyhalide redox flow battery</article-title>
          <source>J. Power Sources</source>
          <year>2003</year>
          <volume>24</volume>
          <fpage>299</fpage>
          <lpage>302</lpage>
          <pub-id pub-id-type="doi">10.1016/S0378-7753(03)00621-9</pub-id>
        </citation>
      </ref>
      <ref id="B7-applsci-02-00726">
        <label>7.</label>
        <citation citation-type="journal">
          <person-group person-group-type="author">
            <name>
              <surname>Vafiadis</surname>
              <given-names>H.</given-names>
            </name>
            <name>
              <surname>Skyllas-Kazacos</surname>
              <given-names>M.</given-names>
            </name>
          </person-group>
          <article-title>Evaluation of membranes for the novel vanadium bromine redox flow cell</article-title>
          <source>J. Membrane Sci.</source>
          <year>2006</year>
          <volume>279</volume>
          <fpage>394</fpage>
          <lpage>402</lpage>
          <pub-id pub-id-type="doi">10.1016/j.memsci.2005.12.028</pub-id>
        </citation>
      </ref>
      <ref id="B8-applsci-02-00726">
        <label>8.</label>
        <citation citation-type="web">
        <collab>HOMER—Analysis of Micropower System Options (NREL)</collab>
           <access-date>(accessed on 13 October 2006)</access-date>
          <comment>Available online:<ext-link xmlns:xlink="http://www.w3.org/1999/xlink" xlink:href="http://www.nrel.gov/homer/" ext-link-type="uri">http://www.nrel.gov/homer/</ext-link></comment>
        </citation>
      </ref>
      <ref id="B9-applsci-02-00726">
        <label>9.</label>
        <citation citation-type="book">
          <person-group person-group-type="author">
            <name>
              <surname>Lambert</surname>
              <given-names>T.</given-names>
            </name>
            <name>
              <surname>Gilman</surname>
              <given-names>P.</given-names>
            </name>
            <name>
              <surname>Lilienthal</surname>
              <given-names>P.</given-names>
            </name>
          </person-group>
          <article-title>Micropower System Modelling with HOMER</article-title>
          <source>Integration of Alternative Sources of Energy</source>
          <publisher-name>John Wiley &amp; Sons</publisher-name>
          <publisher-loc>Hoboken, NJ, USA</publisher-loc>
          <year>2006</year>
        </citation>
      </ref>
      <ref id="B10-applsci-02-00726">
        <label>10.</label>
        <citation citation-type="web">
        <collab>National Electricity Market Management Company (NEMMCO)</collab>
         
          <access-date>(accessed on 13 October 2006)</access-date>
          <comment>Available online:<ext-link xmlns:xlink="http://www.w3.org/1999/xlink" xlink:href="http://www.nemmco.com.au/" ext-link-type="uri">http://www.nemmco.com.au/</ext-link></comment>
        </citation>
      </ref>
      <ref id="B11-applsci-02-00726">
        <label>11.</label>
        <citation citation-type="web">
        <collab>Fuhrländer</collab>
         
          <access-date>(accessed on 13 October 2006)</access-date>
          <comment>Available online:<ext-link xmlns:xlink="http://www.w3.org/1999/xlink" xlink:href="http://www.fuhrlaender.de/" ext-link-type="uri">http://www.fuhrlaender.de/</ext-link></comment>
        </citation>
      </ref>
      <ref id="B12-applsci-02-00726">
        <label>12.</label>
        <citation citation-type="web">
        <collab>Fuel Watch</collab>
        
          <access-date>(accessed on 3 June 2006)</access-date>
          <comment>Available online:<ext-link xmlns:xlink="http://www.w3.org/1999/xlink" xlink:href="http://www.fuelwatch.wa.gov.au/prices/dsp_hist_avg.cfm" ext-link-type="uri">http://www.fuelwatch.wa.gov.au/prices/dsp_hist_avg.cfm</ext-link></comment>
        </citation>
      </ref>
      <ref id="B13-applsci-02-00726">
        <label>13.</label>
        <citation citation-type="web">
        <collab>Bloomberg Professional (TM) Service</collab>
           <access-date>(accessed on 3 August 2006)</access-date>
          <comment>Available online:<ext-link xmlns:xlink="http://www.w3.org/1999/xlink" xlink:href="www.bloomberg.com" ext-link-type="uri">www.bloomberg.com</ext-link></comment>
        </citation>
      </ref>
      <ref id="B14-applsci-02-00726">
        <label>14.</label>
        <citation citation-type="confproc">
          <article-title>Assessment of Diesel Use in Remote Area Power Supply</article-title>
          <source>Australian Greenhouse Office Report</source>
          <conf-loc>Canberra, Australia</conf-loc>
          <conf-date>1999</conf-date>
        </citation>
      </ref>
      <ref id="B15-applsci-02-00726">
        <label>15.</label>
        <citation citation-type="web">
          <article-title>Reserve Bank of Australia-Inflation Calculator</article-title>
          <access-date>(accessed on 11 October 2006)</access-date>
          <comment>Available online:<ext-link xmlns:xlink="http://www.w3.org/1999/xlink" xlink:href="http://www.rba.gov.au/calculator/calc.go" ext-link-type="uri">http://www.rba.gov.au/calculator/calc.go</ext-link></comment>
        </citation>
      </ref>
    </ref-list>
  </back>
</article>
