Human colorectal cancer (CRC) and normal formalin-fixed paraffin-embedded (FFPE) tissue samples were provided by the Institute of Pathology and Cytology of the Dr. Horst Schmidt Kliniken (HSK) in Wiesbaden. 8–14 serial 3 µm-thick paraffin sections were kept at 60 °C for 10 min, deparaffinized (xylol, ethanol) and used for RNA isolation afterwards.
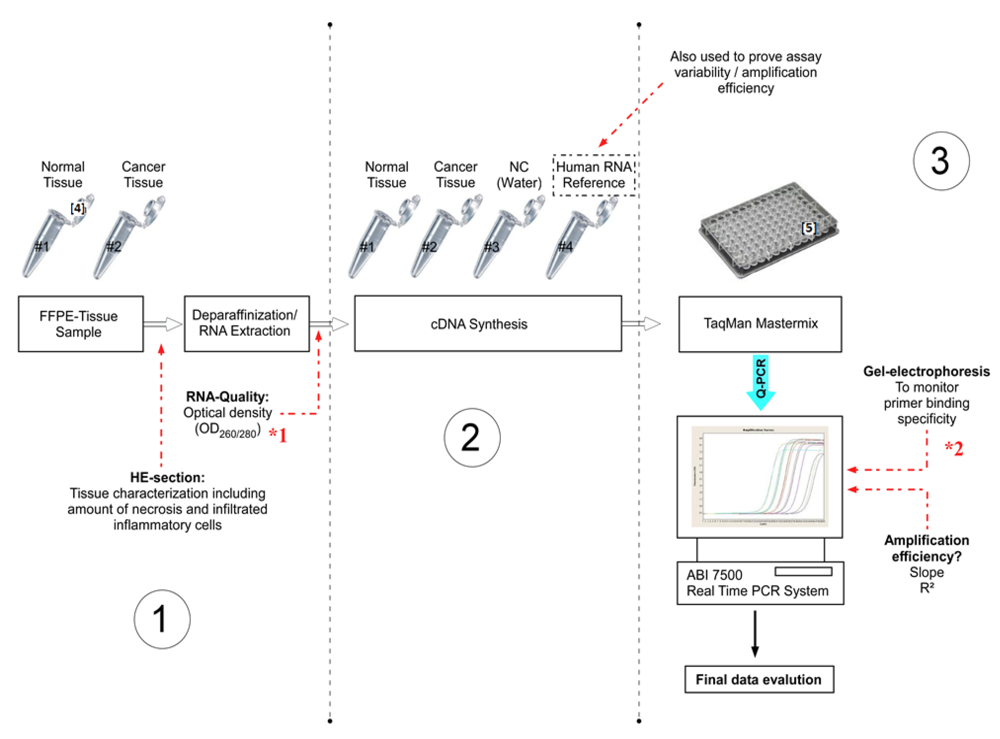
Figure 1.
Experimental design (Step 1–3) of the present study, including important checkpoints (à) to provide quality assessment. (NC = Negative control).
Step 1: FFPE Tissue Sample Characterization, Deparaffinization and RNA Extraction
*1 The RNA quality can be checked by optical density measurements. For RNA integrity the Bioanalyzer 2100 or Experion can be used.
*2 Alternatively, the amplification specificity can be determined by dissociation curve analysis.
• Checkpoint: Tissue Sample Characterization
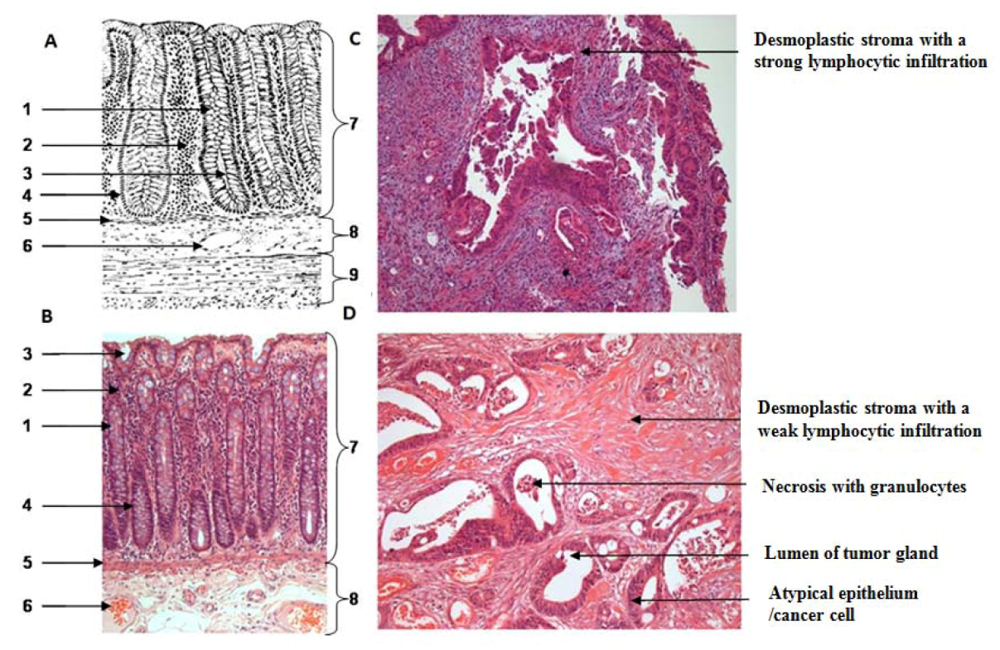
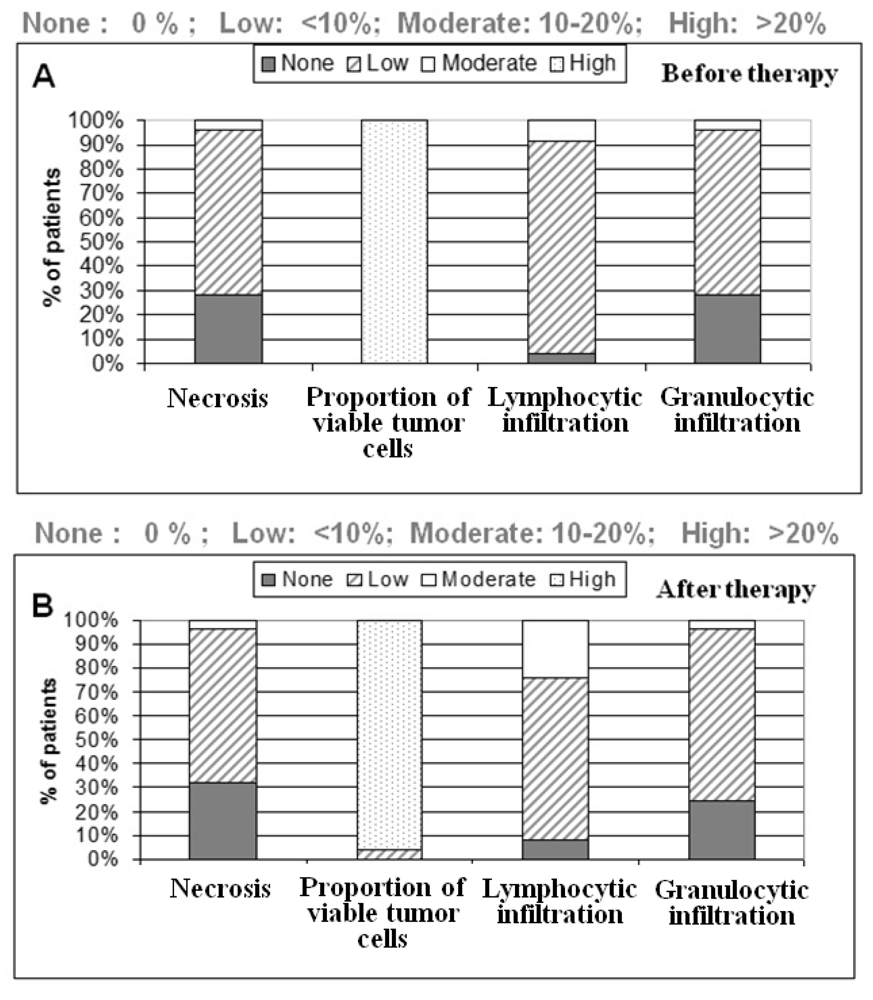
One section per case was HE (hematoxylin & eosin) stained for further characterization of tissue samples regarding the amount of necrosis and inflammatory cells. All tumor samples were diagnosed as low to moderately-differentiated colorectal tumors. All patients were treated with 5-fluoruracil (5-FU) and a total dose of 50.4 Gy. Further patient demographics and clinicopathological findings are depicted in the result part.
The nucleic acid material was isolated from deparaffinized samples manually by using the Recover All Isolation Kit (Ambion) according to the manufacturer´s instructions, with the addition of a 16-h proteinase K lysis step for protein degradation. To avoid DNA contamination interfering with the desired “specific amplification”, the RNA samples were treated with RNase-free DNase.
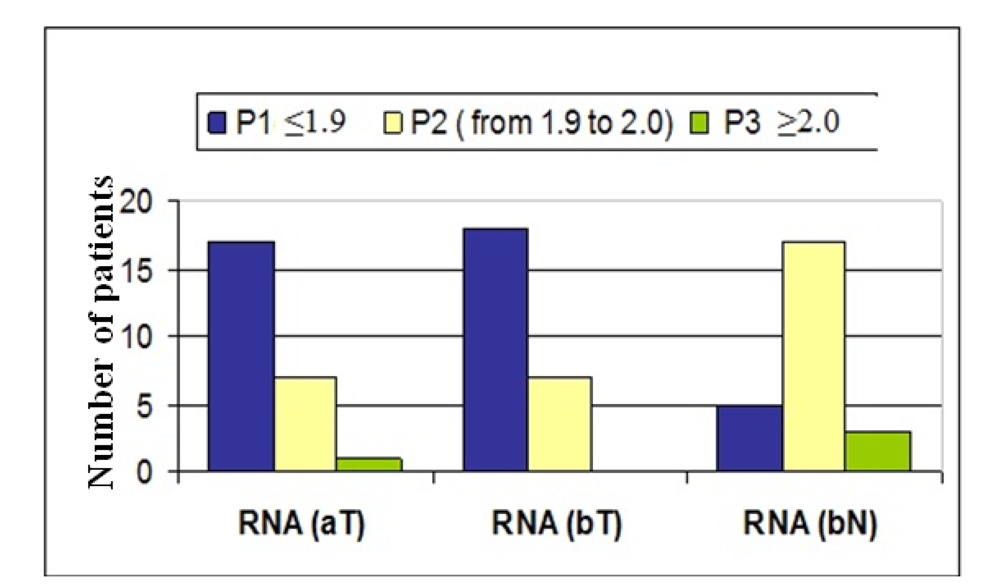
• Checkpoint: Optical Density (A260/280) Measurements of RNA Samples
All nucleic acid concentrations were measured with the NanoPhotometer (Implen). The purity of nucleic acid was assessed by determining the ratio of the absorbance at 260 and 280 nm (A
260/280) as basic control. An acceptable and realistic nucleic acid quality of FFPE material has an optical density (OD A
260/280) ranging from 1.8 to 2.1 [
6].
The RT efficiency can be affected through salt contaminations, phenols, other alcohols, and inhibitors carried over from RNA isolation process [
7]. To assess the RNA integrity by electophoretic separation, the Agilent 2100 Bioanalyzer (Agilent Technologies, USA) or the Experion (Bio-Rad Laboratories, USA) can be used [
8]. Undegraded RNA is essential for reliable gene expression analyses. In our study, the RNA integrity was observed by agarose gel electrophoresis. A disadvantage of this method may be the appearance of smears in the case of FFPE-samples. In contrast to miRNA (about ~25 nt (nucleotide) in size) analysis which is growing in importance in oncology, mRNA (up to 10 kb) is more easily degraded by cleavage of RNAes during tissue sampling, purification and storage which also varies significantly between laboratories [
9].
Step 2: cDNA Synthesis: Reverse Transcriptase PCR (RT-PCR)
The mRNA strand was first reverse transcribed into its single stranded cDNA (complementary DNA) using the High Capacity cDNA Reverse Transcription Kit (ABI), containing all components necessary for quantitative conversion. The kit includes Random Primers, optimized RT Buffer, dNTP’s, RNase Inhibitor and MultiScribe™ MuLV reverse transcriptase.
The cDNA was then further amplified through a quantitative real-time PCR (Q-PCR). For comparative Q-PCR, normal and carcinoma tissue of the same patient were reverse transcribed. Stable “Human RNA-Reference” (Stratagene) was used for assay validation purposes. To confirm the absence of contaminants, a negative control (water control) should be included in the experimental design (
Figure 1). A positive control (artificial template with defined concentration) can be used to detect the presence of PCR-inhibitors. To examine the quality and yield of cDNA, two primer pairs of a stable reference gene (~1 kb apart) can be used. The C
T -value of the 5´end primer pair should not exceed that of the 5´end pair by more than 1 C
T [
9].
Step 3: Quantitative Real-Time PCR (Q-PCR)
Different technologies exist to investigate the transciptome on RNA level. For instance, the microarray analysis may examine the gene expression of thousands of genes (up to 20,000) in a short time but has a high variability and insufficient sensitivity. Another technique to analyze the mRNA expression level is the RT-PCR by HPLC separation and UV detection or high resolution gel electrophoresis followed by densitometric analysis. In addition, gene quantification can be determined by LightCycler (Roche) or ABI 7500 technologies using “hybridization probes” [
9]. The latter one with up to a 96-well standard format was used in this study.
The best-known probe system, which has also been used in the present study, is ABI’s TaqMan [
7]. The TaqMan gene expression assay is a ready to use 5'-3'
Taq polymerase assay containing TaqMan
® dye-labeled probes (FAM/TAMRA) and desired primers as listed in
Table 1.
Table 1.
Highly purified salt-free primers for gene targeting (ABI).
Table 1.
Highly purified salt-free primers for gene targeting (ABI).
| Gene | Gene Symbol | Assay | Location | Amplicon-Length |
|---|
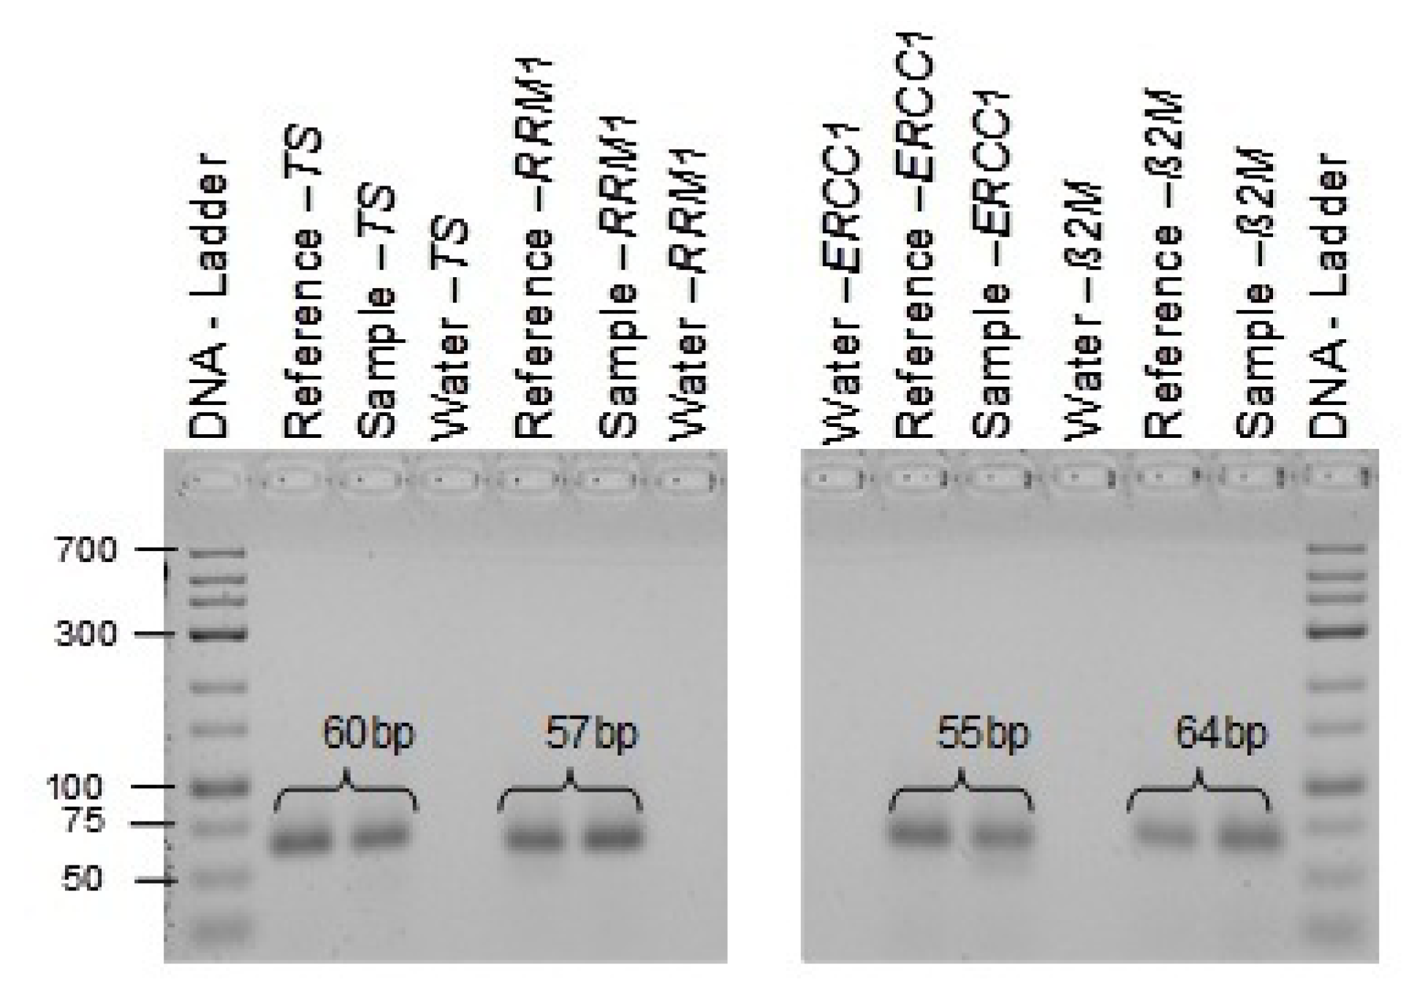
| Thymidylate-Synthase | TYMS | Hs00426586_m1 | Exon 6-7 | 60 bp |
| β-2-Microglobulin | β-2m | Hs00187842_m1 | Exon 1-2 | 64 bp |
| Ribonucleotide Reductase M1 | RRM1 | Hs01040705_m1 | Exon 8-9 | 57 bp |
| Excision Repair Cross-Complementing Repair Gene, Complementation group 1 | ERCC1 | Hs01012158_m1 | Exon 3-4 | 55 bp |
In contrast to the available SYBR-green based detection, TaqMan probes detect specific amplification products only.
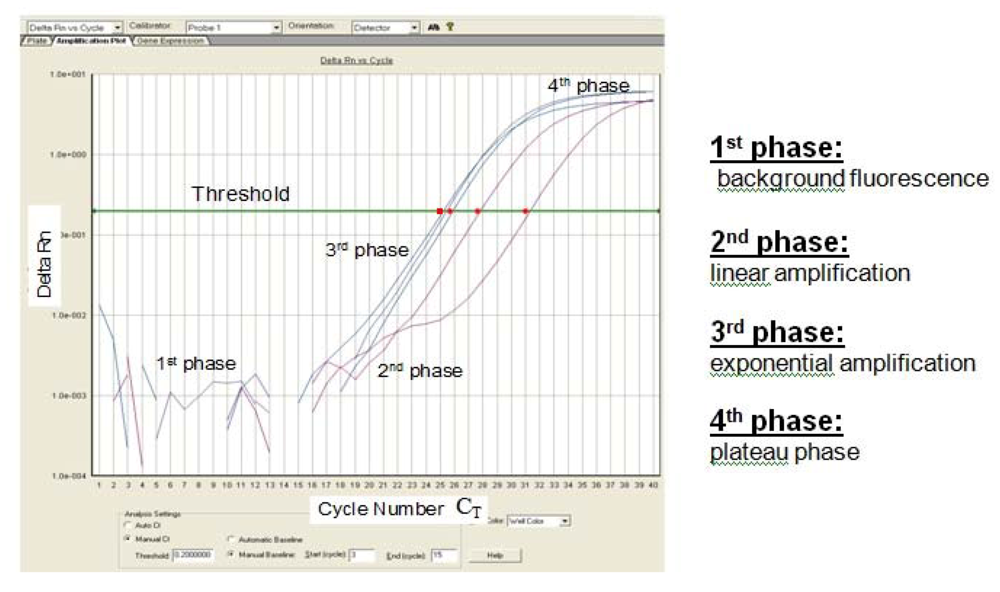
Probe hydrolysis separates fluorophore and quencher, which results in an increased fluorescence signal which can be measured. This method enables fluorescent monitoring of amplified DNA in real time, at which a threshold amount of amplicon cDNA is produced. The cycle threshold (C
T) value describes the point at which the fluorescence crosses the threshold (
Figure 2). According to Pfaffl, the Q-PCR reaction can be divided into four characteristic phases (
Figure 2) [
7].
Figure 2.
Sigmoidal-shaped amplification plot showing increases in fluorescence signal (phase 1–4). Fluorescence signal
versus cycle number (C
T).
Delta Rn (= (Rn
+) − (Rn
-)) indicates the magnitude of the signal intensity generated by a given set of PCR conditions. A decreased C
T value (x axis) indicates a higher amount of starting template. The Rn
- value is obtained as a ratio for a PCR without template (the no-template control) and the Rn
+ value is the ratio of FAM fluorescence intensity to the fluorescence intensity of the passive reference dye (ROX) included in the reaction mixture for a PCR with template [
7].
The amount of amplified target is directly proportional to the input amount of target during the exponential phase of PCR amplification.
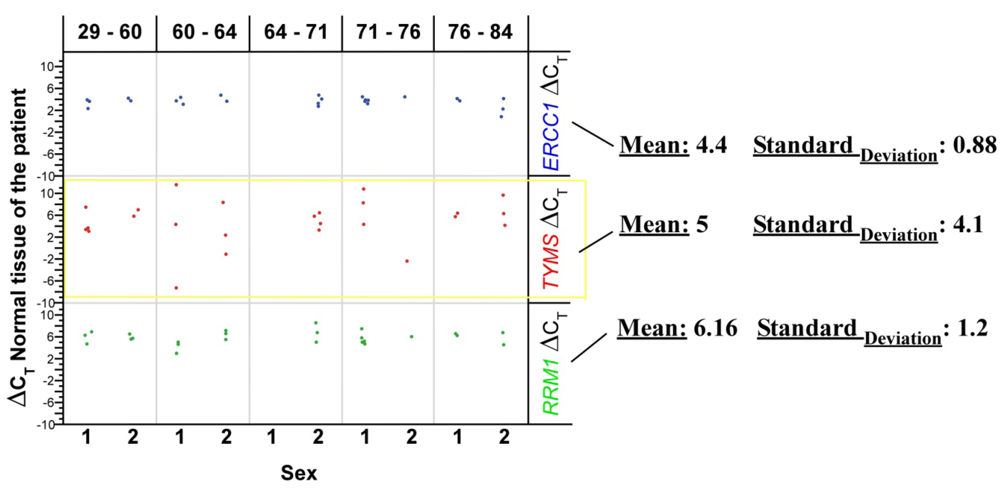
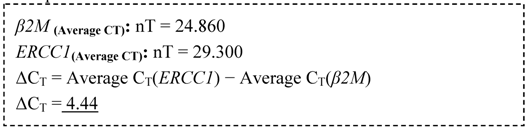
By using the CT data, the gene mRNA expression can be explored. The output data of quantitative PCR are shown and discussed in detail later. ß2-microglobulin (ß2M), a component of the MHC (Major Histocompatibility Complex) class I molecule, was used as endogenous control and normalization factor for the RNA concentration of each sample. Thus, in this experiment, ß2-microglobulin gene content should remain constant relative to total nucleic acid. For a comparative gene expression analysis, the specific individual normal tissue of the patient was used as calibrator.
• Checkpoint: Confirmation of Primer Specificity and Amplified PCR End Products
The real-time PCR end product was later documented by 4% ethidium bromide agarose gel staining to ensure proper target amplification, which results in a single band with the desired length (
Table 1). Generally, the typical dissociation curve is applied to detect nonspecific amplification in cDNA samples.
• Checkpoint: Test of Endogenous Housekeeping Genes as Adequate Internal Controls
Many classical non-regulated (housekeeping) genes are described. But the biggest problem is that their mRNA expression can be regulated significantly, depending, for instance, on the kind of treatment: in this case, radiochemotherapy (necrosis? inflammation?). Therefore, variances in the target tissue were also investigated between individuals to avoid misinterpretation of biologically relevant information [
2,
7]. The most common housekeeping genes are, for instance, actins, tubulins, microglobulins and ribosomal RNAs (18S rRNA and 28S rRNA). To investigate the optimal reference gene for normalization of the target gene among all samples, online available programs,
i.e., geNorma or Bestkeeper, can be applied.
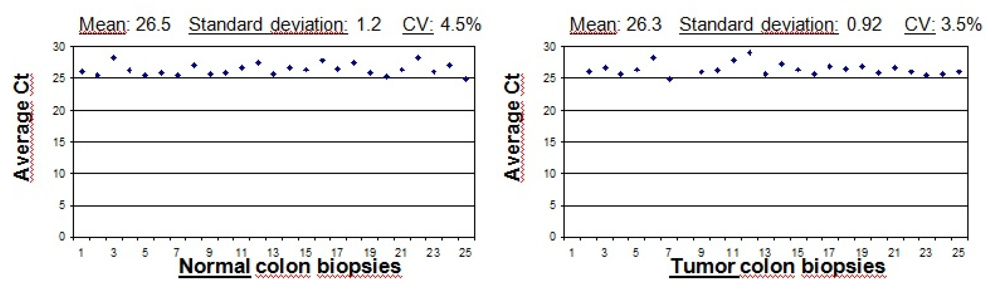
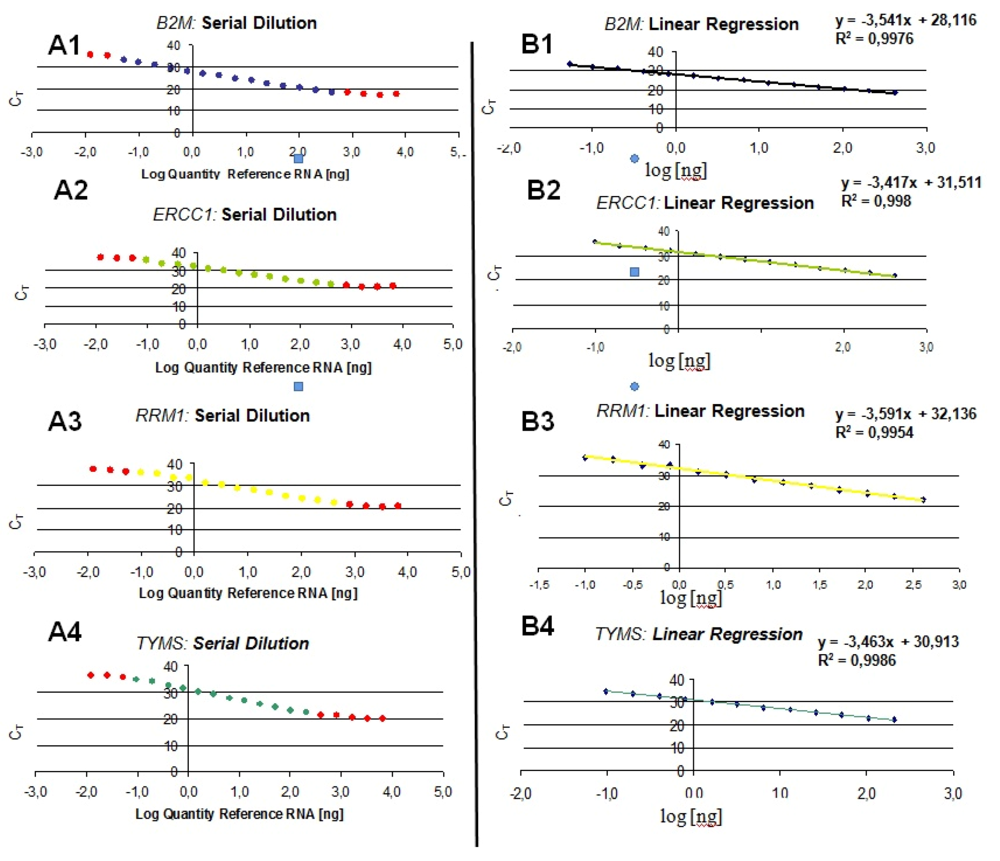
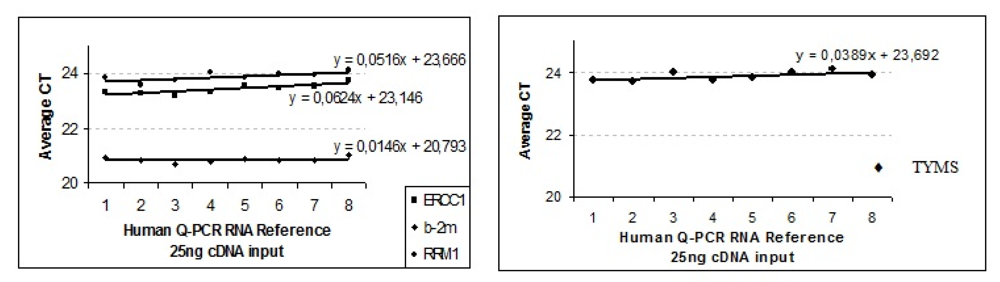
• Checkpoint: Determination of Inter- and Intra-assay variances as well as Individual Amplification Efficiencies, Including the Dynamic Range
The efficiency of the transcription and Q-PCR was estimated via a standard calibration dilution curve using a conventional RNA Reference (Stratagene) and slope calculation for each assay as B2M, ERCC1, TYMS and RRM1. Slopes between −3.1 and −3.8 are acceptable, giving reaction efficiencies between 90 and 100%. Linear regression analysis indicates the dynamic range. To reduce inter-assay variations, target gene unspecific random-hexamer primers are used to synthesize a cDNA pool (alternatively, octamer- or decamer-primers are available).
If gene-specific PCR primers are designed to produce short products and facilitate multiparallel quantitative analysis, usual criteria such as the GC content (40%, 60%) as well as the length (18 to 25 bases) and Tm (60 ± 1 °C) should be keep in mind [
9].
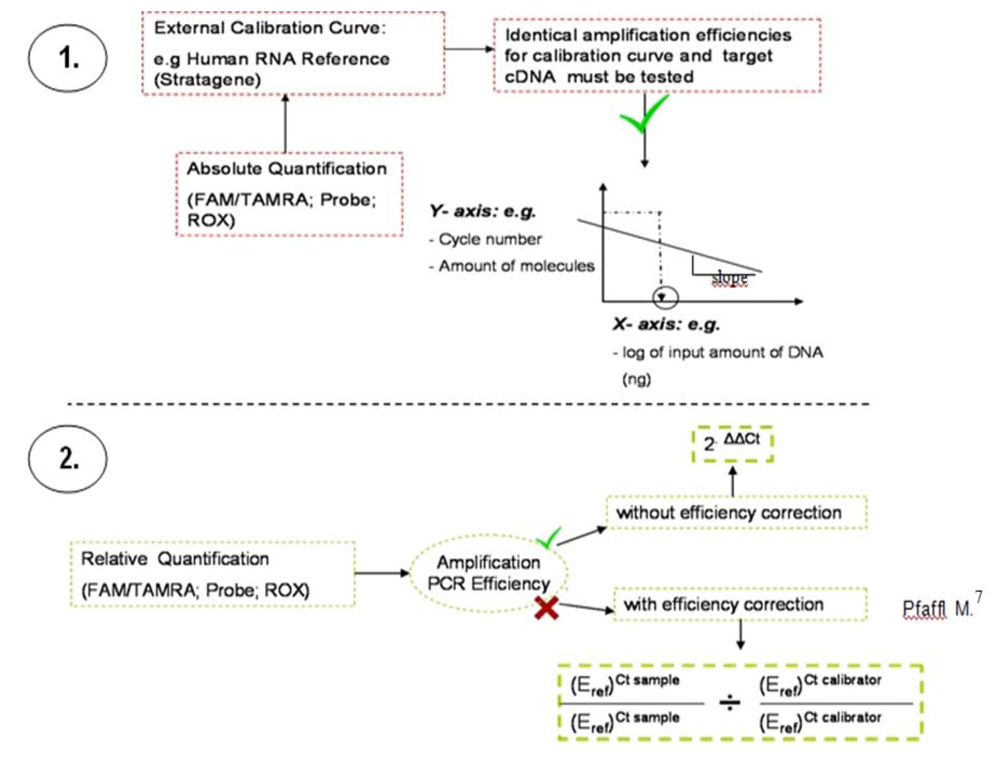
2.1. Final Data Evaluation
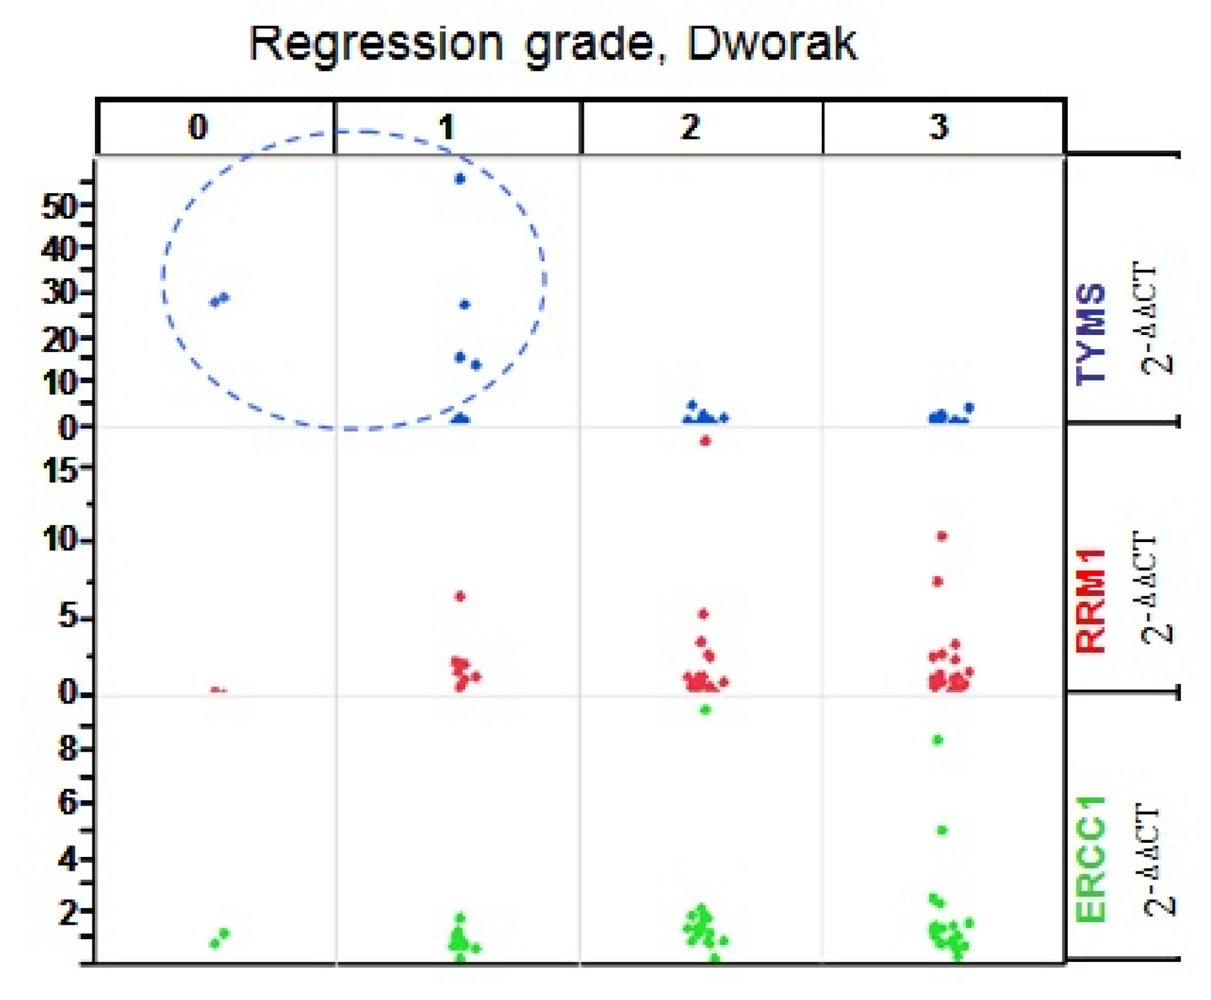
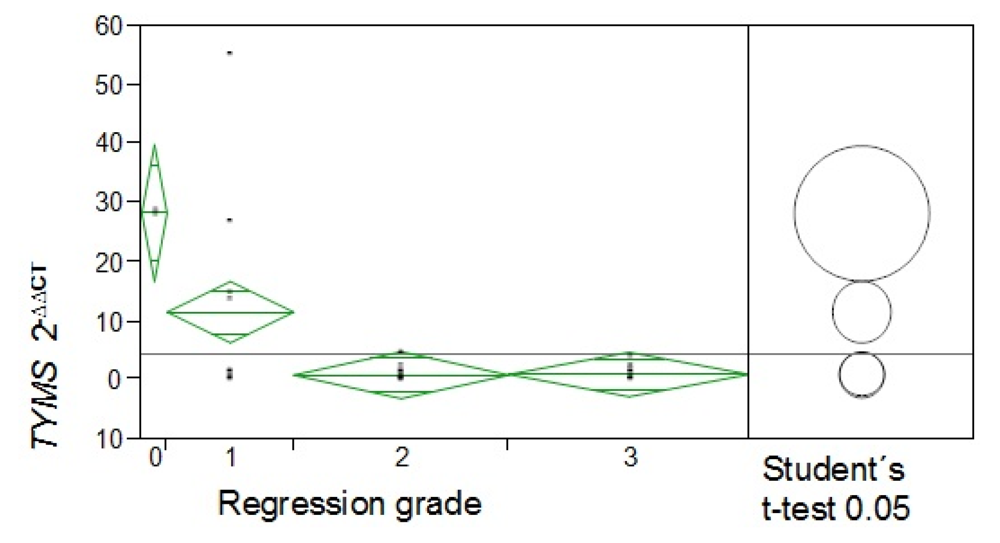
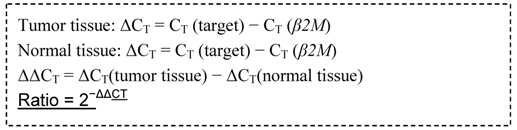
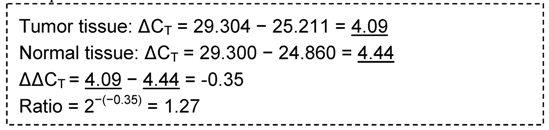
Many mathematical and statistical methods exist to evaluate the quantification of mRNA populations. However, the best method to analyze the output data remains an issue of discussion. In the present study, the comparative method (2–ΔΔCt), represented as x-fold expression, was used to compare the mRNA levels of the desired gene in colorectal cancer cells, before and after radiochemotherapeutic treatment, versus non-neoplastic cells.
The following figure (
Figure 3) illustrates the two widely-applied methodologies for Q-PCR data analysis: relative and absolute quantification. dsDNA melting curve analysis should be performed at the end of the PCR run.
Figure 3.
Methodology used to evaluate Q-PCR data. The absolute quantification (1.) relates the PCR signal (cycle number) to the input amount of DNA, using a calibration curve. By use of regression line analysis the amplification efficiency of the whole PCR system can be monitored. Relative quantification (2.) is based on the expression levels of a target gene versus the individual normal tissue of the patient (calibrator). Normalization is undertaken by a non-regulated endogenous gene expression, e.g., derived from classical and frequently described housekeeping genes, here ß2M.


 RRM1 = p = 0.001