

Ethanolic Extracts of Six Cultivated Mushrooms as a Source of Bioactive Compounds
by
 , , ,
, , ,
Wojciech Radzki
1 ,
,
Krzysztof Tutaj
2,*,
Katarzyna Skrzypczak
1,
Monika Michalak-Majewska
1 and
Waldemar Gustaw
1 1
Department of Fruits, Vegetables and Mushrooms Technology, Faculty of Food Sciences and Biotechnology, University of Life Sciences in Lublin, Skromna 8, 20-704 Lublin, Poland
2
Department of Biochemistry and Toxicology, University of Life Sciences in Lublin, Akademicka 13, 20-950 Lublin, Poland
*
Author to whom correspondence should be addressed.
Appl. Sci. 2024, 14(1), 66; https://doi.org/10.3390/app14010066
Submission received: 5 December 2023
/
Revised: 15 December 2023
/
Accepted: 18 December 2023
/
Published: 20 December 2023
(This article belongs to the Special Issue Natural Products and Bioactive Compounds)
Abstract
:Freeze-dried stems and caps of six cultivated mushroom species, namely Agaricus bisporus (white) Agaricus bisporus (brown), Lentinula edodes, Pholiota nameko, Pleurotus eryngii and Pleurotus ostreatus were subjected to ethanolic extraction. The obtained extracts were analyzed in terms of total phenolics content, total flavonoids content and antioxidant capacity, and the results were calculated per gram of mushroom dry weight and extract dry weight. The LC–MS technique was applied to determine the profiles of phenolic acids. The amount of total phenolics in the stems (per the fruiting bodies’ dry weight) ranged from 1.09 ± 0.09 mg/g (P. ostreatus) to 4.02 ± 0.20 mg/g (the white A. bisporus), whereas in the caps it ranged from 1.49 ± 0.07 mg/g (P. nameko) to 6.22 ± 0.21 mg/g (the brown A. bisporus). The total flavonoid content in the stems (per the fruiting bodies’ dry weight) varied from 0.46 ± 0.05 mg/g (P. ostreatus) to 1.72 ± 0.02 mg/g (the brown A. bisporus), and in the caps it ranged from 0.48 ± 0.01 mg/g (P. ostreatus) to 1.93 ± 0.05 mg/g (the white A. bisporus). The antioxidant potential measured with the FRAP assay showed that the caps displayed higher activity compared to the stems. However, in the case of the DPPH assay performed on A. bisporus, this relationship was inverted. Different species contained varied concentrations of phenolic acids. P. eryngii caps contained the highest amount of 3,4-DHBA, L. edodes caps were the richest source of caffeic acid, whereas the highest amount of syringic acid was observed in L. edodes stems. The caps of P. nameko contained the highest amounts of p-coumaric and t-cinnamic acid, as well as 4-hydroxybenzaldehyde.
1. Introduction
The origins of mushroom cultivation date back to the 11th century, when shiitake mushrooms (Lentinula edodes) began to be cultivated on logs in China. In Europe, the first cultivation of button mushrooms (Agaricus bisporus) began in the seventeenth century in France [1]. A significant increase in the production of edible mushrooms took place at the beginning of the twentieth century, when the technology for cultivation on an industrial scale was developed. Currently, about 20 species of mushroom are produced on an industrial scale [2] and the most commonly cultivated genres/species in the world are Lentinula edodes (with a production share of 26%), Pleurotus ostreatus and Pleurotus eryngii (21%), Auricularia (21%) and Agaricus bisporus (11%) [3]. Since mushrooms are valued primarily for their culinary and nutritional values, most of the fruiting bodies produced are intended for consumption. Nevertheless, in recent decades there has been a sharp increase in the popularity of mushrooms in Western countries, due to their numerous health-promoting properties. Mushroom-based products such as dietary supplements, nutraceuticals and medicines have appeared on the market [4].
The health-promoting potential of fungi is related to their various activities, including immunomodulating, cardioprotective, antimicrobial, antiviral, antioxidant and antitumor behaviors [5]. Compounds such as high-molecular polysaccharides, terpenes and proteins are primarily responsible for the antitumor effect. Cardioprotective effects are attributed to compounds such as polysaccharides, or low-molecular weight compounds which decrease the content of cholesterol in the blood (lovastatin, erythadenine) [6]. The antioxidant effect of mushroom fruiting bodies is mainly caused by the presence of phenolic compounds and, to a lesser extent, by vitamins, sterols or unpurified polysaccharides [7]. Polysaccharides, terpenes, phenolic acids and proteins were reported to exert antiviral properties [8], while antimicrobial effects were attributed mainly to oxalic acid, benzoic acid, peptides and terpenes [9].
Dietary supplements and nutraceuticals based on mushrooms often have a form of concentrated extract, either aqueous or alcoholic, with varying degrees of purification. These extracts can be in the form of solutions but also can be dried, and sold as powders or tablets [4]. The raw materials used for their production are primarily the fruiting bodies of cultivated edible or inedible mushrooms (sometimes referred to as medical). In order to reduce the cost of the production of mushroom extracts, manufacturers try to use inferior raw materials (too-small or too-large fruiting bodies, or fruiting bodies with fully-open caps), as well as production waste such as stems [10]. It is worth noting that the content of individual bioactive components in mushrooms varies depending on the morphological parts of the fruiting body. So far, this has been the subject of several studies. Some authors reported a higher content of total phenolic compounds and antioxidant capacity in mushroom caps [11,12]. Similarly, other authors reported substantially higher content of protein in caps than in stems [13]. On the other hand, in the case of high-molecular-weight polysaccharides, this relationship may be reversed [14].
In order to optimally use mushrooms as a raw material, it seems to be justified to determine the content of biologically active compounds in different parts of the fruiting bodies. Therefore, the purpose of this study was to investigate the caps and stems of six cultivated mushroom species in terms of the content of bioactive substances. The study involved determining the total phenolic compounds and flavonoids, as well as measuring the antioxidant potential of the obtained mushroom extracts. By employing liquid chromatography coupled with a mass spectrometer, the profiles of phenolic acids in stems and caps were compared among the species, which significantly fills the gap in the literature. To our knowledge, the analysis of phenolic acid content in the caps and stems of cultivated mushrooms has not been the subject of research so far. Additionally, an important aspect of this study is that ethyl alcohol was used as a solvent to obtain the extracts. Unlike the frequently used methanol, ethanol belongs to the GRAS solvents (Generally Recognized as Safe) [15]. Therefore, the products extracted with this alcohol can be used as dietary supplements or food additives without any obstacles and are perceived as safer by consumers.
2. Materials and Methods
2.1. Raw Material
Six cultivated mushroom species, namely Agaricus bisporus (white), Agaricus bisporus (brown), Lentinula edodes, Pholiota nameko, Pleurotus eryngii and Pleurotus ostreatus, were used in the experiment. Fresh fruiting bodies (3 kgs for every species) were provided by one producer (Tomasz Grela, Dąbrówka, Poland), belonged to one crop and were produced in an ecologic manner (certified ecologic production). Mushrooms were divided into stems and caps and freeze-dried separately for 72 h using the Alpha 1–3 freeze dryer (Christ, Osterode, Germany). The fruiting bodies were subjected to a lyophilization process within approximately two hours after the harvest. Dried samples were then ground into fine powder with the GM200 mill (Retsch, Haan, Germany). For each species, the percentage of stems and caps was determined (Table 1). These calculations allowed us to determine the content of individual bioactive compounds in the whole fruiting bodies.
2.2. Solvent Extraction
Powdered stems and caps (0.4 g) were transferred into Falcon tubes and mixed with 80% ethanol (v/v) at the ratio of 1:30. The tubes were shaken for 30 min at 50 °C and 160 rpm using the Incu Shaker Mini (Benchmark Scientific, Sayreville, NJ, USA). The obtained extracts were separated through centrifugation (4200× g, 30 min) and stored at −20 °C prior to analysis. The extractions were performed in triplicate and yields were calculated and expressed as %. Ethanolic extracts were further used for the colorimetric determination of bioactive compounds and antioxidant activities, as well as chromatographic determination of phenolic acids.
2.3. Total Phenolics and Flavonoids Content
The total phenolics content in ethanolic extracts was measured spectrophotometrically using the methodology described by [16]. Briefly, samples (0.1 mL) were mixed with 0.6 mL of Folin–Ciocalteau reagent (ten times diluted) and 1.35 mL of 5% (w/v) Na2CO3. After incubation without light (15 min, room temperature), samples were measured spectrophotometrically at 565 nm using the Helios Gamma spectrometer (Thermo, Waltham, MA, USA). Different concentrations of gallic acid were applied to construct the calibration curve.
The total flavonoids content in ethanolic extracts was determined according to the method described by Jia et al. [17]. Samples (0.5 mL) were mixed with distilled water (1.25 mL) and 75 µL of NaNO2. The mixtures were incubated for 5 min and 150 µL of AlCl3 solution was added. After secondary incubation (6 min), 0.5 mL of NaOH solution was added. The mixtures were measured at 510 nm with the Helios Gamma spectrometer (Thermo, USA). The calibration curve was constructed with different concentrations of quercetin.
2.4. Antioxidant Capacity
The ferric-reducing antioxidant power (FRAP) assay, developed by [18], was used to determine antioxidant activity. FRAP reagent was prepared by mixing three solutions (300 mM acetate buffer, 10 mM 2,4,6-tripyridyl-striazine (TPTZ) dissolved in 40 mM HCl and 20 mM FeCl3 ∙ 6H2O) at the ratio 10:1:1. Aliquots of samples (0.1 mL) were mixed with freshly prepared FRAP reagent (1.9 mL), shaken and incubated for 15 min at 37 °C. Measurements were carried out at 593 nm using the Helios Gamma spectrometer (Thermo, USA). The calibration curve was prepared using Trolox, and results were expressed as Trolox equivalents (TE) per one gram of mushroom dry weight.
The capacity to scavenge DPPH (1,1-diphenyl-2-picrylhydrazyl) radicals was determined according to [19]. The extracts (0.1 mL) were mixed with ethanolic solution of DPPH (0.2 mM). After 15 min of incubation at room temperature (in the dark), the mixtures were measured spectrophotometrically at 517 nm (Helios Gamma, Thermo, USA). The results were expressed as Trolox equivalents per one gram of mushroom dry weight.
2.5. Determination of Phenolic Acids Profile
The concentration of phenolic compounds was determined by means of a high performance liquid chromatograph (ExionLC AD, AB Sciex, Framingham, MA, USA) coupled with a mass spectrometer (QTRAP 6500+, AB Sciex, Framingham, MA, USA), according to the procedure described earlier [20], with some modifications: instead of 0.1% formic acid in water, the eluent A contained 0.1% of formic acid and 10 mmol/L ammonium formate. Chromatographic separation of ethanolic extracts was carried out on a Kinetex Biphenyl (100 mm × 3 mm, 2.6 μm particle size) column (Phenomenex, Torrance, CA, USA). Column temperature was set at 35 °C. The mobile phase flow rate was 0.4 mL/min and the injection volume was 5 µL. The gradient started at 5% B (0.1% formic acid in acetonitrile), was held there for 1 min, and increased to 22% B at 2 min. Subsequently, the gradient was increased to 28% at 5.0 min, then held there for 1 min, and increased to 70% at 10 min and to 95% at 11 min, held isocratically from 11 to 12 min and then returned to initial conditions over 0.1 min with a total run time of 14 min. The mass spectrometer operated with an electrospray (ESI) ion source in the negative ion mode. The data were collected in the scheduled multiple reactions monitoring (sMRM) mode. Parameters: temperature of the ion source: 600 °C; curtain gas (CUR): 35; collision gas—nitrogen (CAD): high; ion spray voltage (IS): −4500; ion source gas 1 (GS1): 70; ion source gas 2 (GS2): 60; entrance potential (EP): −10. Compound specific MRM parameters—retention times, precursor ion (Q1), product ions (Q3), collision energy (CE), declustering potential (DP) and collision cell exit potential (CXP)—are listed in Table 2 and were optimized for each phenolic compound. Analyst 1.7.2 software (AB Sciex, Framingham, MA, USA) was used to control the LC/MS/MS system. SCIEX OS Version 2.1.6.59781 (AB Sciex, Framingham, MA, USA) was used for data processing. The identification of each of the components of the extracts was performed using the standards of phenolic compounds. The main peaks found in the extracts were identified by comparing, using the retention times and mass spectra, with those of authentic standards. An internal standard calibration method for the quantification of phenolic compounds was applied. Individual stock solutions of the standards were prepared by dissolving approximately 4 mg (accurately weighed) into separate 10 mL amber glass tubes and adding 80% ethanol to the final concentration of 1 mg/mL. From the stock solutions, a mix solution was prepared at 10 µg/mL. Then, for quantification, the mix solution was serially diluted to generate nine calibration standard solutions in the range of 0.1–500 ng/mL. Calibration solutions were prepared in an extraction solution (80% ethanol), in which the solutions contained varying amounts of standards and a consistent amount of trans-cinnamic-d7 (final concentration 100 ng/mL). Each of the calibration levels were analyzed through LC–MS, and the relative responses (response of phenolic acid/response of trans-cinnamic-d7) of the standard solutions were plotted against the relative amounts (amount of phenolic acid/amount of trans-cinnamic-d7) to create a calibration curve. For peak integration, the MQ4 algorithm was used. Over a relevant range of phenolic acid levels, a linear equation was generated for use in the determination of phenolic acids in the extracts (Table S1 in the Supplementary Materials). Each of the ethanolic extract solutions was prepared as stated in Section 2.2 and contained an equivalent amount of internal standard as in the calibration standards (trans-cinnamic-d7 acid, final concentration 100 ng/mL). When the extract was analyzed, the relative responses of the phenolic acid and trans-cinnamic-d7, along with the known amount of trans-cinnamic-d7 added, allowed the authors to determine the unknown phenolic acid concentration using the previously established linear equation. The lowest concentration (1 ng/mL) obtained from the calibration curve was set as the LLOQ. All the prepared solutions were stored at −20 °C before the analysis. The individual standards of phenolic compounds (QC—quality controls) were run before and after unknown samples. Phenolic compounds, LC–MS grade water, ACN, ammonium formate and formic acid were purchased from Sigma Aldrich (St. Louis, MO, USA).
2.6. Statistical Analysis
The extractions and all the measurements were carried out in triplicate. The results were expressed as mean ± standard deviation (SD). The data was compared using unidirectional analysis of variance (ANOVA) with the level of significance set at p < 0.05. Tukey’s test was performed to compare different data. Statistica v. 13 software was used to analyze the data.
3. Results and Discussion
3.1. Extraction Yield
Extraction yields of ethanolic extracts are presented in Table 3. Comparing the whole fruiting bodies, the highest extraction yields were recorded for A. bisporus (white), A. bisporus (brown) and P. eryngii, reaching approximately ~40%. Contrastingly, P. ostreatus showed the lowest yield (~18%). In a previous study, the extraction yield from P. ostreatus was substantially higher and accounted for almost 30%, whereas for A. bisporus (white) the yield was similar to the present study [21]. The highest differences between stems and caps were noticed in P. nameko and P. ostreatus, where caps gave lower yields compared to stems. In the cases of P. eryngii and A. bisporus (brown), these differences were not substantial. On the contrary, the caps of species like L. edodes and A. bisporus (white) gave higher yields compared to their stems.
3.2. The Content of Total Phenolics
The assay with the Phenol–Ciocalteau reagent is a common and low-cost method to quantify the total level of phenolic compounds in a sample. Nevertheless, the unquestionable disadvantage of this method is the low sensitivity. It should be kept in mind that due to the low specificity of the Phenol–Ciocalteau reagent, the results of this analysis may be overestimated [22]. The concentration of the total phenolics is presented in Figure 1a,b. Figure 1a shows the content of phenolics, calculated per one gram of mushroom dry weight. The quantity of phenolics in whole fruiting bodies ranged from 1.50 ± 0.09 (P. nameko) to 5.57 ± 0.19 (A. bisporus (brown)). The high concentration of phenolics in ethanolic extracts obtained from the brown A. bisporus supports previous findings in the literature [21]. Likewise, Palacios [23] reported that the content of phenolics in this mushroom was approximately twice of that of P. ostreatus and amounted to ~3 mg/g. The results showed that the brown button mushroom is approximately 21% richer in phenolics compared to the white button mushroom. This is in agreement with earlier studies where A. bisporus (brown) contained ~24% more phenolics than A. bisporus (white) [24]. There was also a difference in the level of phenolics content between two Pleurotus species. In the case of P. ostreatus it reached 5.57 ± 0.19 mg/g, whereas in the case of P. eryngii a significantly lower quantity was found (4.61 ± 0.14 mg/g). This observation is consistent with that of Shreya et al. [25], who reported that P. ostreatus contained approximately 44% more phenolics compared to P. eryngii.
With regard to the distribution of phenolics in fruiting bodies, in almost all cases caps were significantly richer in these compounds. These results match those observed in earlier studies. It has been observed that methanolic extracts from A. bisporus (white) caps contained approximately 44% more phenolic compounds than those from stems [26]. In this study, however, the difference was significantly lower (~19%), which could be caused by the use of a different solvent. Similarly, Hong et al. [27] noticed that L. edodes caps had ~24% more phenolics than stems (in this study the difference amounted to ~54%). Interestingly, in contrast to this study, Zhang and coworkers [28] observed that stems of L. edodes were substantially richer in phenolics compared to their caps. It is also worth noting that the present study showed that, in the case of P. nameko, phenolics were distributed equally between caps and stems. The starkest difference can be observed in P. ostreatus, where the content of phenolic compounds in caps was almost three times higher than in stems. The specific distribution of phenolic compounds can vary among different mushroom species and even within the same species. A few factors play a key role here, like the environment in which they are grown, as well as the stage of development. Moreover, the concentration of phenolics can also be also influenced by light exposure, temperature and substrate composition [29].
In order to evaluate which extract accumulated the highest quantity of phenolics, the data on extraction yields were taken into account. The calculated amounts of phenolics per one gram of an extract can be seen in Figure 1b. In general, ethanolic extracts were richer in phenolics compared to mushroom powders. The highest amounts were present in the extracts obtained from caps. The extracts can be ranked in the following order: P. ostreatus > A. bisporus (brown) > A. bisporus (white) > L. edodes, P. nameko, P. eryngii. However, in the cases of A. bisporus (white) and L. edodes, the extracts from stems contained phenolics at levels close to that of the extracts from caps (the differences did not exceed 13%). Interestingly, P. ostreatus is an example of a mushroom which produces a low yield of total soluble compounds, however much of these compounds could be classified as phenolics, according to the assay.
3.3. The Content of Total Flavonoids
Flavonoids, belonging to the polyphenols, are commonly found in nature as dyes. Their presence has also been found in mushrooms. The content of flavonoids per gram of dry weight of the fruiting bodies is shown in Figure 2a. Among the whole fruiting bodies, the lowest concentrations were noticed in P. ostreatus and P. eryngii (0.47 ± 0.02 mg/g and 0.51 ± 0.04 mg/g, respectively), while the highest were in A. bisporus (brown) followed by A. bisporus (white) (1.84 ± 0.04 mg/g and 1.64 ± 0.04 mg/g, respectively). The results of A. bisporus support the previous findings in which their flavonoids level was recorded at ~1.7 mg/g [30]. On the other hand, Palacios et al. [23] reported similar amounts of flavonoids in A. bisporus and P. ostreatus (approximately 1 mg/g).
In the case of three species (P. nameko, P. ostreatus and P. eryngii), flavonoids were distributed equally in the fruiting bodies. The caps of A. bisporus (brown) and L. edodes contained slightly higher amounts of flavonoids compared to the stems. However, in the case of the white A. bisporus the difference was very stark (the concentration in the caps was almost three times higher than in the stems). This outcome is contrary to that of Hong et al. [27]—who found slightly higher content of flavonoids in the stems of A. bisporus—but consistent with data obtained by Babu and Rao [26], who reported flavonoid concentration in caps at 2.173 ± 0.007 mg/g and in stems at 1.533 ± 0.005 mg/g.
When the contents of total flavonoids were expressed per one gram of extract dry weight, the values were several times larger, due to the concentration of these compounds. The highest levels of flavonoids were observed in the extracts from A. bisporus caps (white and brown), while much lower concentrations were observed in the extracts from P. nameko and P. ostreatus caps. Extracts from L. edodes and P. eryngii showed the lowest quantities, and in these cases, flavonoids were distributed equally in the fruiting bodies.
3.4. Phenolic Acids Profile
Several phenolic acids or their derivatives were detected in the mushrooms’ fruiting bodies. They can be seen in Figure 3, which contains an exemplary chromatogram obtained from P. nameko caps. As can be seen from Table 4, which shows the comparison of the whole fruiting bodies, the richest in 3,4-DHBA were P. eryngii > P. ostreatus > P. nameko. Significant amounts of caffeic acid was observed in L. edodes, P. nameko and A. bisporus (white). The content of syringic acid varied from 0.09 ± 0.01 µg/g (P. eryngii) to 1.53 ± 0.02 µg/g (P. nameko). With regard to p-coumaric acid, the richest sources were the fruiting bodies of P. nameko (3.00 ± 0.27 µg/g) followed by the brown A. bisporus (0.55 ± 0.06 µg/g). On the contrary, very small quantities of ferulic acid were found in all the tested species. T-cinnamic acid was detected in all the tested samples, which corresponds to previous findings by Chu et al. [31]. Substantial amounts of this compound were found in P. nameko (2.64 ± 0.06 µg/g) as well as in P. eryngii (1.15 ± 0.61 µg/g). In terms of 4-hydroxybenzaldehyde, its content ranged from 0.98 ± 0.04 µg/g (P. nameko) to 0.29 ± 0.02 µg/g (L. edodes). These results differ from previous findings in that many of the acids observed here have not been detected in the fruiting bodies of species such as A. bisporus, L. edodes, P. ostreatus, P. eryngii [32]. This discrepancy could be attributed to the less sensitive methods of detection (a photodiode array detector). In general, taking into consideration the total amounts of all the analyzed phenolic acids, the whole fruiting bodies could be ranked as follows: P. nameko > P. eryngii > P. ostreatus > L. edodes > A. bisporus (brown) > A. bisporus (white).
The contents of phenolic acids depended on the part of the fruiting body. In general, the caps contained more phenolic acids compared to the stems regardless of the species; however, some exceptions are listed below. In the case of A. bisporus (white), the stems contained slightly higher amounts of syringic acid, significantly higher content of 4-hydroxybenzaldehyde, and comparable amounts of ferulic and t-cinnamic acid. With regard to the brown A. bisporus, the stems were slightly richer in syringic acid and significantly richer in 4-hydroxybenzaldehyde. The stems of L. edodes contained almost three times more syringic acid and similar amounts of t-cinnamic acid compared to the caps. In the case of P. nameko, only 4-hydroxybenzaldehyde content was substantially higher in the stems. And finally, in the stems of P. ostreatus, caffeic and syringic acids were present in higher amounts, whereas in P. eryngii only syringic acid was richer. Ribeiro et al. [11] analyzed the fruiting bodies of two wild-growing species (Amanita rubescens, Suillus granulatus) and determined the p-hydroxybenzoic acid levels in different parts of each mushroom. Similar to the present findings, its content accumulated mostly in the caps.
The amounts of phenolic acids, when calculated per gram of extract, were substantially higher compared the values per gram of fruiting body. This finding is consistent with that of Ucar and Karadag [33], who reported approximately three times higher contents of phenolic acids in P. ostreatus extracts compared to fruiting bodies. The total sum of phenolic acids in the stems ranged from 3.97 µg/g (the white A. bisporus) to 14.03 µg/g (L. edodes), whereas in the caps it ranged from 4.9 µg/g (the white A. bisporus) to 50.26 µg/g (P. nameko).
3.5. Antioxidant Activity
Antioxidant properties are a frequently evaluated parameter of foodstuff. It is assumed that eating foods rich in antioxidants can help to protect the body from the harmful effects of free radicals. A frequently used method to determine general antioxidant properties is the ability to reduce iron ions (FRAP). Numerous studies indicate that mushrooms are a good source of antioxidant substances, which is also confirmed by these results. As shown in Figure 4a, the values of the FRAP parameter for the whole fruiting bodies ranged from 8.16 ± 0.11 µmoles/g (P. nameko) to 25.33 ± 0.86 µmoles/g (the white A. bisporus). High FRAP values of button mushrooms have been noticed previously. Radzki et al. [21] reported the FRAP capacity in the white A. bisporus at ~30 µmoles/g. Other authors reported exceptionally high FRAP activity in A. bisporus methanolic extracts in comparison to other cultivated or wild-growing species [34,35].
The caps exhibited higher FRAP antioxidant activity compared to the stems in all the investigated species except for P. nameko, where the stems displayed slightly higher antioxidant capacity. Similar to the content of phenolics, the most significant difference between the parts was noticed in P. ostreatus (the activity of the caps was approximately three times higher compared to the stems).
When the FRAP values were calculated per one gram of the dry extract (Figure 4b), it appeared that the strongest antioxidant capacity is displayed by the extracts obtained from P. ostreatus caps (97.38 ± 5.40 µmoles/g), followed by the caps of A. bisporus brown and white (67.00 ± 1.15 µmoles/g and 64.75 ± 1.43 µmoles/g, respectively). On the contrary, the weakest activity levels were reported in P. ostreatus stems (15.09 ± 0.53 µmoles/g). In most of the analyzed species the extracts from the stems displayed significantly lower antioxidant capacities. However, in the cases of A. bisporus (white) and P. eryngii, the differences were not so evident. These results support previous findings by [36], who noticed that methanolic extracts from L. edodes stems displayed lower activities compared to the caps. Moreover, [26] compared the FRAP values of the methanolic extracts obtained from the different parts of A. bisporus. They observed insubstantial differences between the stems and the caps, despite the fact that the caps contained significantly higher concentration of the total phenolics (~21 mg/g and 15 mg/g for the caps and the stems, respectively).
It is strongly recommended to use more than one antioxidant assay to evaluate properties of foodstuff, as various methods may produce quite different results. The reason for this is that these assays differ in their mechanisms of reaction and specificity [37]. The scavenging of DPPH radicals is a very common method which is used to determine the antioxidant capacity of mushroom-derived extracts. The activity range of whole mushrooms varied, as shown in Figure 5a, from 4.17 ± 0.12 µmoles/g (P. nameko) to 8.85 ± 0.10 µmoles/g (the brown A. bisporus). Interestingly, there was no statistically important difference between A. bisporus white and brown, although the brown contained a ~20% higher amount of total phenolics and a ~12% higher amount of total flavonoids. In this study P. ostreatus fruiting bodies showed significantly stronger scavenging potential compared to P. eryngii (5.41 ± 0.33 µmoles/g and 4.38 ± 0.06 µmoles/g, respectively). This finding is consistent with that of other authors who compared methanolic [32] or ethanolic [25] extracts obtained from these two Pleurotus strains.
The scavenging of DPPH radicals evidently depended on the part of the fruiting bodies from which the extracts were obtained. The stems of both white and brown A. bisporus showed slightly higher antioxidant capacity compared to the caps. In the case of P. eryngii no statistical difference was observed. With regards to L edodes and P. ostreatus, the caps exhibited significantly higher activities compared to the stems (almost twice and six times higher, respectively). Several previous reports have shown that mushrooms’ caps, when compared to the stems, exhibit slightly higher DPPH scavenging potential [11,36,38]. However, this study has been unable to demonstrate that. It could be explained by the fact that the activity depends on many other factors including species, cultivation methods, time of harvest and finally, the methods of extraction [39].
DPPH scavenging activity calculated per one gram of the extracts is shown in Figure 5b. The most striking result to emerge from the data is that the extract from P. ostreatus caps displayed exceptionally high potential (48.45 ± 1.85 µmoles/g) compared to other species. Taking into account that the extraction yield of the P. ostreatus caps was the lowest among the samples, this suggests that this extract contains the highest quantity of antioxidant compounds per gram. On the contrary, the lowest activity levels were exhibited by the P. ostreatus stems (3.57 ± 0.53 µmoles/g) followed by the P. nameko stems (8.79 ± 0.53 µmoles/g), P. eryngii stems and caps (10.85 ± 0.08 µmoles/g and 11.53 ± 0.95 µmoles/g, respectively), L. edodes stems (16.34 ± 0.84 µmoles/g) and finally, the caps of the white A. bisporus (21.06 ± 1.38 µmoles/g) and the brown A. bisporus (21.52 ± 1.28 µmoles/g).
The antioxidant values calculated per one gram of dry extract were substantially higher in comparison to the values expressed per one gram of fruiting body. These values can be useful in determining the antioxidant properties of the product which could be potentially used as a food additive. Many authors point to a high correlation between the content of total phenolic compounds and the activity of antioxidants. As can be seen from Table 5, correlations between antioxidant activities and the content of antioxidant compounds were established. A very strong correlation was observed between total phenolics content and FRAP values, which is in accordance with previous findings [35]. Similarly, a strong correlation (0.83) was found between total phenolics content and DPPH. Much weaker correlations were observed between total flavonoids content and antioxidant assays. However, both antioxidant assays correlated well with one another (0.86).
4. Conclusions
In this investigation, the aim was to analyze several cultivated mushrooms in terms of the content of bioactive compounds and antioxidant activity. Moreover, the crucial part of the research was the comparison between different parts of the mushrooms (stem, caps). The most obvious finding to emerge from this study is that that ethanolic extracts obtained from different species differ markedly in terms of total phenolics, flavonoids and phenolic acids, and display varied antioxidant activities. Because mushroom stems are usually less valuable to consumers, they are often a residue of production. The investigation of the stems has shown that in many cases they are a good source of bioactive compounds, and could potentially be a cheap raw material for the production of various foodstuffs, food supplements or nutraceuticals. However, due to the significant differences between species or varieties, it seems to be crucial to take into account the content of biologically active substances during the design of these products, in order to achieve the intended goal. Therefore, the limitation of this study is the number of bioactive compounds which was determined. Further studies could be carried out to quantify other antioxidant compounds (e.g., flavonoids, sterols) or the compounds showing entirely different biological activity. Moreover, as the content of many bioactive compounds is influenced by other factors (e.g., the stage of the fruiting bodies’ maturity, the methods of cultivation, the composition of media), a natural progression of this work would be to analyze the impact of these factors on the content of selected bioactive compounds.
Supplementary Materials
The following supporting information can be downloaded at: https://www.mdpi.com/article/10.3390/app14010066/s1, Table S1: Analytical parameters of LC-MS quantitative method; data for calibration curves, and lowest limit of quantification (LLOQ) and upper limit of quantification (ULOQ) values for each analyzed phenolic compound standard.
Author Contributions
Conceptualization, W.R.; methodology, W.R. and K.T.; validation, W.R., K.T. and K.S.; formal analysis, W.R.; investigation, W.R., K.T. and K.S.; resources, W.R. and W.G.; writing—original draft preparation, W.R.; writing—review and editing, W.R., M.M.-M. and W.G.; visualization, W.R.; supervision, W.G., M.M.-M. and K.S.; project administration, W.G. and K.S. All authors have read and agreed to the published version of the manuscript.
Funding
This study was financed as part of a program by the Minister of Education and Science, under the project name “Regional Initiative of Excellence” in 2019–2023, project number 029/RID/2018/19, funding amount 11,927,330.00 PLN.
Data Availability Statement
The data presented in this study are available upon request from the corresponding author. The data are not publicly available due to privacy.
Conflicts of Interest
The authors declare no conflict of interest.
References
- Sánchez, C. Modern Aspects of Mushroom Culture Technology. Appl. Microbiol. Biotechnol. 2004, 64, 756–762. [Google Scholar] [CrossRef] [PubMed]
- Siwulski, M.; Sobieralski, K.; Sas-Golak, I. Wartość Odżywcza i Prozdrowotna Grzybów. Żywność Nauk. Technol. Jakość. 2014, 21, 16–28. [Google Scholar] [CrossRef]
- Singh, M.; Kamal, S.; Sharma, V. Status and Trends in World Mushroom Production-III-World Production of Different Mushroom Species in 21st Century. Mushroom Res. 2021, 29, 75. [Google Scholar] [CrossRef]
- Reis, F.S.; Martins, A.; Vasconcelos, M.H.; Morales, P.; Ferreira, I.C.F.R. Functional Foods Based on Extracts or Compounds Derived from Mushrooms. Trends Food Sci. Technol. 2017, 66, 48–62. [Google Scholar] [CrossRef]
- Singh, M.P.; Rai, S.N.; Dubey, S.K.; Pandey, A.T.; Tabassum, N.; Chaturvedi, V.K.; Singh, N.B. Biomolecules of Mushroom: A Recipe of Human Wellness. Crit. Rev. Biotechnol. 2022, 42, 913–930. [Google Scholar] [CrossRef]
- Guillamón, E.; García-Lafuente, A.; Lozano, M.; D’arrigo, M.; Rostagno, M.A.; Villares, A.; Martínez, J.A. Edible Mushrooms: Role in the Prevention of Cardiovascular Diseases. Fitoterapia 2010, 81, 715–723. [Google Scholar] [CrossRef]
- Shaffique, S.; Kang, S.M.; Kim, A.Y.; Imran, M.; Khan, M.A.; Lee, I.J. Current Knowledge of Medicinal Mushrooms Related to Anti-Oxidant Properties. Sustain. 2021, 13, 7948. [Google Scholar] [CrossRef]
- Bhambri, A.; Srivastava, M.; Mahale, V.G.; Mahale, S.; Karn, S.K. Mushrooms as Potential Sources of Active Metabolites and Medicines. Front. Microbiol. 2022, 13, 837266. [Google Scholar] [CrossRef]
- Alves, M.; Ferreira, I.F.R.; Dias, J.; Teixeira, V.; Martins, A.; Pintado, M. A Review on Antimicrobial Activity of Mushroom (Basidiomycetes) Extracts and Isolated Compounds. Planta Med. 2012, 78, 1707–1718. [Google Scholar] [CrossRef]
- Aguiló-Aguayo, I.; Walton, J.; Viñas, I.; Tiwari, B.K. Ultrasound Assisted Extraction of Polysaccharides from Mushroom By-Products. Lwt 2017, 77, 92–99. [Google Scholar] [CrossRef]
- Ribeiro, B.; Lopes, R.; Andrade, P.B.; Seabra, R.M.; Gonçalves, R.F.; Baptista, P.; Quelhas, I.; Valentão, P. Comparative Study of Phytochemicals and Antioxidant Potential of Wild Edible Mushroom Caps and Stipes. Food Chem. 2008, 110, 47–56. [Google Scholar] [CrossRef] [PubMed]
- Ferreira, I.C.F.R.; Baptista, P.; Vilas-Boas, M.; Barros, L. Free-Radical Scavenging Capacity and Reducing Power of Wild Edible Mushrooms from Northeast Portugal: Individual Cap and Stipe Activity. Food Chem. 2007, 100, 1511–1516. [Google Scholar] [CrossRef]
- Barroso, L.S.; Copetti, C.; Komeroski, M.R.; Saudades, J.d.O.; da Silva, V.L.; Doneda, D.; Camargo, L.d.R.; Flôres, S.H.; Rios, A.d.O.; de Oliveira, V.R. Physicochemical and Sensory Evaluation in Sautéed Caps and Stems of Edible Mushrooms. J. Culin. Sci. Technol. 2020, 18, 306–316. [Google Scholar] [CrossRef]
- Radzki, W.; Kalbarczyk, J. Water Soluble Polysaccharides Content in Three Species of Edible and Medicinal Mushrooms: Lentinula Edodes, Pleurotus ostreatus, Agaricus Blazei. Herba Pol. 2010, 56, 31–38. [Google Scholar]
- Takeuchi, T.; Pereira, C.; Braga, M.; Maróstica, M.; Leal, P.; Meireles, A. Low-Pressure Solvent Extraction (Solid–Liquid Extraction, Microwave Assisted, and Ultrasound Assisted) from Condimentary Plants. In Extracting Bioactive Compounds for Food Products; Meireles, A., Ed.; CRC Press: Boca Raton, FL, USA, 2009. [Google Scholar]
- Singleton, V.L.; Rossi, J.A. Colorimetry of Total Phenolics with Phosphomolybdic Acid–Phosphotungstic Acid Reagents. Am. J. Enol. Vitic. 1965, 16, 144–158. [Google Scholar] [CrossRef]
- Jia, Z.; Tang, M.; Wu, J. The Determination of Flavonoid Contents Inmulberry and Their Scavenging Effects on Superoxides Radicals. Food Chem. 1998, 64, 555–559. [Google Scholar]
- Benzie, I.F.F.; Strain, J.J. The Ferric Reducing Ability of Plasma (FRAP) as a Measure of “Antioxidant Power”: The FRAP Assay. Anal. Biochem. 1996, 239, 70–76. [Google Scholar] [CrossRef]
- Blois, M.S. Antioxidant Determinations by the Use of a Stable Free Radical. Nature 1958, 181, 1199–1200. [Google Scholar] [CrossRef]
- Szydłowska-Tutaj, M.; Szymanowska, U.; Tutaj, K.; Domagała, D.; Złotek, U. The Addition of Reishi and Lion’s Mane Mushroom Powder to Pasta Influences the Content of Bioactive Compounds and the Antioxidant, Potential Anti-Inflammatory, and Anticancer Properties of Pasta. Antioxidants 2023, 12, 738. [Google Scholar] [CrossRef]
- Radzki, W.; Sławinska, A.; Jabłonska-Ryś, E.; Michalak-Majewska, M. Effect of Blanching and Cooking on Antioxidant Capacity of Cultivated Edible Mushrooms: A Comparative Study. Int. Food Res. J. 2016, 23, 599–605. [Google Scholar]
- Huang, D.; Boxin, O.U.; Prior, R.L. The Chemistry behind Antioxidant Capacity Assays. J. Agric. Food Chem. 2005, 53, 1841–1856. [Google Scholar] [CrossRef] [PubMed]
- Palacios, I.; Lozano, M.; Moro, C.; D’Arrigo, M.; Rostagno, M.A.; Martínez, J.A.; García-Lafuente, A.; Guillamón, E.; Villares, A. Antioxidant Properties of Phenolic Compounds Occurring in Edible Mushrooms. Food Chem. 2011, 128, 674–678. [Google Scholar] [CrossRef]
- Dubost, N.J.; Ou, B.; Beelman, R.B. Quantification of Polyphenols and Ergothioneine in Cultivated Mushrooms and Correlation to Total Antioxidant Capacity. Food Chem. 2007, 105, 727–735. [Google Scholar] [CrossRef]
- Shreya, S.; Mohapatra, D.; Naik, G.G.; Bobde, Y.; Ghosh, B.; Sahu, A.N. In Vitro Antioxidant and Cytotoxic Potential of Pleurotus Mushroom and Activity-Based Correlation: A Comparative Study. J. Anal. Chem. 2023, 78, 456–463. [Google Scholar] [CrossRef]
- Babu, D.R.; Rao, G.N. Antioxidant Properties and Electrochemical Behavior of Cultivated Commercial Indian Edible Mushrooms. J. Food Sci. Technol. 2013, 50, 301–308. [Google Scholar] [CrossRef] [PubMed]
- Hong, M.-H.; Jin, Y.-J.; Pyo, Y.-H. Antioxidant Properties and Ubiquinone Contents in Different Parts of Several Commercial Mushrooms. J. Korean Scociety Food Sci. Nutr. 2012, 41, 1235–1241. [Google Scholar] [CrossRef]
- Zhang, N.; Chen, H.; Zhang, Y.; Ma, L.; Xu, X. Comparative Studies on Chemical Parameters and Antioxidant Properties of Stipes and Caps of Shiitake Mushroom as Affected by Different Drying Methods. J. Sci. Food Agric. 2013, 93, 3107–3113. [Google Scholar] [CrossRef] [PubMed]
- Zawadzka, A.; Janczewska, A.; Kobus-Cisowska, J.; Dziedziński, M.; Siwulski, M.; Czarniecka-Skubina, E.; Stuper-Szablewska, K. The Effect of Light Conditions on the Content of Selected Active Ingredients in Anatomical Parts of the Oyster Mushroom (Pleurotus ostreatus L.). PLoS ONE 2022, 17, e0262279. [Google Scholar] [CrossRef]
- Barros, L.; Falcão, S.; Baptista, P.; Freire, C.; Vilas-Boas, M.; Ferreira, I.C.F.R. Antioxidant Activity of Agaricus Sp. Mushrooms by Chemical, Biochemical and Electrochemical Assays. Food Chem. 2008, 111, 61–66. [Google Scholar] [CrossRef]
- Chu, M.; Khan, R.D.; Zhou, Y.; Agar, O.T.; Barrow, C.J.; Dunshea, F.R.; Suleria, H.A.R. LC-ESI-QTOF-MS/MS Characterization of Phenolic Compounds in Common Commercial Mushrooms and Their Potential Antioxidant Activities. Processes 2023, 11, 1711. [Google Scholar] [CrossRef]
- Kim, M.Y.; Seguin, P.; Ahn, J.K.; Kim, J.J.; Chun, S.C.; Kim, E.H.; Seo, S.H.; Kang, E.Y.; Kim, S.L.; Park, Y.J.; et al. Phenolic Compound Concentration and Antioxidant Activities of Edible and Medicinal Mushrooms from Korea. J. Agric. Food Chem. 2008, 56, 7265–7270. [Google Scholar] [CrossRef] [PubMed]
- Ucar, T.M.; Karadag, A. The Effects of Vacuum and Freeze-Drying on the Physicochemical Properties and in Vitro Digestibility of Phenolics in Oyster Mushroom (Pleurotus ostreatus). J. Food Meas. Charact. 2019, 13, 2298–2309. [Google Scholar] [CrossRef]
- Piljac-Žegarac, J.; Šamec, D.; Piljac, A.; Mešić, A.; Tkalčec, Z. Antioxidant Properties of Extracts of Wild Medicinal Mushroom Species from Croatia. Int. J. Med. Mushrooms 2011, 13, 257–263. [Google Scholar] [CrossRef] [PubMed]
- Alvarez-Parrilla, E.; De La Rosa, L.A.; Martínez, N.R.; González Aguilar, G.A. Total Phenols and Antioxidant Activity of Commercial and Wild Mushrooms from Chihuahua, Mexico. Cienc. Tecnol. Aliment. 2007, 5, 329–334. [Google Scholar] [CrossRef]
- Mishra, K.K.; Pal, R.S.; Bhatt, J.C. Comparison of Antioxidant Properties in Cap and Stipe of Lentinula Edodes -A Medicinal Mushroom. Emir. J. Food Agric. 2015, 27, 562–569. [Google Scholar] [CrossRef]
- Prior, R.; Wu, X.; Schaich, K. Standardized Methods for the Determination of Antioxidant Capacity and Phenolics in Foods and Dietary Supplements. J. Agric. Food Chem. 2005, 53, 4290–4302. [Google Scholar] [CrossRef]
- Oboh, G.; Shodehinde, S.A. Distribution of Nutrients, Polyphenols and Antioxidant Activities in the Pilei and Stipes of Some Commonly Consumed Edible Mushrooms in Nigeria. Bull. Chem. Soc. Ethiop. 2009, 23, 391–398. [Google Scholar] [CrossRef]
- Lin, J.T.; Liu, C.W.; Chen, Y.C.; Hu, C.C.; Juang, L.D.; Shiesh, C.C.; Yang, D.J. Chemical Composition, Antioxidant and Anti-Inflammatory Properties for Ethanolic Extracts from Pleurotus Eryngii Fruiting Bodies Harvested at Different Time. Lwt 2014, 55, 374–382. [Google Scholar] [CrossRef]
Figure 1.
The content of total phenolics in the extracts from caps, stems and whole fruiting bodies, expressed per fruiting body dry weight (a) and per extract dry weight (b); Abw—A. bisporus (white), Abb—A. bisporus (brown), Le—L. edodes, Pn—P. nameko, Pe—P. eryngii, Po—P. ostreatus. Mean values (n = 3) with different lowercase letters show significant differences among the parts of mushrooms belonging to the same species. Mean values with different capital letters indicate significant differences among the same parts belonging to various species (p < 0.05, Tukey’s test).
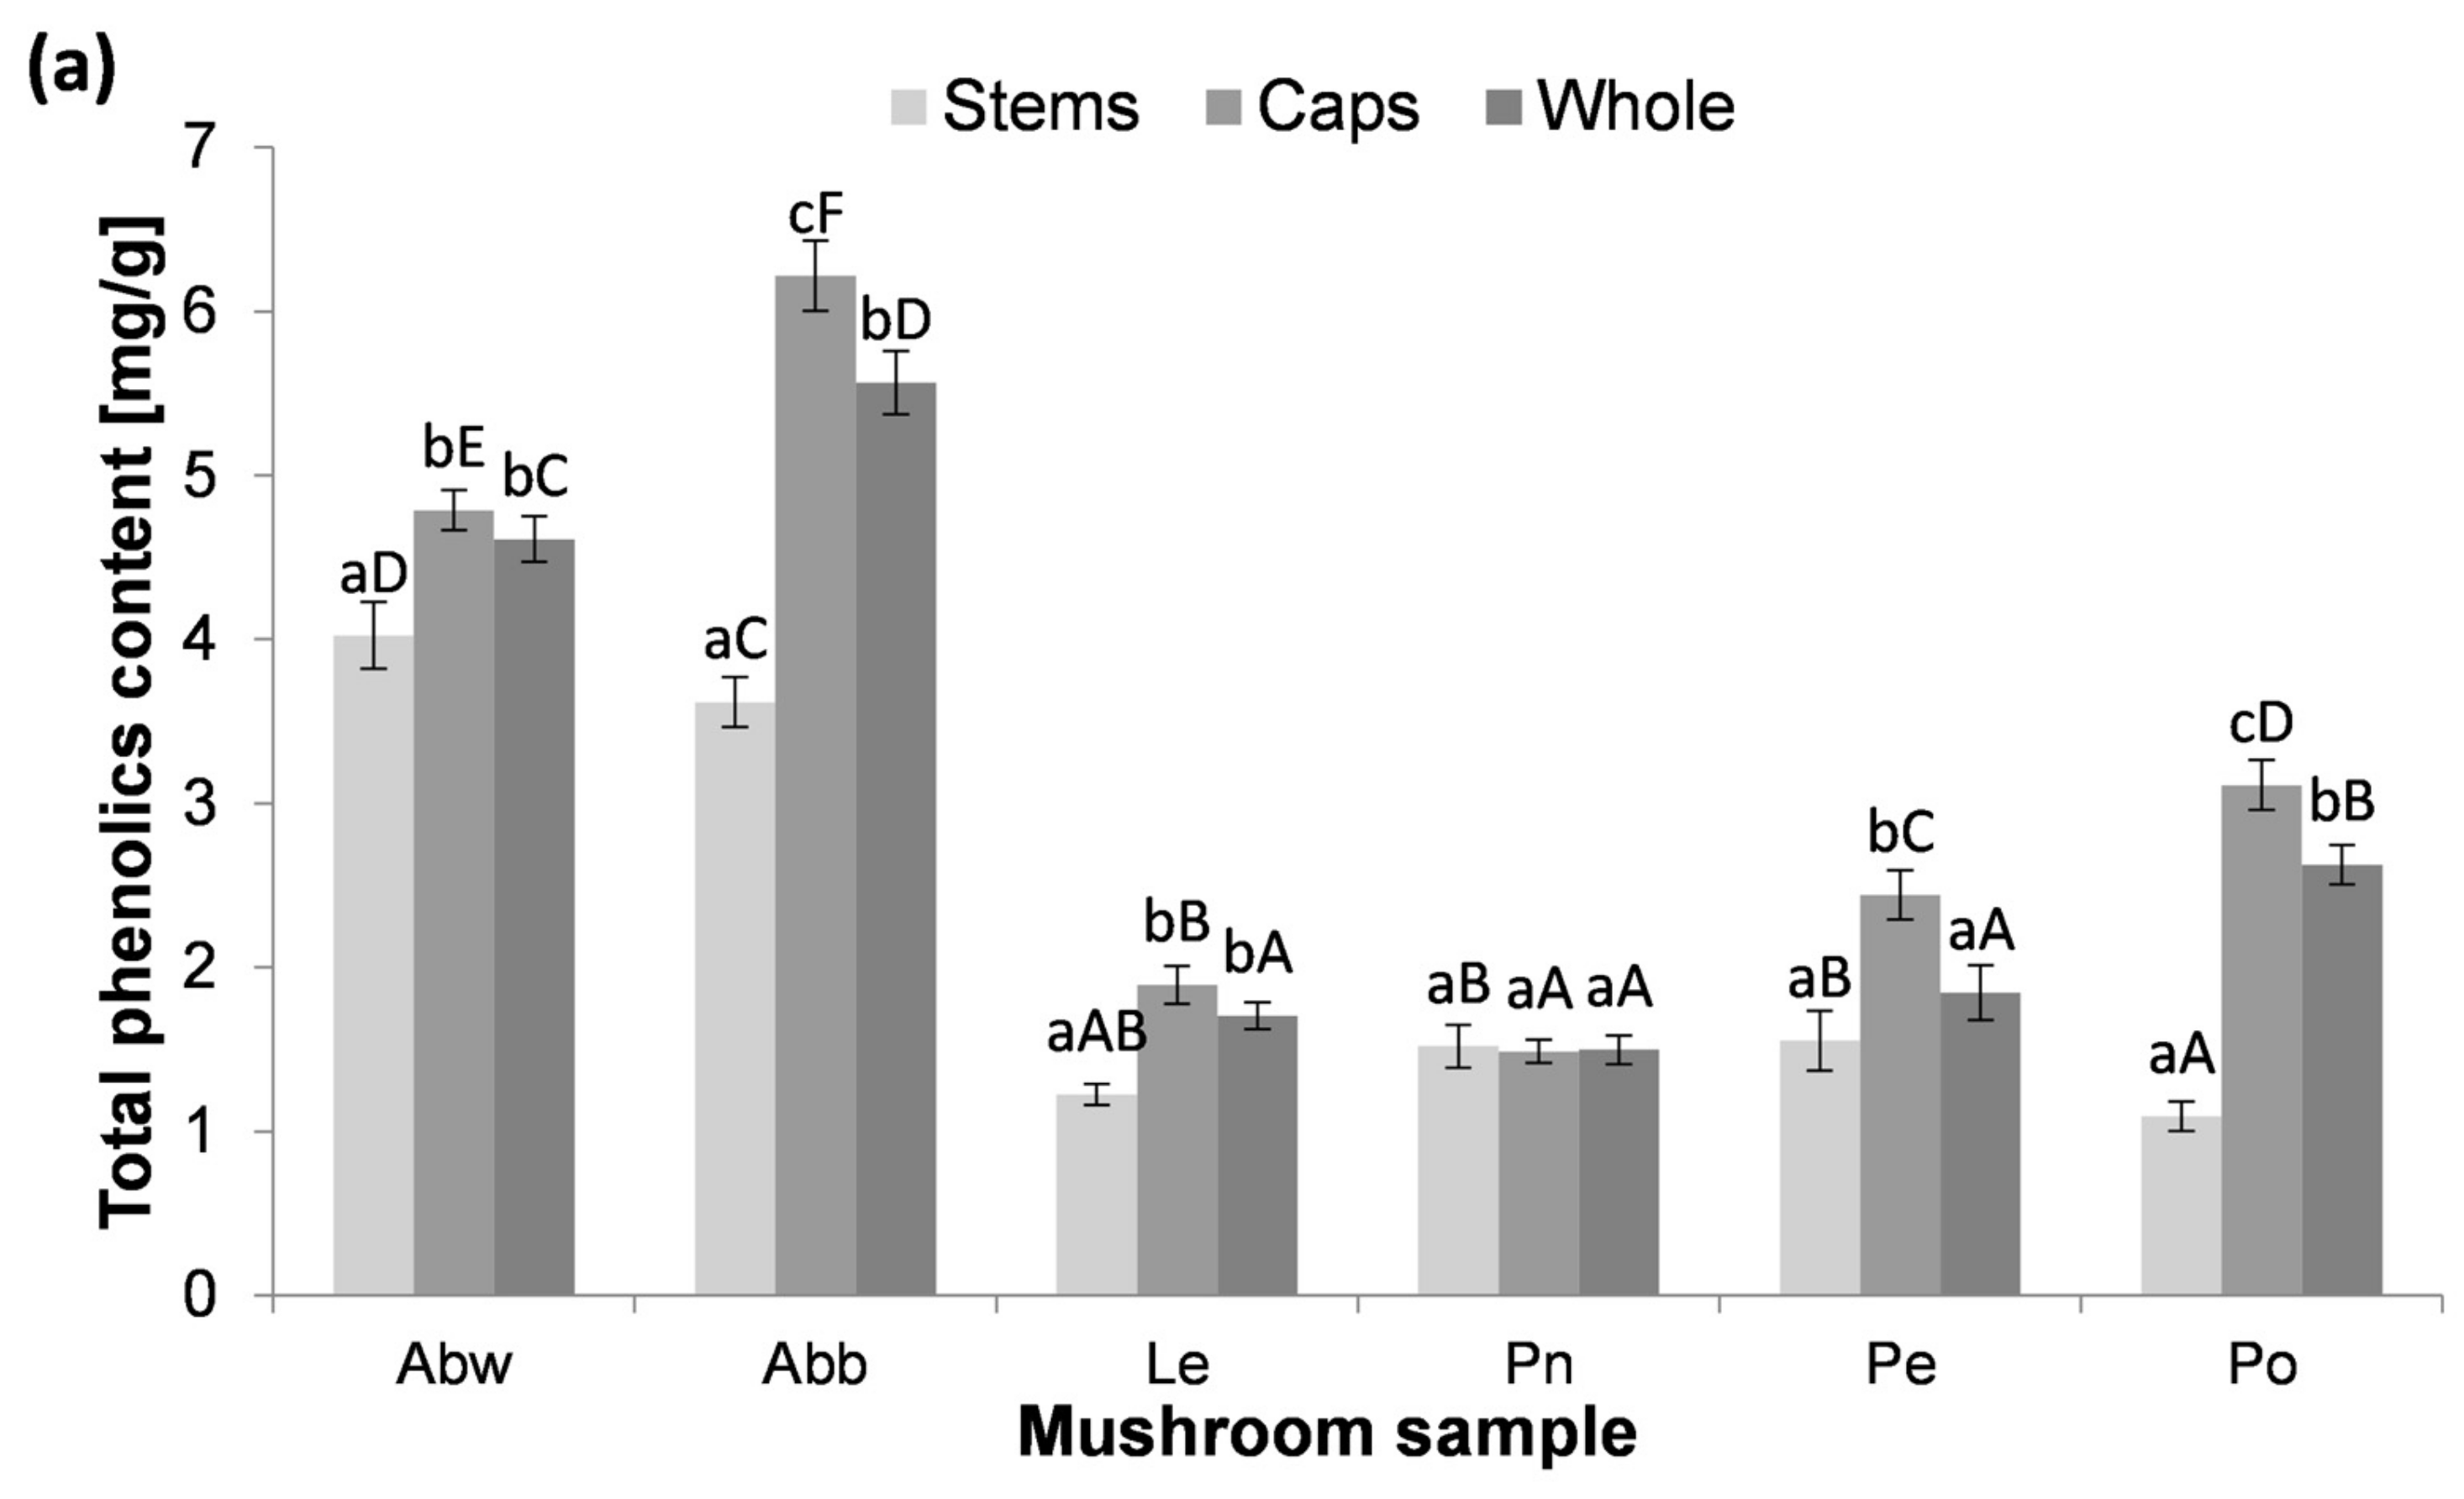
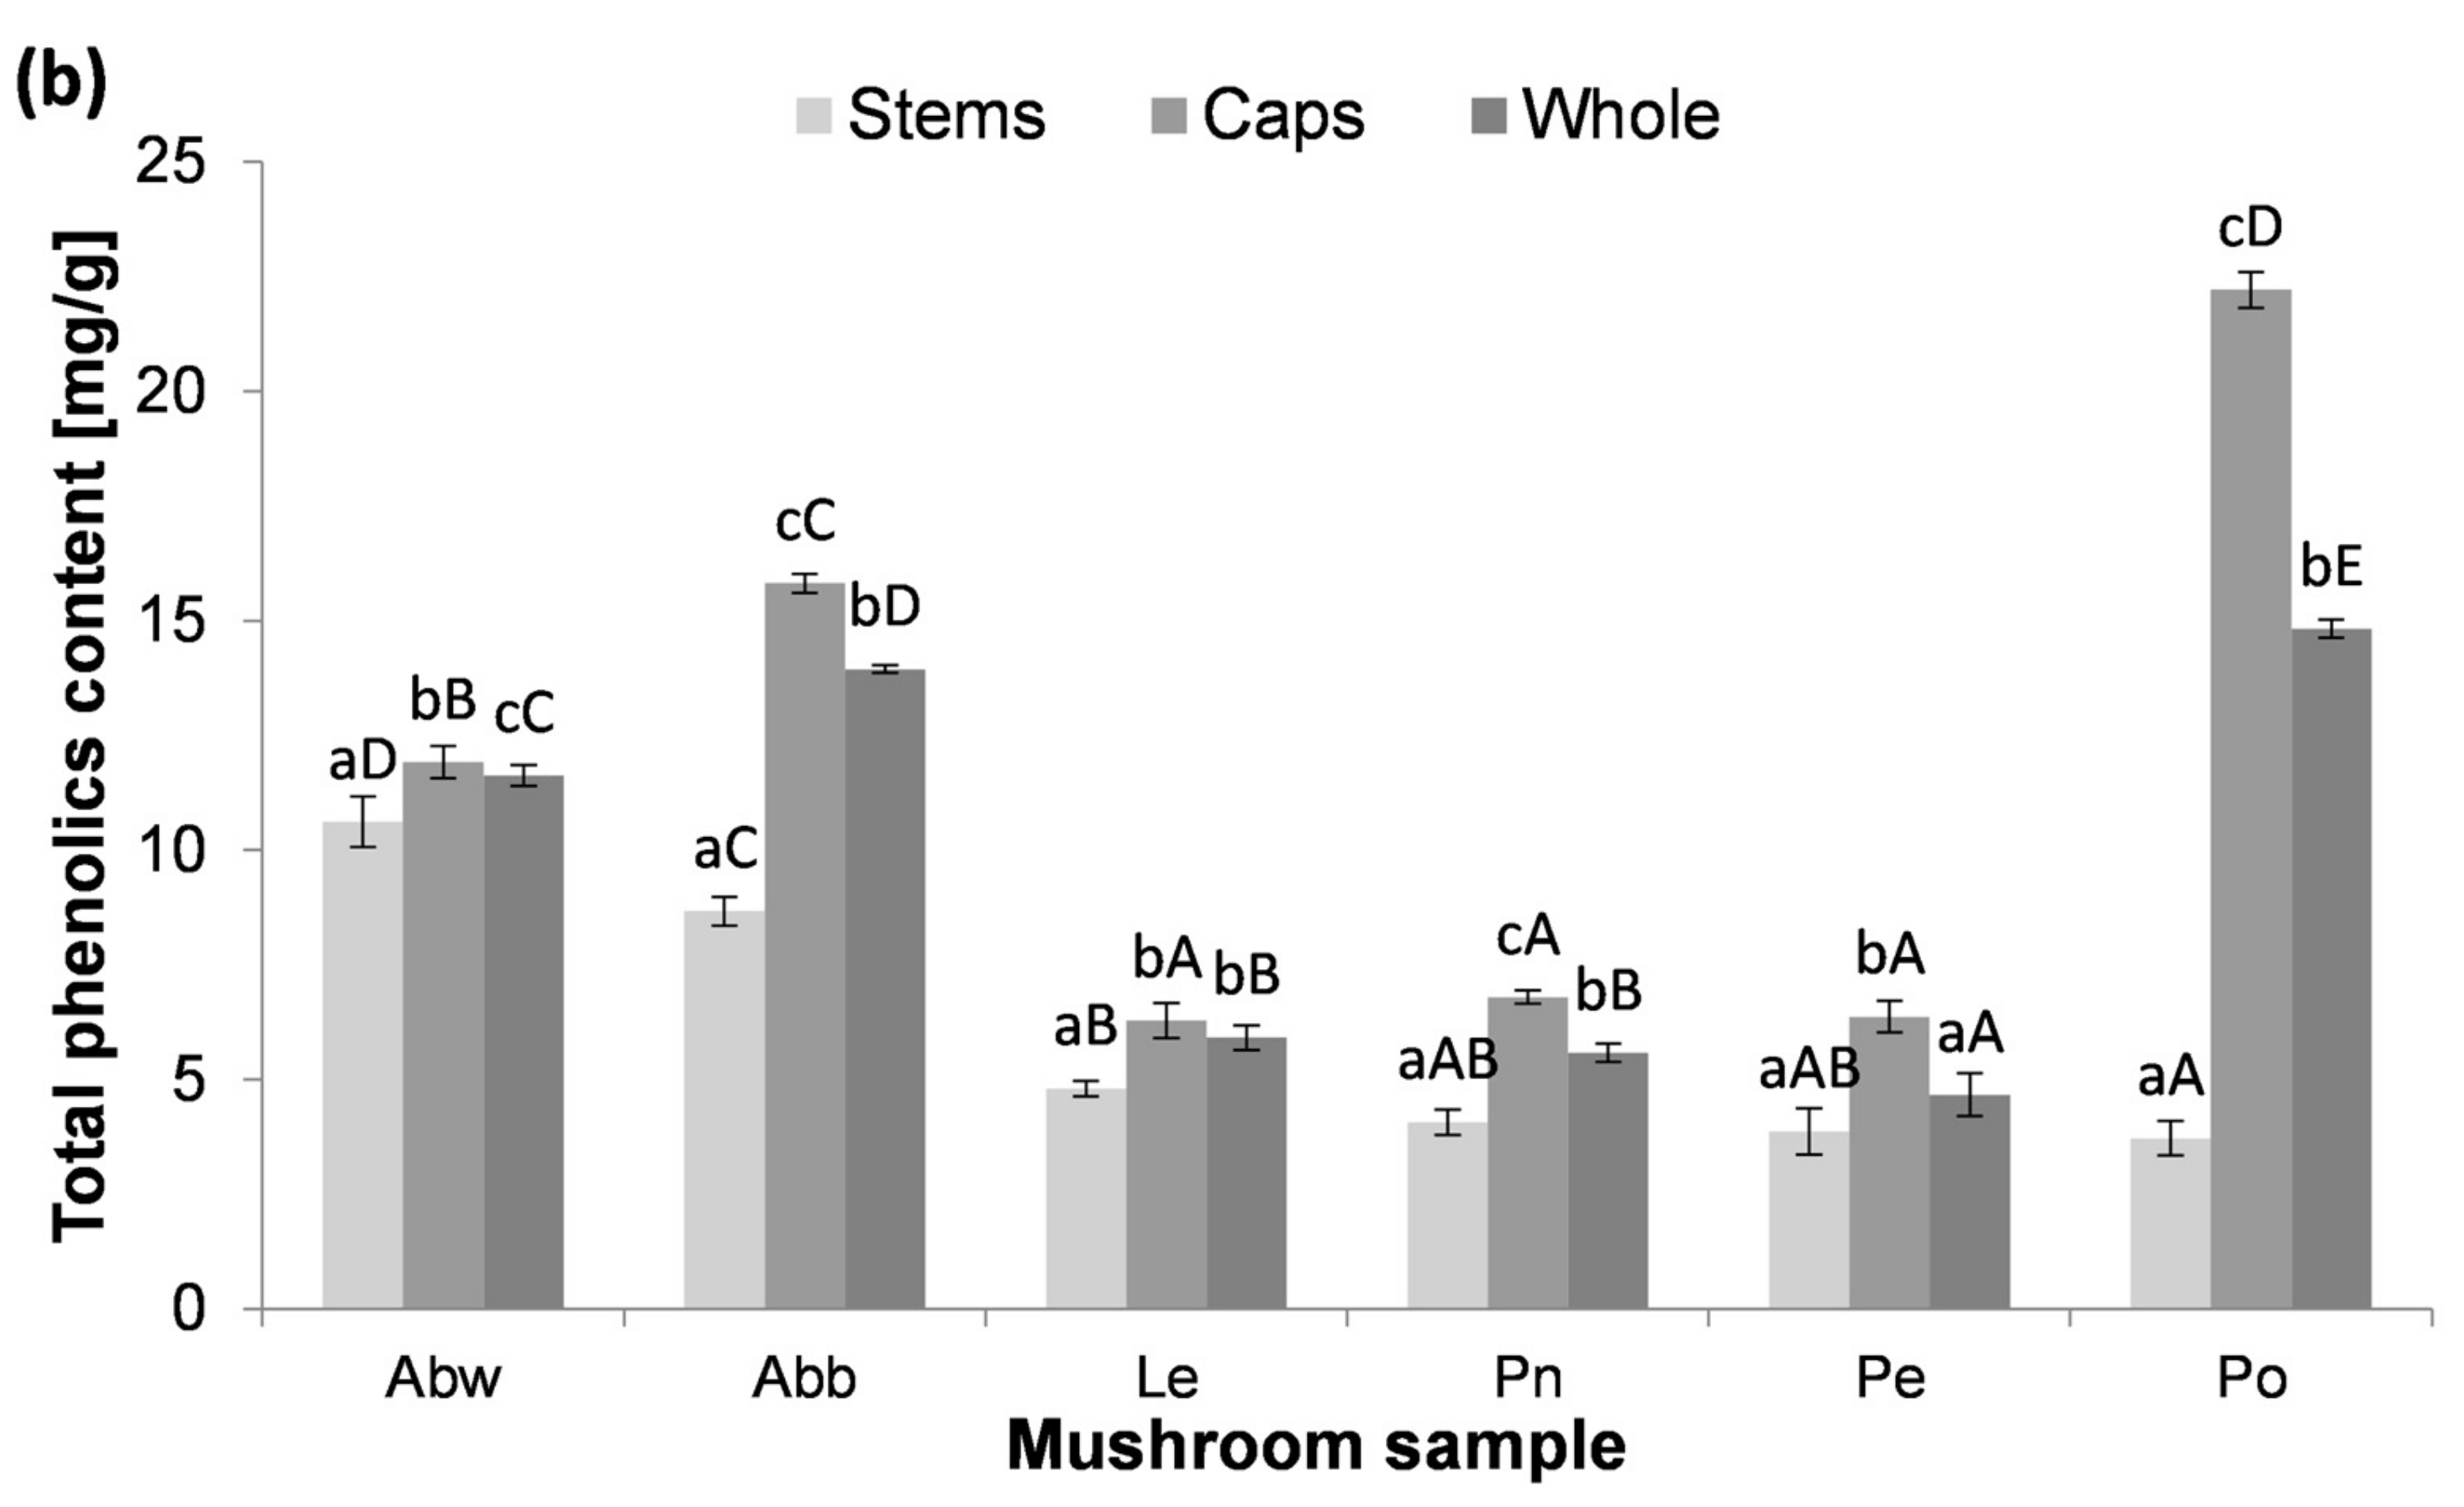
Figure 2.
The content of total flavonoids in the extracts from caps, stems and whole fruiting bodies, expressed per fruiting body dry weight (a) and per extract dry weight (b); Abw—A. bisporus (white), Abb—A. bisporus (brown), Le—L. edodes, Pn—P. nameko, Pe—P. eryngii, Po—P. ostreatus. Mean values (n = 3) with different lowercase letters show significant differences among the parts of mushrooms belonging to the same species. Mean values with different capital letters indicate significant differences among the same parts belonging to various species (p < 0.05, Tukey’s test).
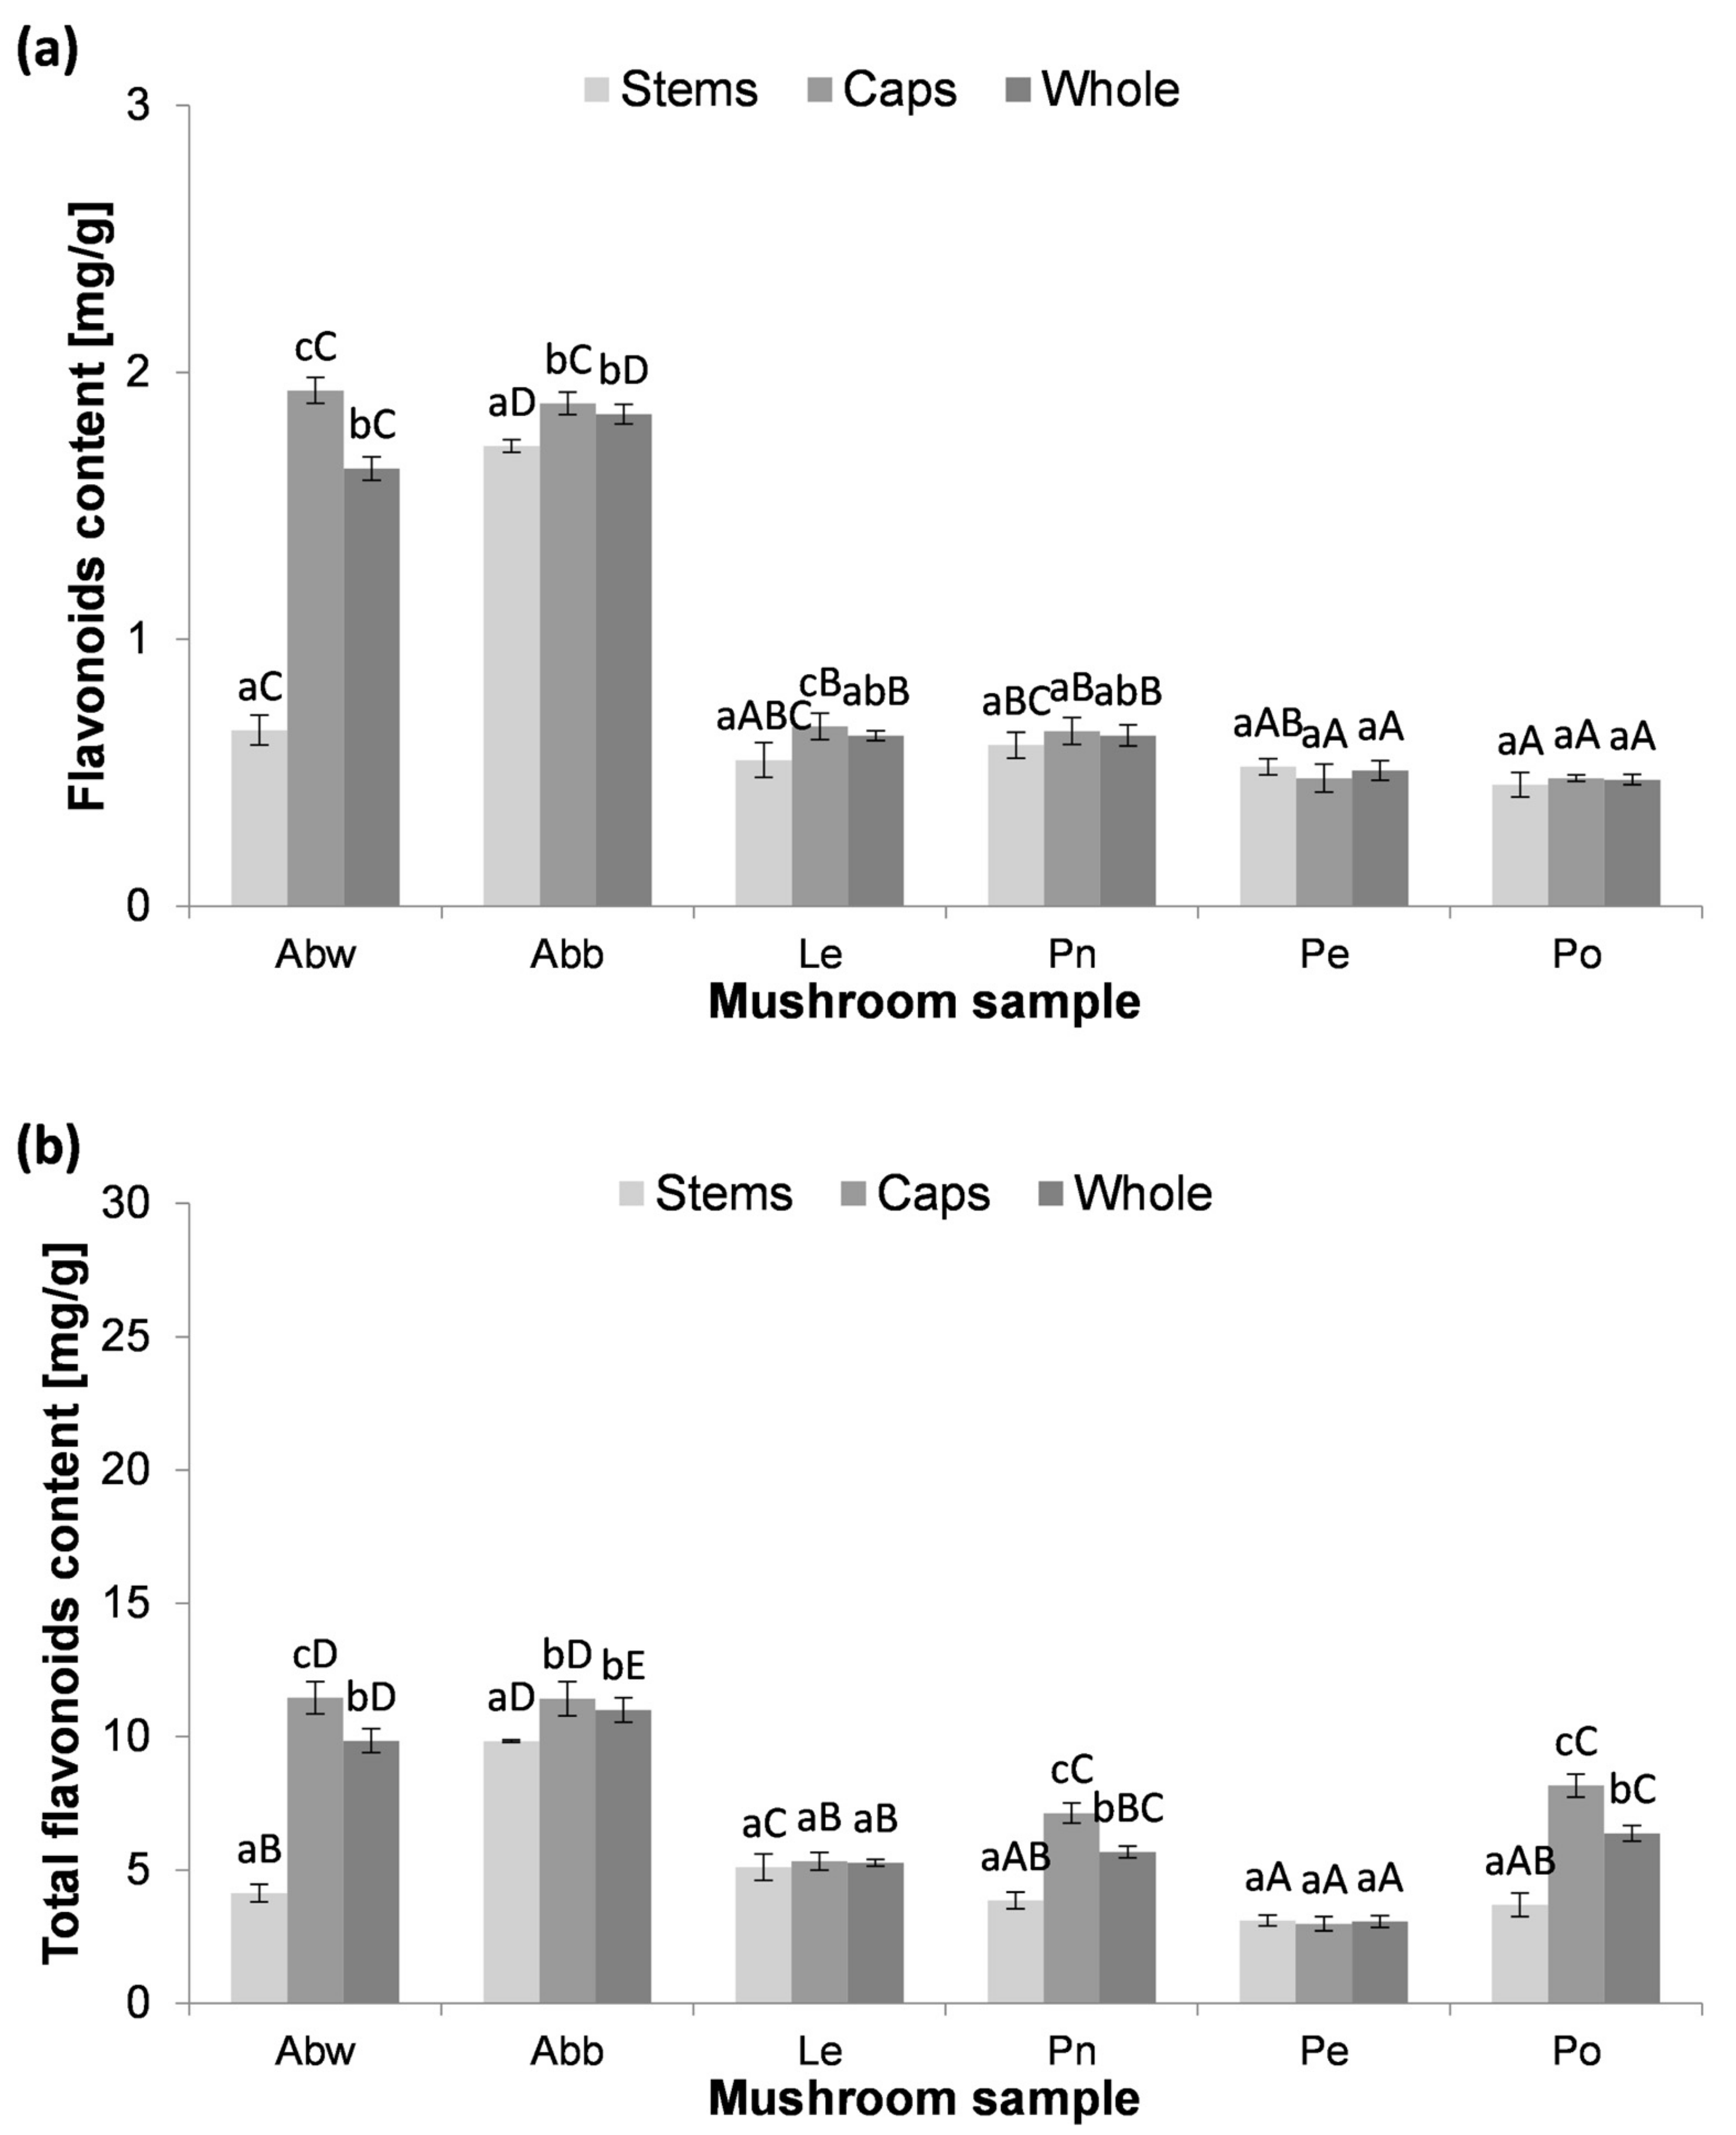
Figure 3.
LC–MS chromatogram of P. nameko caps extract, obtained in scheduled MRM acquisition mode: (1) 3,4-dihydroxybenzoic acid, (2) caffeic acid, (3) syringic acid, (4) 4-hydroxybenzaldehyde, (5) p-Coumaric acid, (6) ferulic acid, (7) trans-cinnamic acid, (ISTD) trans-cinnamic-d7 acid.
Figure 3.
LC–MS chromatogram of P. nameko caps extract, obtained in scheduled MRM acquisition mode: (1) 3,4-dihydroxybenzoic acid, (2) caffeic acid, (3) syringic acid, (4) 4-hydroxybenzaldehyde, (5) p-Coumaric acid, (6) ferulic acid, (7) trans-cinnamic acid, (ISTD) trans-cinnamic-d7 acid.
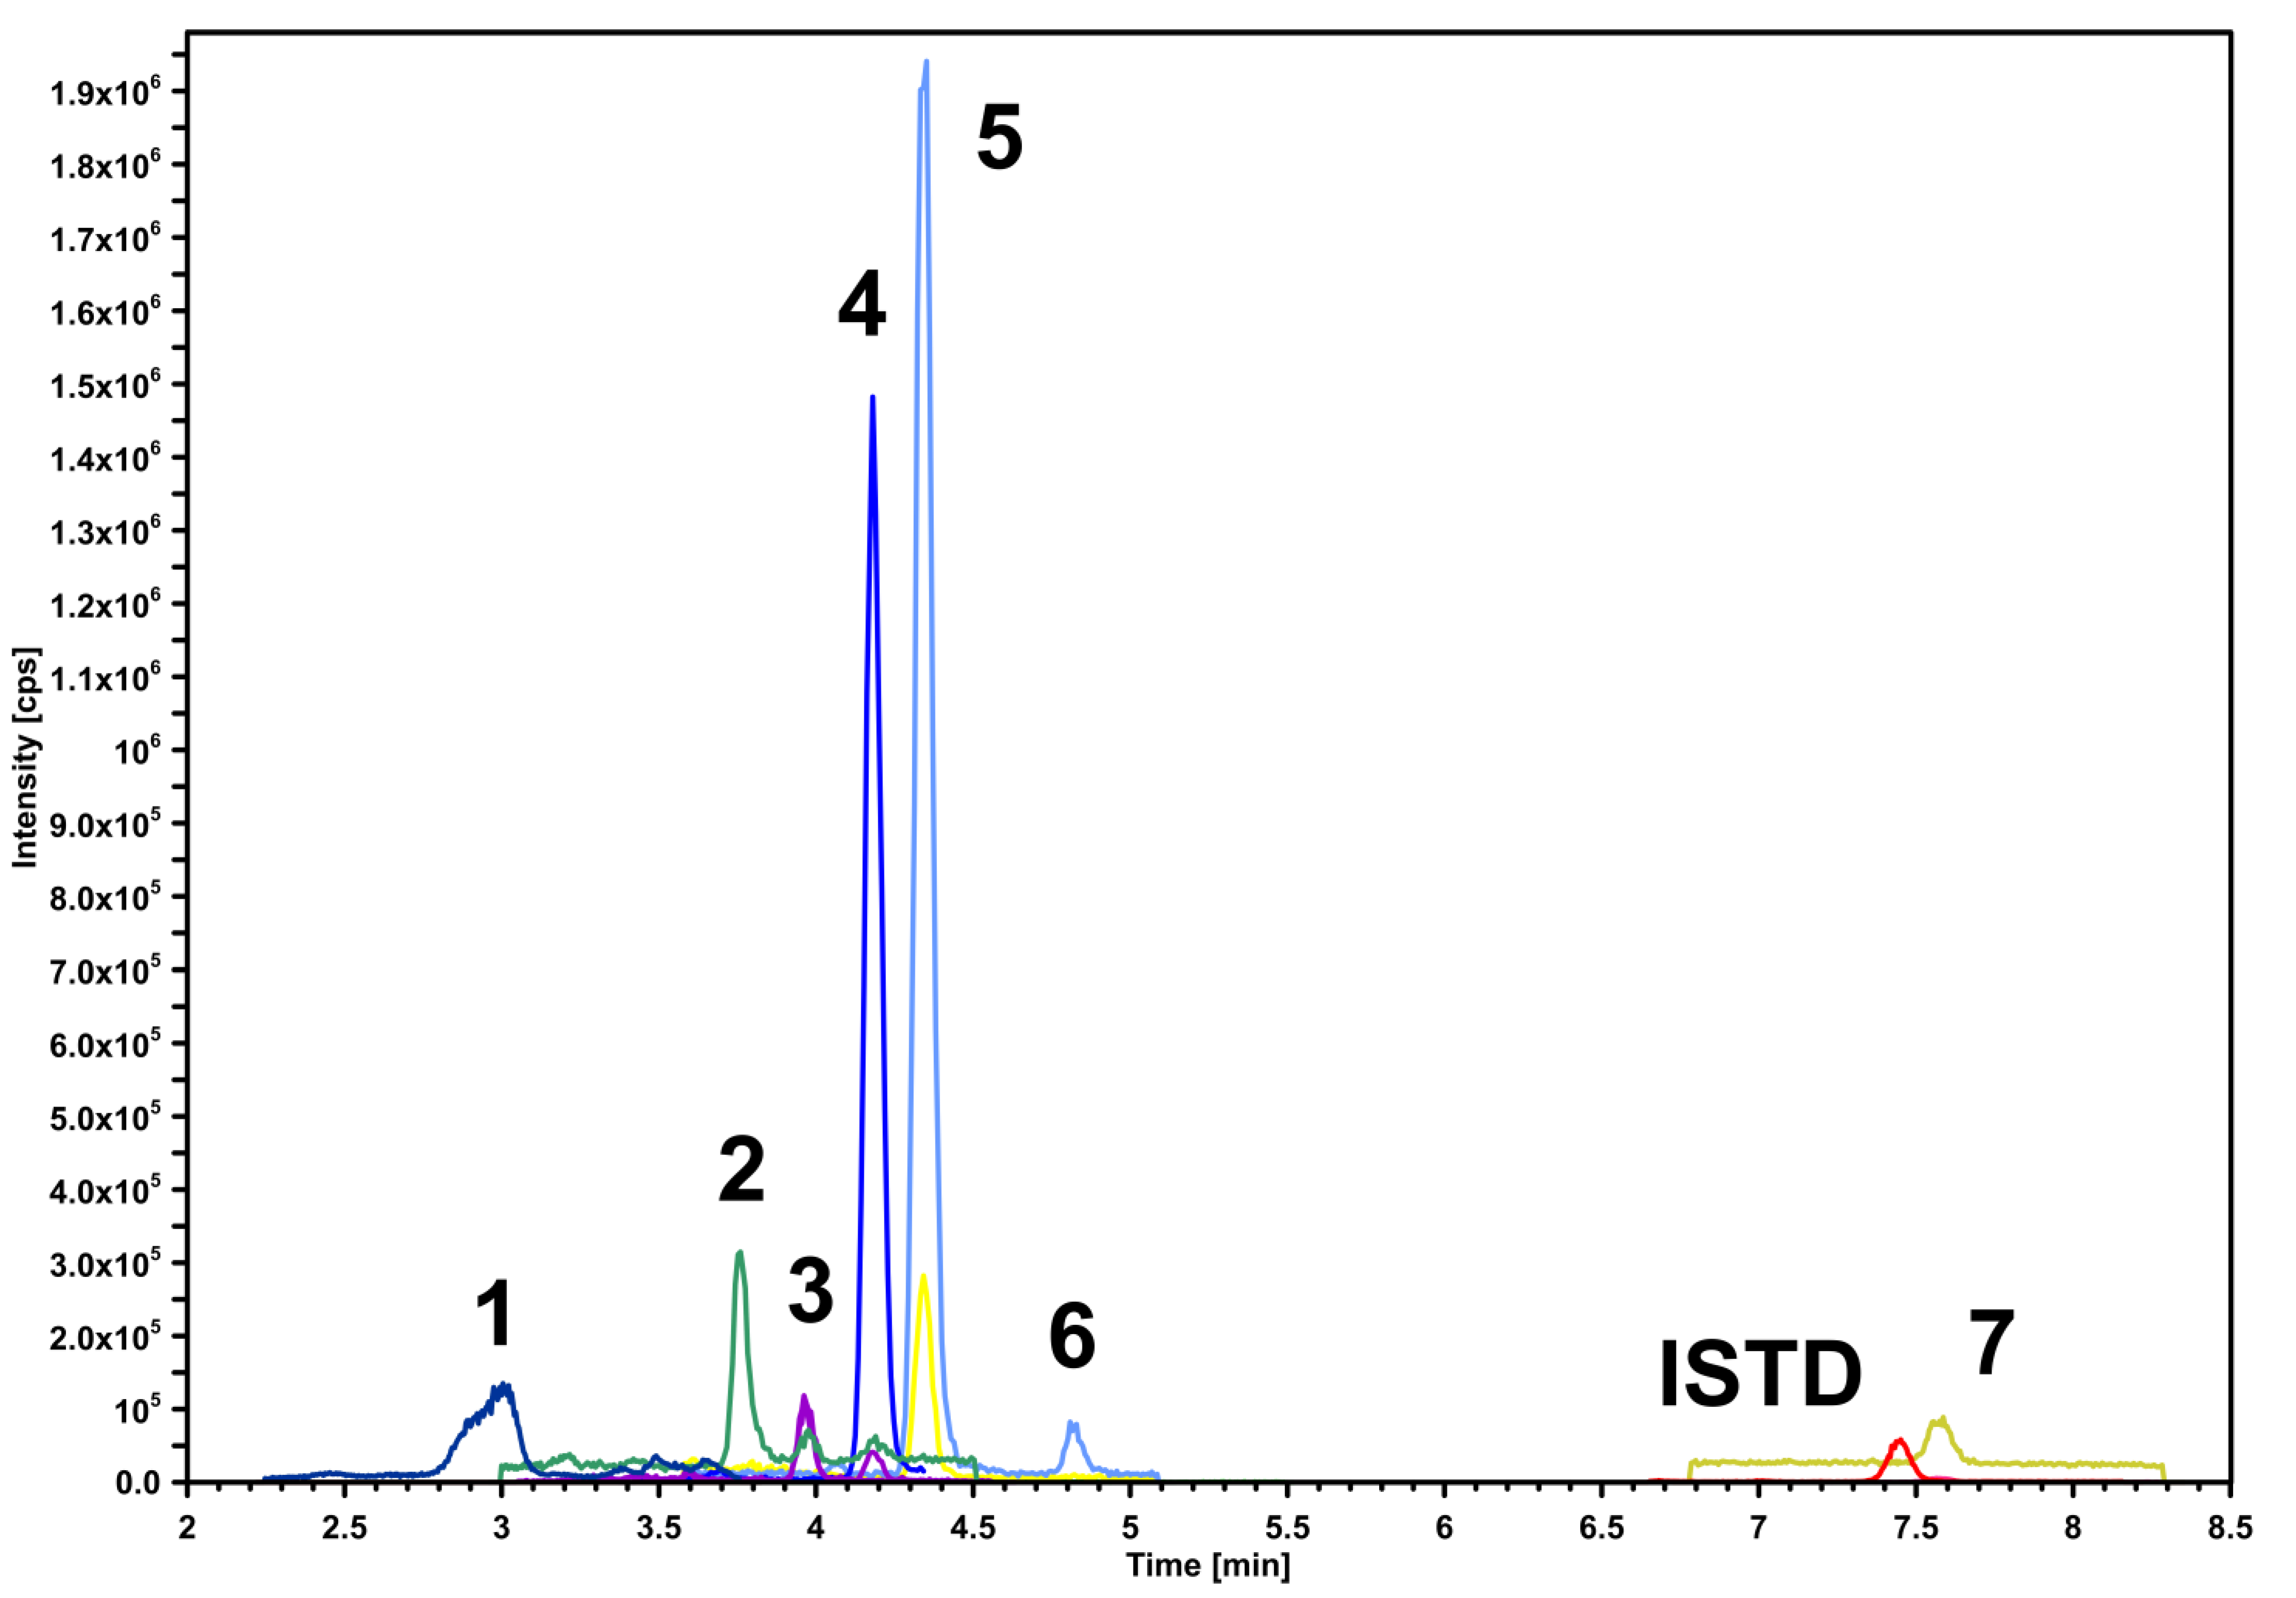
Figure 4.
The FRAP antioxidant activity of the extracts from caps, stems and whole fruiting bodies, expressed per fruiting body dry weight (a) and per extract dry weight (b); Abw—A. bisporus (white), Abb—A. bisporus (brown), Le—L. edodes, Pn—P. nameko, Pe—P. eryngii, Po—P. ostreatus. Mean values (n = 3) with different lowercase letters show significant differences among the parts of mushrooms belonging to the same species. Mean values with different capital letters indicate significant differences among the same parts belonging to various species (p < 0.05, Tukey’s test).
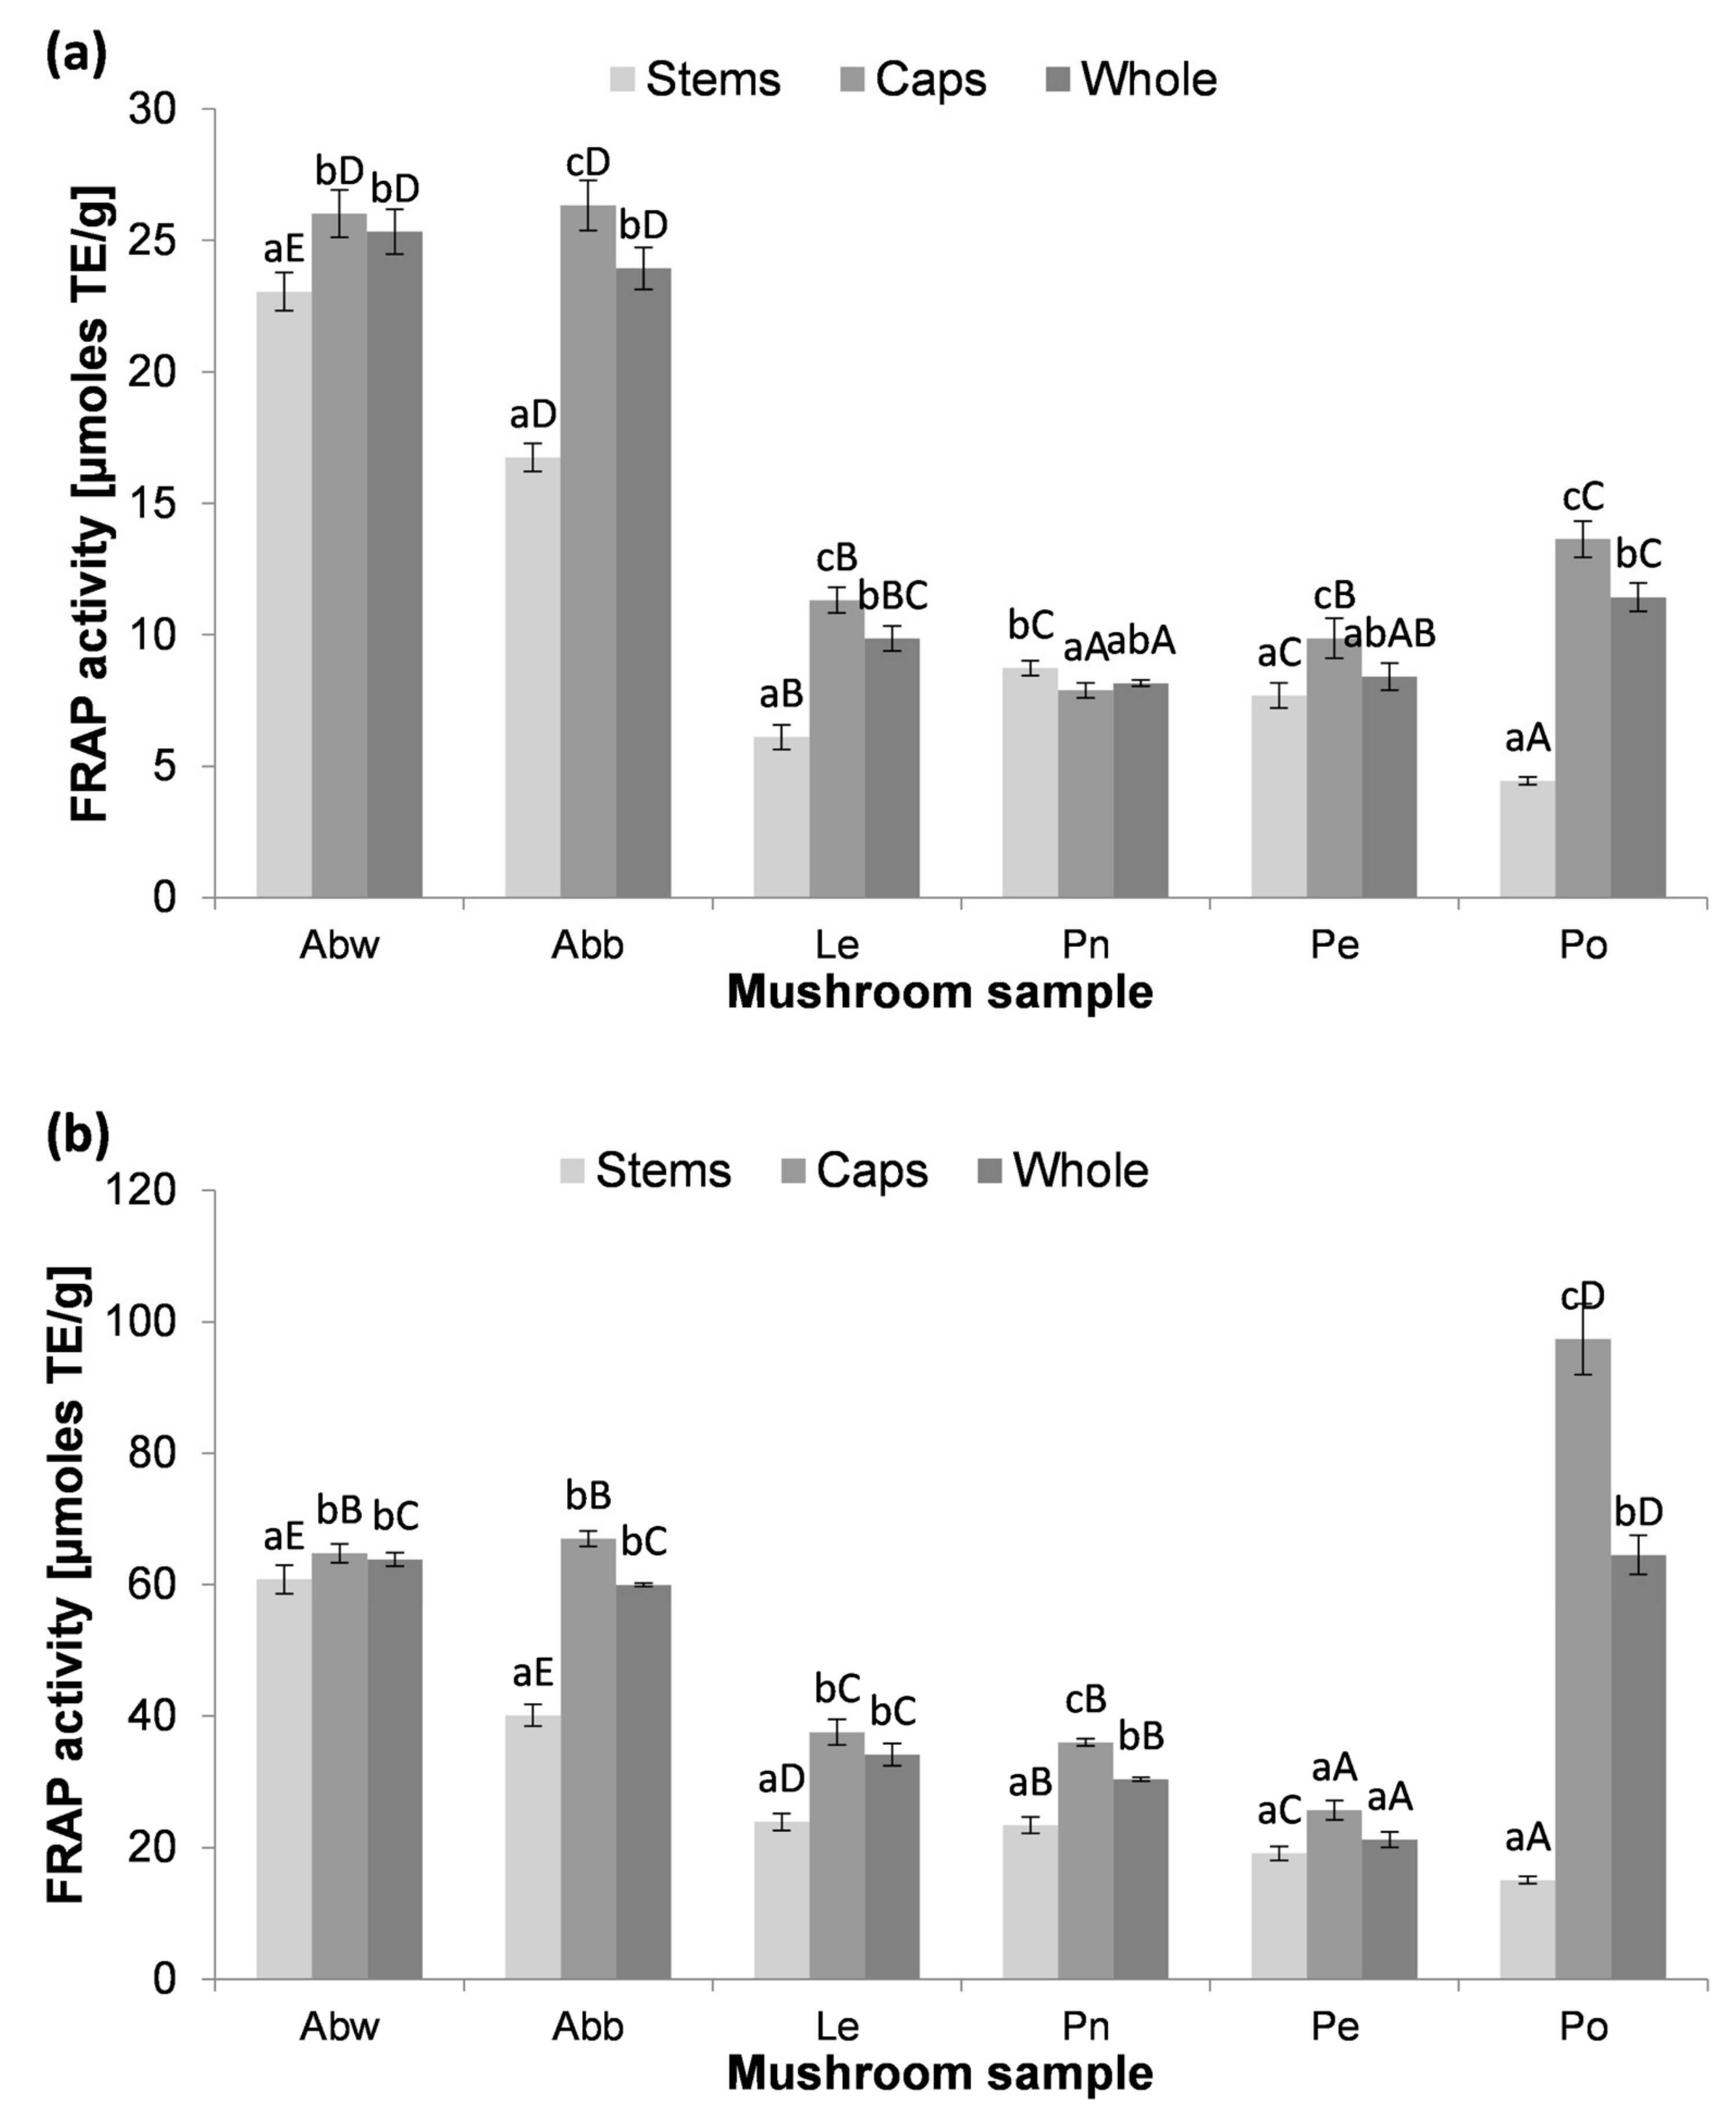
Figure 5.
The scavenging of DPPH radicals by the extracts from caps, stems and whole fruiting bodies, expressed per fruiting body dry weight (a) and per extract dry weight (b); Abw—A. bisporus (white), Abb—A. bisporus (brown), Le—L. edodes, Pn—P. nameko, Pe—P. eryngii, Po—P. ostreatus. Mean values (n = 3) with different lowercase letters show significant differences among the parts of mushrooms belonging to the same species. Mean values with different capital letters indicate significant differences among the same parts belonging to various species (p < 0.05, Tukey’s test).


Table 1.
Percentage of stems’ and caps’ dry weight for individual species, and the ratio between these parts of the fruiting bodies.
Table 1.
Percentage of stems’ and caps’ dry weight for individual species, and the ratio between these parts of the fruiting bodies.
| Species | Stems [%] | Caps [%] | S:C Ratio | Description of the Fruiting Bodies |
|---|---|---|---|---|
| A. bisporus (white) | 23 | 77 | 1:3.35 | closed caps, caps diameter 4–6 cm |
| A. bisporus (brown) | 21 | 62 | 1:2.95 | closed caps, caps diameter 2.5–4.5 cm |
| L. edodes | 27.8 | 72.2 | 1:2.59 | open caps, caps diameter 4–6 cm |
| P. nameko | 32 | 68 | 1:2.12 | closed caps, caps diameter 0.8–1.7 cm |
| P. eryngii | 67.4 | 32.6 | 1:0.48 | open caps, caps diameter 4.5–7 cm |
| P. ostreatus | 24.5 | 75.5 | 1:3.09 | open caps, caps length 3.5–9 cm |
Table 2.
Mass spectrometric data for the analysis of phenolic compounds. CE—Collision Energy, DP—Declustering Potential, CXP—Collision Cell Exit Potential.
Table 2.
Mass spectrometric data for the analysis of phenolic compounds. CE—Collision Energy, DP—Declustering Potential, CXP—Collision Cell Exit Potential.
| Compound | Retention Time (min) | Precursor Ion (m/z) | Product Ion 1 (m/z)/CE | Product Ion 2 (m/z)/CE | DP | CXP |
|---|---|---|---|---|---|---|
| 3,4-Dihydroxybenzoic acid | 3.00 | 153 | 108.9/−20 | 65.0/−30 | −30 | −11 |
| Caffeic acid | 3.75 | 179 | 135.0/−22 | 107.0/−32 | −30 | −9 |
| Syringic acid | 3.80 | 197 | 181.9/−18 | 122.9/−30 | −30 | −19 |
| 4-Hydroxybenzaldehyde | 4.18 | 121 | 91.9/−30 | 65.1/−32 | −30 | −11 |
| p-Coumaric acid | 4.33 | 163 | 119.0/−20 | 92.9/−42 | −20 | −9 |
| Ferulic acid | 4.74 | 193 | 177.9/−18 | 134/−22 | −30 | −11 |
| trans-Cinnamic-d7 acid | 7.40 | 153,9 | 110.0/−16 | - | −35 | −13 |
| trans-Cinnamic acid | 7.53 | 146.9 | 77.0/−28 | 103/−14 | −30 | −9 |
Table 3.
Yields of ethanolic extraction (%) from dry mushroom fruiting bodies.
| Species | Stems | Caps | Whole |
|---|---|---|---|
| A. bisporus (white) | 37.9 ± 1.1 aC | 40.2 ± 1.4 bD | 39.7 ± 1.0 bC |
| A. bisporus (brown) | 41.7 ± 0.6 aD | 39.3 ± 0.3 aD | 39.9 ± 1.3 aC |
| L. edodes | 25.5 ± 0.6 aA | 30.1 ± 0.3 cC | 28.8 ± 0.1 bB |
| P. nameko | 37.3 ± 0.8 cC | 21.9 ± 0.2 aB | 26.8 ± 0.6 bB |
| P. eryngii | 40.2 ± 0.6 bD | 38.3 ± 0.3 aD | 39.6 ± 0.4 abC |
| P. ostreatus | 29.4 ± 0.5 cB | 14.0 ± 0.1 aA | 17.7 ± 0.7 bA |
Mean values (n = 3) with different lowercase letters show significant differences among the parts of mushrooms belonging to the same species. Means with different capital letters indicate significant differences among the same parts belonging to various species (p < 0.05, Tukey’s test).
Table 4.
Phenolic acids profile, measured with the use of LC–MS; all the contents are expressed in µg/g of mushroom dry weight (the first value) or in µg/g of ethanolic extract dry weight (the second value, after “/”); nd—not detected.
Table 4.
Phenolic acids profile, measured with the use of LC–MS; all the contents are expressed in µg/g of mushroom dry weight (the first value) or in µg/g of ethanolic extract dry weight (the second value, after “/”); nd—not detected.
| Species | Part | 3,4-DHBA | Caffeic Acid | Syringic Acid | p-Coumaric Acid | Ferulic Acid | t-Cinnamic Acid | 4-hydroxybenzaldehyde |
|---|---|---|---|---|---|---|---|---|
| A. bisporus | Stems | 0.05 ± 0.02/0.14 ± 0.04 | nd | 0.26 ± 0.01/0.69 ± 0.03 | 0.03 ± 0.01/0.07 ± 0.02 | 0.06 ± 0.00/0.16 ± 0.01 | 0.29 ± 0.02/0.76 ± 0.04 | 0.81 ± 0.03/2.14 ± 0.14 |
| (white) | Caps | 0.10 ± 0.04/0.26 ± 0.11 | 0.02 ± 0.00/0.04 ± 0.00 | 0.22 ± 0.02/0.55 ± 0.05 | 0.08 ± 0.01/0.19 ± 0.04 | 0.06 ± 0.00/0.14 ± 0.01 | 1.20 ± 0.12/2.99 ± 0.34 | 0.30 ± 0.08/0.74 ± 0.18 |
| Whole | 0.09 ± 0.03/0.24 ± 0.08 | 0.01 ± 0.00/0.03 ± 0.00 | 0.23 ± 0.01/0.58 ± 0.04 | 0.07 ± 0.01/0.17 ± 0.03 | 0.06 ± 0.00/0.15 ± 0.01 | 0.99 ± 0.10/2.50 ± 0.25 | 0.41 ± 0.05/1.04 ± 0.12 | |
| A. bisporus | Stems | 0.15 ± 0.02/0.36 ± 0.05 | 0.04 ± 0.02/0.11 ± 0.04 | 0.41 ± 0.03/0.98 ± 0.08 | 0.31 ± 0.02/0.73 ± 0.06 | 0.06 ± 0.01/0.15 ± 0.01 | 0.63 ± 0.08/1.50 ± 0.19 | 0.68 ± 0.03/1.63 ± 0.07 |
| (brown) | Caps | 0.09 ± 0.01/0.23 ± 0.02 | 0.35 ± 0.01/0.90 ± 0.05 | 0.35 ± 0.01/0.88 ± 0.04 | 0.62 ± 0.07/1.58 ± 0.24 | 0.06 ± 0.00/0.15 ± 0.00 | 0.62 ± 0.09/1.57 ± 0.24 | 0.51 ± 0.01/1.29 ± 0.08 |
| Whole | 0.10 ± 0.01/0.26 ± 0.03 | 0.28 ± 0.00/0.71 ± 0.03 | 0.36 ± 0.02/0.90 ± 0.03 | 0.55 ± 0.06/1.37 ± 0.19 | 0.06 ± 0.00/0.15 ± 0.00 | 0.62 ± 0.07/1.55 ± 0.18 | 0.55 ± 0.01/1.37 ± 0.07 | |
| L. edodes | Stems | nd | 0.23 ± 0.05/0.89 ± 0.22 | 2.18 ± 0.07/8.55 ± 0.49 | 0.02 ± 0.01/0.07 ± 0.02 | nd | 0.86 ± 0.06/3.35 ± 0.14 | 0.30 ± 0.01/1.17 ± 0.06 |
| Caps | nd | 0.47 ± 0.12/1.55 ± 0.39 | 0.68 ± 0.04/2.26 ± 0.11 | nd | nd | 0.83 ± 0.04/2.76 ± 0.12 | 0.29 ± 0.02/0.95 ± 0.07 | |
| Whole | nd | 0.41 ± 0.11/1.43 ± 0.36 | 1.02 ± 0.05/3.55 ± 0.16 | <0.01/0.01 ± 0.00 | nd | 0.84 ± 0.02/2.91 ± 0.09 | 0.29 ± 0.02/1.01 ± 0.07 | |
| P. nameko | Stems | 0.59 ± 0.02/1.57 ± 0.07 | 0.18 ± 0.01/0.48 ± 0.01 | 1.21 ± 0.03/3.24 ± 0.03 | 0.39 ± 0.04/1.04 ± 0.13 | 0.07 ± 0.00/0.20 ± 0.01 | 0.93 ± 0.04/2.49 ± 0.07 | 0.52 ± 0.02/1.39 ± 0.08 |
| Caps | 0.93 ± 0.03/4.26 ± 0.24 | 0.37 ± 0.02/1.71 ± 0.09 | 1.63 ± 0.02/7.45 ± 0.22 | 3.79 ± 0.34/17.33 ± 2.04 | nd | 3.16 ± 0.07/14.42 ± 0.09 | 1.12 ± 0.05/5.10 ± 0.34 | |
| Whole | 0.85 ± 0.03/3.18 ± 0.17 | 0.33 ± 0.01/1.23 ± 0.05 | 1.53 ± 0.02/5.72 ± 0.13 | 3.00 ± 0.27/11.22 ± 1.30 | 0.02 ± 0.00/0.06 ± 0.00 | 2.64 ± 0.06/9.86 ± 0.07 | 0.98 ± 0.04/3.65 ± 0.23 | |
| P. eryngii | Stems | 1.71 ± 0.05/4.27 ± 0.15 | nd | 0.17 ± 0.02/0.43 ± 0.04 | 0.05 ± 0.01/0.13 ± 0.03 | nd | 1.07 ± 0.55/2.66 ± 1.41 | 0.60 ± 0.04/1.50 ± 0.09 |
| Caps | 3.97 ± 0.09/10.37 ± 0.42 | nd | 0.07 ± 0.01/0.18 ± 0.02 | 0.23 ± 0.01/0.60 ± 0.04 | nd | 1.17 ± 0.71/3.06 ± 1.87 | 0.71 ± 0.01/1.84 ± 0.01 | |
| Whole | 3.45 ± 0.06/8.73 ± 0.15 | nd | 0.09 ± 0.01/0.23 ± 0.01 | 0.19 ± 0.01/0.48 ± 0.03 | nd | 1.15 ± 0.61/2.91 ± 1.56 | 0.68 ± 0.01/1.73 ± 0.03 | |
| P. ostreatus | Stems | 0.95 ± 0.03/3.24 ± 0.11 | 0.24 ± 0.01/0.81 ± 0.01 | 0.28 ± 0.00/0.95 ± 0.01 | 0.06 ± 0.01/0.22 ± 0.01 | nd | 0.47 ± 0.28/1.62 ± 0.98 | 0.60 ± 0.01/2.05 ± 0.02 |
| Caps | 2.31 ± 0.11/16.52 ± 1.83 | 0.09 ± 0.01/0.62 ± 0.09 | 0.05 ± 0.01/0.38 ± 0.06 | 0.07 ± 0.01/0.50 ± 0.09 | nd | 0.80 ± 0.05/5.71 ± 0.34 | 0.84 ± 0.03/5.99 ± 0.58 | |
| Whole | 1.99 ± 0.08/11.28 ± 0.84 | 0.12 ± 0.01/0.69 ± 0.06 | 0.10 ± 0.00/0.59 ± 0.04 | 0.07 ± 0.01/0.39 ± 0.05 | nd | 0.73 ± 0.09/4.10 ± 0.58 | 0.78 ± 0.02/4.43 ± 0.29 |
Table 5.
Pearson correlations (R) between the content of bioactive compounds (mg/g extract dry weight) and the antioxidant capacities calculated per gram of extract dry weight.
Table 5.
Pearson correlations (R) between the content of bioactive compounds (mg/g extract dry weight) and the antioxidant capacities calculated per gram of extract dry weight.
| Assay | FRAP | DPPH | TFC |
|---|---|---|---|
| TPC | 0.97 * | 0.83 * | 0.67 * |
| TFC | 0.69 * | 0.48 * | – |
* p-value < 0.01.
Disclaimer/Publisher’s Note: The statements, opinions and data contained in all publications are solely those of the individual author(s) and contributor(s) and not of MDPI and/or the editor(s). MDPI and/or the editor(s) disclaim responsibility for any injury to people or property resulting from any ideas, methods, instructions or products referred to in the content. |
© 2023 by the authors. Licensee MDPI, Basel, Switzerland. This article is an open access article distributed under the terms and conditions of the Creative Commons Attribution (CC BY) license (https://creativecommons.org/licenses/by/4.0/).
Share and Cite
MDPI and ACS Style
Radzki, W.; Tutaj, K.; Skrzypczak, K.; Michalak-Majewska, M.; Gustaw, W. Ethanolic Extracts of Six Cultivated Mushrooms as a Source of Bioactive Compounds. Appl. Sci. 2024, 14, 66. https://doi.org/10.3390/app14010066
AMA Style
Radzki W, Tutaj K, Skrzypczak K, Michalak-Majewska M, Gustaw W. Ethanolic Extracts of Six Cultivated Mushrooms as a Source of Bioactive Compounds. Applied Sciences. 2024; 14(1):66. https://doi.org/10.3390/app14010066
Chicago/Turabian StyleRadzki, Wojciech, Krzysztof Tutaj, Katarzyna Skrzypczak, Monika Michalak-Majewska, and Waldemar Gustaw. 2024. "Ethanolic Extracts of Six Cultivated Mushrooms as a Source of Bioactive Compounds" Applied Sciences 14, no. 1: 66. https://doi.org/10.3390/app14010066
Note that from the first issue of 2016, this journal uses article numbers instead of page numbers. See further details here.