
Intermediate Isolation System with Nonlinear Lower Structure and Isolation System

1
Department of Structures for Engineering and Architecture, University of Naples Federico II, 80125 Naples, Italy
2
Department of Engineering, University of Palermo, 90133 Palermo, Italy
*
Author to whom correspondence should be addressed.
Appl. Sci. 2023, 13(7), 4590; https://doi.org/10.3390/app13074590
Submission received: 8 February 2023
/
Revised: 27 March 2023
/
Accepted: 3 April 2023
/
Published: 4 April 2023
(This article belongs to the Special Issue Recent Perspectives on Smart Structures and Infrastructures for Enhanced Vibration Mitigation and Health Monitoring)
Abstract
:This paper reports a study on the Intermediate Isolation System (IIS) applied to existing buildings. This kind of application is particularly suitable when a vertical addition is planned for buildings in seismic zones; in such a case, an isolation system can be placed at the base of the extension to prevent the increase, or, better, to reduce the seismic demand on the existing structure. In previous works, parametric response spectrum analyses have been carried out on lumped mass models by varying the period of the isolation system. As a result, a sort of IIS design spectrum has been derived and used for selecting design solutions for the vertical extension that minimize the overall seismic response. In this paper, the above design indications are assessed in the light of nonlinear time history analyses, accounting for the hysteretic response of the existing structure and the nonlinear behaviour of the isolation system. The IIS configurations are analysed and the results are discussed and compared in terms of peak response. In light of the obtained analysis results, the effectiveness and robustness of IIS applications for vertical extensions are discussed, and design implications are suggested.
1. Introduction
The Intermediate Isolation System (IIS) derives from the Base Isolation System (BIS) by shifting the position of the isolation layer upward. Therefore, a building can be ideally subdivided into a sub-structure and super-structure, respectively placed below and above the isolation interface. Due to the flexibility of the lower structure, the dynamic behaviour of the IIS is more complex and less intuitive than that of the BIS. The IIS is characterized by a twofold dynamic behaviour that combines two strategies of passive control: the isolation of the upper structure and mass damping on the lower structure. In particular, the isolated upper structure behaves as a base isolated structure on the roof of the lower structure and, at the same time, as a mass damper for the lower structure. Unlike conventional tuned mass dampers (TMD), in which the mass of the absorber is an added mass of only few per cent of the structural mass, in the IIS a part of the building is converted into a mass damper, with a mass that can be comparable to, or even larger than, the mass of the lower structure. For this reason, the IIS is also termed as non-conventional mass damper, building mass damper, or inhabited mass damper. By increasing the mass of the TMD, the robustness of the system increases; consequently, the seismic response is less sensitive to variations of the design parameters, and to the frequency content and impulsive character of the seismic input [1]. By exploiting this robustness, some actual IIS buildings have been designed in Japan as “untuned” mass dampers [2,3,4].
In Japan the IIS is quite diffused and has gained significant popularity, so that more than 60 buildings have been realized in the past 20 years [5]. This system is frequently used for new construction buildings, in particular tall buildings. Some examples are the Iidiabashi 1st Building, Shiodome Sumitomo Building, Nakanoshima Festival Tower, Tekko Building, and Roppongi Ground Tower [2,3,6,7,8,9,10]. Only in a few cases has the IIS has been adopted for expanding vertically existing buildings, as in Berry St. in San Francisco, USA [11,12], and the Musashino City Disaster Prevention and Safety Centre in Tokyo, Japan [2,3].
In the last decade, several researchers have studied IIS in order to understand its dynamic behaviour, identify the governing mechanical parameters, and derive design indications that ensure good seismic performance.
Important contributions, of course, come from Japan; in particular, some researchers [2,3,6,7] deal with the IIS as a “concentrated energy dissipation” design problem, considering that most of the seismic energy input is absorbed by isolator and damper devices installed in the isolation layer. Other Japanese researchers [13,14,15] adopt two-degrees-of-freedom (2DOF) models and have proposed a seismic response prediction method in which the natural mode functions are incorporated into the energy-balance method, firstly suggested by Akiyama [16], to derive the seismic response of the system. Additional contributions are given in [17,18,19], where the impact of the dynamic interaction between upper and lower structures and the effect of the possible coupling of the higher modes are investigated by adopting simplified three-degree-of-freedom (3DOF) models; the results of the analyses are also compared to the outcomes of experimental campaigns [20,21]. In other papers [22,23], an optimization procedure is proposed using 3DOF models to enhance the seismic performance of both upper and lower structures. Ikeda [24] has recently suggested the pole allocation method applied to 3DOF models for analysing the dynamic characteristics of intermediate isolation systems and elaborating a mathematical solution in closed form. In a subsequent paper [25], the method has been generalized for including any passive control strategy (base isolation, inter-story isolation, tuned mass dampers, viscous dampers). De Angelis et al. [1] and Reggio and De Angelis [26] have investigated the dynamic behaviour of nonconventional TMD by adopting both multi- and two-degrees-of-freedom models and by modelling the seismic input as a stationary Gaussian stochastic process with zero mean. The control criterion suggested in [1] is the minimization of the root-mean-square displacement response of the damped main structure; in [26], instead, the criterion is the maximization of an energy performance index, defined as the ratio between the energy dissipated in the isolation system and the input energy globally transferred to the model. An experimental campaign on a multi-story frame structure equipped with nonconventional TMD has also been reported in [27], with white noise, sine sweep, and natural earthquakes as input motion conditions. Donà et al. [28,29] have considered IIS made by fluid viscous dampers and have derived the optimal parameters for minimizing the isolation drift and simultaneously controlling the superstructure performance. Bernardi et al. [30] have proposed a multi-objective optimization approach applied to a 2DOF model, representing an IIS working as a TMD. The objective functions were the minimization of the variance of the substructure drift and the variance of the isolation drift (or of the superstructure acceleration), with the seismic input modelled as a stationary Gaussian stochastic process with zero mean.
This paper examines the interesting idea of utilizing the IIS to extend vertically existing buildings for addressing the increasing demand for real estate in contemporary cities with almost no land take [2,3,11,12,31,32,33,34,35,36,37]. In earthquake-prone zones, IIS can prevent any increase in seismic effects, despite the increase in mass due to the vertical extension. Furthermore, even a non-negligible reduction in the seismic response can be obtained if proper design procedures are followed for the new extension, based on the properties of the existing one. In fact, vertical extension of existing buildings is being adopted in several major European cities as a means of sustainable recovery and growth. Vertical extensions are also very useful in responding to the demand, born after the COVID-19 pandemic, for new living and working spaces that allow safe social distancing. In England, new laws were issued in 2020 to encourage the construction of new living space by adding up to two storeys to existing buildings without any application [38]. Upper extensions are arising in Geneva, Milan, Rotterdam, Vienna, London, and New York City; this strategy is worth spreading because, based on the concept of the circular economy, it is more sustainable than the common approach of demolition/reconstruction of existing buildings, which consumes more energy and materials [39]. Furthermore, within the current urban planning trend of Transit-Oriented Development (TOD), the realization of over-track buildings for exploiting the space above rail infrastructure is becoming quite popular in Japan. A very interesting example is the Dayia Gate Ikebukuro, in Tokyo, an over-track tall building with mid-story isolation, constructed over the Ikebukuro railway station [40].
The authors have deeply examined the dynamic problem of IIS application for building extensions, with the aim of promoting the diffusion of this strategy, which is both sustainable and effective in earthquake-prone zones. A first insight on this topic is provided by the authors in [32], in which a three-storey masonry building is selected as case study and extended by means of different two-storey steel structures, isolated at the base and erected on the top of the existing building. In [33], the authors developed a proof-of-concept study for the large-scale application of this strategy, with reference to the town of Pozzuoli (South Italy). Finally, a design procedure has been defined and illustrated in [31]. The key point of this procedure is the parametric response spectrum analyses performed on lumped mass models by varying the mechanical properties of the building extension. As a result, so called IIS design spectra are derived and used for selecting design solutions for the vertical extension that do not alter or reduce the response of the existing lower structure.
In this paper, the procedure described above is improved by considering the nonlinear behaviour of the masonry structure of the existing building and of the isolation system, made of High Damping Rubber Bearings. The novelty of the paper therefore lies in the assessment of the effect of nonlinearities in structural complexes with IIS. The authors’ aim is to check the accuracy and reliability of IIS design spectra as a tool for the preliminary design of an isolated vertical extension. In the light of the analysis results, the IIS approach for vertical extension is discussed and some design implications are suggested.
2. Procedure Framework
In the research carried out so far by the authors, some existing buildings were chosen and analysed as case studies of vertical extension with IIS [32,33]. The case studies include low-rise masonry buildings in Pozzuoli, an Italian town close to Naples, where a recent plan has been issued for reconstructing the upper floors (demolished nearly forty years ago) of several buildings of the historic centre. These buildings, therefore, appear as optimal candidates for investigating vertical extension with IIS.
The procedure for the design and assessment of vertical extension with IIS consists of four main steps, fully described in [31] and briefly recalled here. The steps concern:
- Examination of the existing building;
- Parametric response spectrum analysis on simplified lumped mass model;
- Selection and design of one or more solutions;
- Advanced analyses on refined models of the design solution(s).
The proposed procedure is described in the following sections by selecting a masonry existing building as a case study [31]. For the sake of brevity, the results of the dynamic and static analyses, performed on the simplified and refined models of both the reference existing building and the design solutions, are only discussed for the weakest direction of the case study.
3. Examination of the Existing Building
The existing building shown in Figure 1a and thoroughly analysed in [31] is here considered as the lower structure (LS).
3.1. Brief Description of the Existing Building
The existing building selected as the LS in the IIS system is made of unreinforced tuff masonry (URM), with walls having thickness going from 0.75 m to 0.95 m. The mechanical properties assumed for the tuff masonry material are: average weight 16 kN/m3, Young modulus 1080 MPa, shear modulus 360 MPa, compression strength 3.0 MPa () and diagonal cracking tensile strength () 0.10 MPa.
The existing building originally had three stories above the ground; following the bradyseismic events that occurred in the city of Pozzuoli in the 1980s, the third storey, and the second storey of the building on the left side, were demolished. Therefore, the foundations and the masonry walls, designed for bearing such an extra load, can in their current state be considered able to bear the vertical extension (Figure 1a). Moreover, the vertical extension, designed in steel structural material, will be lighter than the demolished masonry storey. Finally, it is well known that masonry buildings have a compression strength demand-to-capacity ratio between one fifth and one tenth [41,42]. A verification of the compressive stress in the walls due to gravity loads at the ultimate limit state has also been carried out. The average value of compression strength demand to capacity ratio derived from the analysis is equal to 8%, confirming that this masonry structure can be chosen as a case study for investigating vertical extension with IIS.
3.2. Seismic Assessment of the LS
The first step of the proposed procedure (Section 2) aims to characterize the dynamic behaviour and lateral strength capacity of the LS.
The three-dimensional Finite Element (3D FE) model of the LS, built by means of the software SAP2000 [43], is shown in Figure 1b. As observed in Figure 1a, the masonry buildings in aggregate show vertical setbacks that are removed to provide the same rooftop level, corresponding to the isolation layer. For this aim, a “filling” steel structure has been added on the roof of the first building on the left side; furthermore, the masonry walls of the second and third buildings have been extended with the same masonry material so that they all reach the same height (Figure 1b).
The structural system of the unreinforced masonry (URM) building is made of vertical walls connected by horizontal spandrels. The modelling approach adopted in this paper is the equivalent frame model (EFM) with weak spandrels [44], a simplified approach that is very common in engineering practice [44,45,46]. Neglecting the flexural contribution of the spandrels, the model is composed of vertical cantilever beams (the piers) connected to each other at floor levels through a rigid diaphragm.
A concentrated plasticity model is used for describing the flexural and shear nonlinear behaviour of masonry piers [44,47,48,49]. Two flexural hinges are assigned at both ends of each pier, while one shear hinge is assigned at the centre of each pier. Only the diagonal cracking (Equation (2)) has been considered as a possible shear failure mechanism [50] since it is the most likely failure mode for URM with irregular blocks, as also suggested by the Italian code [51]. The sliding shear failure, which is related to the un-cracked section and thus, in turn, to the flexural behaviour, has not been considered in the model. For this reason, the shear-flexure interaction in the plastic hinges is neglected. The flexural and diagonal shear resistances are calculated using the formulas reported in the Italian code [51,52] and recalled below:
where: l, t, and are the length, the thickness and the stress compression due to gravity load of the masonry piers, respectively; is a factor that takes into account the shear stress distribution in the cross section and is related to the aspect ratio of the wall [53].
The plastic hinge properties at yielding and ultimate limit states are given in Figure 1c.
Push over analyses were carried out on the 3D FE model of the LS (Figure 1b) by means of the software SAP2000 [43]. The push over curve for the weakest Y direction (Figure 1b) and uniform loading pattern, which corresponds to the lowest capacity of LS, is provided in Figure 1d, along with the bilinear force–displacement relationship obtained according to the N2 method [54]. The dynamic properties of the equivalent single degree-of-freedom model (SDOF LS, Figure 2a) are: mass = 2472 kNs2/m, lateral stiffness = 639,883 kN/m, fundamental period 0.39 s, damping constant = 3983 kNs/m, equivalent viscous damping ratio = 0.05, and fundamental circular frequency 16.11 rad/s, where the ~ symbol refers to the reduced order model.
4. Parametric Response Spectrum Analysis and IIS Design Spectra
The second step of the proposed procedure aims to check the viability of the approach, understand the dynamic response of the IIS, and choose the dynamic characteristics of the added structure and isolation system that contribute to minimizing the seismic demand on the entire structure. For these aims, parametric response spectrum analysis (RSA) was carried out on simplified three-degrees-of-freedom model of IIS (3DOF IIS (Figure 2b)) by varying the characteristics of the intermediate isolation system (ISO) and of the extension, considered as the upper structure (US). The mass, stiffness, and damping constants of the LS (i.e., , , and ) are the same dynamic properties of the SDOF LS (Figure 2a) described in the previous Section 3.2. The mass, stiffness, and damping constants of the ISO and US are termed as: , , , and , , , respectively. To define , , , and , the following parameters are introduced:
- -
- mass ratio α = = 0.25, where: is the mass of the isolated vertical addition, and = 1.5;
- -
- stiffness ratio K = = 1.25;
- -
- period of the isolated extension = [0.05–5] s.
By selecting a steel braced frame structure for the addition, an equivalent viscous damping ratio = 0.02 was adopted for the US, while for the isolation system made of High Damping Rubber Bearings (HDRB), an equivalent viscous damping ratio = 0.15 was considered.
With these assumptions, the values of the mass, stiffness, and damping constants of the isolated vertical addition are provided in Table 1; the values of the fundamental period and circular frequency of the standalone (not isolated) upper structure, and , and of the isolation system, and , are provided as well.
Figure 2 also depicts the relative displacements of the DOFs with respect to the ground, i.e.,: dLS, relative displacement of the LS in the SDOF LS; d1,IIS, d2,IIS, and d3,IIS, relative displacements of the first, second, and third degree of freedom of the 3DOF IIS.
Since the three DOFs show very different damping ratios (i.e., ξLS = 0.05, ξISO = 0.15, ξUS = 0.02), the 3DOF IIS model is characterized by non-proportional (or non-classical) damping. The assumption of proportional (or classical) damping, for which the off-diagonal terms of the damping matrix can be neglected, may result in nonconservative response prediction [55]. By adopting the fully populated damping matrix, the equations of motion are coupled and involve complex modal coordinates and complex eigenvectors [56]. Being a non-classically damped system, the RSA was developed by means of the method described by Sinha and Igusa [57].
The analysis takes as reference the horizontal elastic response spectrum in acceleration provided by the Italian seismic code [52] at the Life Safety level (10% probability of exceedance in 50 years). For the case of Pozzuoli, the elastic acceleration response spectrum is plotted in Figure 3a with the following parameters: ag = 0.162 g, site ground acceleration; F0 = 2.347, maximum value of the amplification factor for horizontal acceleration; TC* = 0.333 s, reference value to calculate the period corresponding to the starting point of the constant velocity branch; S = 1.472, factor depending on the soil and topographic categories; CC = 1.509, factor depending on the soil category; ξ = 0.05, viscous damping ratio.
The analysis results of the linear RSA can be plotted in terms of different global response parameters (absolute acceleration, as; base shear, Vb; drift of the first DOF, d1,IIS), and as a function of TISO/TLS, which is the major design parameter, once the size (and the mass) of the vertical extension has been set. The typical trend of the RSA results is shown in Figure 3b, which refers to the IIS made by the LS here chosen as an example and the steel vertical extension plus the HDRB isolation system. The graph represents the so called “nonconventional TMD design spectrum” or “IIS design spectrum”, in terms of drift ratio = d1,IIS/dLS, i.e., drift of LS, in the 3DOF IIS model (design configuration) divided by the counterpart in the SDOF LS (as-is configuration).
Three plus-one regions can be clearly distinguished in the graph, i.e.,: zone 1, characterised by displacement ratio values larger than 1; zone 2, characterised by displacement ratio values smaller than 1; zone 3, characterised by displacement ratio values almost equal to 1; and a transition zone, between zones 2 and 3, characterised by displacement ratio values gradually approaching to 1.
Zone 1, where TISO/TLS < 1 and > 1, exemplifies the case of existing buildings expanded with vertical additions rigidly connected to the substructure. The solutions that fall into the zone 3, where TISO/TLS > 5 and is close to 1, correspond to a nearly perfect disconnection between vertical extensions and substructure (isolation effect). In this case, the isolated upper structure works as a structure isolated at its base (BIS), with values of TISO enough long to exclude any dynamic interaction with the substructure.
For period ratios TISO/TLS approximately in the range 1–5, the ratio < 1 and an advantageous dynamic interaction arises between the two structural parts. The isolated upper structure in fact acts as a TMD for the lower structure, thus reducing the displacement response of the system (mass damping effect). It is worth observing that the range of period ratios TISO/TLS = 1–3 identifies zone 2, conventionally defined for ≤ 0.9; then, in the range TISO/TLS = 3–5, the displacement ratio increases from 0.9 to 1.0.
Hence, in brief, the results provided in Figure 3b lead to the following remarks:
- The seismic demand on the LS of the IIS building can be almost the same as the existing construction if the isolation system (ISO) is designed to disconnect the upper and lower structures; or, even better, the seismic demand can be reduced if the isolation system is designed to connect appropriately the two portions, thus converting the isolated extension into a mass damper with a large mass ratio.
- For ratios of TISO/TLS not much larger than 1 (zone 2), the mass damping effect arises, and the isolated upper structure (US + ISO) works as a nonconventional (tuned or un-tuned) mass damper (TMD) for the lower structure (LS), leading to a reduced top displacement in the masonry lower structure as compared to the original building;
- For ratios TISO/TLS much larger than 1 (zone 3), the isolation effect is emphasized, with almost no variation in the top displacement of the existing lower structure with respect to value registered in the as-is configuration.
Other examples of IIS design spectra, derived for buildings characterized by different values of the fundamental period (i.e., TLS = 0.18, 0.55, 0.72, 0.81 s), are given in Figure 4 [33], where the base shear ratio ( = Vb,IIS/Vb,LS) is chosen as response parameter and depicted as a function of the period of the isolation system TISO. The displacement ratio, adopted for plotting the results in Figure 3b, could be chosen also in this case, with only a change in the y-axis scale but not in the results trend, due the linearity of the analysis.
In each chart, by varying the value of the mass ratio α, the results are provided as fitting curves [33]. Each fitting curve is obtained by post-processing the results, representing the effect of stiffness ratio K (K = = 0.1, 0.5, 1, 2), through low-pass and mean filters [58].
In general, the beneficial effect of mass ratio α on the mass damping zone can be clearly observed: by adopting larger values of the mass ratio, the shear response is reduced for a wider range of periods of the isolation system.
It is also worth observing that not all the cases corresponding to < 1 can be considered as feasible design solutions; the minimum values of the shear ratio, in fact, often correspond to excessively flexible upper structures (K < 1). Moreover, although < 1, an unfavourable resonance response, can arise in the upper structure, this occurrence, due to the coupling of higher modes of US and LS, does not depend on TISO and leads to an amplified response of the vertical addition [32,59]. Nevertheless, since mode coupling arises when the periods of the two higher modes in the 3DOF IIS model are comparable (maximum scatter of 15%), this detrimental effect can be predicted and avoided by design [59].
By varying the period of the lower structure, TLS, the same trend observed in Figure 3b is obtained, with the fixed-base, mass damping and isolation behaviour zones clearly recognizable. The differences only emerge when looking at the case of a very stiff lower structure (TLS = 0.18 s): for a large mass ratio (α = 1.0, 2.0), the dynamic behaviour does not show the range of the mass damping effect, which instead arises, though limited, for smaller mass ratios (α < 0.5). For the other cases, in addition to the beneficial effect of mass ratio α on the whole period range, it can be observed that the range of TISO where < 1 becomes wider as TLS increases.
These charts, taken as a whole, provide useful indications on the design parameters; as an example, let us consider the line = 0.9 and the fitting curves for α = 0.25 (grey curves) in each chart of Figure 4. It can be observed that as TLS increases, the number of design solutions for ≤ 0.9 increases (grey shaded area in the charts). Furthermore, as TLS increases, the values of TISO corresponding to the minimum of the fitting curves (shown with red circle markers) become longer. For the most flexible lower structure (e.g., TLS = 0.81 s) and the fitting curve corresponding to the largest mass ratio (e.g., α = 2, blue curve), the number of design solutions corresponding to ≤ 0.9 further increases (blue shaded area in Figure 4d) compared to the case of α = 0.25.
5. Selection of Design Solutions
The IIS design spectrum offers the possibility of selecting alternative design solutions, characterized by different dynamic behaviour. Four solutions designated in Figure 3b as B, C, D, E, are chosen and explored (Figure 5a). Solution B corresponds to the minimum response, thus it can be considered as the optimal solution, according to the modelling approach and analysis methods adopted herein (3DOF model, linear RSA). Solution C also falls into zone 2, where a non-negligible response reduction is expected, while Solution D is in the transition zone; finally, the Solution E corresponds to almost perfect isolation, with values of the response parameters very close to those of the LS in the as-is configuration. A conventional vertical extension, consisting of US without an isolation system, designated as Solution A in Figure 3b, is also considered for comparison.
Both the isolation system and the upper structure of each structural solutions have been designed. The upper structure, a steel structure with braced frames, remains the same in all solutions A, B, C, D, E. Characterized by K = 1.28 and TUS = 0.14 s with TUS < TISO/3, it has been designed to avoid higher mode coupling with the lower structure and to be sufficiently stiffer than the isolation system. The isolation system, which governs the dynamic behaviour of the extended building, is made by High Damping Rubber Bearings (HDRBs), with an equivalent viscous damping ratio ξISO = 0.15. It has been designed to provide a global secant stiffness kISO such that the selected values of TISO (TISO = 0.5 s; 1.0 s; 1.5 s; 5.0 s) are obtained as: TISO = 2π(MISO/kISO)0.5, with MISO = 940 kNs2/m the total isolated mass of the steel superstructure plus the isolation system.
The schematic representation of the isolation system, composed by 10 HDRBs placed at the intersection of orthogonal masonry walls, is provided in Figure 5b,c, respectively in elevation and in plan.
6. Time History Analyses on 3D Models and Comparison to IIS Design Spectrum
6.1. Modelling Approaches and Analysis Types
The results on IIS behaviour discussed above have been derived from linear response spectrum analyses. In the next step, some simplified assumptions and limitations are removed in order to assess the effectiveness of IIS through more accurate models and methods. Hence, the three-dimensional (3D) FE models of the selected solutions (Figure 5b) are built in the SAP2000 computer code [43] and analysed through linear and nonlinear time history analyses (THA). The cases of standalone lower structure and of conventional vertical extension, consisting of US attached to the LS without any isolation system (designated as A in Figure 3b), have also been considered.
In the nonlinear THA, the 3D FE model of the LS already utilized for the push-over analyses (see Section 3.2) is retained. However, in the 3D models of the IIS design solutions, the values of the ultimate bending moment for the flexural plastic hinges at the ends of masonry piers are updated to consider the compression due to the gravity load of the vertical extension. This additional compression has a general stabilizing effect for the LS, which is reflected in a reduction in the tensile stress arising in the walls for lateral load. The Pivot-type hysteretic model is adopted for describing the cyclic response of both hinges in bending and shear (Figure 6a), with the values of the parameters α1, α2, β1, β2, and ηPivot defined to control the shape of the hysteresis loops and the stiffness and strength degradation. In particular, α1 defines the position of the pivot points P1 and P2, whereas α2 defines the position of the pivot points P3 and P4 for unloading from positive and negative force, respectively. β1 and β2 define the position of the pinching pivot points PP1 and PP2 for reverse loading from zero toward positive and negative force, respectively. The parameter ηPivot determines the amount of degradation of the elastic slopes after plastic deformation. According to [60], the model parameters α1, α2, β1, and β2, are here set equal to 0.45, while the parameter ηPivot is set equal to zero. More details on the modelling approach adopted here for the hysteretic behaviour of masonry are provided in [31,60].
Concerning the isolation system (Figure 5c), the hysteretic behaviour of HDRBs can be reasonably described by the bilinear constitutive model calibrated as follows [61] (Figure 6b). If the values are known of global secant stiffness kISO, design displacement SDe (from the displacement design spectrum at TISO), and equivalent viscous damping ratio ξISO, number of isolators n, then, the values of secant stiffness keff, initial stiffness k1, post-yield stiffness k2, intersection between the prolongation of post-yield branch and the y-axis Q, and yield displacement Dy, can be derived according the following formulas:
The secant stiffness keff (Equation (3)) is obtained by dividing the global secant stiffness kISO for the number of isolators (n = 10). By specifying the value of the equivalent viscous damping ratio (Equation (4), ξISO = 0.15) and neglecting Dy, we can calculate a first estimate for Q(1), k2(1) and k1(1) from Equation (5). From these values, we can derive the value of Dy through Equation (6) and recalculate Q, k2, and k1 (Equation (7)).
Data on the bilinear constitutive model of the isolators utilized in the design solutions B, C, D, E are reported in Table 2.
In this procedure, the definition of the design displacements SDe(T) is an issue to be further investigated. The idea is to derive floor spectra in terms of displacement for the design of the isolation system.
The seismic isolators can be preliminarily sized from data sheets of producers, e.g., [62]. As an example for the solution B (TISO = 0.5 s), set the values of design displacement and secant stiffness close to Sde and keff, respectively, and by choosing hard rubber (G = 1.4 MPa), an isolator diameter of 900 mm and total rubber thickness of 60 mm are derived. For the configuration E (TISO = 5 s), a solution with quite small isolators (200 mm diameter, 75 mm total rubber thickness) is derived even when considering a soft rubber (G = 0.4 MPa). Therefore, a mixed solution (isolators plus sliders) could be a better choice.
Because the design solutions are non-classically damped systems (see Section 4), the fully populated damping matrix, which leads to coupled equation of motions, is accounted for through direct integration THA [43]. Direct integration THA is also developed for the 3D FE model of the as-is configuration. The method of superposition of modal damping matrices [43,63] has been used for constructing the viscous damping matrix, as recommended by [64]. In both model types, representing the as-is configuration and the design configurations (A–E), energy dissipation sources other than that associated with the yielding of structural elements have been accounted for through viscous damping. For the masonry LS in the as-is configuration, a single value of the modal damping ratio is specified, equal to 5%. For the IIS configurations, different values of modal damping ratios have been attributed to the modes based on the structural portion (LS, ISO, US) that contributes more significantly to structural response. Therefore, a modal damping ratio equal to 0 is attributed to the first three modes, which manly involves the isolated upper structure, since the energy dissipating mechanisms usually accounted through viscous damping do not arise either at the isolated level or in the US (which follows the isolation system almost rigidly). For the modes from the fourth to the twelfth, mainly involving the LS, the values of the modal damping ratios are 5%. Higher modes involving the US are not present, due to its high stiffness.
Seven earthquake records are selected by means of the software REXEL v 3.5 [65] from the SIMBAD database [66] (for PGA = [0.1, 0.3] g and T = [0.15, 2] s); the record set is selected to derive an average spectrum close to the response spectrum of the site (Figure 3a), with upper and lower tolerance of 30% and 10% (Figure 7). The major data of the ground motion records are provided in Table 3.
The horizontal component of the ground motion has been applied only in the weakest direction (i.e., Y-direction) and only the nonlinear behaviour of in-plane masonry piers in the Y-Direction has been considered. Moreover, the possible couplings between the two horizontal components and between the horizontal and vertical components of the ground motion have been neglected. Soil–structure interaction has also been neglected.
The results of linear and nonlinear THA are compared to the RSA results.
The object of comparison is threefold, and concerns:
- modelling of the as-is and retrofitted building configurations: lumped mass (3DOF IIS and SDOF LS) vs. three-dimensional (3D FE IIS and 3D FE LS) models;
- assumption of the mechanical behaviour of the existing structure and of the isolation system: equivalent linear vs. nonlinear behaviour;
- seismic input and analysis type: code elastic spectrum and Response Spectrum Analysis (RSA) vs. ground motion acceleration records averagely matching the elastic spectrum and Time History Analyses (linear and nonlinear THA).
All in all, the final aim is the evaluation of step 2, i.e., parametric RSA on the lumped mass model and the resulting IIS design spectrum, as a reliable prediction of the actual response of IIS. That is, though some slight scatter between the values of response parameters is allowable, the behaviour trend should be confirmed.
In the following, linear time history analyses on 3D FE building models are first carried out in order to establish the effects of modelling (lumped mass vs. three-dimensional models) and seismic input (Figure 8, Figure 9, Figure 10 and Figure 11). Nonlinear analyses considering only the hysteresis of either the substructure or the isolation system are then performed. Fully nonlinear analyses accounting for both mechanical nonlinearities (in the LS and ISO) are finally executed.
6.2. Linear THA
A preliminary comparison is given in Figure 8a, where the IIS design spectrum (displacement ratio vs. fundamental period of the IIS) is contrasted to the blue markers, representing the results of linear THAs carried out on the 3D FE models of the six design solutions (A–E). The markers are obtained as average values of the peak displacements exhibited under the seven seismic inputs and are plotted as a function of the fundamental period T1 of the structural complex after addition. The markers are almost coincident with the curve derived from RSA on lumped mass models. Therefore, it seems that, when the LS of the IIS complex remains in the elastic field, the IIS design spectrum provides a very good estimate of the expected behaviour in terms of displacement demand.
6.3. Nonlinear THA: Nonlinearity in the Lower Structure
A comparison analogous to the one in Figure 8a is given in Figure 8b, where the markers provide the result of nonlinear THA on 3D models of IIS, with the LS described through the Pivot-type model, as reported in Section 6.1. For both the US and the isolation system, linear modelling is adopted. The results seem in agreement with the RSA curve for cases B (TISO = 0.5 s, T1 = 0.63 s) and C (TISO = 1 s, T1 = 1.06 s); some scatters are observed for cases D (TISO = 1.5 s, T1 = 1.54 s) and E (TISO = 5 s, T1 = 5.01 s). However, it is worth observing that these displacement ratios are smaller than the RSA counterparts. Therefore, even when the lower structure has nonlinear behaviour, the IIS spectrum can be used for the preliminary design of IIS, since it provides an estimate on the safe side of the expected behaviour.
6.4. Nonlinear THA: Nonlinearity in the Isolation System
Further analyses on 3D FE models have also been performed by accounting for the nonlinear response of the isolation system, made of HDRBs, as discussed in Section 6.1. Linear behaviour for the lower structure is considered in these analyses, while subsequently nonlinear behaviour of both the isolation system and the lower structure is considered.
In Figure 9a, the RSA curve is contrasted to the results of nonlinear THA on the 3D FE models only accounting for the nonlinearity in the isolation system. A substantial correspondence of nonlinear analysis results with RSA is found for the cases B and E, while the values of displacement ratio derived from nonlinear THA for the design solutions C and D are slightly lower than the RSA counterparts. Therefore, also accounting for the hysteretic behaviour of the isolation devices, the RSA provides an estimate of the expected behaviour on the safe side.
6.5. Nonlinear THA: Nonlinearity in the Lower Structure and Isolation System
Finally, both the lower structure and the isolators are modelled accounting for their hysteretic response, as reported in the previous Section 6.1.
In Figure 9b, the relevant results of the nonlinear THA on the 3D FE models are compared to the IIS design spectrum. The case C and the RSA curve show similar values of displacement ratio. However, a displacement demand larger than one, and thus much larger than the value predicted from RSA, was obtained for the design solution B. The value of the displacement ratio larger than one implies an increase, rather than a reduction, of displacement compared to the reference LS model, which in turn implies that IIS spectrum derived by means of RSA seems neither accurate nor safe as a design tool for maximizing the mass damping effect.
Therefore, when the nonlinear behaviour of both the isolation devices and the lower structure are considered, the RSA provides an estimate of the expected behaviour on the safe side for isolation periods falling in the transition zone or longer. Indeed, for the cases D and E, significant differences can be observed between the RSA curve and the nonlinear THA results; however, the latter are smaller than the former. Hence, the RSA-based predictions of seismic demand remain on the safe side, though not accurate.
Comparing the IIS solutions to the conventional extension (point A, T1 = 0.43 s), in most cases the IIS counterparts exhibit lower displacement demand. However, fully nonlinear analyses, accounting for the hysteretic behaviour of both masonry structure and isolation system, have highlighted that design solutions that maximize the mass damping effect (design zone 2, case B in Figure 9b) can exhibit an amplification, rather than a reduction, of the seismic response.
Since solution B is the only one that does not follow, more or less closely, the trend predicted through linear RSA and confirmed by linear THA, it needs further investigation. Considering that nonlinear THA response is particularly sensitive to the modelling assumptions, additional analyses are currently being developed by the authors, by modifying the values of the modal damping ratios (ηi) attributed to the masonry structure modes (i.e., to all modes, for the LS in the as-is configuration; from the fourth to the twelfth modes, for the IIS configurations). In addition to the value of 5% adopted in this paper, the value 2% has also been specified for ηi. The results obtained from analyses with ηi = 2% are compared to the ones with ηi = 5% in terms of displacement ratio in Figure 10. Here, it can be observed that the results for the design solutions A (conventional extension) and E (perfect isolation) are very close varying ηi. However, for the solutions B, C, and D, larger scatters can be observed, particularly for solution B. These preliminary results highlight that the modal damping value strongly influences the structural response in nonlinear THA.
6.6. Linear and Nonlinear THA: The Base Shear Ratio
In Figure 11, the IIS design spectrum is compared to markers, representing the average peak results of the seven THAs on the design solutions in the case in which masonry structure and isolation system are both assumed to be elastic (Figure 11a), or the masonry structure is assumed to be elastic and the isolation system inelastic (Figure 11b). In particular, the markers are depicted both in terms of displacement ratio and base shear ratio, and the RSA curves for and are overlapped since they represent results in normalized form. As can be seen in Figure 11, the THA values of the base shear ratio are slightly larger than the displacement ratio counterparts, both neglecting or considering the nonlinear behaviour of the isolation system.
This comparison is only reported for the analyses where the LS is linear, since the base shear ratio is not indicative of the IIS response when the hysteretic behaviour of the masonry structure is considered. As shown in [31], by comparing the push-over curves and the global hysteretic loops under selected seismic inputs, it clearly appears that the former are the backbones of the latter. Exceeding the elastic limit of the masonry structure, the top displacement increases under an almost constant value of base shear. For this reason, when the existing structure undergoes inelastic deformations, in the as-is configuration and/or in the design solution, the base shear ratio is not representative of the seismic response of the IIS.
7. Conclusions
In this paper, time history analyses were carried out on 3D FE models of an existing masonry building, selected as a case study, and on some design configurations of the same building, consisting in vertical extensions through IIS. The aim was to assess the validity and accuracy of the prediction derived from response spectrum analyses on lumped-mass models for preliminary design purpose. Conventional extension has been also considered for comparison.
Based on the results of the linear and nonlinear THA, the following conclusions can be derived:
- The dynamic behaviour of the 3D FE model of the extended building can be reasonably estimated through the simplified 3DOF IIS model;
- Based on the results of linear THA, the peak displacement demand in the lower structure is reduced for low–medium values of TISO (zone 2, mass damping effect);
- Considering the nonlinear behaviour either for the masonry structure only, or for the isolation system only, a reduced response in the existing building is still obtained for low-medium values of TISO (zone 2, mass damping effect);
- Considering the hysteretic behaviours of both the masonry structure and the isolation system, some reductions in the displacement response are obtained, but only for medium–large values of TISO (transition zone and beyond);
- When a building should be vertically expanded, the adoption of an isolation interface between the existing and the new structures usually enhances the seismic performance of the existing structural portion with respect to the case of a vertical extension conventionally realised (without isolation system).
- However, fully nonlinear analyses, accounting for the hysteretic behaviour of both masonry structure and isolation system, have highlighted that design solutions that maximize the mass damping effect can lead to an amplification, rather than a reduction in the seismic response.
- The results have also highlighted a remarkable influence of the modal damping values adopted in nonlinear THA on the structural response. When the lower structure exhibits significant inelastic deformations, the design of isolated vertical extension in the mass damping zone seems not advisable.
- It is worth underlying that all the above results have been obtained with reference to a single case study. In order to confirm the seismic performance that can be achieved through IIS, other case studies should be considered for further analyses and deeper insights.
Author Contributions
Conceptualization, F.E., D.F. and E.M.; Methodology, F.E., M.A., D.F. and E.M.; Software, F.E., M.A. and D.F.; Validation, F.E., D.F. and E.M.; Formal analysis, F.E., M.A. and D.F.; Investigation, F.E., M.A., D.F. and E.M.; Resources, F.E. and E.M.; Data curation, F.E.; Writing—original draft, F.E., D.F. and E.M.; Writing—review & editing, F.E., D.F. and E.M.; Visualization, F.E. All authors have read and agreed to the published version of the manuscript.
Funding
This research was partially supported by the projects DPC—ReLUIS 2022–2024, WP15—Contributi normativi relativi a Isolamento e Dissipazione: CUP G53C22000200001 “Progetto ReLUIS 2022–2024.
Institutional Review Board Statement
Not applicable.
Informed Consent Statement
Not applicable.
Data Availability Statement
Not applicable.
Conflicts of Interest
The authors declare no conflict of interest.
References
- De Angelis, M.; Perno, S.; Reggio, A. Dynamic response and optimal design of structures with large mass ratio TMD. Earthq. Eng. Struct. Dyn. 2012, 41, 41–60. [Google Scholar] [CrossRef]
- Tsuneki, Y.; Torii, S.; Murakami, K.; Sueoka, T. Middle-story isolated structural system of high-rise building. In Proceedings of the 14th World Conference on Earthquake Engineering, Beijing, China, 12–17 October 2008. [Google Scholar]
- Tsuneki, Y.; Torii, S.; Murakami, K.; Sueoka, T. Middle-story isolated structural system of high-rise building. J. Disaster Res. 2009, 4, 229–238. [Google Scholar] [CrossRef] [Green Version]
- Faiella, D.; Mele, E. Insights into inter-story isolation design through the analysis of two case studies. Eng. Struct. 2020, 215, 110660. [Google Scholar] [CrossRef]
- Kobayashi, M.; Sasaki, D. Making a seismic design database of mid-story isolated buildings and structural property evaluation based on response prediction method. AIJ J. Technol. Des. 2009, 15, 65–70. [Google Scholar] [CrossRef] [Green Version]
- Murakami, K.; Kitamura, H.; Ozaki, H.; Teramoto, T. Design and analysis of a building with the middle-story isolation structural system. In Proceedings of the 12th World Conference of Earthquake Engineering, Auckland, New Zealand, 30 January–4 February 2000; Volume 857, pp. 1–8. [Google Scholar]
- Sueoka, T.; Torii, S.; Tsuneki, Y. The application of response control design using middle-story isolation system to high-rise building. In Proceedings of the 13th World Conference on Earthquake Engineering, Vancouver, BC, Canada, 1–6 August 2004. [Google Scholar]
- Okada, K.; Yoshida, S. Structural design of Nakanoshima festival tower. Int. J. High-Rise Build. 2014, 3, 173–183. [Google Scholar] [CrossRef]
- Nakagawa, K.; Shimazaki, D.; Yoshida, S.; Okada, K. Application of seismic isolation systems in Japanese high-rise builings. Int. J. High-Rise Build. 2015, 36–38. [Google Scholar]
- Tamari, M.; Yoshihara, T.; Miyashita, M.; Ariyama, N.; Nonoyama, M. Structural design and performance evaluation of a mid-story seismic isolated high-rise building. Int. J. High-Rise Build. 2017, 6, 227–235. [Google Scholar] [CrossRef] [Green Version]
- Dutta, A.; Sumnicht, J.F.; Mayes, R.L.; Hamburger, R.O.; Citipitioglu, A. An innovative application of base isolation technology. In Proceedings of the ATC & SEI Conference on Improving the Seismic Performance of Existing Buildings and Other Structures, San Francisco, CA, USA, 9–11 December 2009; pp. 841–854. [Google Scholar]
- Sumnicht, J. On the Grid-Seismic Isolators, Sandwiched between Two Steel Grids, Separate an Existing San Francisco Building from Its Vertical Addition; American Institute of Steel Construction, Inc.: Chicago, IL, USA, 2008. [Google Scholar]
- Murakami, K.; Kitamura, H.; Matsushima, Y. The prediction for seismic responses of the two-mass model with the mid-story isolation system. J. Struct. Constr. Eng. 2001, 66, 51–58. [Google Scholar] [CrossRef] [Green Version]
- Murakami, K.; Suoeka, T. Proposal of a seismic design method for mid-story isolated structural system using a two-mass analysis model. In Proceedings of the International Symposium of Network and Center-Based Research for Smart Structures Technologies and Earthquake Engineering, Osaka, Japan, 6–9 July 2004; SE04-075. [Google Scholar]
- Tasaka, M.; Mori, N.; Yamamoto, H.; Murakami, K.; Sueoka, T. Applying seismic isolation to buildings in Japan—Retrofitting and middle-story isolation. In Proceedings of the Structures Congress 2008: 18th Analysis and Computation Specialty Conference, 24–26 April 2008; pp. 1–11. [Google Scholar] [CrossRef]
- Akiyama, H. Earthquake-Resistant Limit-State Design for Buildings; University of Tokyo Press: Tokyo, Japan, 1985; ISBN 978-0-86008-377-1. [Google Scholar]
- Wang, S.J.; Chang, K.C.; Hwang, J.S.; Lee, B.H. Simplified analysis of mid-story seismically isolated buildings. Earthq. Eng. Struct. Dyn. 2011, 40, 119–133. [Google Scholar] [CrossRef]
- Moriizumi, E.; Kobayashi, M. A study on earthquake response considered vibration characteristics of superstructure and substructure of seismically isolated buildings. In Proceedings of the 15th World Conference on Earthquake Engineering, Lisboa, Portugal, 24–28 September 2012; p. 1792. [Google Scholar]
- Kobayashi, M.; Koh, T. Modal coupling effects of mid-story isolated buildings. In Proceedings of the 14th World Conference on Earthquake Engineering, Beijing, China, 12–17 October 2008. [Google Scholar]
- Wang, S.J.; Chang, K.C.; Hwang, J.S.; Hsiao, J.Y.; Lee, B.H.; Hung, Y.C. Dynamic behavior of a building structure tested with base and mid-story isolation systems. Eng. Struct. 2012, 42, 420–433. [Google Scholar] [CrossRef]
- Wang, S.J.; Hwang, J.S.; Chang, K.C.; Lin, M.H.; Lee, B.H. Analytical and experimental studies on midstory isolated buildings with modal coupling effect. Earthq. Eng. Struct. Dyn. 2013, 42, 201–219. [Google Scholar] [CrossRef]
- Wang, S.J.; Lee, B.H.; Chuang, W.C.; Chang, K.C. Optimum dynamic characteristic control approach for building mass damper design. Earthq. Eng. Struct. Dyn. 2018, 47, 872–888. [Google Scholar] [CrossRef]
- Wang, S.J.; Lee, B.H.; Chuang, W.C.; Chiu, I.C.; Chang, K.C. Building mass damper design based on optimum dynamic response control approach. Eng. Struct. 2019, 187, 85–100. [Google Scholar] [CrossRef]
- Ikeda, Y. Fundamental equation based on pole allocation for interstory seismic isolation of buildings. Struct. Control. Health Monit. 2021, 28, e2687. [Google Scholar] [CrossRef]
- Ikeda, Y.; Matsumoto, Y. Unified description of passive vibration control for buildings based on pole allocation applied to three-degree-of-freedom model. Struct. Control. Health Monit. 2022, 29, e2995. [Google Scholar] [CrossRef]
- Reggio, A.; Angelis, M.D. Optimal energy-based seismic design of non-conventional Tuned Mass Damper (TMD) implemented via inter-story isolation. Earthq. Eng. Struct. Dyn. 2015, 44, 1623–1642. [Google Scholar] [CrossRef]
- Basili, M.; Angelis, M.D. Experimental Dynamic Response of a Multi-Story Frame Structure Equipped with Non-Conventional TMD Implemented via Inter-Story Isolation. Appl. Sci. 2022, 12, 9153. [Google Scholar] [CrossRef]
- Donà, M.; Bernardi, E.; Zonta, A.; Minotto, M.; da Porto, F.; Tan, P. Effectiveness and optimal design of fluid-viscous dampers for inter-storey isolated buildings. In Proceedings of the XVIII ANIDIS Conference, Ascoli Piceno, Italy, 15–19 September 2019. [Google Scholar]
- Donà, M.; Bernardi, E.; Zonta, A.; Tan, P.; Zhou, F. Evaluation of optimal FVDs for inter-storey isolation systems based on surrogate performance models. Bull. Earthq. Eng. 2021, 19, 4587–4621. [Google Scholar] [CrossRef]
- Bernardi, E.; Donà, M.; Tan, P. Multi-objective optimization of the inter-story isolation system used as a structural TMD. Bull. Earthq. Eng. 2023, 21, 3041–3065. [Google Scholar] [CrossRef]
- Faiella, D.; Argenziano, M.; Esposito, F.; Brandonisio, G.; Fraldi, M.; Mele, E. Effectiveness of Isolated Vertical Extension of Masonry Buildings as Nonconventional TMD. Soil Dyn. Earthq. Eng. 2023, 165, 107675. [Google Scholar] [CrossRef]
- Faiella, D.; Calderoni, B.; Mele, E. Seismic retrofit of existing masonry buildings through inter-story isolation system: A case study and general design criteria. J. Earthq. Eng. 2022, 26, 2051–2087. [Google Scholar] [CrossRef]
- Argenziano, M.; Faiella, D.; Bruni, F.; De Angelis, C.; Fraldi, M.; Mele, E. Upwards-Vertical Extensions of Masonry Built Heritage for Sustainable and Antifragile Urban Densification. J. Build. Eng. 2021, 44, 102885. [Google Scholar] [CrossRef]
- Chey, M.H.; Chase, J.G.; Mander, J.B.; Carr, A.J. Innovative seismic retrofitting strategy of added stories isolation system. Front. Struct. Civ. Eng. 2013, 7, 13–23. [Google Scholar] [CrossRef]
- Bernardi, E.; Donà, M.; da Porto, F.; Tan, P. Investigations on inter-storey seismic isolation as a technique for adding upper storeys. In Proceedings of the 8th International Conference on Computational Methods in Structural Dynamics and Earthquake Engineering (COMPDYN), Athens, Greece, 27–30 June 2021; National Technical University of Athens (NTUA): Athens, Greece, 2021. [Google Scholar] [CrossRef]
- Donà, M.; Bernardi, E.; Zonta, A.; Saler, E.; da Porto, F. Assessment of the inter-story isolation technique applied to an existing school building. In Current Perspectives and New Directions in Mechanics, Modelling and Design of Structural Systems; CRC Press: Boca Raton, FL, USA, 2022; pp. 233–239. [Google Scholar]
- Ryan, K.L.; Earl, C.L. Analysis and design of inter-story isolation systems with nonlinear devices. J. Earthq. Eng. 2010, 14, 1044–1062. [Google Scholar] [CrossRef]
- GOV.UK. Available online: https://www.gov.uk/government/news/new-laws-to-extend-homes-upwards-and-revitalise-town-centres (accessed on 27 January 2023).
- Urban Flows Observatory—The University of Sheffield. Available online: https://urbanflows.ac.uk/vertical-extension-sustainable-future/ (accessed on 27 January 2023).
- Nakamizo, D.; Kimura, S.; Koitabashi, Y. Safety studies in seismic design of a mid-story isolated over track building. In Proceedings of the 17th World Conference on Earthquake Engineering, 17WCEE, Sendai, Japan, 13–18 September 2020. [Google Scholar]
- Consiglio Superiore dei Lavori Pubblici. Norme Tecniche per la Progettazione, Esecuzione e Collaudo Degli Edifici in Muratura e per il Loro Consolidamento di Cui al Decreto Ministeriale 20 Novembre 1987; Serie Generale n.285 del 05-12-1987—Suppl. Ordinario n. 103; Gazzetta Ufficiale della Repubblica Italiana: Rome, Italy, 1987. (In Italian) [Google Scholar]
- Heyman, J. The stone skeleton. Int. J. Solids Struct. 1966, 2, 249–279. [Google Scholar] [CrossRef]
- Computers and Structures, Inc. SAP2000 Linear and Nonlinear Static and Dynamic Analysis and Design of Three-Dimensional Structures; Computers and Structures, Inc.: Berkeley, CA, USA, 2009. [Google Scholar]
- Ghersi, A.; Lenza, P.; Calderoni, B. Edifici in Muratura Alla Luce Della Nuova Normativa Sismica; Dario Flaccovio Editore: Palermo, Italy, 2020. (In Italian) [Google Scholar]
- Quagliarini, E.; Maracchini, G.; Clementi, F. Uses and limits of the Equivalent Frame Model on existing unreinforced masonry buildings for assessing their seismic risk: A review. J. Build. Eng. 2017, 10, 166–182. [Google Scholar] [CrossRef]
- Cattari, S.; Calderoni, B.; Caliò, I.; Camata, G.; de Miranda, S.; Magenes, G.; Milani, G.; Saetta, A. Nonlinear modeling of the seismic response of masonry structures: Critical review and open issues towards engineering practice. Bull. Earthq. Eng. 2022, 20, 1939–1997. [Google Scholar] [CrossRef]
- Manzini, C.F.; Magenes, G.; Penna, A.; da Porto, F.; Camilletti, D.; Cattari, S.; Lagomarsino, S. Masonry Italian code-conforming buildings. Part 1: Case studies and design methods. J. Earthq. Eng. 2018, 22 (Suppl. 2), 54–73. [Google Scholar] [CrossRef]
- Pasticier, L.; Amadio, C.; Fragiacomo, M. Non-linear seismic analysis and vulnerability evaluation of a masonry building by means of the SAP2000 V. 10 code. Earthq. Eng. Struct. Dyn. 2008, 37, 467–485. [Google Scholar] [CrossRef]
- Ozturk, B. Seismic behavior of two monumental buildings in historical Cappadocia region of Turkey. Bull. Earthq. Eng. 2017, 15, 3103–3123. [Google Scholar] [CrossRef]
- Magenes, G.; Calvi, G.M. In-plane seismic response of brick masonry walls. Earthq. Eng. Struct. Dyn. 1997, 26, 1091–1112. [Google Scholar] [CrossRef]
- Consiglio Superiore dei Lavori Pubblici. Circolare del Ministero delle Infrastrutture e dei Trasporti 21 gennaio 2019, n. 7 Istruzioni per l’Applicazione dell’«Aggiornamento delle Norme Tecniche per le Costruzioni» di cui al Decreto Ministeriale 17 Gennaio 2018; Serie Generale n.35 del 11-02-2019—Suppl. Ordinario n. 5; Gazzetta Ufficiale della Repubblica Italiana: Rome, Italy, 2019. (In Italian) [Google Scholar]
- Consiglio Superiore dei Lavori Pubblici. Circolare del Ministero delle infrastrutture e Dei Trasporti 21 gennaio 2019 “Istruzioni per l’applicazione dell’«Aggiornamento delle “Norme tecniche per le costruzioni”» di cui al decreto ministeriale 17 gennaio 2018”; Gazzetta Ufficiale della Repubblica Italiana: Rome, Italy, 2018. (In Italian) [Google Scholar]
- Tomaževič, M. Shear resistance of masonry walls and Eurocode 6: Shear versus tensile strength of masonry. Mater. Struct. 2009, 42, 889–907. [Google Scholar] [CrossRef]
- Fajfar, P.; Gašperšič, P. The N2 method for the seismic damage analysis of RC buildings. Earthq. Eng. Struct. Dyn. 1996, 25, 31–46. [Google Scholar] [CrossRef]
- Moutinho, C. An alternative methodology for designing tuned mass dampers to reduce seismic vibrations in building structures. Earthq. Eng. Struct. Dyn. 2012, 41, 2059–2073. [Google Scholar] [CrossRef]
- Veletsos, A.S.; Ventura, C.E. Modal analysis of non-classically damped linear systems. Earthq. Eng. Struct. Dyn. 1986, 14, 217–243. [Google Scholar] [CrossRef]
- Sinha, R.; Igusa, T. CQC and SRSS methods for non-classically damped structures. Earthq. Eng. Struct. Dyn. 2012, 24, 615–619. [Google Scholar] [CrossRef]
- Wilmshurst, T.H. Signal Recovery from Noise in Electronic Instrumentation; CRC Press: Boca Raton, FL, USA, 1990. [Google Scholar]
- Faiella, D.; Mele, E. Vibration characteristics and higher mode coupling in intermediate isolation systems (IIS): A parametric analysis. Bull. Earthq. Eng. 2019, 17, 4347–4387. [Google Scholar] [CrossRef]
- Dowell, O.K.; Seible, F.; Wilson, E.L. Pivot hysteresis model for reinforced concrete members. ACI Struct. J. 1998, 95, 607–617. [Google Scholar]
- Naeim, F.; Kelly, J.M. Design of Seismic Isolated Structures: From Theory to Practice; John Wiley & Sons: New York, NY, USA, 1999. [Google Scholar]
- FIP Industriale. Isolatori Elastomerici Serie SI. 2016. Available online: www.fipindustriale.it,S02_SI-ita.pdf (accessed on 14 March 2023).
- Wilson, E.L.; Penzien, J. Evaluation of orthogonal damping matrices. Int. J. Numer. Methods Eng. 1972, 4, 5–10. [Google Scholar] [CrossRef]
- Chopra, A.K.; McKenna, F. Modeling viscous damping in nonlinear response history analysis of buildings for earthquake excitation. Earthq. Eng. Struct. Dyn. 2016, 45, 193–211. [Google Scholar] [CrossRef]
- Iervolino, I.; Galasso, C.; Cosenza, E. REXEL: Computer aided record selection for code-based seismic structural analysis. Bull. Earthq. Eng. 2010, 8, 339–362. [Google Scholar] [CrossRef]
- Smerzini, S.; Paolucci, R. SIMBAD: A Database with Selected Input Motions for Displacement Based Assessment and Design–3rd Release, Research Project DPC-RELUIS 2010–2013. 2013. Available online: https://www.reluis.it/images/stories/REXEL/SIMBAD_Database_Polimi.pdf (accessed on 2 April 2023).
Figure 1.
(a) Front view of the existing building with the volume to be reconstructed (depicted in red); (b) 3D FE model of the lower structure; (c) plastic hinge for flexural and shear behaviour of masonry piers; (d) capacity curves for the weakest direction of the existing building.
Figure 1.
(a) Front view of the existing building with the volume to be reconstructed (depicted in red); (b) 3D FE model of the lower structure; (c) plastic hinge for flexural and shear behaviour of masonry piers; (d) capacity curves for the weakest direction of the existing building.

Figure 2.
Simplified lumped-mass models: (a) SDOF LS, (b) 3DOF IIS.

Figure 3.
(a) Code Response Spectrum for the selected site (Pozzuoli) [52]; (b) graph of displacement ratio = d1,IIS/dLS as a function of the period ratio TISO/TLS, considered as IIS design spectrum. KEYS: TB and TC are the lower and upper limit of the period of the constant acceleration branch; TD is the value defining the beginning of the constant displacement range; TISO,B, TISO,C, TISO,D, TISO,E are the periods of the isolation system in the B, C, D, E design solutions.

Figure 4.
IIS design spectra (for different LS) in terms of base shear ratio vs. TISO.
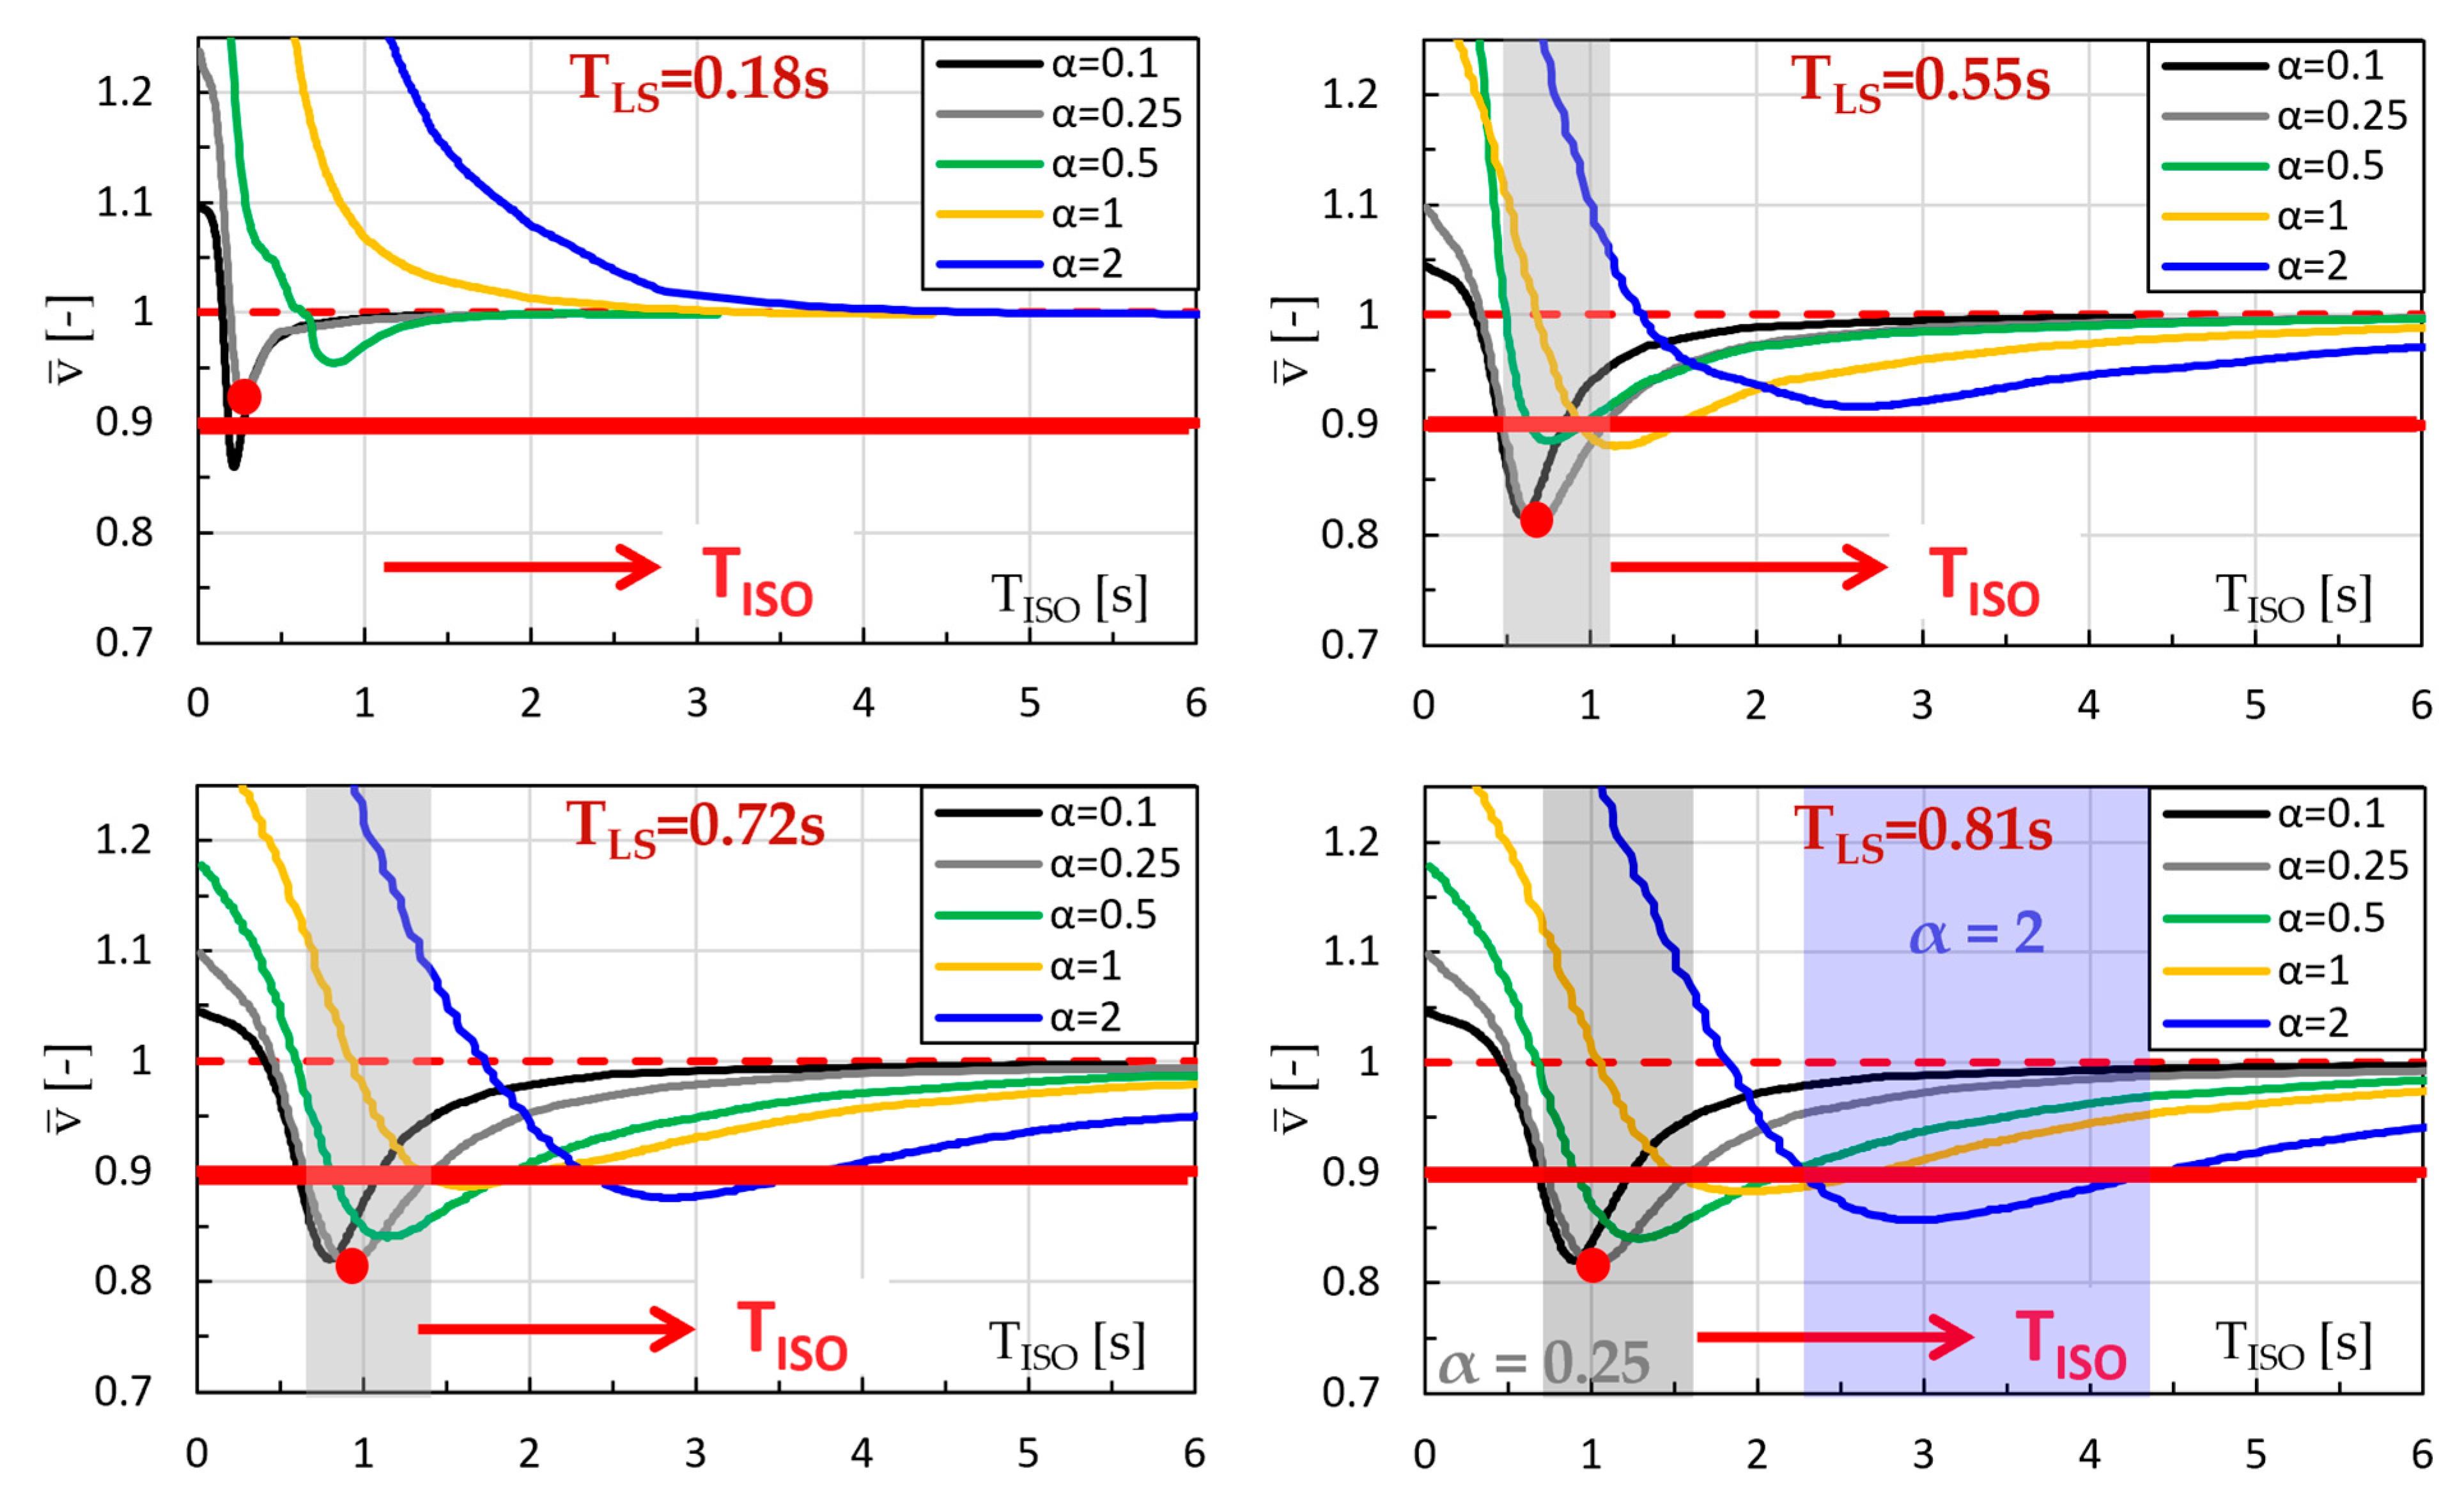
Figure 5.
(a) Front view of IIS building, (b) 3D FEM of the IIS, (c) exploded axonometric view of IIS.
Figure 5.
(a) Front view of IIS building, (b) 3D FEM of the IIS, (c) exploded axonometric view of IIS.

Figure 6.
(a) Pivot-type model for plastic hinges in masonry piers of LS, (b) bilinear model of isolator.
Figure 6.
(a) Pivot-type model for plastic hinges in masonry piers of LS, (b) bilinear model of isolator.

Figure 7.
Set of spectrum-compatible acceleration response spectra of Pozzuoli site.

Figure 8.
RSA on lumped mass models vs. THA on 3D FE models with (a) linear and (b) nonlinear LS behaviour.
Figure 8.
RSA on lumped mass models vs. THA on 3D FE models with (a) linear and (b) nonlinear LS behaviour.

Figure 9.
RSA on lumped mass models vs. THA on 3D FE models with (a) nonlinear ISO behaviour and (b) nonlinear behaviour of both LS and ISO.
Figure 9.
RSA on lumped mass models vs. THA on 3D FE models with (a) nonlinear ISO behaviour and (b) nonlinear behaviour of both LS and ISO.

Figure 10.
RSA on lumped mass models vs. THA on 3D FE models with ηi = 5% vs. THA on 3D FE models with ηi = 2%.
Figure 10.
RSA on lumped mass models vs. THA on 3D FE models with ηi = 5% vs. THA on 3D FE models with ηi = 2%.

Figure 11.
RSA on lumped mass models vs. THA on 3D FE models with (a) linear behaviour of both LS and ISO and (b) nonlinear ISO behaviour.
Figure 11.
RSA on lumped mass models vs. THA on 3D FE models with (a) linear behaviour of both LS and ISO and (b) nonlinear ISO behaviour.


Table 1.
Dynamic properties of the upper structure and isolation system in the 3DOF IIS.
| Upper Structure | Isolation System |
|---|---|
| = 371 kNs2/m = 799,854 kN/m = 689 kNs/m = 0.135 s = 46.43 rad/s | = 247 kNs2/m = [976, 9,759,065] kN/m = [233, 23,298] kNs/m = [0.05, 5] s = [1.26, 126] rad/s |
Table 2.
Data of the bilinear constitutive model of the isolators utilized in the IIS design solutions.
Table 2.
Data of the bilinear constitutive model of the isolators utilized in the IIS design solutions.
| TISO [s] | keff [N/mm] | k1 [N/mm] | k2 [N/mm] | Q [N] | Sde [mm] | |
|---|---|---|---|---|---|---|
| B | 0.5 | 14,844 | 112,223 | 11,222 | 128,343 | 36 |
| C | 1 | 3711 | 28,056 | 2806 | 64,506 | 71 |
| D | 1.5 | 1649 | 12,469 | 1247 | 43,004 | 107 |
| E | 5 | 148 | 1122 | 112 | 5800 | 160 |
Table 3.
Major data of the ground motion records.
| Earthquake Name | Emilia Pianura Padana | Darfield | Christchurch | Christchurch | Hyogo-Ken Nanbu | Superstition Hills | Northridge |
|---|---|---|---|---|---|---|---|
| Date | 29 May 2012 | 3 September 2010 | 21 February 2011 | 13 June 2011 | 16 January 1995 | 24 November 1987 | 17 January 1994 |
| Waveform ID | 317 | 335 | 341 | 389 | 411 | 449 | 459 |
| Earthquake ID | 133 | 137 | 142 | 149 | 34 | 93 | 99 |
| Station ID | MOG0 | TPLC | RHSC | RHSC | TKS | WSM | ST_24389 |
| Fault Mech. | reverse | strike-slip | reverse | reverse | strike-slip | strike-slip | reverse |
| Ep. Distance [km] | 16.43 | 23.58 | 13.73 | 14.76 | 17.45 | 19.5 | 20.19 |
| PGA [g] | 0.17 | 0.19 | 0.25 | 0.19 | 0.18 | 0.21 | 0.22 |
| EC8 Site class | C * | C * | C * | C * | C * | C | C |
* based on geological information alone.
Disclaimer/Publisher’s Note: The statements, opinions and data contained in all publications are solely those of the individual author(s) and contributor(s) and not of MDPI and/or the editor(s). MDPI and/or the editor(s) disclaim responsibility for any injury to people or property resulting from any ideas, methods, instructions or products referred to in the content. |
© 2023 by the authors. Licensee MDPI, Basel, Switzerland. This article is an open access article distributed under the terms and conditions of the Creative Commons Attribution (CC BY) license (https://creativecommons.org/licenses/by/4.0/).
Share and Cite
MDPI and ACS Style
Esposito, F.; Argenziano, M.; Faiella, D.; Mele, E. Intermediate Isolation System with Nonlinear Lower Structure and Isolation System. Appl. Sci. 2023, 13, 4590. https://doi.org/10.3390/app13074590
AMA Style
Esposito F, Argenziano M, Faiella D, Mele E. Intermediate Isolation System with Nonlinear Lower Structure and Isolation System. Applied Sciences. 2023; 13(7):4590. https://doi.org/10.3390/app13074590
Chicago/Turabian StyleEsposito, Francesco, Mario Argenziano, Diana Faiella, and Elena Mele. 2023. "Intermediate Isolation System with Nonlinear Lower Structure and Isolation System" Applied Sciences 13, no. 7: 4590. https://doi.org/10.3390/app13074590
Note that from the first issue of 2016, this journal uses article numbers instead of page numbers. See further details here.