
Permanent Deformation and Its Unified Model of Coal Gangue Subgrade Filler under Traffic Cyclic Loading


1
Hunan Provincial Key Laboratory of Geotechnical Engineering for Stability Control and Health Monitoring, Hunan University of Science and Technology, Xiangtan 411201, China
2
College of Civil Engineering, Tongji University, Shanghai 200092, China
3
Hunan Software Vocational and Technical University, Xiangtan 411201, China
*
Author to whom correspondence should be addressed.
Appl. Sci. 2023, 13(7), 4128; https://doi.org/10.3390/app13074128
Submission received: 20 February 2023
/
Revised: 14 March 2023
/
Accepted: 22 March 2023
/
Published: 24 March 2023
(This article belongs to the Special Issue New Trends in Long-Life Road Infrastructures: Materials and Structures)
Abstract
:Using coal gangue as subgrade filler can not only solve the environmental problems of coal mine waste accumulation but also decrease the subgrade cost, which has important theoretical and practical significance. A series of cyclic triaxial tests was carried out using the large-scale dynamic and static triaxial apparatus (LSDSTA) to investigate the permanent deformation () of coal gangue subgrade filler (CGSF) under cyclic loading. Experimental grading was designed by using the fractal model grading equation (FMGE), and then well-grading limits of CGSF were captured. The relationship curve between and the numbers of cyclic loading (N) can be divided into three stages, i.e., the rapid growth phase, the deceleration growth phase, and the approaching stability phase. N = 1000 can be used as the criterion for reaching the stable stage of CGSF. The effect of confining pressure () on is related to the level of . The effect of on is significant when is smaller, whereas the influence of on is smaller when is larger. Furthermore, the influence of grading () on of coal gangue samples is significant. With the increase of , first increases and then decreases, reflecting that there is an obvious optimal grading for coal gangue samples under cyclic loading. Moreover, the effect of compaction degree () on of CGSF depends on the level of . is hardly affected when is smaller, whereas increasing has a significant effect on restraining when is bigger. In addition, according to the analysis of the permanent deformation curve for CGSF, the unified calculation model of permanent deformation for CGSF under cyclic loading is established. Compared with the existing permanent deformation models, the proposed model in this paper can better describe the permanent deformation of CGSF under cyclic loading. Finally, the model parameters are analyzed, and the model is verified.
1. Introduction
Coal gangue is a waste material associated with the process of coal mine construction, coal exploitation, accounting for 15–20% of coal production. Now, more than 6 billion tons of coal gangue are accumulated on the surface of mining areas in China, and its emission has leaped to the top of China’s industrial solid waste [1,2,3]. However, compared with the amount of released coal gangue, the utilization rate of coal gangue in China is low, resulting in a large amount of surplus coal gangue piled up on the useful land for a long time. The long-term accumulation of coal gangue has caused great harm to the surrounding environment [4,5]: ① A large number of useful land resources (such as cultivated land, forest land, and mining sites) are occupied. ② Dust particles easily float in the air, and coal gangue self-ignition produces many harmful gases, resulting in serious air pollution. ③ The piled-high coal gangue easily causes landslides, debris flow and other geological disasters. ④ Accumulated coal gangue seriously affects the surrounding landscape environment. Therefore, the effective utilization of coal gangue has great theoretical and practical significance.
The effective utilization of coal gangue waste has always been a hot topic that concerns many scholars. The physical and chemical characteristics of coal gangue are similar to natural gravel, so coal gangue can be broken down into a coarse aggregate of concrete, which can decrease the exploitation of natural gravel but can also save costs and avoid a series of hazards caused by it [6,7,8]. Hence, the study on coal gangue concrete has been focused on by many scholars in recent years [9,10], and the results indicate that the mechanical behaviors of coal gangue concrete, made by replacing a certain amount of gravel with coal gangue, are close to that of ordinary concrete of the same grade. Zhao et al. [11] investigated the effect of partial replacement of fly ash with natural loess on gangue-cemented paste backfill (GCPB) performance. Gangue-cemented paste backfill specimens with varying loess doses were produced, and then the rheological properties, macroscopic strength, and microstructural evolution of GCPB were examined. Zhao et al. [12] studied the activation and hydration mechanisms of composite activated coal gangue geopolymer, and the results show that coal gangue can be employed as a primary cementitious material after being modified by the proposed activation method. Su et al. [13] studied the influence of thermally activated coal gangue powder on the structure of the interfacial transition zone in concrete.
However, compared with traditional concrete, the investigation of the coal gangue concrete still shows many deficiencies. The consumption of coal gangue used as subgrade filler is tremendous, which can effectively solve the problem of coal gangue accumulation. Chen et al. [14] studied the effect of the compactive effort and initial particle gradings on the particle size distribution of mineral waste slag based on screening tests and analyzed the effects of different factors such as the compactive effort, moisture content, coarse grain content (CGC, mass proportion of particles with sizes greater than 5 mm), and forming methods on the engineering properties of mineral waste slag to determine the reasonable roadbed construction parameters. In addition, the research on coarse aggregate subgrade filler has a great reference value for coal gangue subgrade filler [15,16,17].
As mentioned above, coal gangue is widely used as subgrade filler. The coal gangue subgrade is affected by the traffic dynamic loading in the actual environment. However, there is little research reporting the dynamic behaviors of coal gangue, especially considering coarse particles, used as subgrade filler under traffic cyclic loading. Hence, a series of cyclic triaxial tests was carried out using the LSDSTA to research the permanent deformation of CGSF (the maximum particle size is 60 mm) under cyclic loading. The purposes of this study are to (1) study the permanent deformation of coal gangue used as subgrade filler so as to realize resource utilization, (2) explore the effect of , , and on the permanent deformation to further understand the mechanical properties of CGSF, and (3) establish the unified model of permanent deformation in order to apply this to different types of permanent deformation.
2. Laboratory Testing Program
2.1. Tested Materials and Apparatus
The original tested material of the specimens was crushed coal gangue, which was collected from a coal mine in Xiangtan city. The waste coal gangue in this mine is shown in Figure 1. Nearly 15 tons of coal gangue were transported to the laboratory for indoor tests and research. The original particle size of coal gangue not only contains fine particles less than 0.075 mm, but also includes stones of tens of centimeters. It should be noted that the maximum particle size allowed by the test equipment in this test does not exceed 60 mm. Considering that the specimens in this test were prepared manually, CGSF with particle sizes greater than 60 mm were removed. The color of coal gangue particles is black and black-gray, and the coal gangue has not experienced spontaneous combustion. Coal gangue particles are angular, sharp, and hard with a rough surface and an irregular shape. The CGSF was dried to constant weight in an oven at 105–110 °C (more than 24 h), and then the standard sieve tests with aperture sizes of 60, 40, 20, 10, 5, 2, 0.5, and 0.075 mm were carried out. Coal gangue particles of each group after sieving tests were displayed in Figure 2. According to the JTG 3430-2020 Chinese standard for soil test method [18], the natural moisture content of CGSF is 2.20–2.98%, the liquid limit, the plastic limit, and the plasticity index of fine particles are 31.46%, 20.57%, and 10.89%, respectively. The coal gangue of this coal mine mainly includes sandstone, limestone, shale, and mudstone.
An LSDSTA manufactured by Chengdu Donghua Zhuoyue Technology Co., Ltd. (Chengdu, China), was used in this test, which is shown in Figure 3. The specimen sizes allowed by the LSDSTA are = 300 mm and = 600 mm. The ratio between the triaxial specimen diameter and the maximum particle size should not be smaller than 5 [19,20,21]; therefore, the maximum particle size allowed by LSDSTA in this test is no greater than 60 mm, and then the effect of specimen size can be neglected. The LSDSTA mainly includes the following parts: (1) a data acquisition system through a computer, (2) a testing machine control system, (3) a triaxial pressure cover, (4) an axial loading system, (5) a volumetric strain measurement system, and (6) a sample preparation mold, which are shown in Figure 3. The LSDSTA can automatically collect test parameters, such as axial load and displacement, confining pressure, pore pressure, and volumetric strain, as well as realize the static shear test and cyclic dynamic loading test. In addition, the large-scale triaxial tests and the same specimen size were widely used in the previous studies, e.g., Cai et al. [20] and Leng et al. [21], which guarantees the reliability of this apparatus.
2.2. Specimen Preparation and Testing Program
The only way to characterize the grading of granular materials is to use the grading curve. The grading curve contains a large amount of data; however, it lacks quantitative indicators. Hence, it is difficult to make the comparison of the particle size distribution with different gradings of granular materials. In order to completely express the grading of particles and quantitatively analyze the relationship between grading and relevant mechanical indexes, the grading of granular materials is quantified by establishing the grading equations with mathematical formulas, which has great significance for engineering practice and academic research. In this test, the method of artificial sample preparation according to FMGE was used, and the FMGE is defined as [22,23,24]
where represents the fractal dimension, presents the particle size (mm), denotes the cumulative mass percentage with particle size less than (%), and indicates the maximum particle size (mm).
The control parameters of well grading for CGSF are the coefficient of uniformity () and the coefficient of curvature (), and the calculation formulas are as follows [25,26]:
where , , and refer to the particle size corresponding to the passing percentage of 60%, 30%, and 10% in the grading curve, respectively (mm).
CGSF with well grading satisfies and . Furthermore, combining Equations (1)–(3), the range of well grading can be captured based on the FMGE:
According to Equation (4), 4 groups of tests with different fractal dimensions, i.e., = 1.89, 2.13, 2.37, and 2.61, were designed to carry out the experimental research, and the test design grading curve is shown in Figure 4. A cylindrical specimen with = 300 mm and = 600 mm was utilized in this test; and are the diameter and height of the specimen, respectively. According to the Chinese Standard of Soils for Highway Engineering [18], the maximum dry density of the specimen can be obtained. Compaction degree, which was widely used for the triaxial test and situ construction [27,28], is calculated as follows:
where denotes the maximum dry density (), is the dry density of the specimen (), and represents the compaction degree (%).
In this test, the compaction degree was used to control the preparation of specimens and 90%, 93%, and 96% were adopted. In addition, the compaction degree meets the requirements of the road base and subbase materials [18].
Figure 5 shows the process of the large triaxial tests. First, the above drying CGSF (as displayed in Figure 2) should be well mixed according to the designed grading curve (as shown in Figure 4). The specimen prepared in this test was too large and heavy at the laboratory. Therefore, the specimen was compacted with a compaction hammer in a mold in five layers (as shown in Figure 5a). Before placing CGSF on the next layer, the surface of the previously compacted layer was scraped to a depth of about 20 mm to guarantee well-interlocking vertically adjacent layers, just as in other studies [20,29,30]. The target compaction degree of the CGSF specimen was reached by controlling the thickness of each individual layer and the mass of added CGSF. After compaction, a rubber membrane was used to enclose the specimen, and the top and bottom of the specimen were tied with rubber ropes. Figure 5b displays the prepared sample.
Then, the specimen was put in the triaxial pressure cover. All of the specimens were saturated by back pressure before loading, as described by Kong et al. [31], Cai et al. [20], Chen et al. [32], and Wu et al. [33]. The specimens were considered completely saturated when the pore pressure coefficient was larger than 0.95. After that, the required effective confining pressure was applied to the specimen to complete the isotropic consolidation.
The research shows that traffic loading is different from the sine wave, but very similar to the half-sine wave [34]. Therefore, the half-sine wave was used to simulate the traffic cyclic dynamic loading. The dynamic loading frequency was chosen as 1 Hz in these tests, which was also used in [21,34]. This paper mainly focuses on the permanent deformation of CGSF, and the confining pressures (i.e., effective consolidation stress), , of 50, 100, and 150 were selected in this test. The cyclic dynamic loading in railway subgrade is generally distributed between 35 kPa and 185 kPa [35,36]. Therefore, the axial dynamic stress amplitude was taken as 180 kPa in the separate loading test of each sample, and each specimen was loaded with 30,000 numbers of half-sine wave separately in this test. In addition, Wang et al. [37] studied the permanent deformation of reinforced gravelly soil filler under cyclic loading with dynamic stress amplitudes of 90 kPa and 135 kPa.
The test scheme design is shown in Table 1. The large-scale triaxial test can investigate the mechanical properties with large-size particles, which is closer to the engineering practice. Hence, the large-scale triaxial test has been widely used in recent years. Three groups of parallel tests were carried out at the same time under each test condition, and one group was randomly selected for key analysis. The loading process in this test is shown in Figure 6.
3. Permanent Deformation Analysis
The monitoring data show that the permanent deformation of the subgrade under the traffic cyclic loading is very considerable and even has an obvious impact on the normal operation of the project [36]. Therefore, accurate analysis and prediction of the permanent deformation for the subgrade have important theoretical and practical significance for the normal use and safe operation of the completed project and for the guidance of future project construction.
According to the theory of elastoplastic mechanics [35], the axial strain of a coal gangue sample under cyclic loading includes elastic strain and plastic strain , namely:
where represents the axial strain of the specimen; denotes the elastic strain; and indicates plastic strain.
The elastic strain will recover during the loading and unloading process, while the plastic strain cannot recover and will gradually accumulate, resulting in the failure of the sample. Therefore, the cumulative plastic strain causes permanent deformation, and the permanent deformation () studied in this paper is the cumulative plastic strain under cyclic loading. The calculation diagram is shown in Figure 7.
3.1. Effect of Confining Pressure on the Permanent Deformation
According to the above test scheme, the relationship between the permanent deformation () and the numbers of cyclic loading (N) with different confining pressures is shown in Figure 8. The following can be seen from Figure 8: (1) The relationship curve between and N can be divided into three stages. The first stage is the rapid growth phase, and the curve has approximately linear growth. The second stage is the deceleration growth phase; the curve growth rate slows down obviously, and the curve gradient decreases gradually. The third stage is the approaching stability phase, and the permanent deformation closes to stable. (2) As observed in Figure 8, decreases by 2.79% when the confining pressure increases from 50 kPa to 100 kPa, whereas decreases by only 0.30% when the confining pressure increases from 100 kPa to 200 kPa. Hence, the effect of confining pressure on is related to the level of confining pressure. When the confining pressure is smaller, its effect on is significant, whereas when the confining pressure is larger, its influence on is smaller. This also reflects that the effect of traffic cyclic loading on subgrade decreases with the increase of subgrade depth.
3.2. Effect of Grading on the Permanent Deformation
The relationship between and N with different gradings is displayed in Figure 9. As demonstrated in Figure 9: (1) increases approximate linear when N is less than 400. The growth rate of begins to slow down and gradually decreases when . tends to be stable when N is more than 1000. The abovementioned laws apply to the final stability relationship curve between and N. Therefore, N = 1000 can be used as a criterion for reaching the stable stage of CGSF, which can guide the later test loading and coal gangue subgrade engineering. (2) Under the condition of maximum fine particle content ( = 2.61), the coal gangue sample will fail ( reaches 15%) rapidly when N is very small (N = 535). Moreover, in these four groups of tests, of the coal gangue sample is the smallest when = 2.13. Hence, the influence of grading, i.e., particle size distribution, on of coal gangue samples is significant. With the increase of the fractal dimension (), first decreases and then increases, reflecting that there is an obvious optimal grading for coal gangue samples under cyclic loading. Wu et al. [26,38] studied the compaction characteristics of coarse aggregates for embankment dams using the surface vibration compaction test and lateral compression test, which showed that there is an optimal grading of coarse aggregate. In addition, through the large-scale vibration compaction test and static shear test, the authors of [39] also investigated the influence of grading on the compaction and strength of CGSF, and then the optimal grading, i.e., , was captured using FMGE. The reason for this phenomenon is related to the contact relationship and interlocking relationship between coarse and fine particles. These conclusions are all consistent with this study.
3.3. Effect of Compaction Degree on the Permanent Deformation
The evolution of versus N with different compaction degree values is displayed in Figure 10. As demonstrated in Figure 10: (1) The relationship between and N with different compaction degree values is consistent with the variation laws under different confining pressures and grading parameters. (2) When the compaction degree increases from 90% to 93%, the development of is hardly affected. However, when the compaction degree increases from 93% to 96%, increasing compaction degree has a significant effect on restraining . Therefore, the effect of compaction degree on of CGSF depends on the level of compaction degree. is hardly affected when the compaction degree is smaller, whereas increasing the compaction degree has a significant effect on restraining when the compaction degree is bigger.
4. Unified Model of Permanent Deformation
4.1. Comparative Analysis of Existing Models
The establishment of a permanent deformation model has always been the focus of many scholars. The most widely used model was proposed by Monismith et al. [40], which was defined as:
where indicates the permanent deformation, N represents the numbers of cyclic loading, and and are the fitting parameters of this model.
The permanent deformation model proposed by Li et al. [35] was defined as:
where and are the fitting parameters.
Liu et al. [41] proposed the following permanent deformation model:
where and are the fitting parameters.
Wang et al. [37] proposed the permanent deformation model as follows:
where , , and are the fitting parameters.
According to the relationship between and N presented in Figure 8, Figure 9 and Figure 10, the permanent deformation of CGSF under cyclic loading is analyzed using a data-fitting method based on the above models in Equations (7)–(10). Analysis shows that fitting parameters of CGSF in Equation (10) cannot be obtained. Hence, Equation (10) is not investigated in this paper. The fitting parameters are displayed in Table 2.
According to the correlation coefficient () of fitting parameters in Table 2, the existing permanent deformation model cannot accurately enough describe the permanent deformation of CGSF under cyclic loading, and values are all less than 0.9. The permanent deformation curve can be divided into three types [42]: (1) Stable/attenuation type, where first increases with the increase of N and then tends to stay at a stable value when N achieves a larger value. (2) Failure type, where will increase sharply until the specimen fails when N reaches a bigger value. (3) Criticality type, where distributes between (1) and (2). The existing permanent deformation model can describe the variation of one certain type of the mentioned curves well; however, there is a lack of a unified model of permanent deformation used for different types of permanent deformation curves. Therefore, it is necessary to put forward a unified model which can be generally applicable to different types of permanent deformation based on the mentioned CGSF tests.
4.2. Establishment of Unified Model for Permanent Deformation
Based on the above analysis of the permanent deformation curve for CGSF and the comparative analysis of existing models, the relationship between and N is analyzed using regression using MATLAB, and then the unified calculation model of permanent deformation for CGSF under cyclic loading is established:
where p and q are the model parameters.
The model parameters in Equation (11) are solved using the least square method, that is:
The model parameters obtained by Equations (11) and (12) are shown in Table 3. Figure 11 presents the comparative analysis of for the above permanent deformation models, i.e., Equations (7)–(9), and Figure 12 shows the comparison between the proposed model and the test curve. It can be seen from Table 3, Figure 11 and Figure 12, compared with the existing permanent deformation models, that the proposed model in this paper can better describe the permanent deformation of CGSF under cyclic loading. The of the proposed model is bigger than 0.9, which is larger than the other models. The correctness of the model is preliminarily verified.
4.3. Model Parameter Analysis
Based on the test data of the DT02 specimen, i.e., = 100 kPa, , and , the physical meaning of the proposed model (Equation (11)) parameters is analyzed by changing the model parameter values, as shown in Figure 13 (the model parameters of fitting curve in Figure 13 are p = 4.8175, q = 135.5844).
It can be seen from Figure 13 that, when q is constant, the N required before the permanent deformation curve tends to be stable is basically unchanged with the increase of p, whereas the stable value of the permanent deformation curve increases accordingly. Therefore, p reflects the permanent deformation in the stable stage. The greater p occurs with the bigger permanent deformation. Similarly, when p is constant, with the increasing q, the permanent deformation at the stable stage remains unchanged, whereas the N required before the curve tends to be stable increases. Hence, q indicates the N required before the permanent deformation curve tends to be stable, and the greater N required before the permanent deformation curve reaches the stable stage occurs with a larger q.
The above analysis studies the physical meaning of the model parameters by changing the parameter values. Then, the correctness of the above model parameter analysis will be further verified from a mathematical point of view.
For the unified model of permanent deformation, i.e., Equation (11), when N tends to be 0:
Before test loading, the permanent deformation of the sample is 0, and the model is consistent with the actual situation. When the coal gangue sample experiences a large number of cyclic loadings:
According to Equation (14), when N is large enough, the denominator approaches 1, and the maximum value of permanent deformation is equal to p. Therefore, p reflects the permanent deformation in the stable stage. For Equation (14), the smaller N required before the permanent deformation curve reaches the stable stage occurs with the lesser q. It can be seen that the analysis of model parameters from the perspective of mathematics and test curve is consistent.
4.4. Model Validation
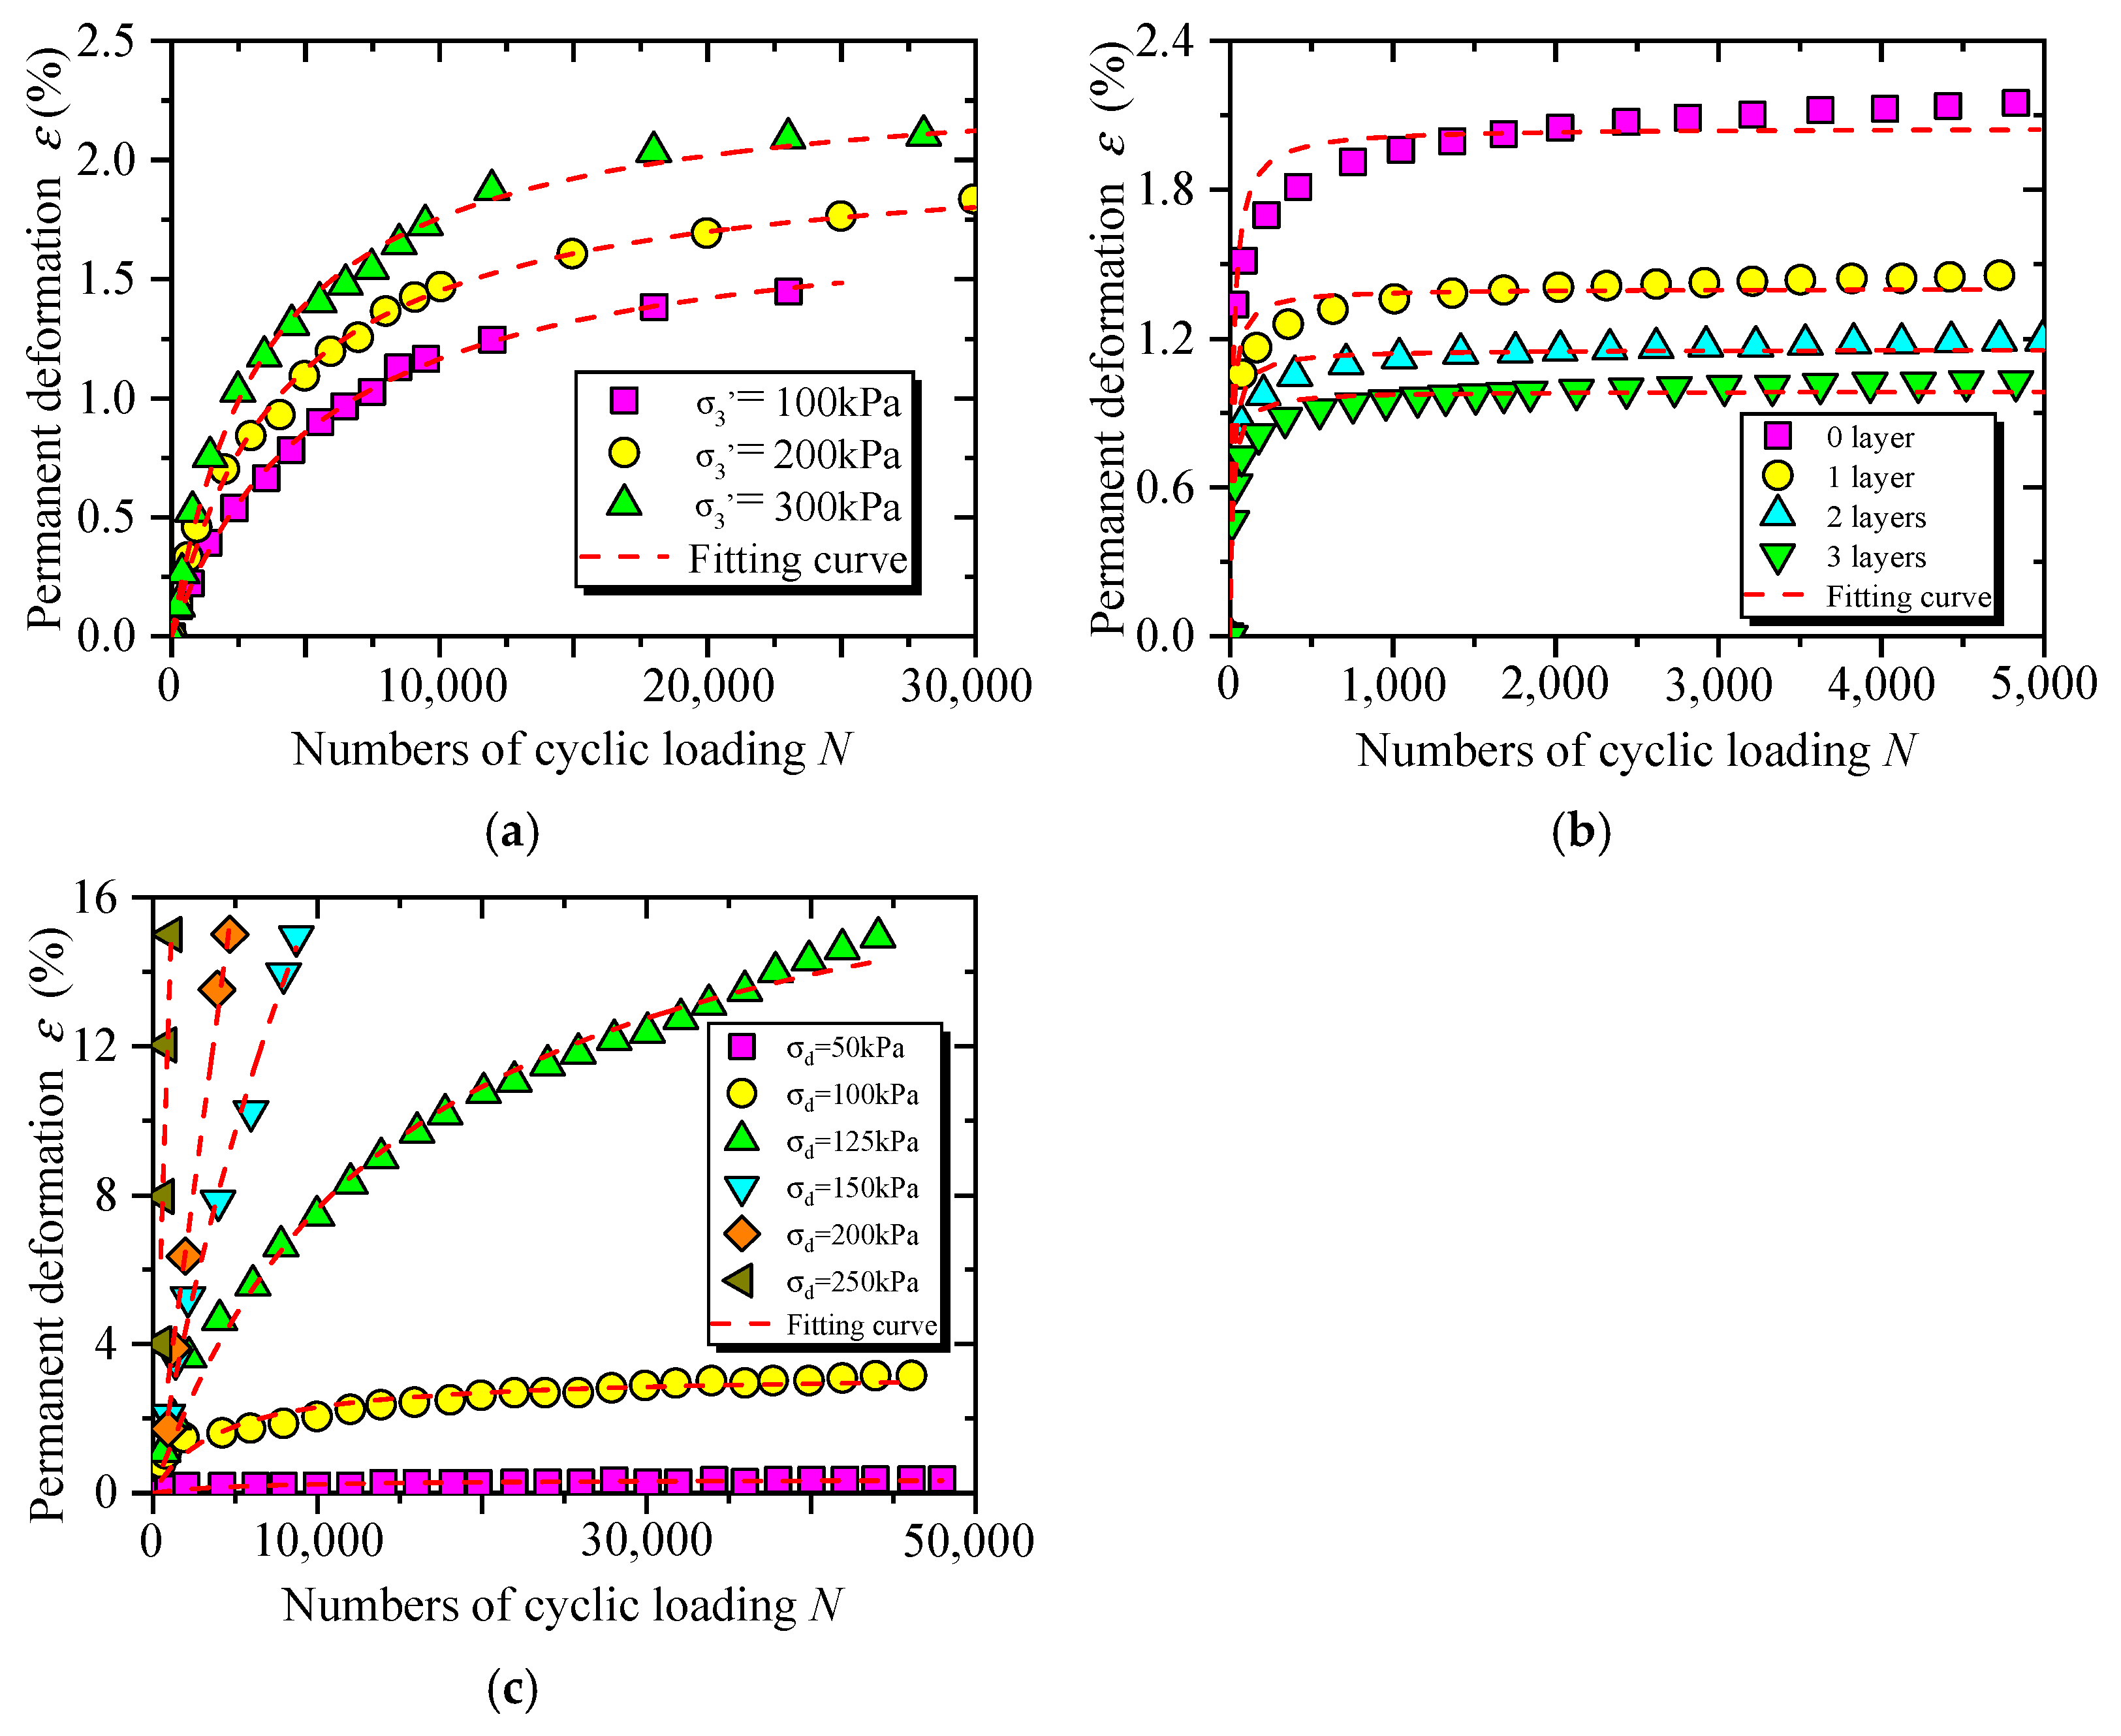
The test data of Figure 8a in Li et al. [35], Figure 3 in Wang et al. [37], and Figure 3a in Mei et al. [43] were selected to verify the correctness of the unified model of permanent deformation in this paper. Figure 14a–c display the fitting effect of the test data in the above research and the permanent deformation model established in this paper. It can be seen from Figure 14 that the permanent deformation model established in this paper can describe the permanent deformation test results in the existing research well, thus verifying the correctness of this model. In addition, three types of the permanent deformation curve in Figure 14 can be described well by the unified model of permanent deformation in this study, which shows the universal applicability of the model in this paper.
5. Conclusions
The following conclusions can be drawn from the investigation described above.
- (1)
- Experimental grading was designed by using FMGE, and the well-grading limits of CGSF were captured based on the FMGE, i.e., the grading is uniform when 1.89 ≤ ≤ 2.63.
- (2)
- The relationship curve between and N can be divided into three stages, i.e., the rapid growth phase, the deceleration growth phase, and the approaching stability phase. N = 1000 can be used as a criterion for reaching the stable stage of CGSF, which can guide the later test loading and coal gangue subgrade engineering.
- (3)
- The effect of confining pressure on is related to the level of confining pressure. The effect of confining pressure on is significant when the confining pressure is smaller, whereas the influence of confining pressure on is smaller when the confining pressure is larger.
- (4)
- The influence of grading on of coal gangue samples is significant. With the increase of , first increases and then decreases, reflecting that there is an obvious optimal grading for coal gangue samples under cyclic loading.
- (5)
- The effect of compaction degree on of CGSF depends on the level of compaction degree. is hardly affected when the compaction degree is smaller, whereas increasing compaction degree has a significant effect on restraining when the compaction degree is bigger.
- (6)
- According to the analysis of the permanent deformation curve for CGSF, the unified calculation model of permanent deformation for CGSF under cyclic loading was established. Compared with the existing permanent deformation models, the proposed model in this paper can better describe the permanent deformation of CGSF under cyclic loading. Then, the model parameters were analyzed and the model was verified.
Author Contributions
Investigation, Z.-T.Z., Y.-H.W., W.-H.G., W.H. and S.-K.L. All authors have read and agreed to the published version of the manuscript.
Funding
This research was funded by the National Natural Science Foundation of China, Grant No. 52208341; the Natural Science Foundation of Hunan Province, Grant No. 2020JJ4019; and the Scientific Research Project of the Hunan Provincial Education Department, Grant No. 21C0360.
Data Availability Statement
Not applicable.
Conflicts of Interest
The authors declare no conflict of interest.
References
- Zhang, Y.; Ling, T.-C. Reactivity activation of waste coal gangue and its impact on the properties of cement-based materials—A review. Constr. Build. Mater. 2020, 234, 117424. [Google Scholar] [CrossRef]
- Zhao, Y.; Qiu, J.; Ma, Z.; Sun, X. Eco-friendly treatment of coal gangue for its utilization as supplementary cementitious materials. J. Clean. Prod. 2021, 285, 124834. [Google Scholar] [CrossRef]
- Li, J.; Huang, Y.; Ouyang, S.; Guo, Y.; Gao, H.; Wu, L.; Shi, Y.; Zhu, L. Transparent characterization and quantitative analysis of broken gangue’s 3D fabric under the bearing compression. Int. J. Min. Sci. Technol. 2022, 32, 335–345. [Google Scholar] [CrossRef]
- Ma, D.; Duan, H.; Liu, J.; Li, X.; Zhou, Z. The role of gangue on the mitigation of mining-induced hazards and environmental pollution: An experimental investigation. Sci. Total Environ. 2019, 664, 436–448. [Google Scholar] [CrossRef] [PubMed]
- Chen, X.; Zheng, L.; Dong, X.; Jiang, C.; Wei, X. Sources and mixing of sulfate contamination in the water environment of a typical coal mining city, China: Evidence from stable isotope characteristics. Environ. Geochem. Health 2020, 42, 2865–2879. [Google Scholar] [CrossRef]
- Xiao, G.; Yang, G.; Jixi, C.; Ruyi, Z. Deterioration mechanism of coal gangue concrete under the coupling action of bending load and freeze–thaw. Constr. Build. Mater. 2022, 338, 127265. [Google Scholar] [CrossRef]
- Wu, Q.-h.; Weng, L.; Zhao, Y.-l.; Feng, F. Influence of infilling stiffness on mechanical and fracturing responses of hollow cylindrical sandstone under uniaxial compression tests. J. Cent. South Univ. 2021, 28, 2485–2498. [Google Scholar] [CrossRef]
- Wu, Q.; Weng, L.; Zhao, Y.; Zhao, F.; Peng, W.; Zhang, S. Deformation and cracking characteristics of ring-shaped granite with inclusion under diametrical compression. Arab. J. Geosci. 2020, 13, 681. [Google Scholar] [CrossRef]
- Li, Y.; Liu, S.; Guan, X. Multitechnique investigation of concrete with coal gangue. Constr. Build. Mater. 2021, 301, 124114. [Google Scholar] [CrossRef]
- Qiu, J.; Zhu, M.; Zhou, Y.; Guan, X. Effect and mechanism of coal gangue concrete modification by fly ash. Constr. Build. Mater. 2021, 294, 123563. [Google Scholar] [CrossRef]
- Zhao, B.; Zhai, D.; Xin, J.; Guo, Y.; Wang, J.; Wei, Q.; Wang, H.; Tang, R. Rheological properties, mechanical characteristics, and microstructures of gangue-cemented paste backfill: Linking to loess doses. Arab. J. Geosci. 2022, 15, 244. [Google Scholar] [CrossRef]
- Zhao, Y.; Yang, C.; Li, K.; Qu, F.; Yan, C.; Wu, Z. Toward understanding the activation and hydration mechanisms of composite activated coal gangue geopolymer. Constr. Build. Mater. 2022, 318, 125999. [Google Scholar] [CrossRef]
- Su, Z.; Li, X.; Zhang, Q. Influence of thermally activated coal gangue powder on the structure of the interfacial transition zone in concrete. J. Clean. Prod. 2022, 363, 132408. [Google Scholar] [CrossRef]
- Chen, M.; Wen, P.; Wang, C.; Chai, Z.; Gao, Z. Evaluation of particle size distribution and mechanical properties of mineral waste slag as filling material. Constr. Build. Mater. 2020, 253, 119183. [Google Scholar] [CrossRef]
- Li, J.; Zhang, J.; Yang, X.; Zhang, A.; Yu, M. Monte Carlo simulations of deformation behaviour of unbound granular materials based on a real aggregate library. Int. J. Pavement Eng. 2023, 24, 2165650. [Google Scholar] [CrossRef]
- Li, J.; Zhang, J.; Zhang, A.; Peng, J. Evaluation on Deformation Behavior of Granular Base Material during Repeated Load Triaxial Testing by Discrete-Element Method. Int. J. Geomech. 2022, 22, 04022210. [Google Scholar] [CrossRef]
- Yao, Y.; Li, J.; Ni, J.; Liang, C.; Zhang, A. Effects of gravel content and shape on shear behaviour of soil-rock mixture: Experiment and DEM modelling. Comput. Geotech. 2022, 141, 104476. [Google Scholar] [CrossRef]
- JTG 3430-2020; Test Methods of Soils for Highway Engineering. China Communications Press: Beijing, China, 2020. (In Chinese)
- Chen, W.B.; Yin, J.H.; Feng, W.Q.; Borana, L.; Chen, R.P. Accumulated Permanent Axial Strain of a Subgrade Fill under Cyclic High-Speed Railway Loading. Int. J. Geomech. 2018, 18, 04018018. [Google Scholar] [CrossRef]
- Cai, Y.Q.; Chen, J.Y.; Cao, Z.G.; Gu, C.; Wang, J. Influence of Grain Gradation on Permanent Strain of Unbound Granular Materials under Low Confining Pressure and High-Cycle Loading. Int. J. Geomech. 2018, 18, 04017156. [Google Scholar] [CrossRef]
- Leng, W.; Xiao, Y.; Nie, R.-s.; Zhou, W.; Liu, W. Investigating Strength and Deformation Characteristics of Heavy-Haul Railway Embankment Materials Using Large-Scale Undrained Cyclic Triaxial Tests. Int. J. Geomech. 2017, 17, 04017074. [Google Scholar] [CrossRef]
- Zhang, Z.-T.; Gao, W.-H. Effect of different test methods on the disintegration behaviour of soft rock and the evolution model of disintegration breakage under cyclic wetting and drying. Eng. Geol. 2020, 279, 105888. [Google Scholar] [CrossRef]
- Zhang, Z.-T.; Gao, W.-H.; Wang, X.; Zhang, J.-Q.; Tang, X.-Y. Degradation-induced evolution of particle roundness and its effect on the shear behaviour of railway ballast. Transp. Geotech. 2020, 24, 100388. [Google Scholar] [CrossRef]
- Zhang, Z.-T.; Gao, W.-H.; Zeng, C.-F.; Tang, X.-Y.; Wu, J. Evolution of the disintegration breakage of red-bed soft rock using a logistic regression model. Transp. Geotech. 2020, 24, 100382. [Google Scholar] [CrossRef]
- Zhu, J.G.; Guo, W.L.; Wen, Y.F.; Yin, J.H.; Zhou, C. New Gradation Equation and Applicability for Particle-Size Distributions of Various Soils. Int. J. Geomech. 2018, 18, 04017155. [Google Scholar] [CrossRef]
- Wu, E.L.; Zhu, J.G.; Chen, G.; Wang, L. Experimental study of effect of gradation on compaction properties of rockfill materials. Bull. Eng. Geol. Environ. 2020, 79, 2863–2869. [Google Scholar] [CrossRef]
- García-de-la-Oliva, J.L.; Moreno-Robles, J. Granular sub-ballast compaction control methods in high-speed railway lines. Spanish experience. Transp. Geotech. 2019, 19, 135–145. [Google Scholar] [CrossRef]
- Trinh, V.N.; Tang, A.M.; Cui, Y.-J.; Dupla, J.-C.; Canou, J.; Calon, N.; Lambert, L.; Robinet, A.; Schoen, O. Mechanical characterisation of the fouled ballast in ancient railway track substructure by large-scale triaxial tests. Soils Found. 2012, 52, 511–523. [Google Scholar] [CrossRef]
- Lenart, S.; Koseki, J.; Miyashita, Y.; Sato, T. Large-scale triaxial tests of dense gravel material at low confining pressures. Soils Found. 2014, 54, 45–55. [Google Scholar] [CrossRef] [Green Version]
- Wichtmann, T.; Rondón, H.A.; Niemunis, A.; Triantafyllidis, T.; Lizcano, A. Prediction of Permanent Deformations in Pavements Using a High-Cycle Accumulation Model. J. Geotech. Geoenviron. Eng. 2010, 136, 728–740. [Google Scholar] [CrossRef] [Green Version]
- Kong, X.; Liu, J.; Zou, D.; Liu, H. Stress-Dilatancy Relationship of Zipingpu Gravel under Cyclic Loading in Triaxial Stress States. Int. J. Geomech. 2016, 16, 04016001. [Google Scholar] [CrossRef]
- Chen, G.; Wu, Q.; Zhao, K.; Shen, Z.; Yang, J. A Binary Packing Material–Based Procedure for Evaluating Soil Liquefaction Triggering during Earthquakes. J. Geotech. Geoenviron. Eng. 2020, 146, 04020040. [Google Scholar] [CrossRef]
- Wu, Q.; Ma, W.j.; Liu, Q.; Zhao, K.; Chen, G. Dynamic shear modulus and damping ratio of rubber-sand mixtures with a wide range of rubber content. Mater. Today Commun. 2021, 27, 102341. [Google Scholar] [CrossRef]
- Huang, B.; Ding, H.; Chen, Y. Simulation of high-speed train load by dynamic triaxial tests. Chin. J. Geotech. Eng. 2011, 33, 195–202. (In Chinese) [Google Scholar]
- Li, Y.; Zhang, J.; Zhu, Z.; Wang, X.; Yu, Z. Accumulated deformation of gravel filler of subgrade under cyclic loading. Adv. Eng. Sci. 2018, 50, 130–137. (In Chinese) [Google Scholar]
- Wang, C.; Chen, Y. Study on effect of traffic loading induced static deviator stress on undrained cyclic properties of saturated soft clay. Chin. J. Geotech. Eng. 2007, 29, 1742–1747. (In Chinese) [Google Scholar]
- Wang, J.; Chang, Z.; Tang, Y.; Tang, Y. Dynamic triaxial test analysis of reinforced gravel soil under cyclic loading. Rock Soil Mech. 2020, 41, 2851–2860. (In Chinese) [Google Scholar]
- Wu, E.; Zhu, J.; Guo, W.; Zhang, Z. Effect of Gradation on the Compactability of Coarse-Grained Soils. KSCE J. Civ. Eng. 2020, 24, 356–364. [Google Scholar] [CrossRef]
- Zhang, Z.; Gao, W.; Liu, C.; Liu, Z.; Feng, X. Experimental study on the effect of gradation on the compaction and strength characteristics of coal gangue subgrade filler. J. Eng. Geol. 2022. (In Chinese) [Google Scholar] [CrossRef]
- Monismith, C.L.; Ogawa, N.; Freeme, C.R. Permanent deformation characteristics of subgrade soils due to repeated load. Transp. Res. Rec. 1975, 537, 1–17. [Google Scholar]
- Liu, B.; Pham, D.P.; Su, Q.; Gui, B. Deformation characteristics of subgrade graded gravel with different water contents. Rock Soil Mech. 2016, 37, 1365–1372. (In Chinese) [Google Scholar]
- Mu, R.; Huang, Z.; Pu, S.; Yao, Z.; Cheng, X. Accumulated deformation characteristics of undisturbed red clay under cyclic loading and dynamic constitutive relationship. Rock Soil Mech 2020, S2, 1–10. (In Chinese) [Google Scholar]
- Mei, H.; Leng, W.; Nie, R.; Li, Y. Study on dynamic behavior and permanent deformation characteristics of coarse-grained soil. J. Huazhong Univ. of Sci. Technol. (Nat. Sci. Ed.) 2019, 47, 113–119. (In Chinese) [Google Scholar]
Figure 1.
The waste coal gangue of a coal mine.
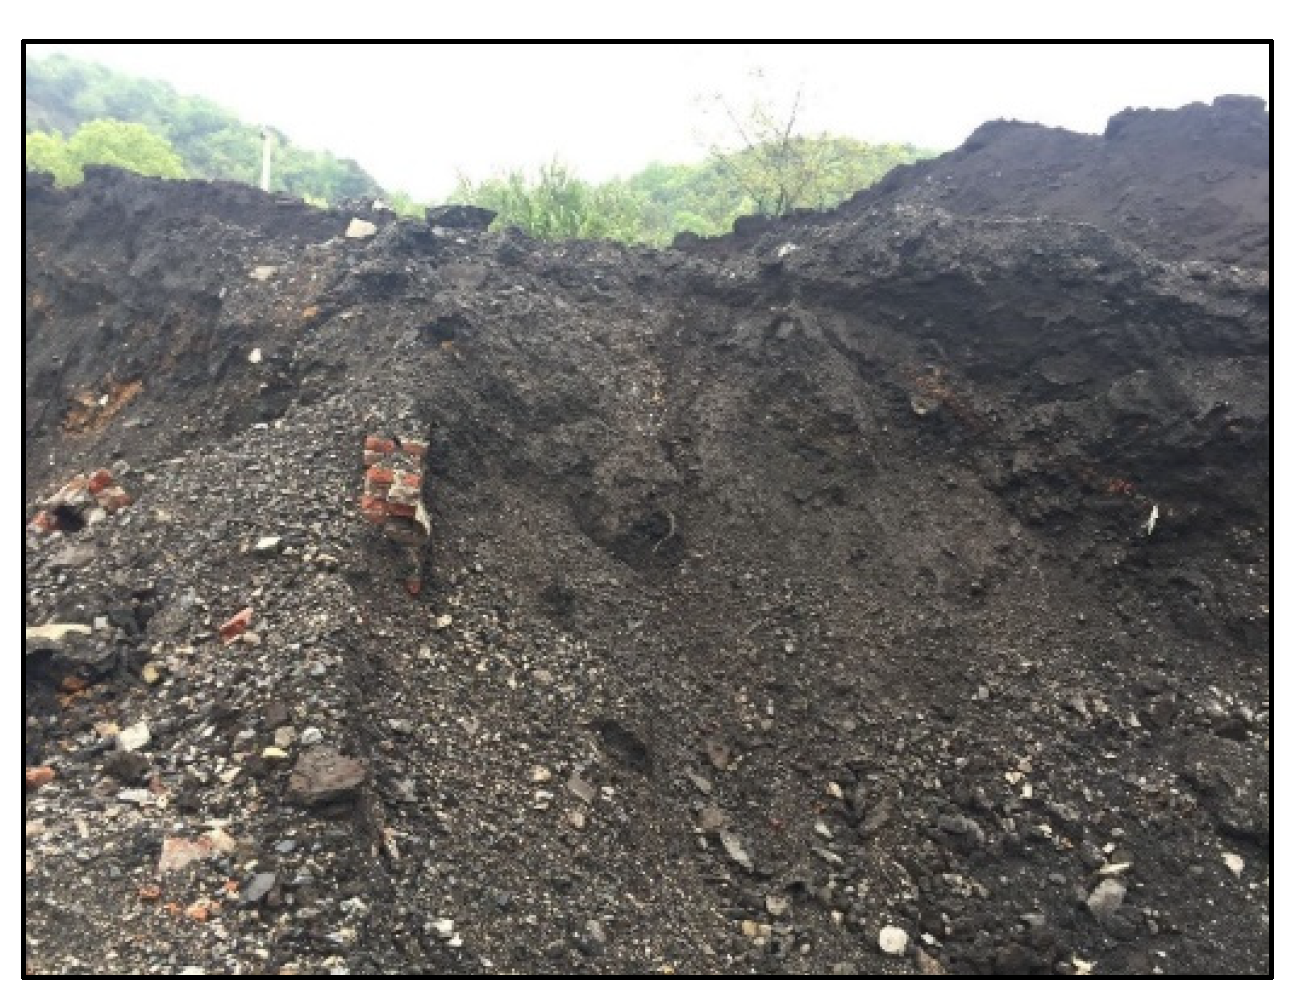
Figure 2.
Coal gangue particles after sieving tests.
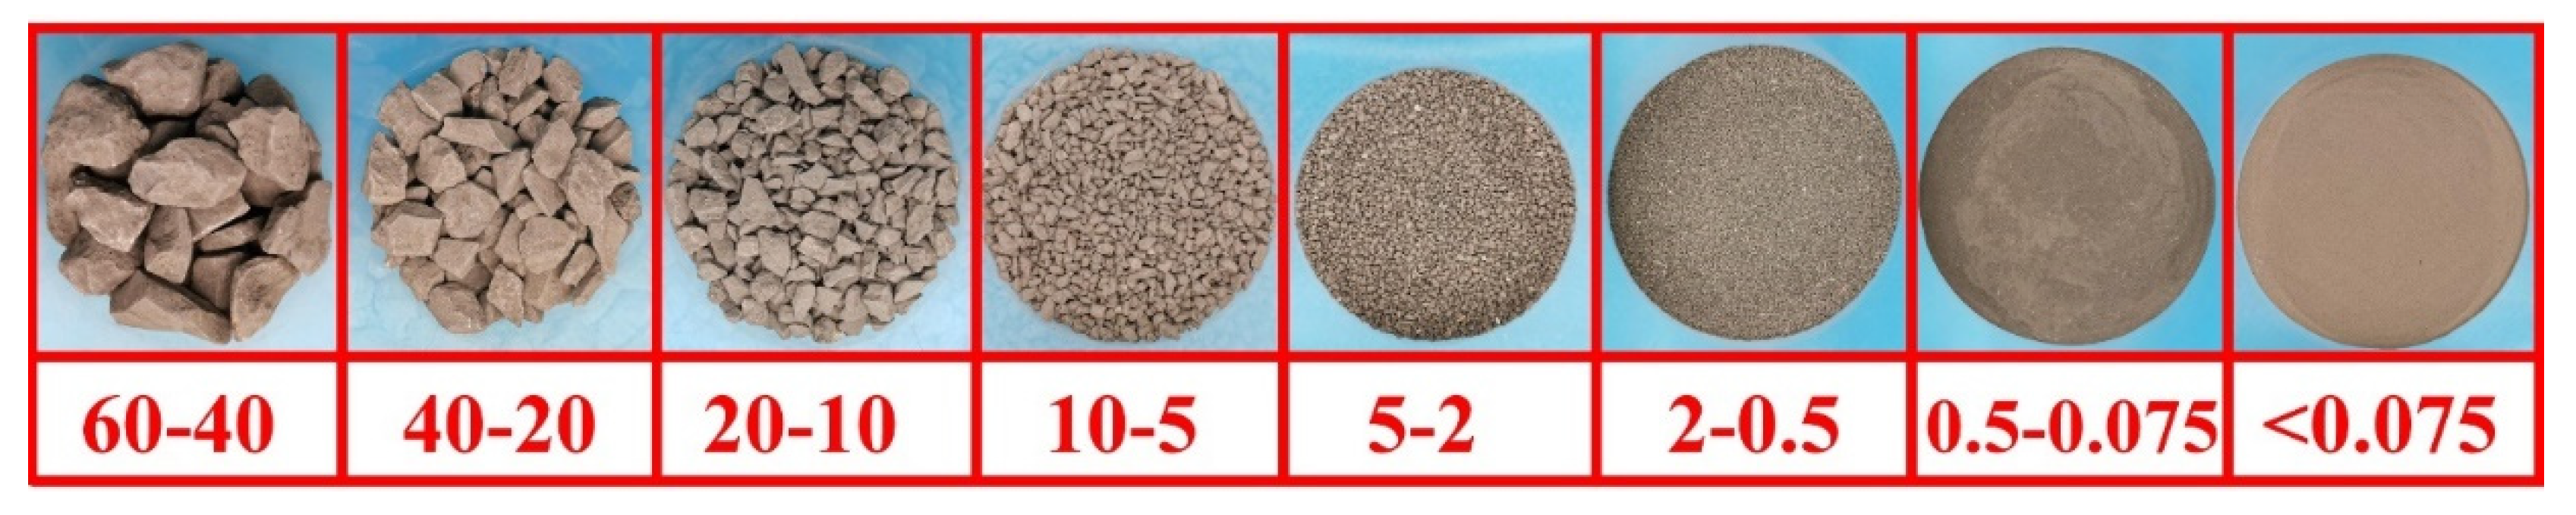
Figure 3.
The large-scale dynamic and static triaxial instrument.
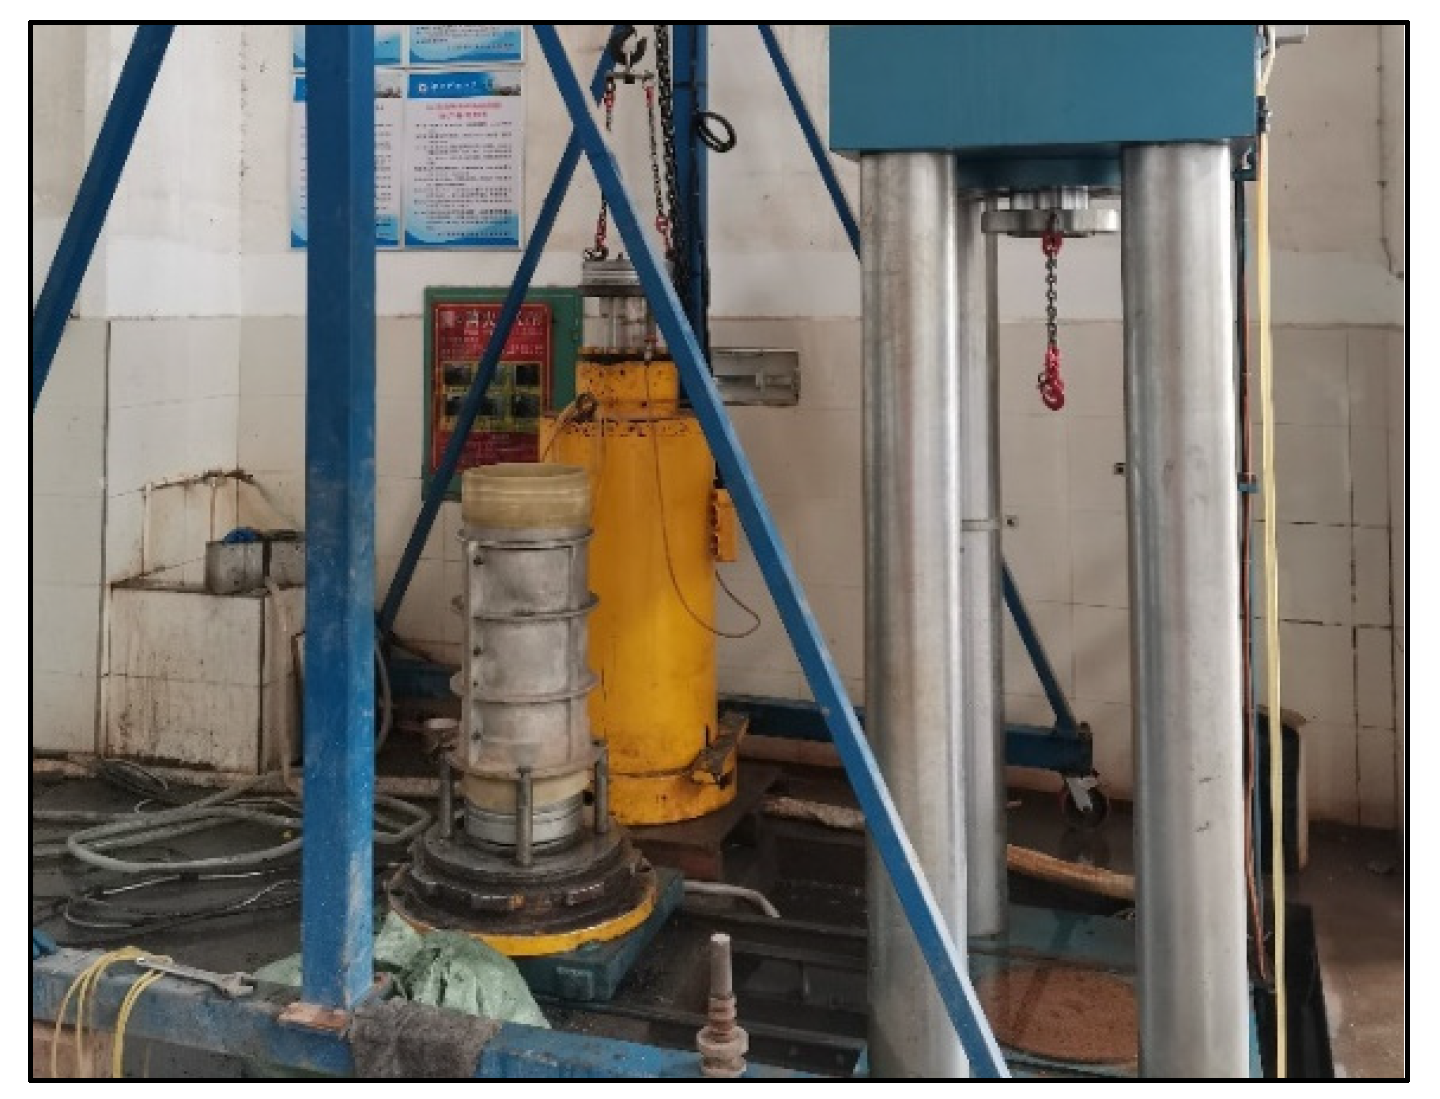
Figure 4.
Particle size distribution of the tested materials.
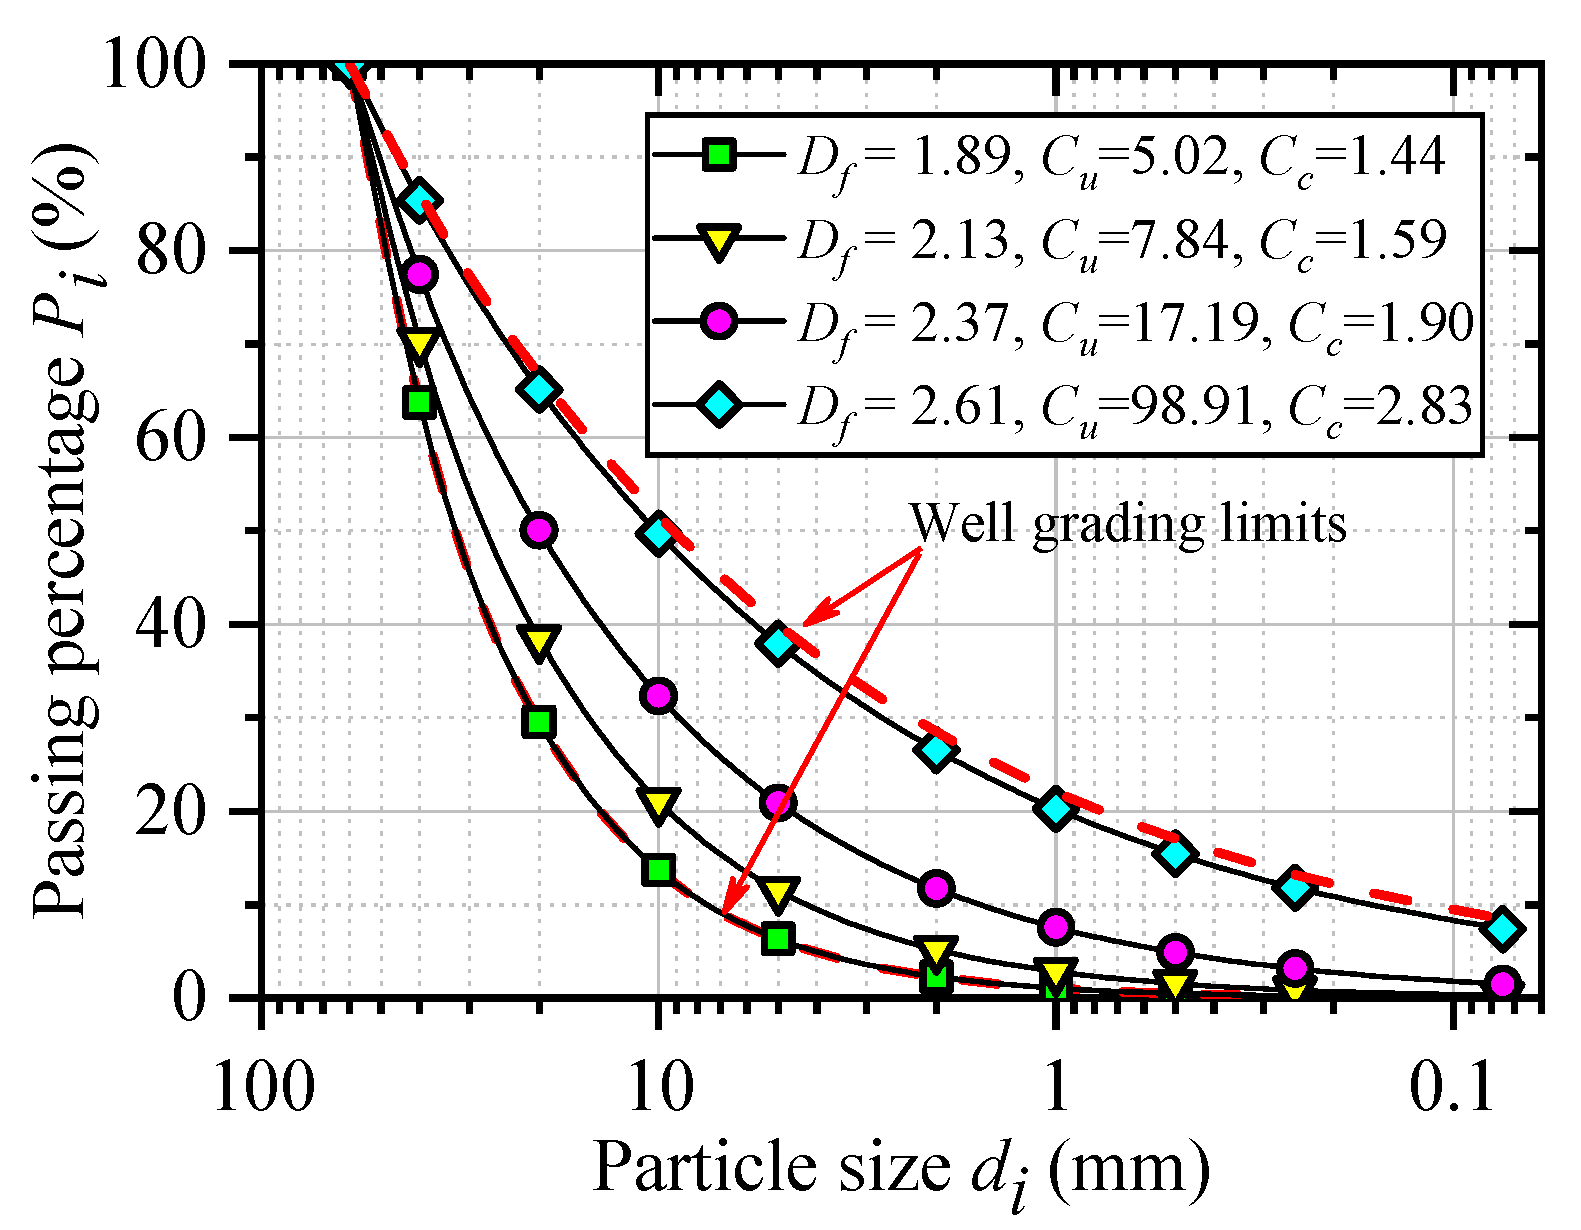
Figure 5.
The process of the large triaxial tests: (a) compacting in the mold; (b) the prepared sample; (c) failed sample after the test.
Figure 5.
The process of the large triaxial tests: (a) compacting in the mold; (b) the prepared sample; (c) failed sample after the test.
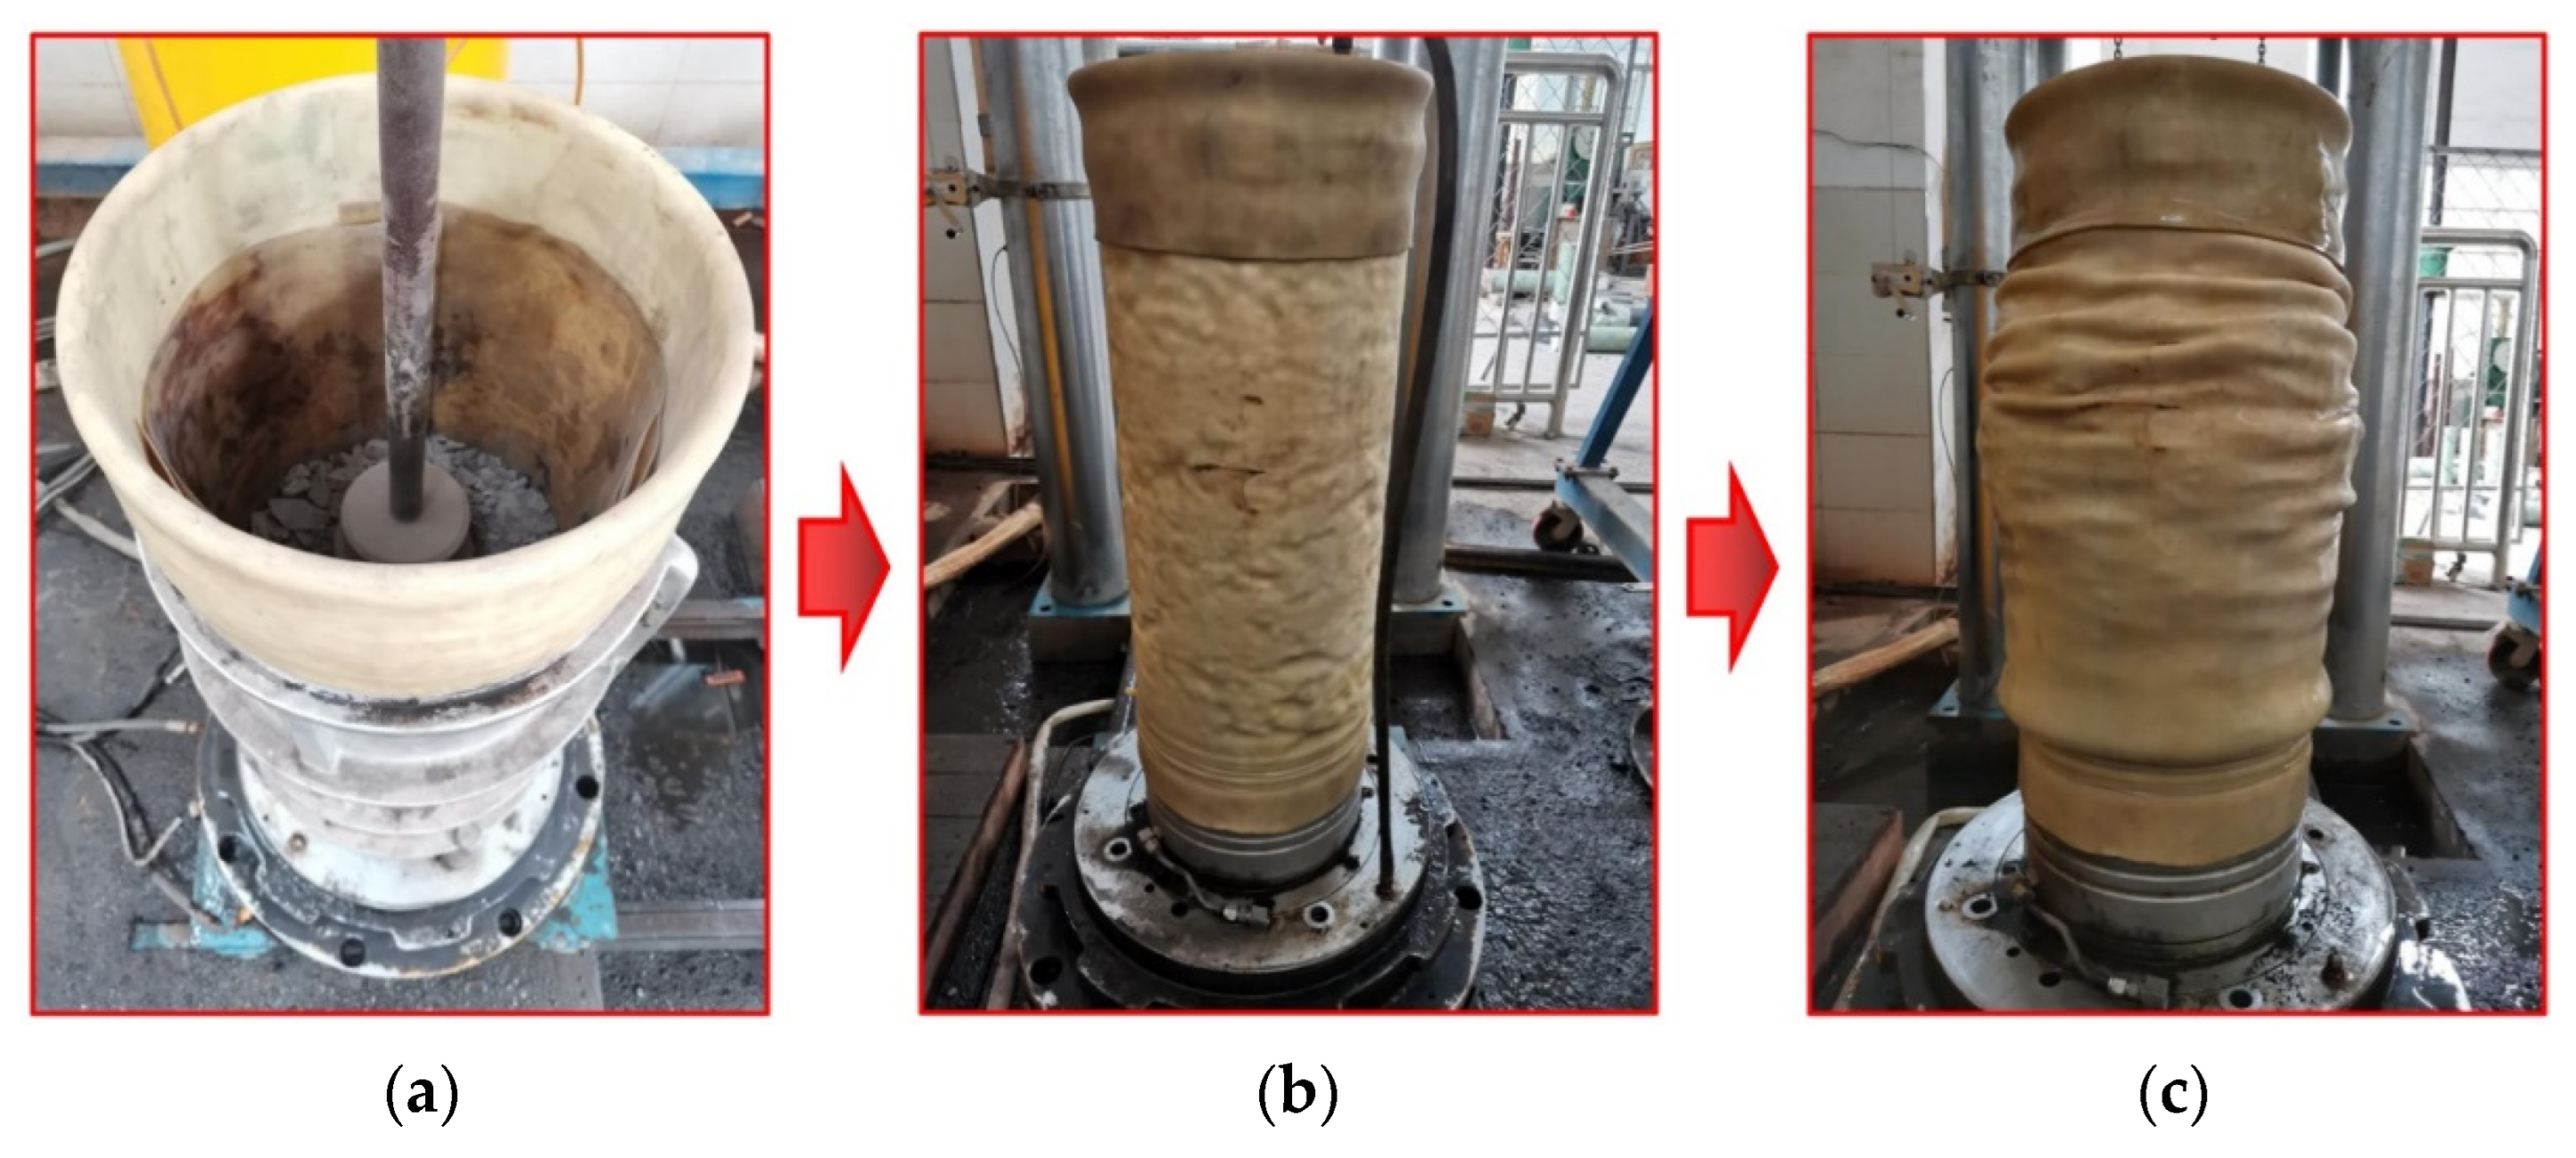
Figure 6.
Loading process under cyclic loading.
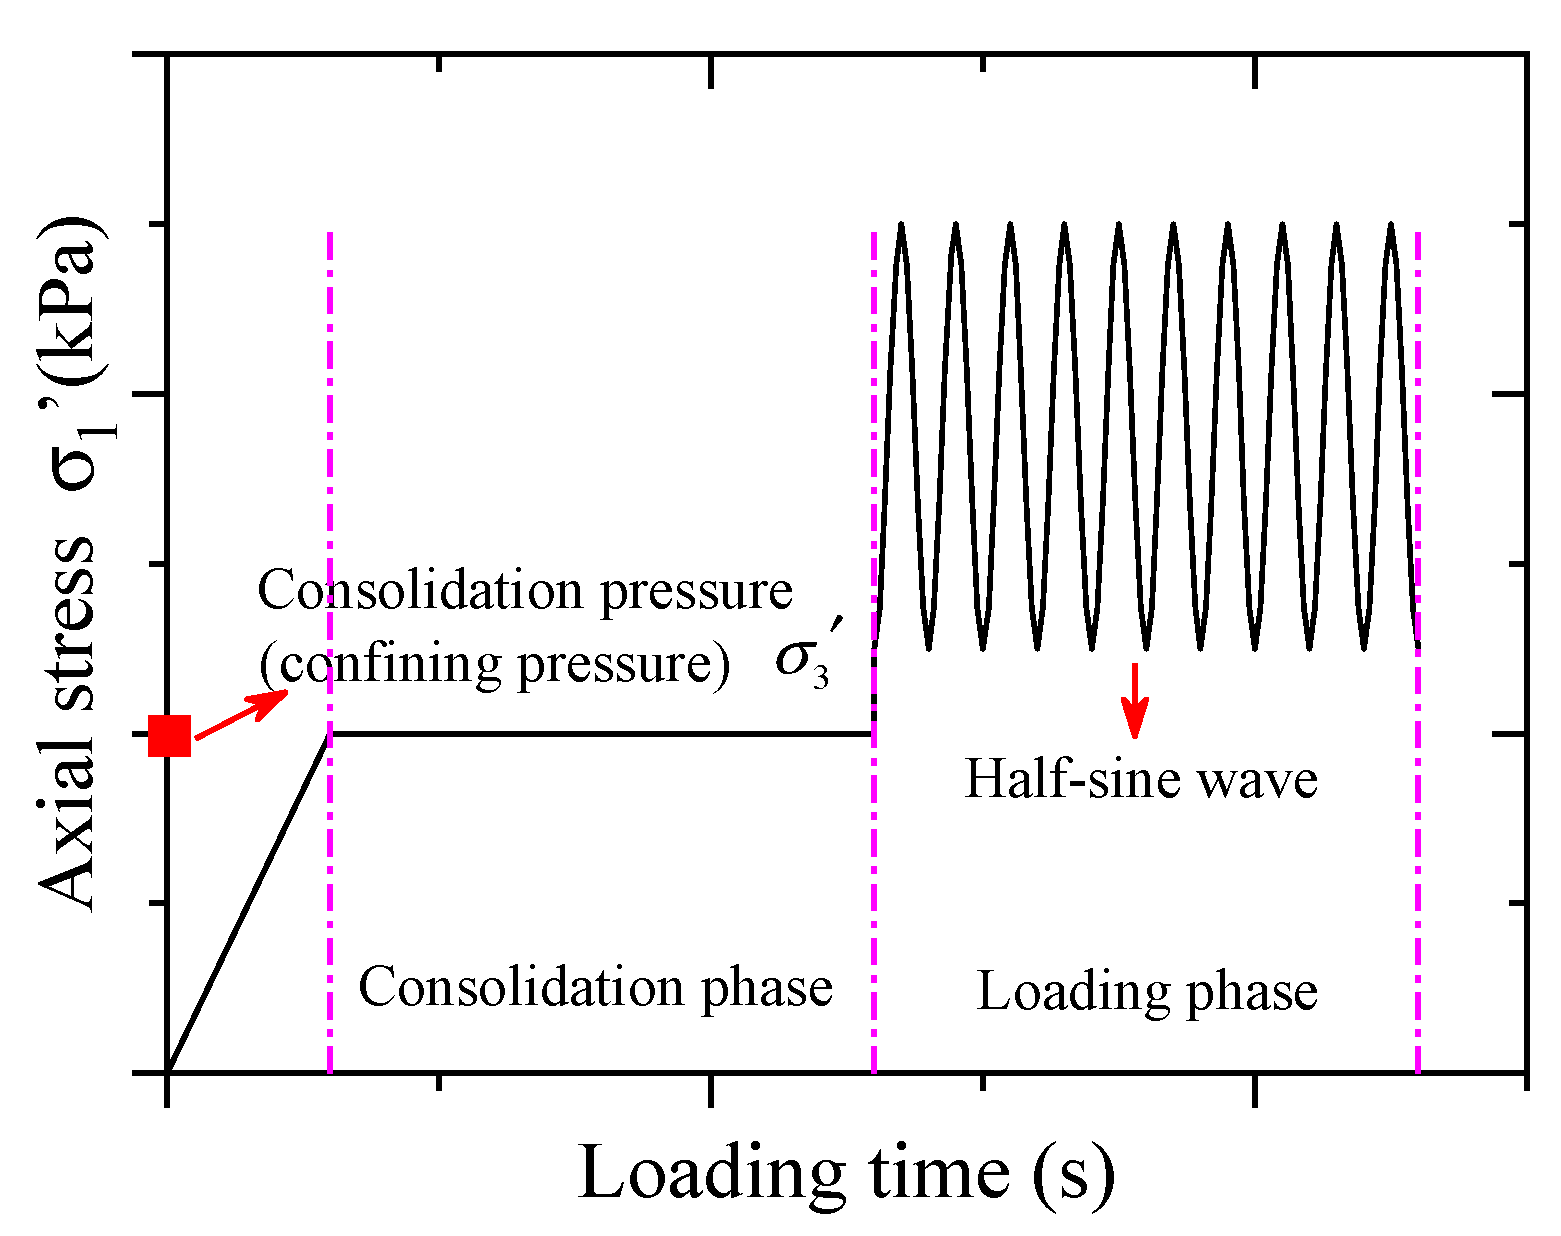
Figure 7.
Schematic diagram of the permanent deformation calculation.
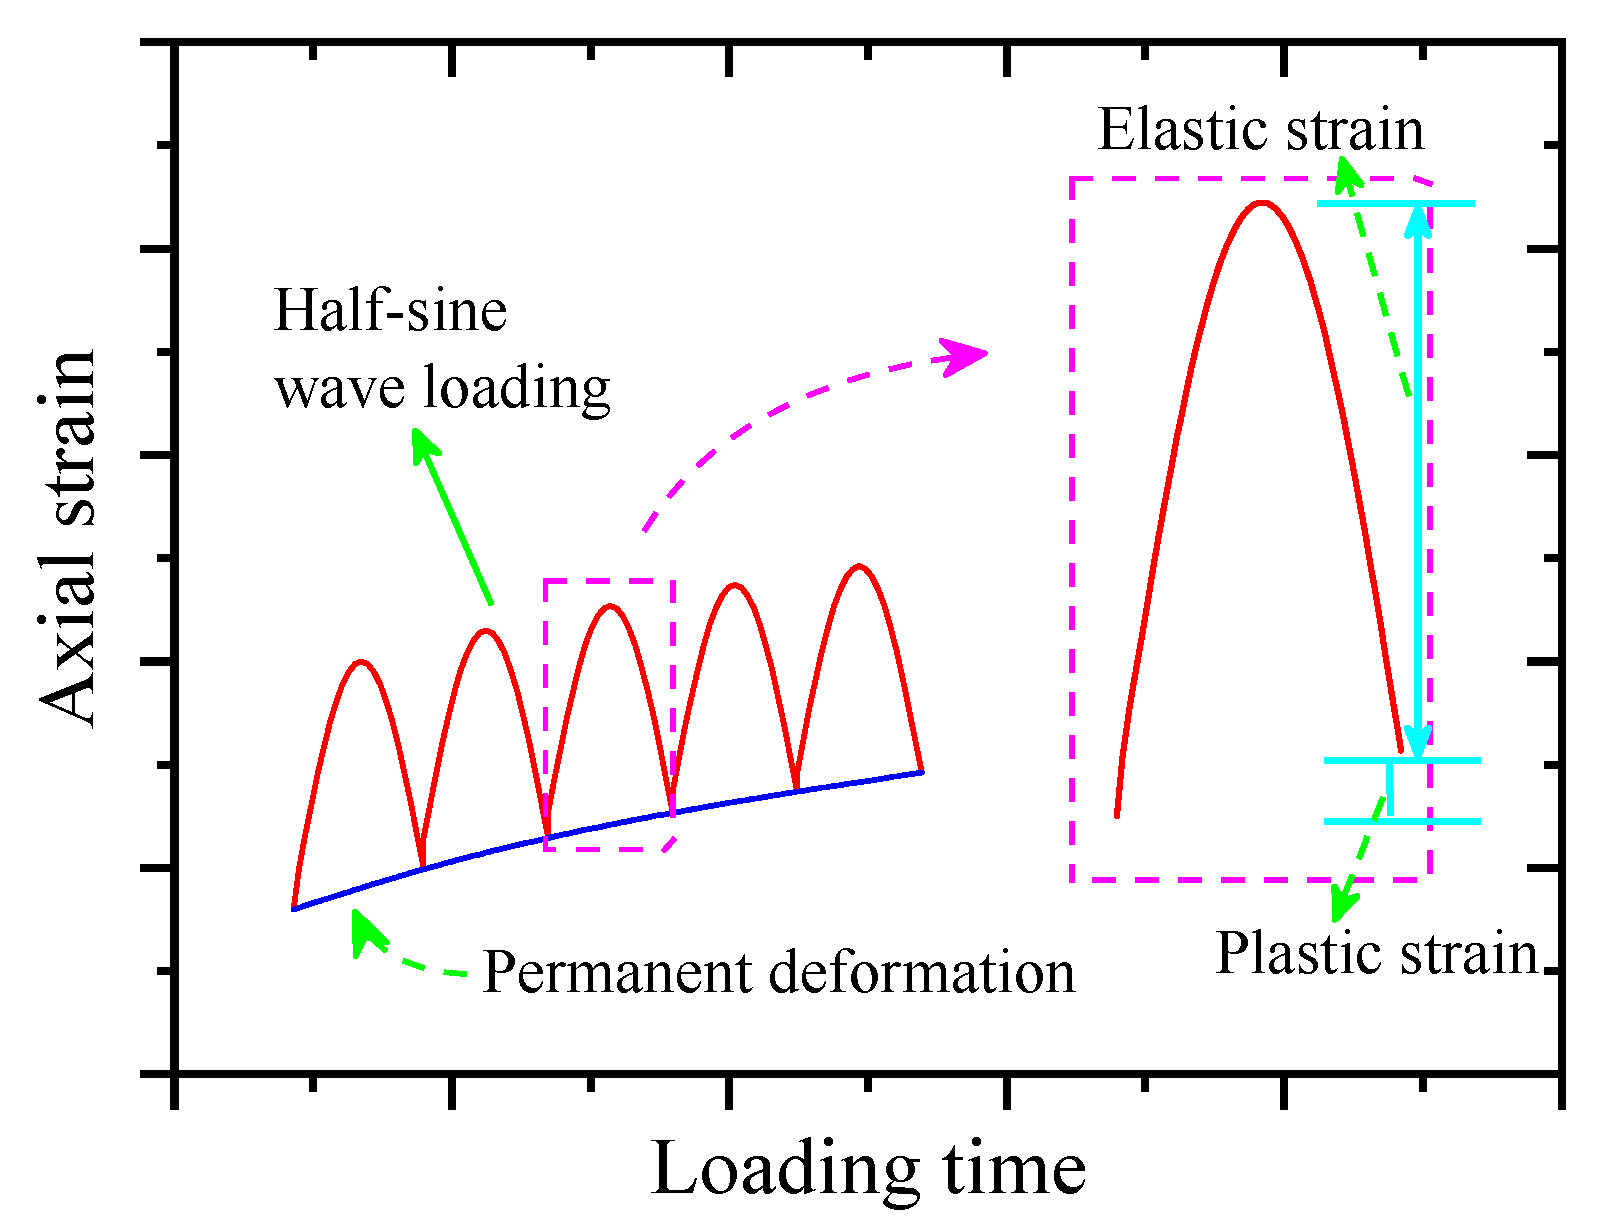
Figure 8.
The relationship between and N with different confining pressure values.
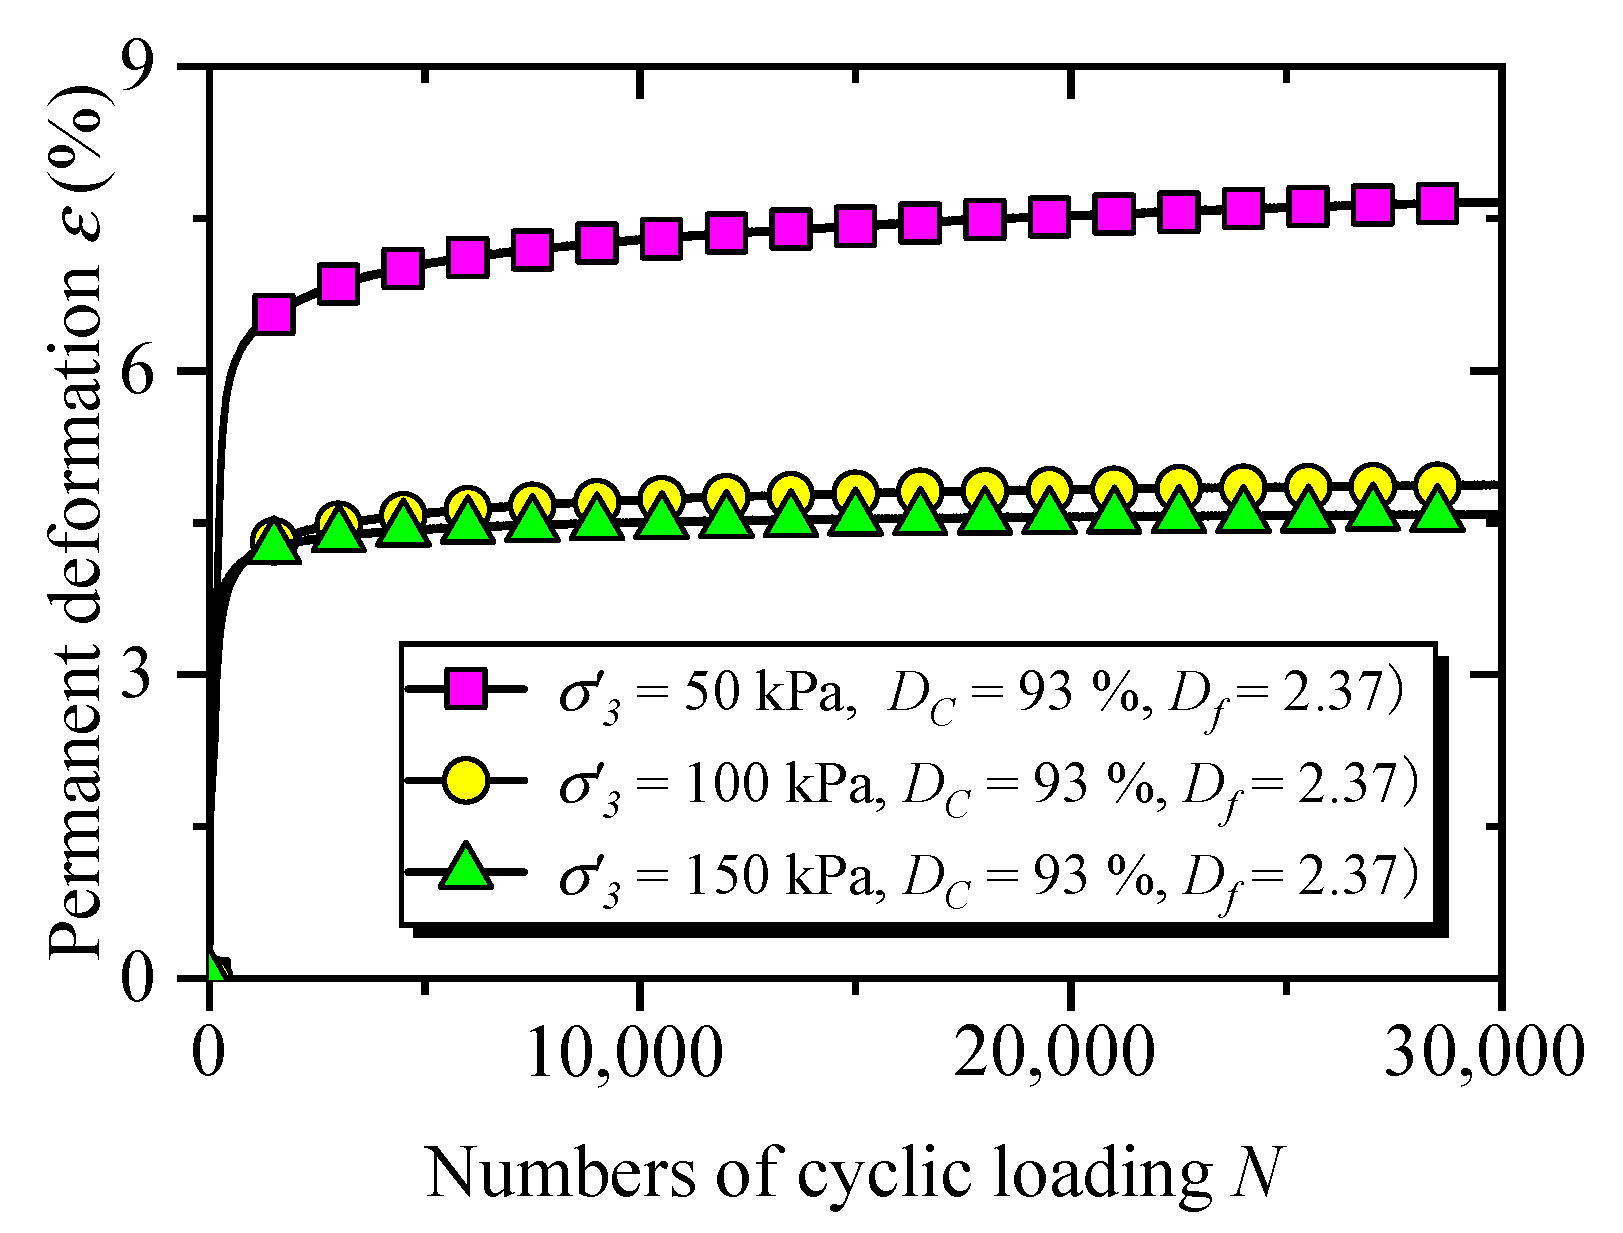
Figure 9.
Relationship between and N with different grading parameters.

Figure 10.
Evolution of versus N with different compaction degree values.


Figure 12.
Comparison between the proposed model and the test curve: (a) under different confining pressure conditions, (b) under diverse compaction degree conditions, and (c) under various grading conditions.
Figure 12.
Comparison between the proposed model and the test curve: (a) under different confining pressure conditions, (b) under diverse compaction degree conditions, and (c) under various grading conditions.
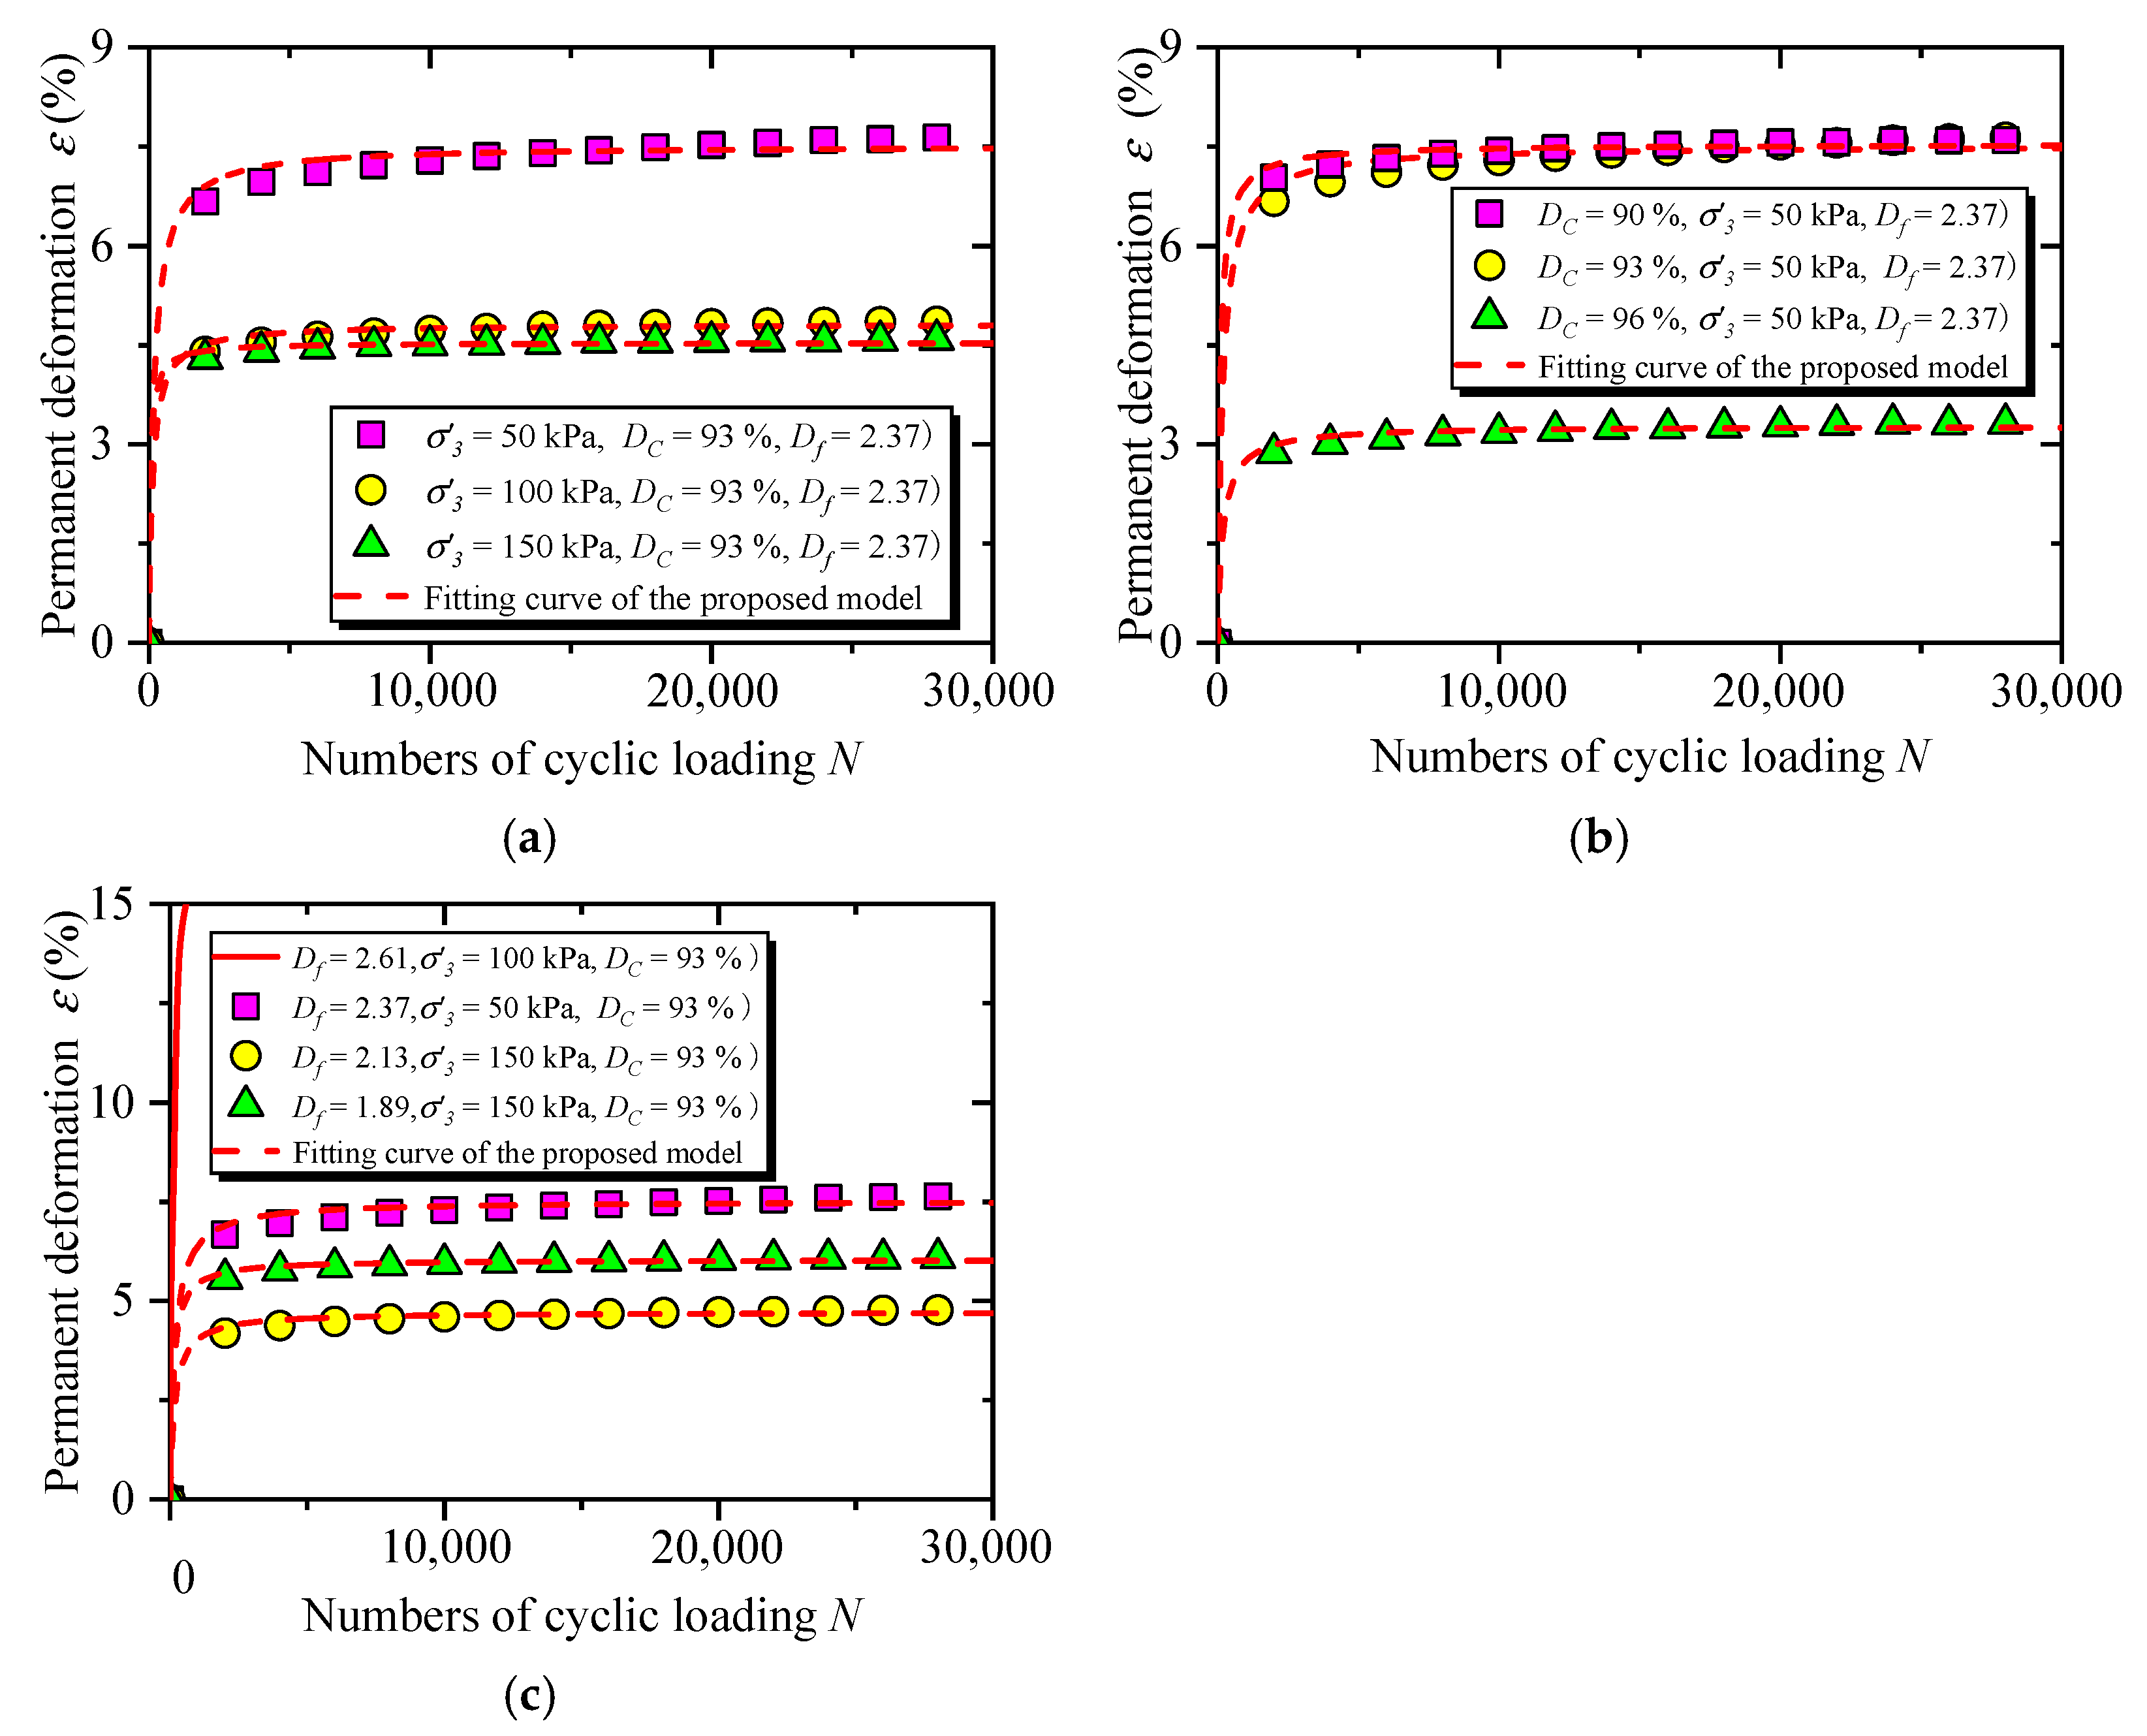
Figure 13.
Model parameters analysis.
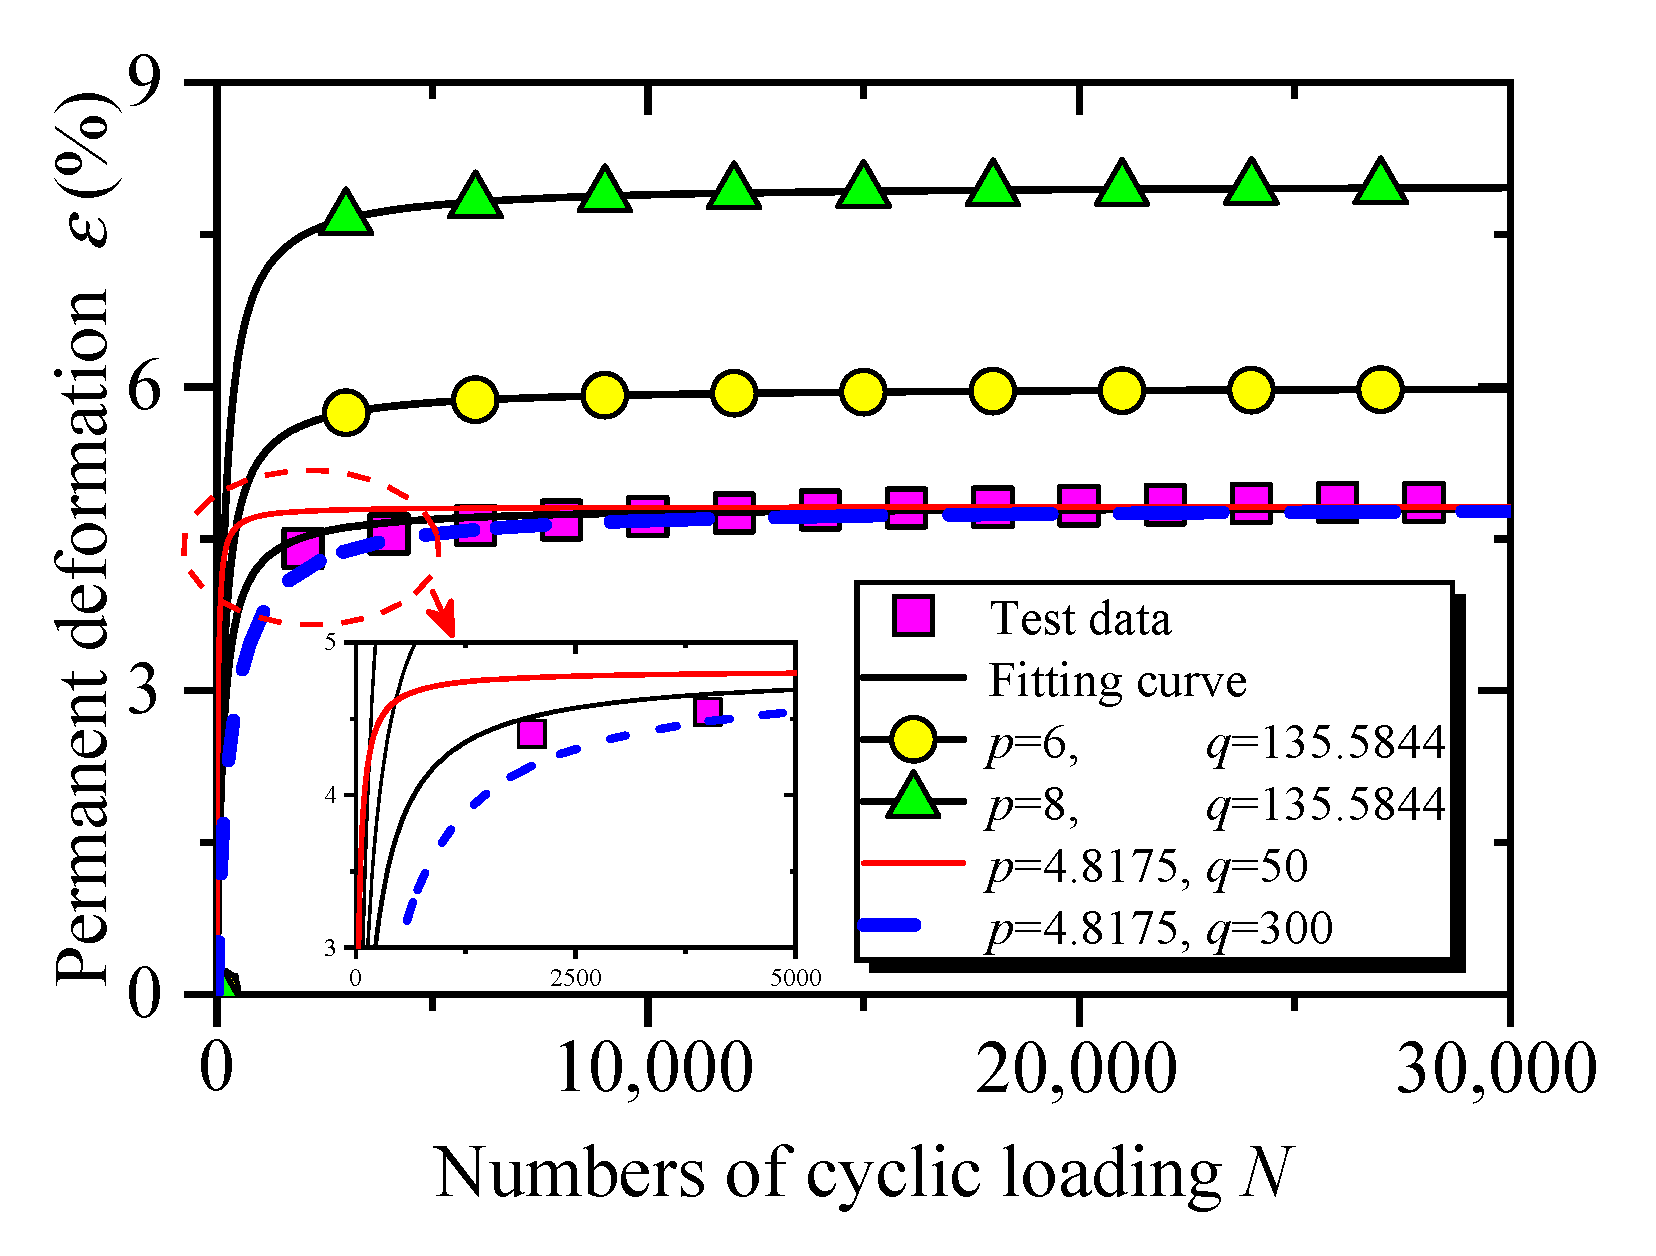
Figure 14.
Model validation. Test data were extracted from: (a) Li et al. [35], (b) Wang et al. [37], and (c) Mei et al. [43].

Table 1.
Test scheme design.
| Specimen Number | (%) | ||
|---|---|---|---|
| DT01 | 2.37 | 50 | 93 |
| DT02 | 2.37 | 100 | 93 |
| DT03 | 2.37 | 150 | 93 |
| DT04 | 2.37 | 50 | 90 |
| DT05 | 2.37 | 50 | 96 |
| DT06 | 2.61 | 50 | 93 |
| DT07 | 2.13 | 50 | 93 |
| DT08 | 1.89 | 50 | 93 |
Table 2.
Model parameters.
| Specimen Number | DT01 | DT02 | DT03 | DT04 | DT05 | DT06 | DT07 | DT08 |
|---|---|---|---|---|---|---|---|---|
| 3.9085 | 2.8126 | 3.2501 | 4.9523 | 1.6604 | 12.1707 | 2.5312 | 3.7737 | |
| 0.0667 | 0.0550 | 0.0345 | 0.0432 | 0.0693 | 0.0323 | 0.0635 | 0.0482 | |
| 0.8159 | 0.7709 | 0.7050 | 0.7170 | 0.8585 | 0.3876 | 0.8570 | 0.7742 | |
| 7.3600 | 4.7367 | 4.4983 | 7.4476 | 3.2039 | 16.5600 | 4.6217 | 5.9533 | |
| 0.0033 | 0.0041 | 0.0102 | 0.0062 | 0.0031 | 0.0051 | 0.0033 | 0.0047 | |
| 0.6947 | 0.7091 | 0.5936 | 0.7042 | 0.6320 | 0.8911 | 0.6038 | 0.6182 | |
| 2.8128 | 2.2945 | 3.0339 | 4.4157 | 1.1584 | 11.2994 | 1.9108 | 3.2612 | |
| 0.4808 | 0.2584 | 0.1558 | 0.3216 | 0.2163 | 0.5537 | 0.2866 | 0.2850 | |
| 0.8560 | 0.8095 | 0.7321 | 0.7494 | 0.8980 | 0.4149 | 0.8937 | 0.8091 |
Table 3.
Parameters of the proposed model.
| Specimen Number | DT01 | DT02 | DT03 | DT04 | DT05 | DT06 | DT07 | DT08 |
|---|---|---|---|---|---|---|---|---|
| 7.5179 | 4.8175 | 4.5371 | 7.5381 | 3.2774 | 16.7341 | 4.7171 | 6.0390 | |
| 178.5503 | 135.5844 | 55.5003 | 87.8797 | 193.5777 | 84.8601 | 172.0490 | 111.6893 | |
| 0.9165 | 0.9391 | 0.9031 | 0.9279 | 0.9104 | 0.9675 | 0.9034 | 0.9152 |
Disclaimer/Publisher’s Note: The statements, opinions and data contained in all publications are solely those of the individual author(s) and contributor(s) and not of MDPI and/or the editor(s). MDPI and/or the editor(s) disclaim responsibility for any injury to people or property resulting from any ideas, methods, instructions or products referred to in the content. |
© 2023 by the authors. Licensee MDPI, Basel, Switzerland. This article is an open access article distributed under the terms and conditions of the Creative Commons Attribution (CC BY) license (https://creativecommons.org/licenses/by/4.0/).
Share and Cite
MDPI and ACS Style
Zhang, Z.-T.; Wang, Y.-H.; Gao, W.-H.; Hu, W.; Liu, S.-K. Permanent Deformation and Its Unified Model of Coal Gangue Subgrade Filler under Traffic Cyclic Loading. Appl. Sci. 2023, 13, 4128. https://doi.org/10.3390/app13074128
AMA Style
Zhang Z-T, Wang Y-H, Gao W-H, Hu W, Liu S-K. Permanent Deformation and Its Unified Model of Coal Gangue Subgrade Filler under Traffic Cyclic Loading. Applied Sciences. 2023; 13(7):4128. https://doi.org/10.3390/app13074128
Chicago/Turabian StyleZhang, Zong-Tang, Yan-Hao Wang, Wen-Hua Gao, Wei Hu, and Shun-Kai Liu. 2023. "Permanent Deformation and Its Unified Model of Coal Gangue Subgrade Filler under Traffic Cyclic Loading" Applied Sciences 13, no. 7: 4128. https://doi.org/10.3390/app13074128
Note that from the first issue of 2016, this journal uses article numbers instead of page numbers. See further details here.