Article

A Novel Approach to Detect COVID-19: Enhanced Deep Learning Models with Convolutional Neural Networks

by
Awf A. Ramadhan
1 and
Muhammet Baykara
2,*
1
Department of Public Health, Duhok Polytechnic University, Duhok 42001, Iraq
2
Department of Software Engineering, Fırat University, Elazığ 23119, Turkey
*
Author to whom correspondence should be addressed.
Appl. Sci. 2022, 12(18), 9325; https://doi.org/10.3390/app12189325
Submission received: 24 August 2022 / Revised: 13 September 2022 / Accepted: 14 September 2022 / Published: 17 September 2022
(This article belongs to the Special Issue Applications of Deep Learning and Artificial Intelligence Methods)

Abstract

:
The novel coronavirus (COVID-19) is a contagious viral disease that has rapidly spread worldwide since December 2019, causing the disruption of life and heavy economic losses. Since the beginning of the virus outbreak, a polymerase chain reaction has been used to detect the virus. However, since it is an expensive and slow method, artificial intelligence researchers have attempted to develop quick, inexpensive alternative methods of diagnosis to help doctors identify positive cases. Therefore, researchers are starting to incorporate chest X-ray scans (CXRs), an easy and inexpensive examination method. This study used an approach that uses image cropping methods and a deep learning technique (updated VGG16 model) to classify three public datasets. This study had four main steps. First, the data were split into training and testing sets (70% and 30%, respectively). Second, in the image processing step, each image was cropped to show only the chest area. The images were then resized to 150 × 150. The third step was to build an updated VGG16 convolutional neural network (VGG16-CNN) model using multiple classifications (three classes: COVID-19, normal, and pneumonia) and binary classification (COVID-19 and normal). The fourth step was to evaluate the model’s performance using accuracy, sensitivity, and specificity. This study obtained 97.50% accuracy for multiple classifications and 99.76% for binary classification. The study also got the best COVID-19 classification accuracy (99%) for both models. It can be considered that the scientific contribution of this research is summarized as: the VGG16 model was reduced from approximately 138 million parameters to around 40 million parameters. Further, it was tested on three different datasets and proved highly efficient in performance.

1. Introduction

The novel coronavirus (COVID-19) is a contagious viral disease that causes acute respiratory syndrome [1,2]. It engulfed the entire world, causing many people to lose their lives daily [3]. The COVID-19 pandemic began to spread from the Chinese city of Wuhan in September 2019 [4]. This new strain was identified as a member of the coronavirus family. It was preceded by severe acute respiratory syndrome (SARS) in China in 2002 and Middle East Respiratory Syndrome (MERS) in the Kingdom of Saudi Arabia in 2013 [5]. The World Health Organization (WHO) named this new virus ‘COVID-19’ in February 2020 and classified it as a global pandemic on 11 March 2020 [1,4,5]. The COVID-19 virus causes various symptoms in those affected, including high temperature, diarrhea, coughing, shortness of breath, acute pneumonia, organ failure and heart failure, among others. Critical cases require pulmonary resuscitation devices, which have been fully implemented in most countries due to the huge number of affected individuals [5,6]. Since the pandemic began to spread worldwide, scientists have been attempting to find an anti-coronavirus drug. Artificial intelligence researchers have also worked on developing early diagnostic mechanisms to detect infected individuals and identify the severity of the patient’s condition to help doctors provide appropriate treatments—for example, using X-ray images, among other techniques [7]. As COVID-19 spread, online X-ray images of COVID and non-COVID patients became publicly available for analysis in the form of databases on various repositories, such as GitHub and Kaggle [1,3].
According to the latest statistics from the WHO, at 4:14 PM CET on 29 December 21, the number of people infected with COVID-19 officially reported worldwide had reached 281,808,270, and the number of deaths had reached 5,411,759 (https://worldhealthorg.shinyapps.io/covid/, accessed on 13 September 2022).
Detecting COVID-19 cases based on X-ray imaging outperforms other virus detection systems and testing groups because it gives faster results, can be used with many patients at the same time and has a low average cost that enables emerging countries to speed up the positive case detection process [4]. The deep learning and machine learning methods used to detect positive COVID-19 cases using computerized tomography (CT), X-ray, and CX images have helped doctors make appropriate decisions. Clinical X-rays are one of the most important and common methods of detecting pneumonia [8]. Deep learning methods, especially convolutional neural networks (CNNs), have performed well in analyzing and classifying X-ray images [9].
This study presents an updated deep-learning model to detect positive cases derived from the VGG16 model. The main objective adopted to build the proposed model is to reduce the training time by minimizing the parameters. The number of parameters in the VGG16 model is approximately 138 million, while the number of parameters in the proposed model is about 40 million. Therefore, reducing the number of parameters to a third is a scientific contribution to this study.
In this study, three datasets were classified, each consisting of X-ray images of patients (coronavirus, pneumonia, and normal) using an updated VGG16 model. Two classification methods were used: multi-classification (three classes) and binary classification (cases infected with coronavirus vs. normal cases). The rest of this paper is arranged as follows. In the Section 2, related work is discussed. The Section 3 describes the databases that were used in this study. In the Section 4, the methods and materials used in the study are described. In the Section 5, the results are listed and discussed briefly. In the Section 6, the conclusion of this study is presented.

2. Related Work

Study [1] presented an approach that used pre-trained CNNs to detect COVID-19 cases using chest X-ray images. Three pre-trained CNNs (AlexNet, GoogLeNet, and SqueezeNet) using binary and multi-classification were applied to three publicly available X-ray databases. The results obtained in this study ranged between 98% and 99.8% for binary classification and between 95% and 98% for multi-classification. Asif Iqbal Khan et al. [10] used CoroNet to detect COVID-19 using chest X-ray images. This study relied on a basic CNN model called Xception with an infiltration layer and two connected layers. This model was used to classify three classes (COVID-19, pneumonia, and normal) with 89.6% accuracy. It also achieved 99% precision for binary classification (COVID-19 and normal) and classifying four categories (COVID-19, bacterial pneumonia, viral pneumonia, normal) with 89% accuracy. Rahman et al. [11] provided a DenseNet201-based model with a quadratic SVM classifier for diagnosing coronavirus cases based on a chest X-ray obtained from a publicly available COVID-19 radiography dataset. This study had two main axes: feature extraction and classifier learning. On the first axis, the researchers used a CNN model trained on ImageNet, a dataset containing 1.2 million images from 1000 categories. The outputs of the first axis were used as inputs for the second axis. This study achieved an accuracy of 98.16%, a sensitivity of 98.93%, and a specificity of 98.77%. Waheed Abdul et al. [12] proposed CovidGAN, a network built on a VGG-16 network that had previously been trained to detect COVID-19. This study also used the GAN approach to generate artificial chest X-ray images. This study achieved 85% accuracy on actual data and 96% accuracy using synthetic additives. Ibrahim Abdullahi et al. [13] suggested using a pre-tested AlexNet network to classify COVID-19 using chest X-rays, a binary classification in which the model was trained to classify COVID-19 versus bacterial pneumonia and COVID-19 versus normal pneumonia. The triple classification was also used to classify COVID-19, normal pneumonia, and bacterial pneumonia. The quadruple classification was used to classify COVID-19, bacterial pneumonia, viral pneumonia, and non–COVID-19. The proposed model achieved 94.43% accuracy, 98.19% sensitivity, 95.78% specificity, 91.43% accuracy, 91.94% sensitivity and 100% specificity for COVID-19 pneumonia. Kusakunniran et al. [14] relied on the ResNet-101 network, which was trained on 1500 × 1500 X-ray images to diagnose COVID-19 using binary classification between virus-infected and normal X-ray images. The lung was segmented using a pre-trained U-Net network. This study achieved a classification accuracy of 98%.
As can be understood from the studies in the literature, it has been seen that COVID-19 based on X-ray images can be detected with high accuracy with various deep learning algorithms. Similarly, machine learning methods often give high success rates. Table 1 shows a comparison between our study and the related work studies.

3. Chest X-ray Databases

This study used three databases of chest X-rays freely available to the public: (1) the COVID-19 Radiography Database (COVID-19 Radiography Database|Kaggle) (Db1) [Available online: https://www.kaggle.com/datasets/tawsifurrahman/covid19-radiography-database (accessed on 7 September 2022).], (2) COVID19 + PNEUMONIA + NORMAL Chest X-Ray Images (COVID19 + PNEUMONIA + NORMAL Chest X-Ray Images|Kaggle) (Db2) [Available online: https://www.kaggle.com/datasets/sachinkumar413/covid-pneumonia-normal-chest-xray-images?select=COVID (accessed on 7 September 2022).], and (3) Chest X-ray (COVID-19 & Pneumonia) (Chest X-ray (COVID-19 & Pneumonia)|Kaggle) (Db3) [Available online: https://www.kaggle.com/datasets/prashant268/chest-xray-covid19-pneumonia (accessed on 7 September 2022)]. Db1 contains four sets of images (COVID-19, lung opacity, normal, and viral pneumonia) collected by a team composed of researchers from Qatar University and Dhaka University, as well as doctors from Pakistan and Malaysia. It was initially released with 219 COVID-19 images, 1341 normal images, and 1345 viral pneumonia images. It was then updated several times and now includes 3616 COVID-19 images, 10,200 normal images, 1345 viral pneumonia images, and 6012 lung opacity images. Figure 1 shows a selection of images from Db1. Db2 contains chest X-ray (CXR) images branched into three subfolders (COVID, NORMAL, PNEUMONIA). It consists of 1626 images of patients with COVID-19, 1802 normal images, and 1800 images of patients with pneumonia. Db3 consists of two main folders (training and testing), and each folder has three sub-folder (COVID-19, pneumonia, and normal). The training set contains 5144 images, and the test set contains 1288. Table 2 shows the number of images in each dataset. As shown in Table 2, all databases contain at least three sets (COVID-19, pneumonia, and normal), while Db1 contains four sets (COVID-19, pneumonia, normal, and lung opacity). In this study, we deleted the lung opacity images from Db1. In this study, we used binary classification (COVID-19 vs. normal) and multiclassification (3 classes: COVID-19, pneumonia, and normal).

4. Methodology

This study used deep learning techniques (CNNs) to detect COVID-19 using chest X-ray databases. Figure 2 shows this study’s stages to reach the desired results. As shown in Figure 2, this study had four main steps, some of which included several sub-steps. Step one.

4.1. Splitting Datasets

In this step, we divided the images in all databases into training and testing sets (70% and 30%, respectively). Table 3 shows how the databases were split into two groups. We can observe from Table 3 that Db1 contains normal images almost three times the COVID-19 images during the training process (7192 normal images and 2616 COVID-19 images), while the tDb3 contains pneumonia images nearly seven times the COVID-19 images (3418 pneumonia images, and 460 COVID-19 images). For this reason, we chose the Db2 containing an almost equal number of images to prevent bias during model training.

4.2. Image Processing
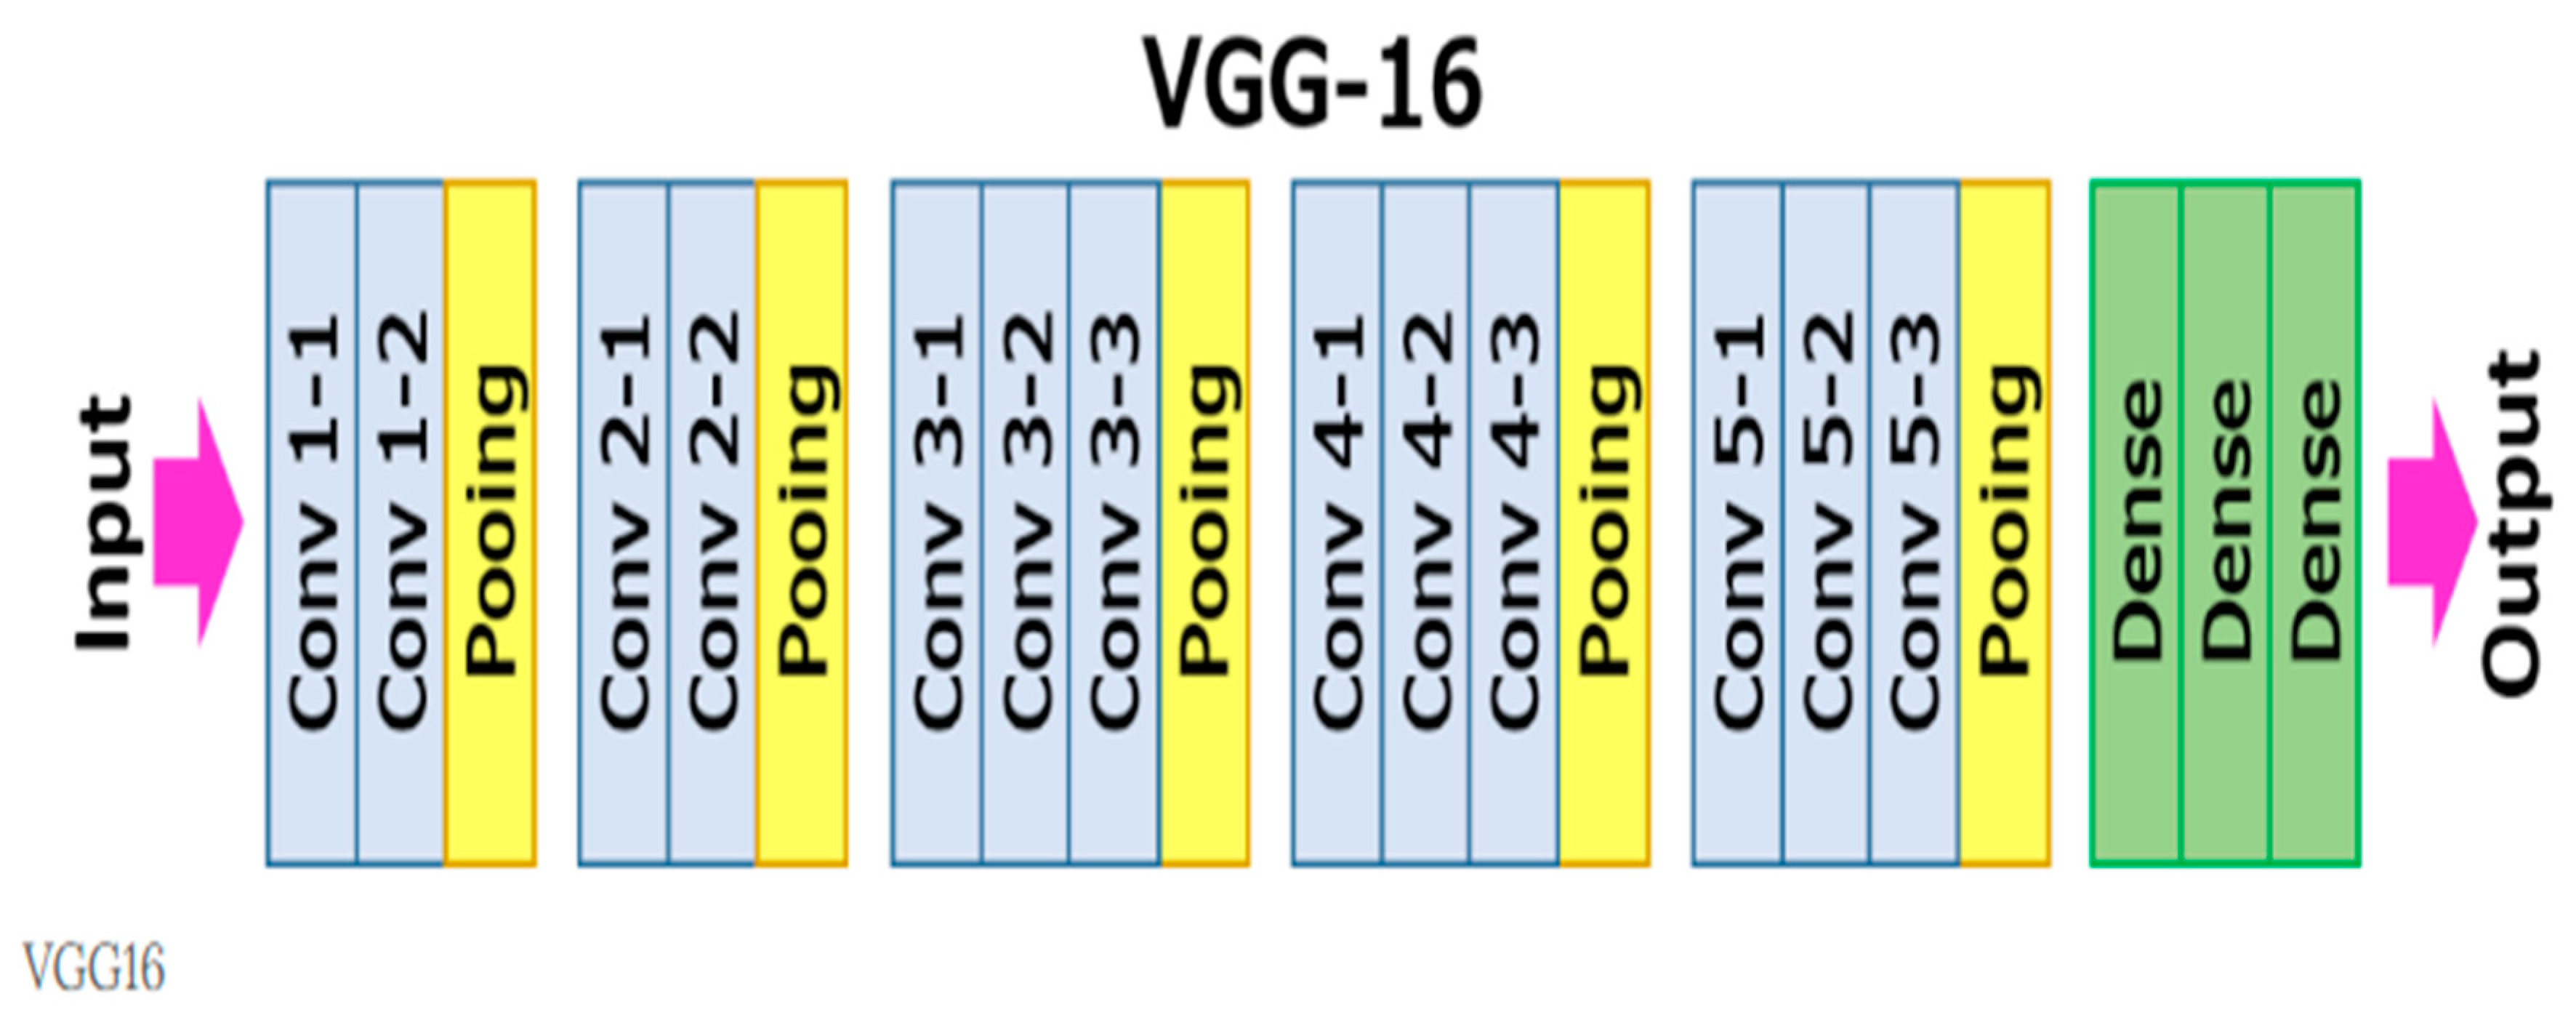
In the image processing stage, all images were uploaded and resized (length and width) to 256 × 256. This size was chosen because the size of all images was greater than or equal to this number. Then the chest area was cropped by selecting the middle point of the images (90 pixels around the center) [15]. The images were thus resized again to 100 × 100. Finally, we normalized the data by dividing them by 255. Figure 3 shows these sub-steps. We can observe from Figure 3 that the first image (a) means the original image, the second image (b) refers to the same image after applying the image cropping method, and the last image (c) refers to the cropped image after resizing it to (100 × 100).

4.3. Proposed Model

Deep learning techniques used in medical image processing helped find solutions to this field’s problems. For example, convolutional neural networks (CNNs) are deep learning networks that are very useful in processing images to find new patterns and recognize objects, faces, and scenes. In this study, a deep learning model called VGG16 was used. The number of parameters for this model was reduced in proportion to the study’s main objective, which is to reduce the training and testing time [16].
CNNs are inspired by biological processes, namely the human brain’s visual cortex. These networks copy the neurons in the human brain to extract more detailed features from images and similarly classify images to the human brain. Figure 4 shows the basic architecture of CNNs [Available online: https://medium.com/analytics-vidhya/convolutional-neural-networks-c123798bd9a4 (accessed on 7 September 2022)]. CNNs have been used in the diagnosis of COVID-19, as they are one of the most effective techniques for diagnosing COVID-19 using digital images [17,18,19].
VGG16 model: VGG16 is a model proposed in 2014 by K. Simonyan and A. Zisserman from Oxford University [20]. The input layer in this model is an image with dimensions (224, 224, 3). This model comprises five blocks of convolutional layers. The first two layers have 64 channels of a 3 × 3 filter size and a ReLU activation unit. Then these two layers are followed by a max-pool layer of stride (2, 2); after that, two layers of 128 channels and filter size (3, 3). These two layers are followed by a max-pooling layer of stride (2, 2) again. The third block contains three layers of 256 channels and filter size (3, 3). They are followed by a max-pooling layer of stride (2, 2). Finally, the last two blocks contain three layers of 512 channels and filter size (3, 3) for each block [21]. Figure 5 shows the structure of the VGG16 model [22].
The VGG16 model is slow because it uses a lot of memory and parameters (approximately 138 million parameters). Most of these parameters, about 123 million, are in fully connected layers. For this reason, this study reduced these parameters to approximately 40 million parameters. This study presented an updated VGG16 CNN model used to build a COVID-19 detection model using chest X-ray images. We used four blocks. The first block contains two layers of 128 channels. It is followed by a max-pooling layer of stride (2, 2). The second block includes two layers of 256 channels followed by a max-pooling layer of stride (2, 2). The third block contains four layers of 512 channels followed by a max-pooling layer of stride (2, 2). The last block has two layers of 1024 channels followed by a max-pooling layer of stride (2, 2). These four blocks are followed by three fully connected flattened layers (1024, 512, and 2526 neurons, respectively) connected to the output layer. Each convolution layer contains a kernel size of three, and a ‘ReLU’ activation function, as shown in Figure 6 and Table 4, which shows the total parameters used in this study. Table 5 shows the parameter setting details in our method.

4.4. Evaluation Metrics

The proposed model used in this study was evaluated using several metrics: global accuracy, recall, precision, F1-score, sensitivity, and specificity. In addition, a confusion matrix was used to check how well both models performed on the new data. The global metrics are defined as the ratio between the correctly predicted values for all classes to the total number of values. A confusion matrix is a tool that measures the performance evaluation of the classification model [23]. In addition, it contains information about the number of actual and predicted labels [24]. The performance of such systems is commonly evaluated using the data in the matrix. The entries in the confusion matrix have the following meaning in the context of this study:
  • TP is the number of correct predictions that an instance is positive,
  • FP is the number of incorrect predictions that an instance positive,
  • FN is the number of incorrect predictions that an instance is negative, and
  • TN is the number of correct predictions that an instance is negative.
A sensitivity test is used to identify positive COVID-19 cases correctly, and this is called the ratio of true positives that are correctly determined by the test. In contrast, the specificity test correctly identifies people with normal cases. It is called the proportion of true negatives, which is correctly determined by the test [25,26].
Equations (1)–(6) give the performance measures for the binary classification, while Equations (7)–(12) provide the multi-classification performance measures [27,28].
A c c b = T P + T N T P + F P + T N + F N
Pr e c i s i o n b = T P T P + F P
Re c a l l b = T P T P + F N
F 1 - S c o r e b = 2 Pr e c i s i o n b Re c a l l b Pr e c i s i o n b + Re c a l l b
S e n s i t i v i t y b = T P T P + F N
S p e c i f i c i t y b = T N F P + T N
A c c m = T P N o r + T P C O V + T P P n e T o t a l s a m p l e s
S e n s . m = T P C O V + T P P n e T P C O V + T P P n e + T N C O V + T N P n e
S p e c i m = T P N o r F P C O V + T P N o r + F P P n e
Pr e c m = T P C o v + T P P n e T P C o v + T P P n e + F P C o v + F P P n e
Re c a l l m = T P C o v + T P P n e T P C o v + T P P n e + F P C o v + F P P n e
F 1 - S c o r e m = 2 Pr e c m Re c a l l m Pr e c m + Re c a l l m
where Accb represents binary accuracy, and Accm represents multi-classification accuracy.

5. Results and Discussion

In this section, we list the results obtained by using the proposed approach to classify chest X-rays into three classes (pneumonia, COVID-19, and normal) and two classes (normal and COVID-19). Table 5 shows the models’ accuracy, sensitivity, and specificity performance. As can be observed from Table 6, the best performance for triple classification was obtained using the Db2 dataset, with 97.50% accuracy and 97.58% sensitivity. While the worst performance for triple classification was obtained using the Db1 dataset, with 95.14% accuracy and 93.60% sensitivity. As for binary classification, the best performance was obtained using the Db3 dataset, with 99.76% accuracy and 100% sensitivity. However, the worst accuracy in binary classification (97%) was obtained using the same dataset (Db1). That means the DB1′s performance did not work well with our model.
Table 7 lists the precision, recall, and F1-scores for datasets Db1, Db2, and Db3. As shown in Table 7, the best COVID-19 classification in the binary classification analysis was 100% in terms of F1-score using DB3, and the best normal classification in the binary classification analysis was (also 100%) in terms of F1-score using DB3.
The worst COVID-19 cases classification in the binary classification analysis was 92% in F1-score using DB1. The worst normal cases classification in the binary classification analysis was 98% in terms of F1-score using DB1.
This is another reason that improving the Db1 dataset did not work well with the proposed model, unlike other datasets. Perhaps this is due to the significant disparity in the number of images between normal and COVID-19 images. For example, the Db1 dataset contains 10,192 normal images, while it contains 3616 COVID-19 images.
Figure 7 and Figure 8 show the confusion matrix, accuracy, and loss curves for Db2 and Db3. As shown in Figure 7, there are four subfigures taken from Db2. Figure 7a,d) refer to the loss function and accuracy for multi-classification and binary classification, respectively. In contrast, Figure 7b,c) show us the confusion matrix for multi-classification and binary classification, respectively—the same thing as Figure 8, which was taken from Db3.
Finally, Table 8 compares this study with previous related work, including the number of samples used in each study and the results obtained (overall accuracy, COVID-19 accuracy, sensitivity, and specificity). As noted in Table 8, this study received promising results compared to related works in the literature, especially in binary classification.

6. Conclusions

Coronavirus is one of the most dangerous viruses to infect the respiratory system. This virus caused huge losses in the global economy. The COVID-19 pandemic started in the Chinese city of Wuhan in September 2019 and swept the world very quickly.
This study used an updated VGG16 model to classify three public COVID-19 datasets. The scientific contribution of this study represents reducing the number of parameters from approximately 138 million parameters (the original VGG16 model) to around 40 million parameters (our model). This model was trained and tested using three public COVID-19 datasets with a total of 21,165 images in Db1, 5226 images in Db2, and 6432 images in Db3. This study had four main steps: (1) splitting the data into training and testing, (2) applying the image cropping method to find the chest area only, (3) applying the proposed model as binary classification and multi-classification, and (4) apply several metrics to evaluate our model. This study obtained promising results using the adopted approach. The accuracy of COVID-19 classification was 99% for triple classification and 100% for binary classification on the Db3 dataset; 98% for triple classification and 99% for binary classification on the Db2 dataset; and 96% for triple classification and 92% for binary classification on the Db1 dataset. In future studies, methods for realizing possible deep learning methods on different data types with hybrid models are planned. Further, we plan to apply the proposed model for the classification of other fields, for example, the classification of brain cancer images, the classification of human emotion signals, and other medical fields.

Author Contributions

Conceptualization, M.B.; methodology, A.A.R. and M.B.; software, A.A.R.; formal analysis, A.A.R. and M.B.; writing-original draft preparation, A.A.R. and M.B.; writing-review and editing.; supervision, M.B.; funding acquisition, M.B. All authors have read and agreed to the published version of the manuscript.

Funding

This research has received no external funding.

Institutional Review Board Statement

Not applicable.

Informed Consent Statement

Not applicable.

Data Availability Statement

All information about the data used in this study are explained in the Section 3.

Conflicts of Interest

The authors declare no conflict of interest.

References

  1. Pham, T.D. Classification of COVID-19 chest X-rays with deep learning: New models or fine tuning? Health Inf. Sci. Syst. 2020, 9, 2. [Google Scholar] [CrossRef] [PubMed]
  2. Gomes, R.; Kamrowski, C.; Langlois, J.; Rozario, P.; Dircks, I.; Grottodden, K.; Martinez, M.; Tee, W.Z.; Sargeant, K.; LaFleur, C.; et al. A Comprehensive Review of Machine Learning Used to Combat COVID-19. Diagnostics 2022, 12, 1853. [Google Scholar] [CrossRef] [PubMed]
  3. Jain, R.; Gupta, M.; Taneja, S.; Hemanth, D.J. Deep learning based detection and analysis of COVID-19 on chest X-ray images. Appl. Intell. 2021, 51, 1690–1700. [Google Scholar] [CrossRef]
  4. Demir, F. DeepCoroNet: A deep LSTM approach for automated detection of COVID-19 cases from chest X-ray images. Appl. Soft Comput. 2021, 103, 107160. [Google Scholar] [CrossRef] [PubMed]
  5. Sethy, P.K.; Behera, S.K.; Ratha, P.K.; Biswas, P. Detection of coronavirus Disease (COVID-19) based on Deep Features and Support Vector Machine. Int. J. Math. Eng. Manag. Sci. 2020, 5, 643–651. [Google Scholar] [CrossRef]
  6. Hussain, E.; Hasan, M.; Rahman, A.; Lee, I.; Tamanna, T.; Parvez, M.Z. CoroDet: A deep learning based classification for COVID-19 detection using chest X-ray images. Chaos Solitons Fractals 2021, 142, 110495. [Google Scholar] [CrossRef]
  7. Varoquaux, G.; Cheplygina, V. Machine learning for medical imaging: Methodological failures and recommendations for the future. NPJ Digit. Med. 2022, 5, 1–8. [Google Scholar] [CrossRef]
  8. Narin, A.; Kaya, C.; Pamuk, Z. Department of Biomedical Engineering, Zonguldak Bulent Ecevit University, 67100, Zonguldak, Turkey. arXiv 2020, arXiv:2003.10849. [Google Scholar]
  9. Khalifa, N.E.M.; Taha, M.H.N.; Hassanien, A.E.; Elghamrawy, S. Detection of coronavirus (COVID-19) associated pneumonia based on generative adversarial networks and a fine-tuned deep transfer learning model using chest X-ray dataset. arXiv 2020, arXiv:2004.01184. [Google Scholar]
  10. Khan, A.I.; Shah, J.L.; Bhat, M.M. CoroNet: A deep neural network for detection and diagnosis of COVID-19 from chest X-ray images. Comput. Methods Programs Biomed. 2020, 196, 105581. [Google Scholar] [CrossRef]
  11. Rahman, S.; Sarker, S.; Al Miraj, A.; Nihal, R.A.; Haque, A.K.M.N.; Al Noman, A. Deep Learning–Driven Automated Detection of COVID-19 from Radiography Images: A Comparative Analysis. Cogn. Comput. 2021, 1–30. [Google Scholar] [CrossRef]
  12. Waheed, A.; Goyal, M.; Gupta, D.; Khanna, A.; Al-Turjman, F.; Pinheiro, P.R. Covidgan: Data augmenta-tion using auxiliary classifier gan for improved COVID-19 detection. IEEE Access 2020, 8, 91916–91923. [Google Scholar] [CrossRef] [PubMed]
  13. Ibrahim, A.U.; Ozsoz, M.; Serte, S.; Al-Turjman, F.; Yakoi, P.S. Pneumonia Classification Using Deep Learning from Chest X-ray Images During COVID-19. Cogn. Comput. 2021, 1–13. [Google Scholar] [CrossRef] [PubMed]
  14. Kusakunniran, W.; Borwarnginn, P.; Sutassananon, K.; Tongdee, T.; Saiviroonporn, P.; Karnjanapreechakorn, S.; Siriapisith, T. COVID-19 detection and heatmap generation in chest x-ray images. J. Med Imaging 2021, 8, 14001. [Google Scholar] [CrossRef]
  15. Abdulrahman, A.; Varol, S. A Review of Image Segmentation Using MATLAB Environment. In Proceedings of the 8th International Symposium on Digital Forensics and Security (ISDFS), Beirut, Lebanon, 1–2 June 2020; pp. 1–5. [Google Scholar] [CrossRef]
  16. Abdulrahman, A.; Baykara, M. A Comprehensive Review for Emotion Detection Based on EEG Signals: Challenges, Applications, and Open Issues. Trait. Signal 2021, 38, 4. [Google Scholar] [CrossRef]
  17. Ahmed, O.; Brifcani, A. Gene Expression Classification Based on Deep Learning. In Proceedings of the 4th Scientific International Conference Najaf (SICN), Al-Najef, Iraq, 29–30 April 2019; pp. 145–149. [Google Scholar]
  18. Singh, K.K.; Siddhartha, M.; Singh, A. Diagnosis of coronavirus disease (COVID-19) from chest X-ray images using modified XceptionNet. Rom. J. Inf. Sci. Technol. 2020, 23, 91–115. [Google Scholar]
  19. Mohammed, A.I.; Tahir, A.A.K. A new image classification system using deep con-volution neural network and modified amsgrad optimizer. J. Duhok Univ. 2019, 22, 89–101. [Google Scholar] [CrossRef]
  20. Simonyan, K.; Zisserman, A. Very deep convolutional networks for large-scale image recognition. arXiv 2014, arXiv:1409.1556. [Google Scholar]
  21. Debnath, S.; Roy, R.; Changder, S. Photo classification based on the presence of diagonal line using pre-trained DCNN VGG16. Multimed. Tools Appl. 2022, 81, 22527–22548. [Google Scholar] [CrossRef]
  22. Rezende, E.; Ruppert, G.; Carvalho, T.; Theophilo, A.; Ramos, F.; de Geus, P. Malicious software classifica-tion using VGG16 deep neural network’s bottleneck features. In Information Technology-New Generations; Springer: Berlin/Heidelberg, Germany, 2018; pp. 51–59. [Google Scholar]
  23. Antunes, J.A.P. To supervise or to self-supervise: A machine learning based comparison on credit supervi-sion. Financ. Innov. 2021, 7, 1–21. [Google Scholar] [CrossRef]
  24. Depren, O.; Kartal, M.T.; Kılıç Depren, S. Recent innovation in benchmark rates (BMR): Evidence from influential factors on Turkish Lira Overnight Reference Interest Rate with machine learning algorithms. Financ. Innov. 2021, 7, 1–20. [Google Scholar] [CrossRef] [PubMed]
  25. Chao, X.; Kou, G.; Li, T.; Peng, Y. Jie Ke versus AlphaGo: A ranking approach using decision making method for large-scale data with incomplete information. Eur. J. Oper. Res. 2018, 265, 239–247. [Google Scholar] [CrossRef]
  26. Wong, H.B.; Lim, G.H. Measures of diagnostic accuracy: Sensitivity, specificity, PPV and NPV. Proc. Singap. Healthc. 2011, 20, 316–318. [Google Scholar] [CrossRef]
  27. Abbas, A.; Abdelsamea, M.M.; Gaber, M.M. Classification of COVID-19 in chest X-ray images using DeTraC deep convolutional neural network. Appl. Intell. 2020, 51, 854–864. [Google Scholar] [CrossRef]
  28. Yadav, S.; Sandhu, J.K.; Pathak, Y.; Jadhav, S. Chest X-ray scanning based detection of COVID-19 using deepconvolutional neural network. Res. Sq. 2020. [Google Scholar] [CrossRef]
  29. Ouchicha, C.; Ammor, O.; Meknassi, M. CVDNet: A novel deep learning architecture for detection of coronavirus (COVID-19) from chest x-ray images. Chaos Solitons Fractals 2020, 140, 110245. [Google Scholar] [CrossRef]
  30. Chowdhury, M.E.H.; Rahman, T.; Khandakar, A.; Mazhar, R.; Kadir, M.A.; Bin Mahbub, Z.; Islam, K.R.; Khan, M.S.; Iqbal, A.; Al Emadi, N.; et al. Can AI Help in Screening Viral and COVID-19 Pneumonia? IEEE Access 2020, 8, 132665–132676. [Google Scholar] [CrossRef]
  31. Islam, Z.; Islam, M.; Asraf, A. A combined deep CNN-LSTM network for the detection of novel coronavirus (COVID-19) using X-ray images. Inform. Med. Unlocked 2020, 20, 100412. [Google Scholar] [CrossRef]
  32. Victor, U.; Dong, X.; Li, X.; Obiomon, P.; Qian, L. Effective COVID-19 Screening using Chest Radiography Images via Deep Learning. In Proceedings of the 4th International Conference on Multimedia Computing, Networking and Applications (MCNA), Valencia, Spain, 19–22 October 2020; pp. 126–130. [Google Scholar] [CrossRef]
  33. Farooq, M.; Hafeez, A. Covid-resnet: A deep learning framework for screening of covid19 from radio-graphs. arXiv 2020, arXiv:2003.14395. [Google Scholar]
Figure 1. Random selection of images from Db1.
Applsci 12 09325 g001
Figure 2. Flow chart diagram for the procedure of this study.
Applsci 12 09325 g002
Figure 3. Sub-steps within step 2 were applied to image number 88 in Db2 (training set, normal subset). (a) Original image; (b) Image after cropping; (c) Image resized to 100 × 100.
Applsci 12 09325 g003
Figure 4. Convolutional neural network architecture.
Applsci 12 09325 g004
Figure 5. Structure of VGG16 convolutional neural network.
Applsci 12 09325 g005
Figure 6. Structure of the updated VGG16 convolutional neural network used in this study.
Applsci 12 09325 g006
Figure 7. Confusion matrix and evaluation metrics for Db2. (a) Loss function and accuracy for multi-classification; (b) Confusion matrix for multi-classification; (c) Confusion matrix for binary classification; (d) The accuracy curve for binary classification.
Applsci 12 09325 g007aApplsci 12 09325 g007b
Figure 8. Confusion matrix and evaluation metrics for Db3. (a) Loss and accuracy curve; (b) Confusion matrix for multi-classification; (c) Confusion matrix for binary classification; (d) The accuracy curve for binary classification.
Applsci 12 09325 g008aApplsci 12 09325 g008b
Table 1. Comparison of this study with the related studies.
StudyMethodNo. of DatasetsClassesAccuracySensitivitySpecificity
(%)(%)(%)
Pham, Tuan [1]AlexNet, GoogleNet, SqueezeNet3Two classesAlexNet 99.14AlexNet 98.44AlexNet 99.9
GoogleNet 99.70GoogleNet 100GoogleNet 99.9
SqueezeNet 99.8SqueezeNet 100SqueezeNet 99.9
Three classesAlexNet 96.46AlexNet 97.35AlexNet 96
GoogleNet 96.25GoogleNet 97.8GoogleNet 95.43
SqueezeNet 96.20SqueezeNet 98.1SqueezeNet 95.35
Asif Iqbal et al. [10]CoroNet2Two classes9998.6-
Three classes89.697.5-
Waheed Abdul et al. [12]CovidGAN3Two classes959097
Ibrahim Abdullahi et al. [13]AlexNet1Two classes99.1697.44100
Three classes9591.384.78
Kusakunniran et al. [14]ResNet-1015Two classes979898
This studyVGG163Two classes99.7610099.68
Three classes97.597.5898.48
Table 2. Contents of the datasets.
SymbolDatabaseNormalCOVID-19PneumoniaLung OpacityTotal
Db1COVID-19 Radiography10,192 images3616 images1345 images6012 images21,165 images
Db2COVID-19 + PNEUMONIA + NORMAL Chest X-ray Images1802 images1626 images1800 images-5226 images
Db3Chest X-ray (COVID-19 & Pneumonia)1583 images576 images4273 images-6432 images
Table 3. Splitting images into two sets at a ratio of 70:30.
DatabaseClassesTrainTest
Db1COVID-192616824
Normal71921452
Pneumonia945400
Db2COVID-191140486
Normal1262540
Pneumonia1260540
Db3COVID-19460116
Normal1266317
Pneumonia3418853
Table 4. The total parameters used in this study.
Layer (Type)Output ShapeParam
conv2d_10(None, 150, 150, 128)3584
batch normalization(None, 150, 150, 128)512
conv2d_11(None, 150, 150, 128)147,584
batch normalization(None, 150, 150, 128)512
max_pooling2d(None, 75, 75, 128)0
dropout_6(None, 75, 75, 128)0
conv2d_12(None, 75, 75, 256)295,168
batch normalization(None, 75, 75, 256)1024
conv2d_13(None, 75, 75, 256)590,080
batch normalization(None, 75, 75, 256)1024
max_pooling2d_6(None, 37, 37, 256)0
dropout_7(None, 37, 37, 256)0
conv2d_14(None, 37, 37, 512)1,180,160
batch normalization(None, 37, 37, 512)2048
conv2d_15(None, 37, 37, 512)2,359,808
batch normalization(None, 37, 37, 512)2048
max_pooling2d_7(None, 18, 18, 512)0
dropout_8(None, 18, 18, 512)0
conv2d_16(None, 18, 18, 512)2,359,808
batch normalization(None, 18, 18, 512)2048
conv2d_17(None, 18, 18, 512)2,359,808
batch normalization(None, 18, 18, 512)2048
max_pooling2d_8(None, 9, 9, 512)0
dropout_9(None, 9, 9, 512)0
conv2d_18(None, 9, 9, 1024)4,719,616
batch normalization(None, 9, 9, 1024)4096
conv2d_19(None, 9, 9, 1024)9,438,208
batch normalization(None, 9, 9, 1024)4096
max_pooling2d_9(None, 4, 4, 1024)0
dropout_10(None, 4, 4, 1024)0
flatten_1 (Flatten)(None, 16,384)0
dense_4 (Dense)(None, 1024)16,778,240
dense_5 (Dense)(None, 512)524,800
dense_6 (Dense)(None, 256)131,328
dropout_11 (Dropout)(None, 256)0
dense_7 (Dense)(None, 3)771
Total params: 40,908,419
Trainable params: 40,898,691
Non-trainable params: 9728
Table 5. Parameter setting details in our method.
Experimental ParametersSetting
Image size100 × 100 × 3
Batch size8
Epoch100
OptimizerSGD
momentum0.9
Learning rate (LR)0.001
LossBinary = binary cross entropy
Multiple = Categorical cross entropy
Validation split0.2
Table 6. Performance of convolutional neural network (accuracy, sensitivity, and specificity) with all datasets and both models.
DatasetModelClassesAccuracy (%)Sensitivity (%)Specificity (%)
DB1VGG16Binary9790.8598.3
Multi95.1493.6094.76
DB2VGG16Binary98.7398.1899.10
Multi97.5097.5898.48
Db3VGG16Binary99.7610099.68
Multi96.5096.3097.30
Table 7. Precision, recall, and F1-score values on all datasets using binary classification.
ModelModelClassesPrecisionRecallF1-Score
DB1VGG16Normal98%98%98%
COVID94%91%92%
DB2VGG16Normal98%99%99%
COVID99%98%98%
DB3VGG16Normal100%100%100%
COVID99%100%100%
Table 8. Comparison of this study with previous studies.
StudyMethodClassesAcc.
(%)
COVIDacc. (%)Sensitive
(%)
Specificity
(%)
Total Samples
(Ouchicha, 2020) [29]CVDNet296.6997.2--2905
(Chowdhury, 2020) [30]DenseNet201299.7099.399.7099.553487
(Yadav, 2020) [28]VGG16299.3598.4199.598.4115,000
This studyVGG16299.7610010099.686432
(Islam, 2020) [31]CNN-LSTM399.499.299.399.24575
(Chowdhury, 2020) [30]DenseNet201397.7496.796.6198.313487
(Victor, 2020) [32]CNN, ResNet387.99---13,800
(Yadav, 2020) [28]VGG16398.8496.8298.719915,000
(Khan, 2020) [10]CoroNet395-97.596.92424
This studyVGG16397.598.1497.5898.4815,153
(Farooq, 2020) [33]ResNet50496.2100--5941
Publisher’s Note: MDPI stays neutral with regard to jurisdictional claims in published maps and institutional affiliations.

