Article

A Semi-Supervised Learning Approach for Automatic Detection and Fashion Product Category Prediction with Small Training Dataset Using FC-YOLOv4

Data and Information Science, Faculty of Science and Technology, Rajamangala University of Technology Thanyaburi, Pathum Thani 12110, Thailand
*
Author to whom correspondence should be addressed.
Appl. Sci. 2022, 12(16), 8068; https://doi.org/10.3390/app12168068
Submission received: 20 June 2022 / Revised: 31 July 2022 / Accepted: 3 August 2022 / Published: 12 August 2022
(This article belongs to the Special Issue Applications of Deep Learning and Artificial Intelligence Methods)

Abstract

:
Over the past few decades, research on object detection has developed rapidly, one of which can be seen in the fashion industry. Fast and accurate detection of an E-commerce fashion product is crucial to choosing the appropriate category. Nowadays, both new and second-hand clothing is provided by E-commerce sites for purchase. Therefore, when categorizing fashion clothing, it is essential to categorize it precisely, regardless of the cluttered background. We present recently acquired tiny product images with various resolutions, sizes, and positions datasets from the Shopee E-commerce (Thailand) website. This paper also proposes the Fashion Category—You Only Look Once version 4 model called FC-YOLOv4 for detecting multiclass fashion products. We used the semi-supervised learning approach to reduce image labeling time, and the number of resulting images is then increased through image augmentation. This approach results in reasonable Average Precision (AP), Mean Average Precision (mAP), True or False Positive (TP/FP), Recall, Intersection over Union (IoU), and reliable object detection. According to experimental findings, our model increases the mAP by 0.07 percent and 40.2 percent increment compared to the original YOLOv4 and YOLOv3. Experimental findings from our FC-YOLOv4 model demonstrate that it can effectively provide accurate fashion category detection for properly captured and clutter images compared to the YOLOv4 and YOLOv3 models.

1. Introduction

The World Health Organization (WHO) announced the COVID-19 outbreak, which began in the city of Wuhan on 30 January 2020, as a Public Health Emergency of International Concern on 11 March 2020 and a pandemic on 11 March 2020 [1]. To minimize the virus spread, individuals are turning to an online-based system, putting aside social distances to avoid unwanted outings, and closing all schools and offices. As a result, customers are shifting their shopping habits to E-commerce platforms to purchase items; consumers are spending more time at home, limiting their ability to shop physically [2]. The fashion industry generates a staggering amount of revenue, often in the billions of dollars, which is directly related to social, cultural, and economic issues in the real world. Clothing is an inescapable requirement for improving personal look in people’s lives. The rapid development of online platforms has led to the proliferation of a great deal of data on social media (the Internet), including clothing data. This, of course, affects how vendors meet customer needs on E-commerce platforms. They eventually saw the value of E-commerce. Stressful occurrences, such as pandemics, also result in long-term behavioral changes and alterations to consuming habits to adjust to new life circumstances.
We discovered, for example, that online customers participate in both problem-solving and emotional coping activities [3]. Prior to the pandemic, one of the keys to the success of E-commerce platforms was customer review ratings, but not after the outbreak [4]. As a result, experts are conducting extensive research to improve the quality of E-commerce and retain existing customers while attracting new ones. Customer satisfaction is a critical aspect of the success of an E-commerce platform [5]. Customer happiness is directly related to identifying items that satisfy the unique demands of each consumer. The more relevant information we can display about a customer’s requirement during the search and suggestion process, the higher the customer satisfaction.
The preceding paper [6] examined the system’s fault in automatic category recommendations on the Shopee Thailand E-commerce portal. This research can assist buyers in avoiding seller fraud and determining which categories are frequently mis-selected by vendors, particularly in the fashion area. When sellers pick a category for their items, 75.1 percent of products are assigned to the “other” category, despite distinct fashion categories. Due to incorrect categorization, undesirable categories are presented when the consumer searches for items by category. Merchants’ lack of comprehension of product category selection might lead to a loss of customer confidence in the E-commerce platform. Object detection is one of the most successful approaches to solving this problem.
Image processing and computer vision heavily depend on object detection ability [7]. Various Computer Vision techniques are frequently utilized in numerous applications, including clothing detection [7,8], clothes collocation [9,10,11], clothing attribution and category recognition [12], and fashion image retrieval [13,14,15,16,17,18]. Object detection techniques are used in practically every aspect of life; the most notable are surveillance [19,20,21,22], autonomous driving [23,24,25], pedestrian detection [26,27,28], and the fashion industry [29,30,31,32]. Object detection aims to identify distinct item categories and precisely locate category-specific objects using bounding boxes. These applications process rich mid-level images using deep learning technology along with effective feature learning [33,34,35]. During the last two decades, it has been widely accepted that developments around object detection occurred in two distinct historical periods. 2014 marked the transition from traditional object detection to object detection based on deep learning [36].
In contrast to previous approaches, deep learning enables us to extract features from low- to high-level images using deeper architectures that boost the capacity to learn more complicated features than shallow architectures. The deep learning image features are more representative than the handmade features [37]. Consequently, numerous academics are shifting their focus to object detection using deep learning. In general, object detectors based on deep learning can be classified as either single-stage or two-stage. Based on past research, it is clear that researchers selected a reliable two-stage detector to detect objects. The You Only Look Once (YOLO) framework is a popular and often used method for identifying things in real time [38,39]. In this study, we picked YOLO version 4 as the foundational model for addressing the fashion category detection problem in the intelligent business domain.
We will concentrate on the Shopee E-commerce platform, which ranks highly among the most powerful E-commerce platforms in the consumer base. Even when the system recommends products for the category in the Shopee seller portal, sellers continue to make category errors, especially the fashion product [6]. Therefore, we will use FC-YOLOv4 to automatically recognize the product category, assisting merchants in making the best selection which is a crucial aspect of E-commerce business intelligence. This study aimed (goal) to discover and categorize clothing trends.
The main contributions of this paper are as follows:
  • We present a recently acquired, tiny dataset from the Shopee E-commerce (Thailand) website. Skirt, Dress, Pants, Hoodie, and Jacket, with a total of 4116 photographs, were compiled under the category “women.” Images of various resolutions, sizes, and positions are gathered in accordance with the website.
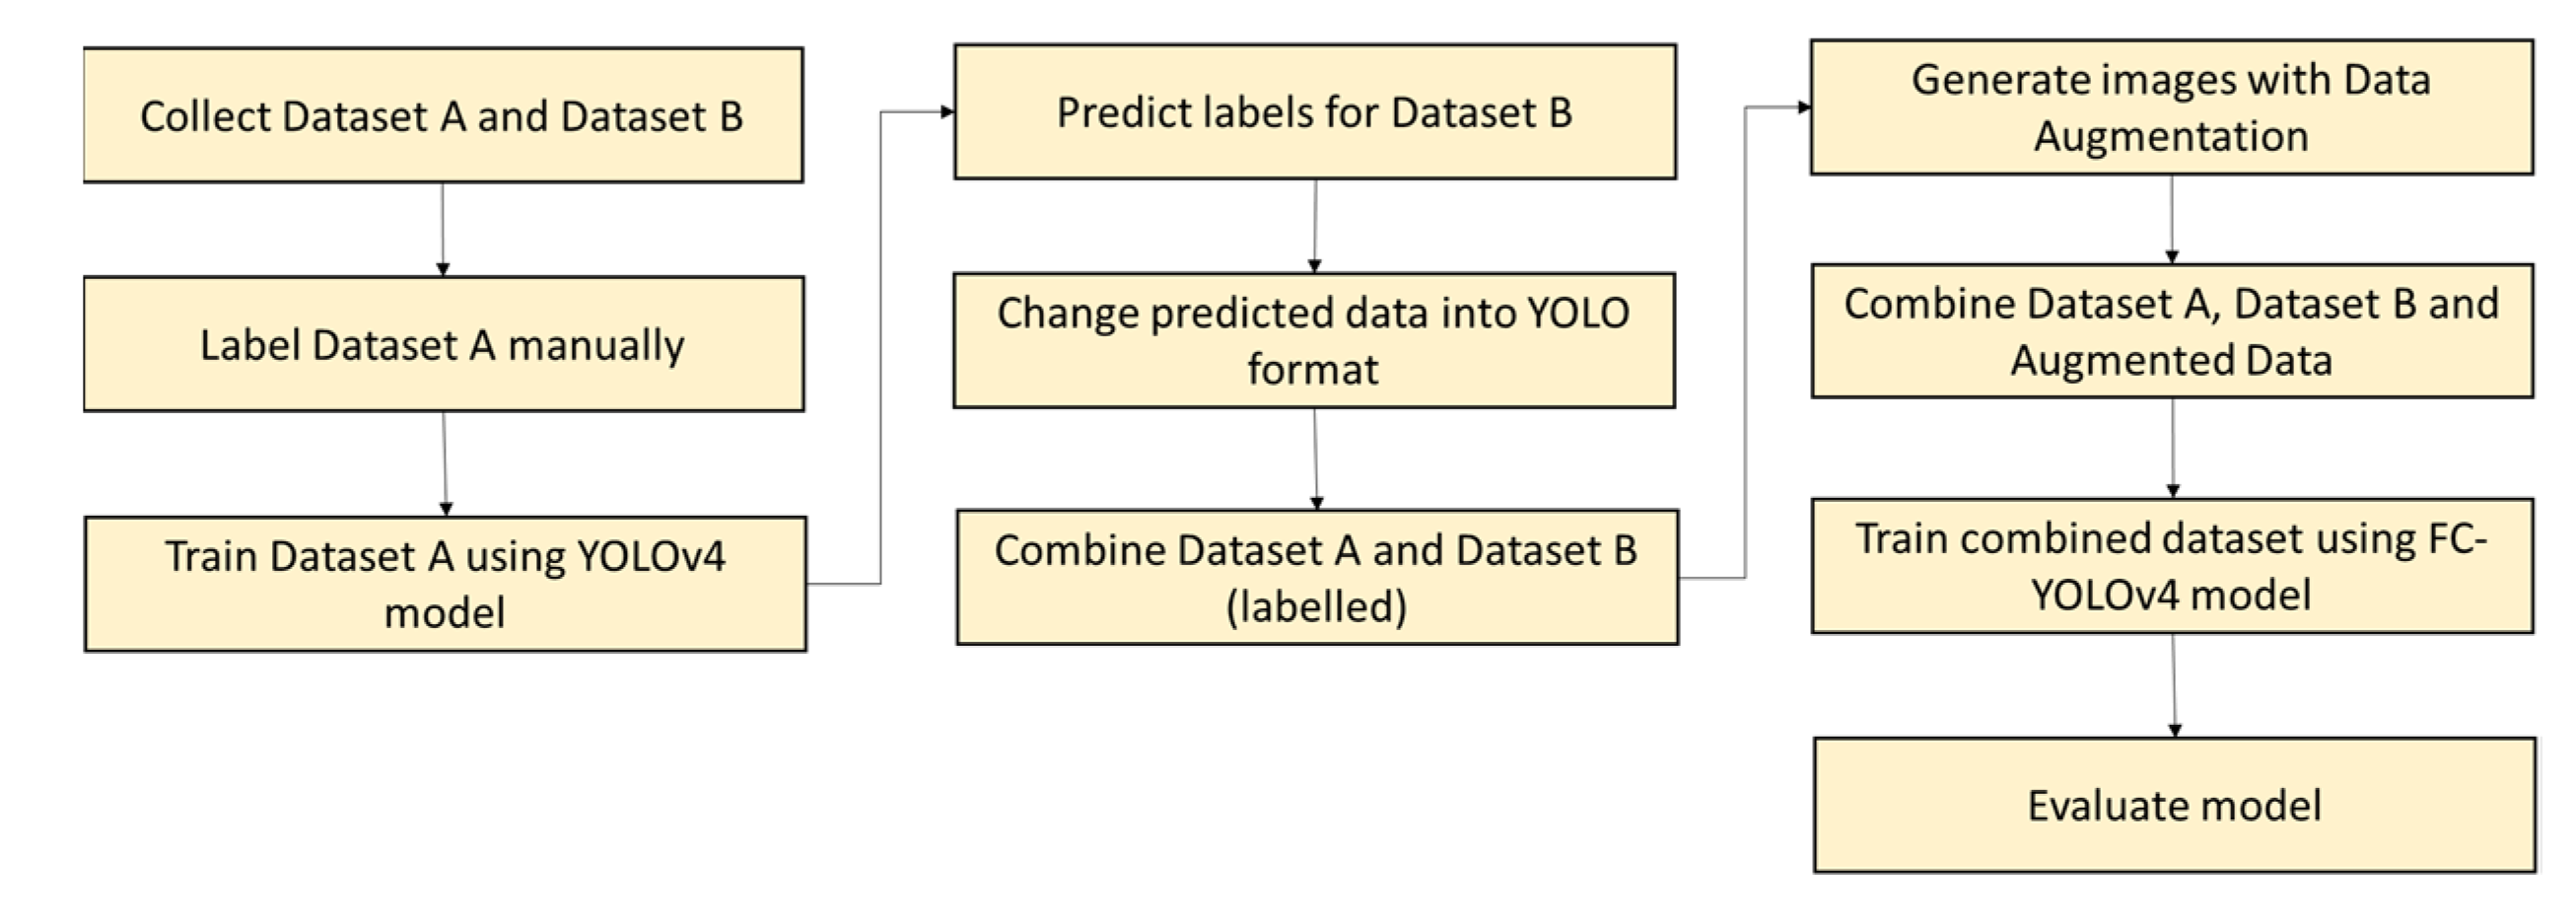
  • We use the semi-supervised learning approach for automatically annotating data to save manual tasks and increase the number of images by using image augmentation to improve object detection accuracy.
  • We propose an accurate image-based classification model utilizing FC-YOLOv4 that can classify Shopee E-commerce products’ images and identify their types.
  • To bring network performance and feature improvements, we increase the quantity of short-circuiting and stacking.
  • To assess and evaluate the applicability and efficiency of the proposed method in fashion category recognition, we evaluated a model with a photo with a cluttered background and compared our FC-YOLOv4 model to YOLOv4 and YOLOv3 with detection time and accuracy as a benchmark.
The content of this article is organized in the following manner. The related work is discussed in the second part. The third section discusses the distribution of our dataset, as well as the structure and implementation of the FC-YOLOv4 detection algorithm. Part four gives a summary of the experimental data as well as a comparison. The fifth section concludes with a strategic approach.

2. Related Works

This part covers garment detection and categorization research, state-of-the-art object detection methods, and YOLO version development.

2.1. Research on Apparel Detection and Classification

Automated product classification in E-commerce using images greatly influences the retail business and is perhaps the most sophisticated application of computer vision. With the advancement of machine learning, several studies have been enhanced, and deep learning technology is now widely employed in the fashion and apparel industries.
One of these studies is [40], a novel model appropriate for low-power devices that use a single-stage detector to recognize numerous garments in the photo. The DeepFashion2 dataset has over 200,000 fashion photos annotated in 13 different classes. Compound scaling is used to scale a backbone feature network that trains input features at various resolutions. It is efficient due to its small number of parameters and cheap computing cost. They minimized the difficulties of single-stage detectors by utilizing the focused loss proposed by RetinaNet. They suggested a technique for multiple-clothing identification and estimating fashion landmarks as an adaption of EfficientDet. Without image preparation, the suggested technique is quick and accurate, and they obtained a bounding box detection accuracy of 0.686 mAP with an inference time of 42 milliseconds. Regarding inference time and resource use, this is obviously inefficient, resulting in the limited applicability of image analysis in the actual situation.
Furthermore, YOLOv4-TPD (YOLOv4 Two-Phase Identification) [41], a two-phase fashion garment recognition system based on the YOLOv4 algorithm, is also available. The study utilized the Items Co-Parsing (CCP) dataset, which included 2098 high-resolution images of fashion clothing. The model detection target categories included the jacket, the top, the bottoms, the skirt, and the bag. They suggested a two-phase transfer learning object detection model for detecting fashion apparel photographs with complicated backgrounds. The experimental results demonstrated that adopting two-phase transfer learning and the CLAHE image enhancement method can enhance model detection precision. They achieved the accuracy of 96.01% of mAP with 15.6333 milli-seconds detection time. This research is more relevant to others regarding detection time and precision. However, the CCP dataset only contains high-resolution photos with no overlapping or occluded items. The selected categories are also simple to identify due to their distinct patterns. This model is unsuitable for clothing with many styles captured by multiple suppliers.
When detecting fashion image categories, there are numerous categories that have similar patterns, such as dress and skirt categories. Researchers are proposed to differentiate object-to-object detection in the previous research [42,43,44,45,46]. To extract suitable and efficient adjacent objects in fashion detection, ref. [47] suggested the Dual Attention Feature Enhancement (DAFE) module. Long-range modeling interactions between channels highlight task-related characteristics and improve pixel-level information. Ref. [44] suggested a method for detecting upper-body garments and classifying them according to distinct attributes for each observed garment. They developed 15 clothing classes for evaluation and presented an 80,000-image benchmark data set for the clothing classification job. Their classifier outperformed an SVM baseline on challenging benchmark data with 41.38 percent versus 35.07 percent average accuracy.
Using SS-DTLM, which stands for Single Stage Deep Transfer Learning model, as a multiclass clothing detector with YOLOv3 modification as the model and an Image feature extraction for various scales, Spatial pyramid pooling with three levels (SPP) is the solution of this research [48]. Their model was trained using Open Images Dataset (OIDV4), which contained six object classes (Shirts, Trousers, Jeans, Skirt, Dress, and Jacket), and Custom created Apparel Dataset, which contained five object categories (Shirts, Trousers, Jeans, Skirt, Dress and Jacket). They compared experimental results with the Yolov3 and Yolov3-Tiny strains. SS-DTLM and K-Means grouping are used to identify the color space of the recognized image. In addition to the several studies, there are YOLO algorithms that several researchers used to detect fashion and apparel products.

2.2. State-of-the-Art Object Detection Algorithms

There are two distinct forms of deep learning object detectors: one- and two-stage detectors. The two-stage object detection method thus requires two stages to conclude. The RoI (Region of Interest) pooling layer can partition two-stage detectors into two stages [49]. The R-CNN series has built and implemented representative networks based on possible regions [50]. R-CNN [51], Fast R-CNN [52], Faster R-CNN [53], and Mask R-CNN [54] have a two-stage detection process. For example, the most popular Faster R-CNN begins with a stage known as RPN, which stands for Region Proposal Network, which is a stage used to identify potential bounding boxes. In the second stage, for the classification and bounding box regression tasks, features are retrieved from each bounding box using an RoI pooling approach. As a preliminary phase, proposals and regional classification are made [55]. Fast/Faster Recurrent Convolutional Neural Network (RCNN two-stage detector) is preferable for immediate information access since the bounding box and object class estimation processes are carried out in tandem [56].
Due to the processing cost of region proposal approaches and their incompatibility with smartphones and other wearable sensors, numerous researchers have pioneered the development of single-stage detection pathways [7]. This is because single-stage detectors are faster in detecting speed and produce more reliable results in terms of accuracy in real-world scenarios. As a result, a single-stage detector is optimal for vast volumes of data, such as those seen in clothing fields. OverFeat [57], Single Shot Detector (SSD) [58], RetinaNet [59], Cornernet [60], and YOLO [61], which are all one-stage detectors, have attracted recognition for their efficiency of processing. Certain parameters, including localization, inference speed, and accuracy, must be carefully examined while designing and selecting one of these detectors.

2.3. Development of YOLO Versions

In 2015, YOLO’s first version (YOLOv1) [61] utilized a single neural network to predict many classes’ bounding box coordinates and confidence scores. YOLOv1 transforms object recognition into challenges with regression. YOLOv1’s primary objective is to build a CNN network capable of predicting tensors. On Pascal VOC2007, YOLOv1 analyzes images at 45 frames per second (fps) rate, which is twice to nine times quicker than Faster R-CNN. Version 2 of YOLO (YOLOv2, or YOLO9000) [62] is a simplified version of YOLO’s single-stage real-time object detection model. It preserves the YOLOv1′s speed advantage while aiming to boost the mAP value. It improves on YOLOv1 in several ways, including the use of Darknet-19 as batch normalization, backbone, a high-resolution classifier, and anchor boxes to predict bounding boxes. It cannot yet generalize to novel or unexpected aspect ratios or configurations of objects. In addition, YOLO’s loss function treats errors consistently in small and large bounding boxes and is not perfect. Then, a new version of YOLOv2 designated YOLOv3 [63] was created using logistic regression to predict the objectiveness score of each bounding box and modify how cost functions are formed. YOLOv3 calculates each label’s binary cross-entropy loss. This may result in a reduction in computing complexity by omitting SoftMax features. [64] proved that YOLOv2 outperforms Faster R-CNN in the identification of fashion clothes. By combining the previous research, it was determined that the YOLO method is more suited for detecting fashion items than the two-stage detection techniques. YOLOv3 is three times quicker than the previous version but has a more significant positioning error. However, it significantly improves tiny object detection. In 2020, YOLOv4 [65] was released, built on the Darknet framework, a freely available neural network framework written in C and CUDA. YOLOv4 takes advantage of the PANet (Path Aggregation Network). This distinction enables the YOLOv4 to be quicker and more precise than the YOLOv3.
Researchers are continually trying to enhance the YOLO standard algorithm for one-stage processes that are as efficient at identifying the position of objects as two-stage approaches. In 2021, ref. [66] proposed the YOLO method with a larger effective receptive field (ERF-YOLO), which would reduce the number of model parameters while maintaining the same performance. BAFPN [42] is a novel bidirectional Feature Pyramid Network that constructs precise object recognition networks using YOLOv4 and Adaptively Spatial Feature Fusion. Utilizing the Exponential Moving Average improves network performance. The constructed network maintains a high computing speed and improves the mAP. Ref. [67] proposed that the YOLO-V4 backbone network CSPDarknet53 be integrated with DenseNet. To accommodate little cherries, the YOLO-V4 model’s a priori box is modified to resemble a cherry-shaped circular marking box. In our study, we introduced the new FC-YOLOv4 model, which is a tangible example of training a network with a small dataset while maintaining detection speed and weight to apply computer vision to the real world. It has the potential to be used in future fashion image analysis research.

3. Materials and Methods

This section discusses dataset collection and pre-processing for our detection, description of traditional YOLOv4 architecture, modified part of our proposed FC-YOLOv4, and the procedure description of our semi-supervised learning for clothing identification and classification.

3.1. Dataset Collection and Pre-Processing

For category detection of fashion clothing datasets from E-commerce, some problems and issues can be considered as follows.
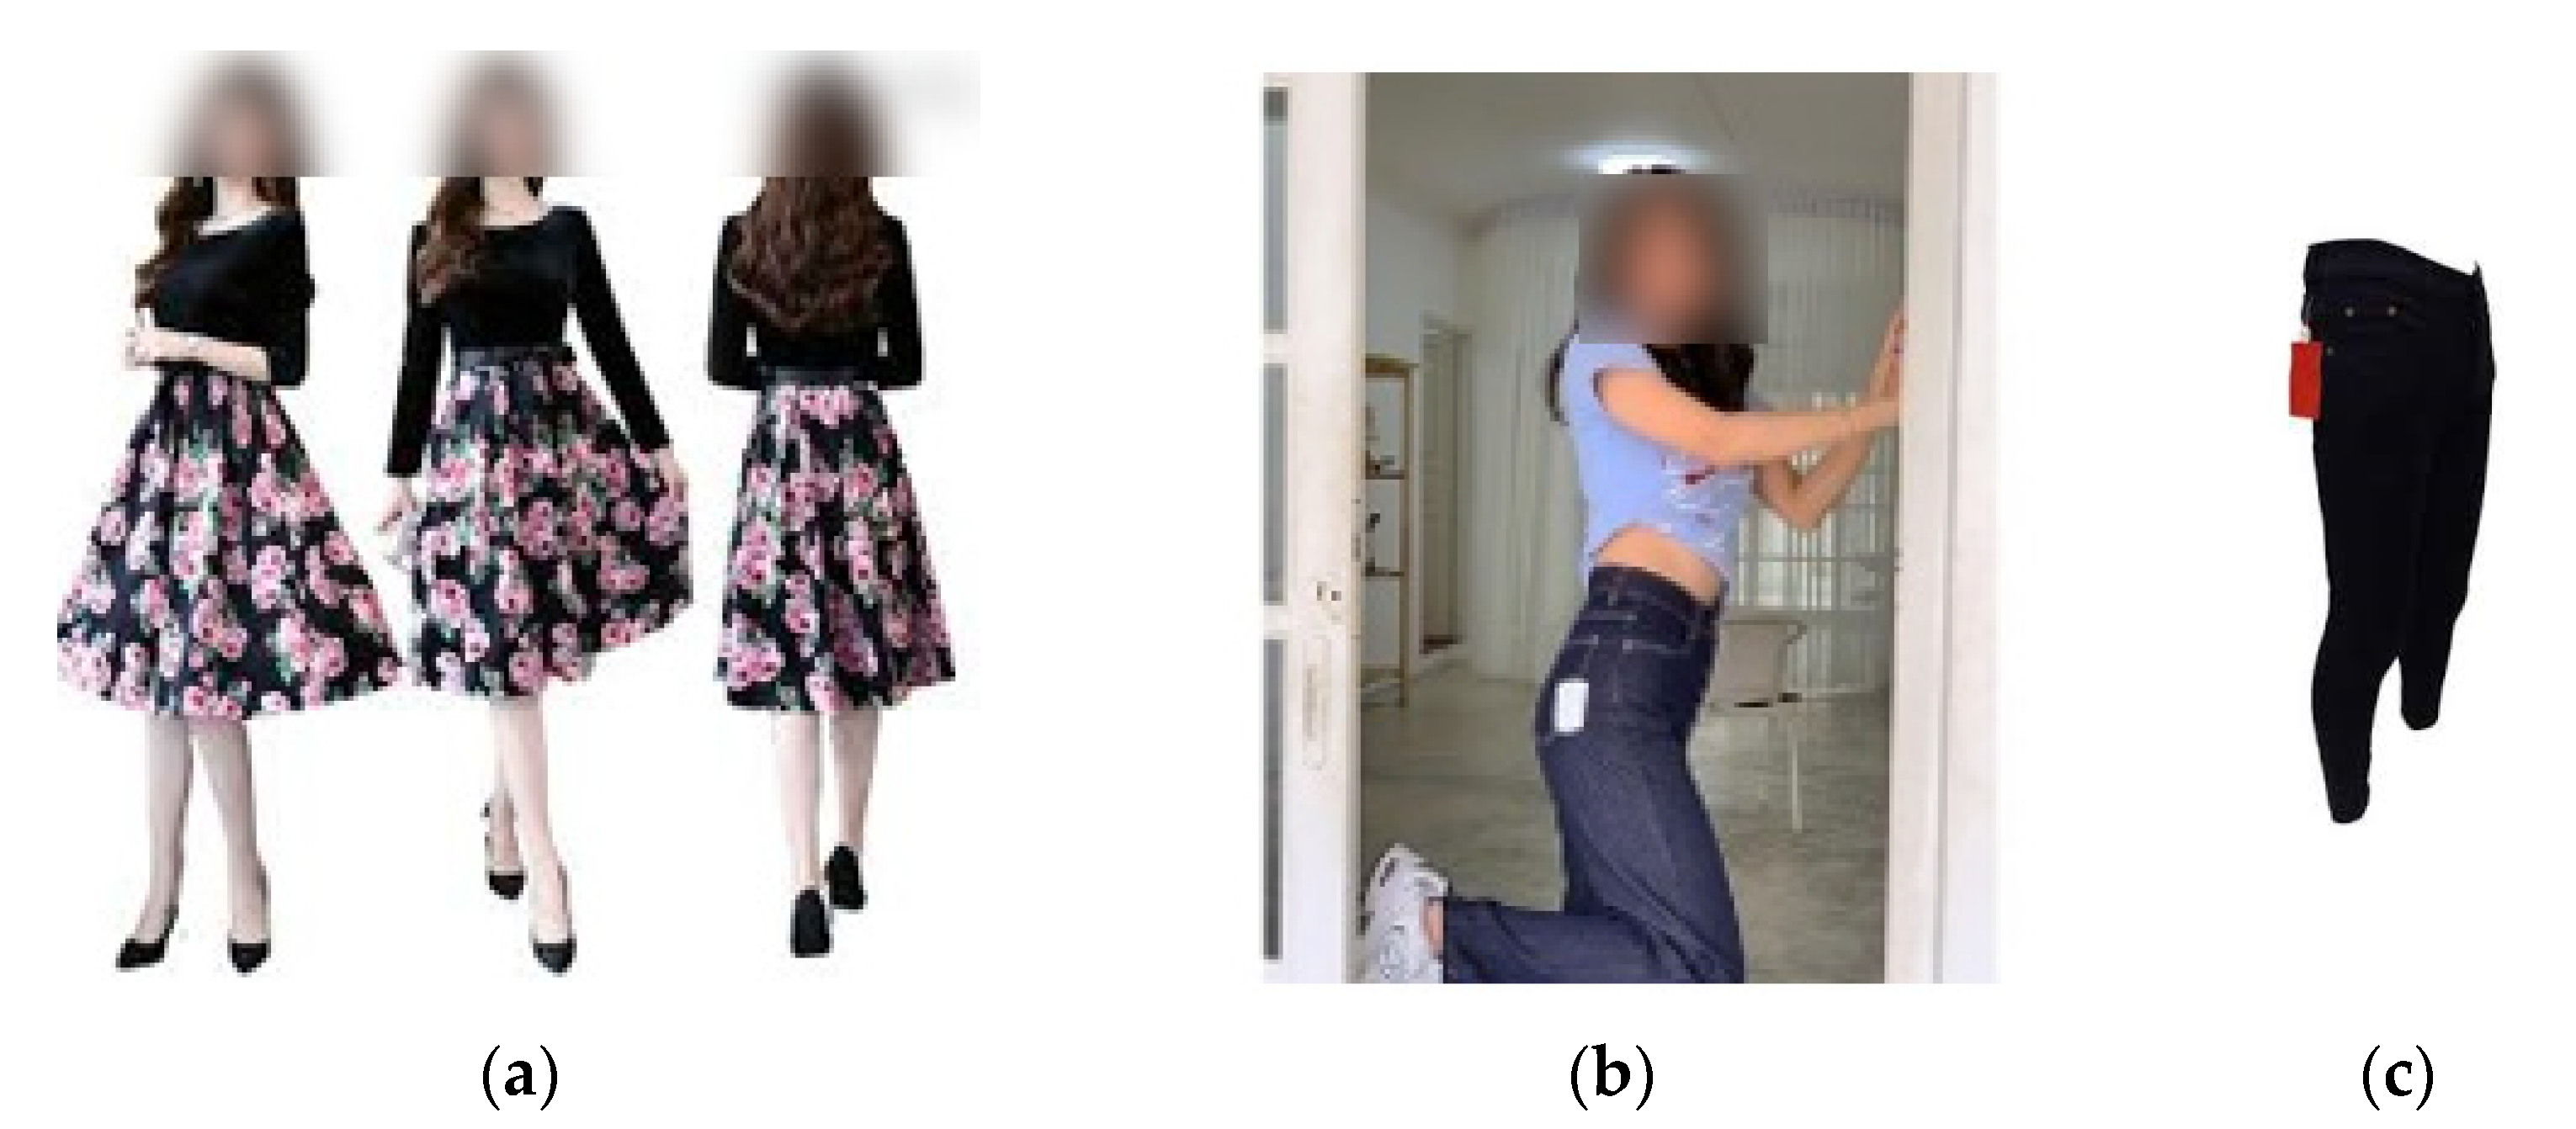
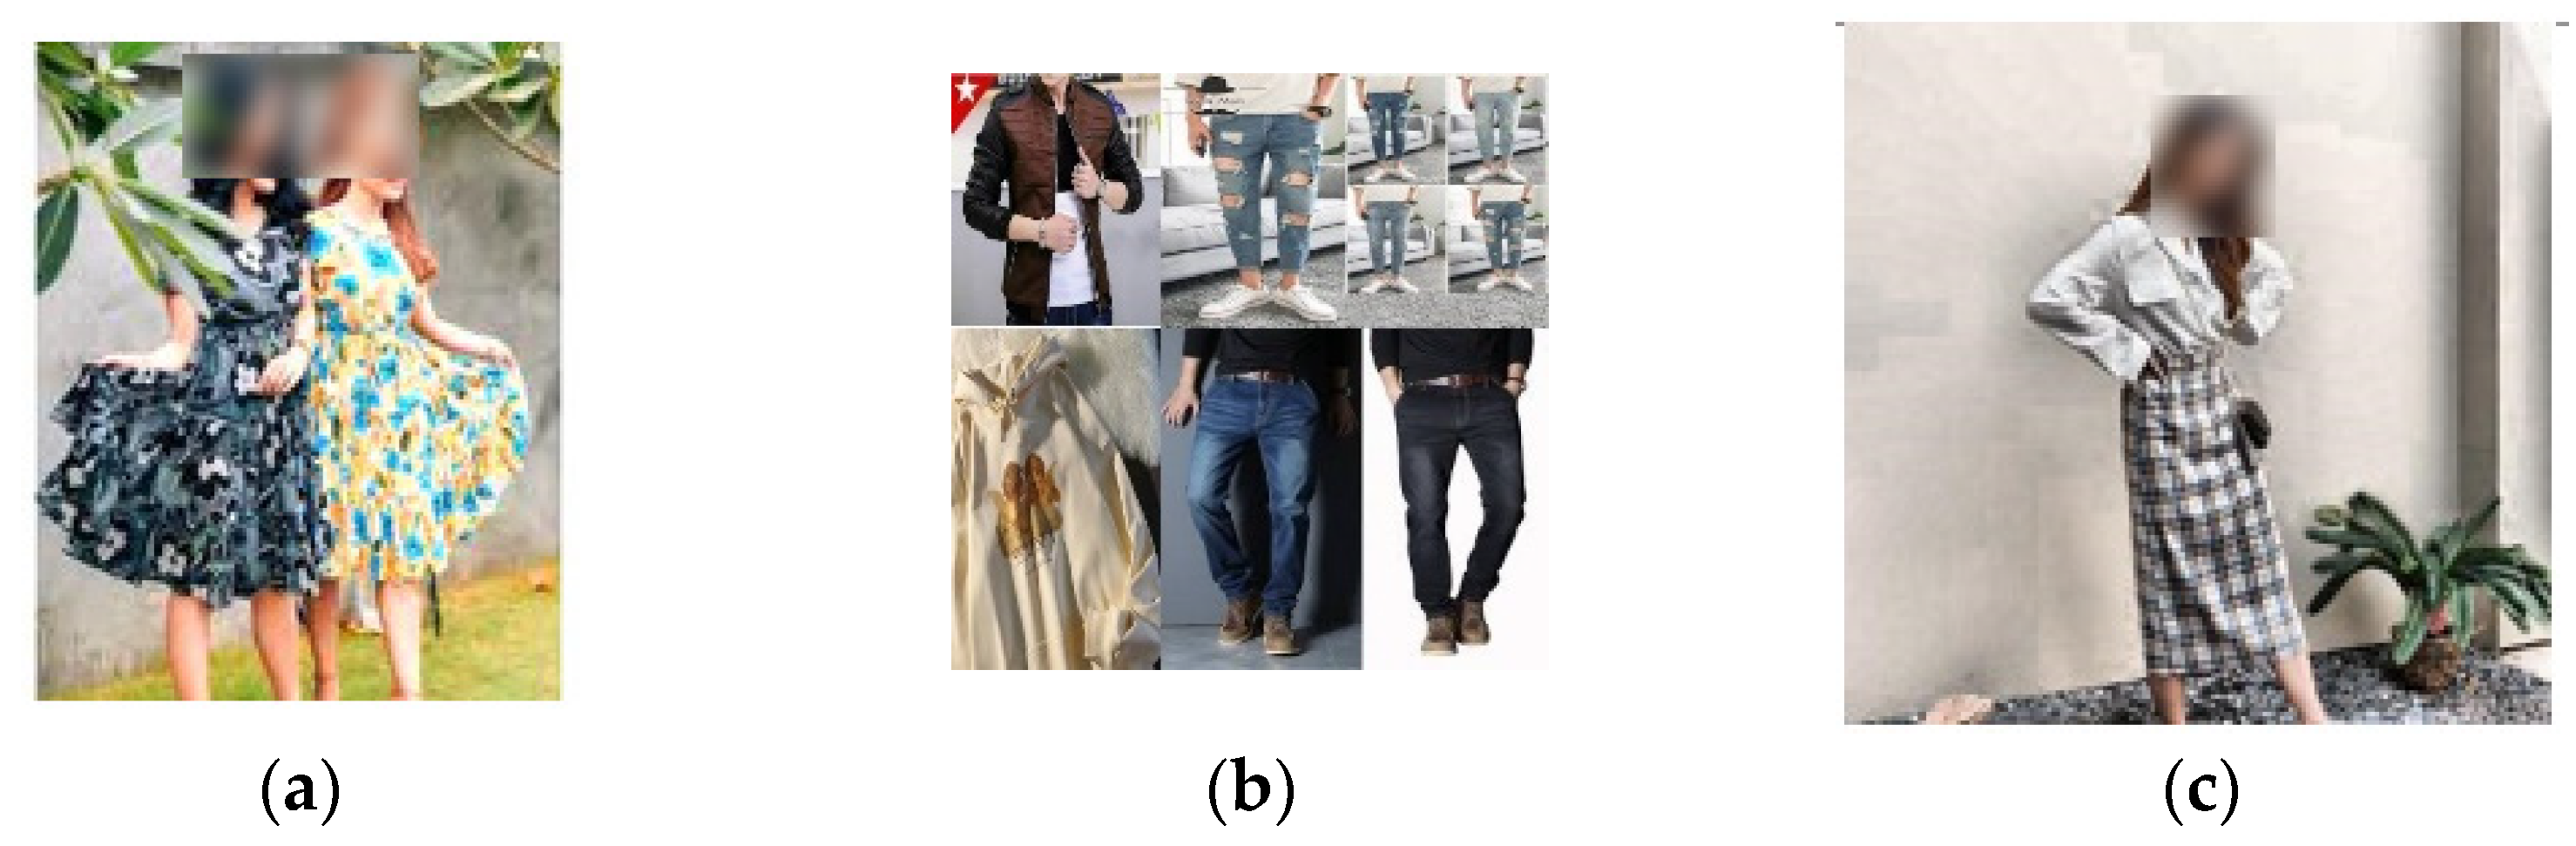
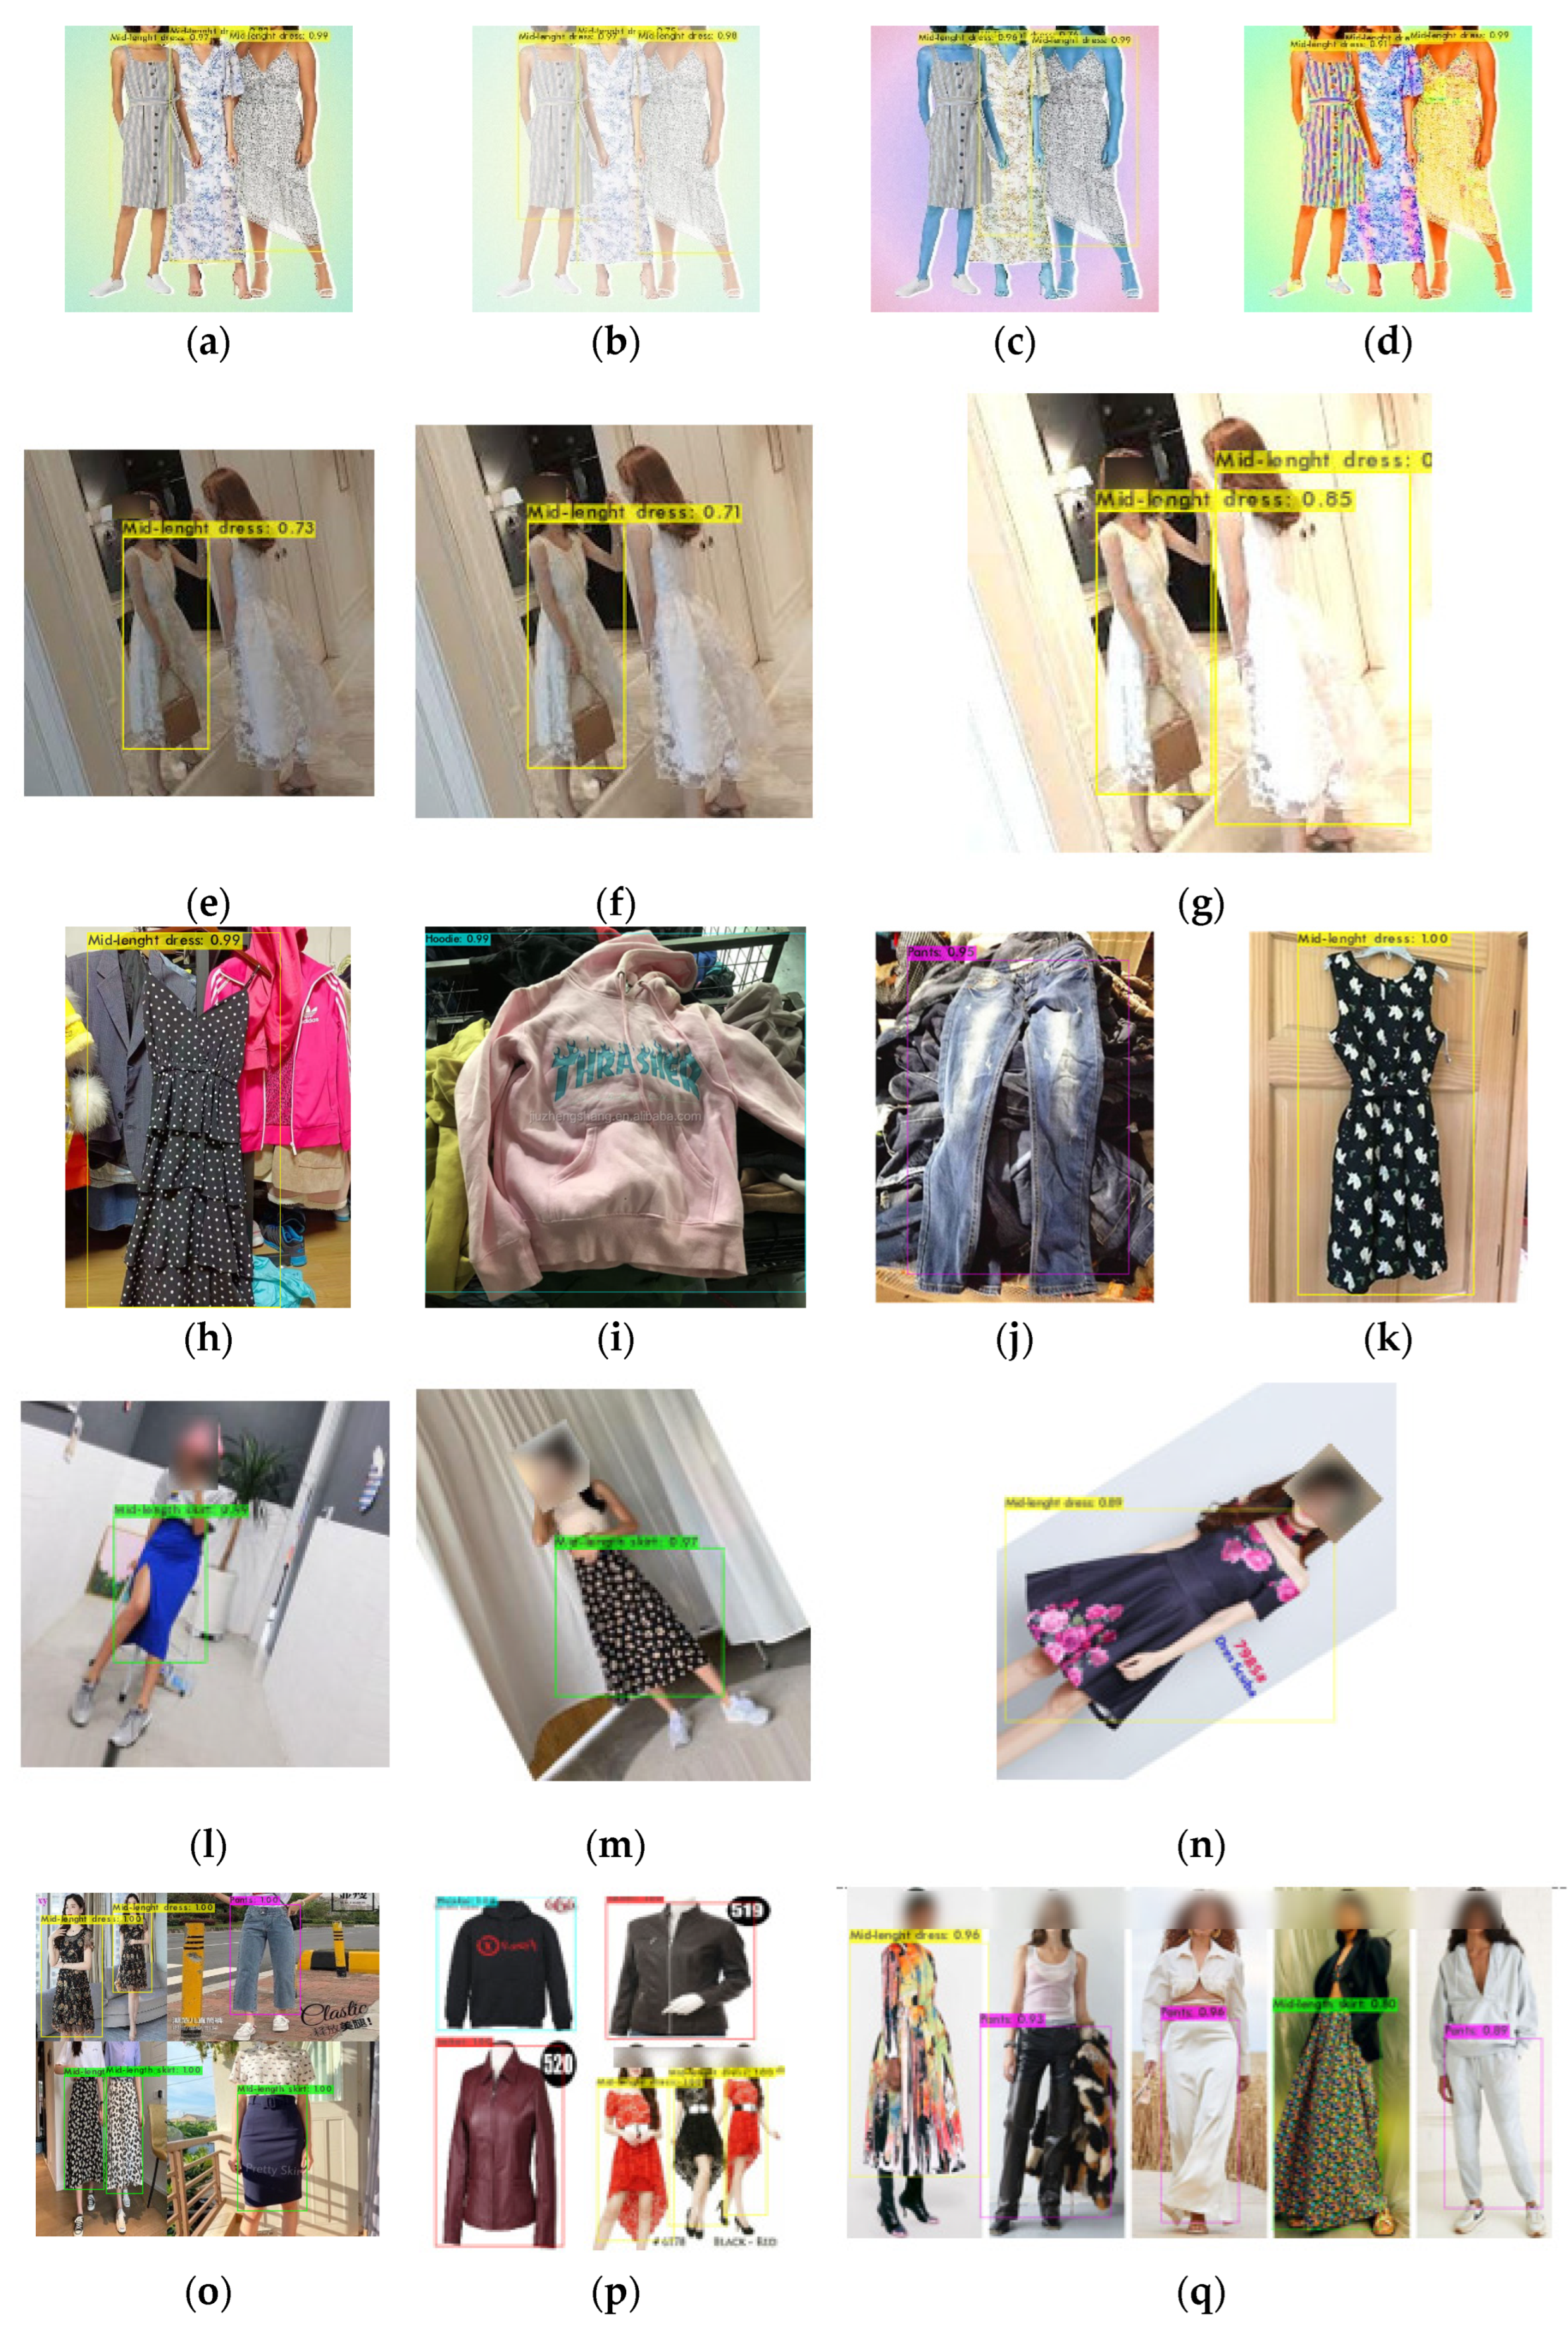
  • As depicted in Figure 1a, depending on the point of view, the same clothes can be considered in different categories (e.g., skirt or dress category), and different clothing can be considered in the same category.
  • Figure 1b illustrates that the clothing form can be simply modified by stretching, folding, hanging, and changing the model position.
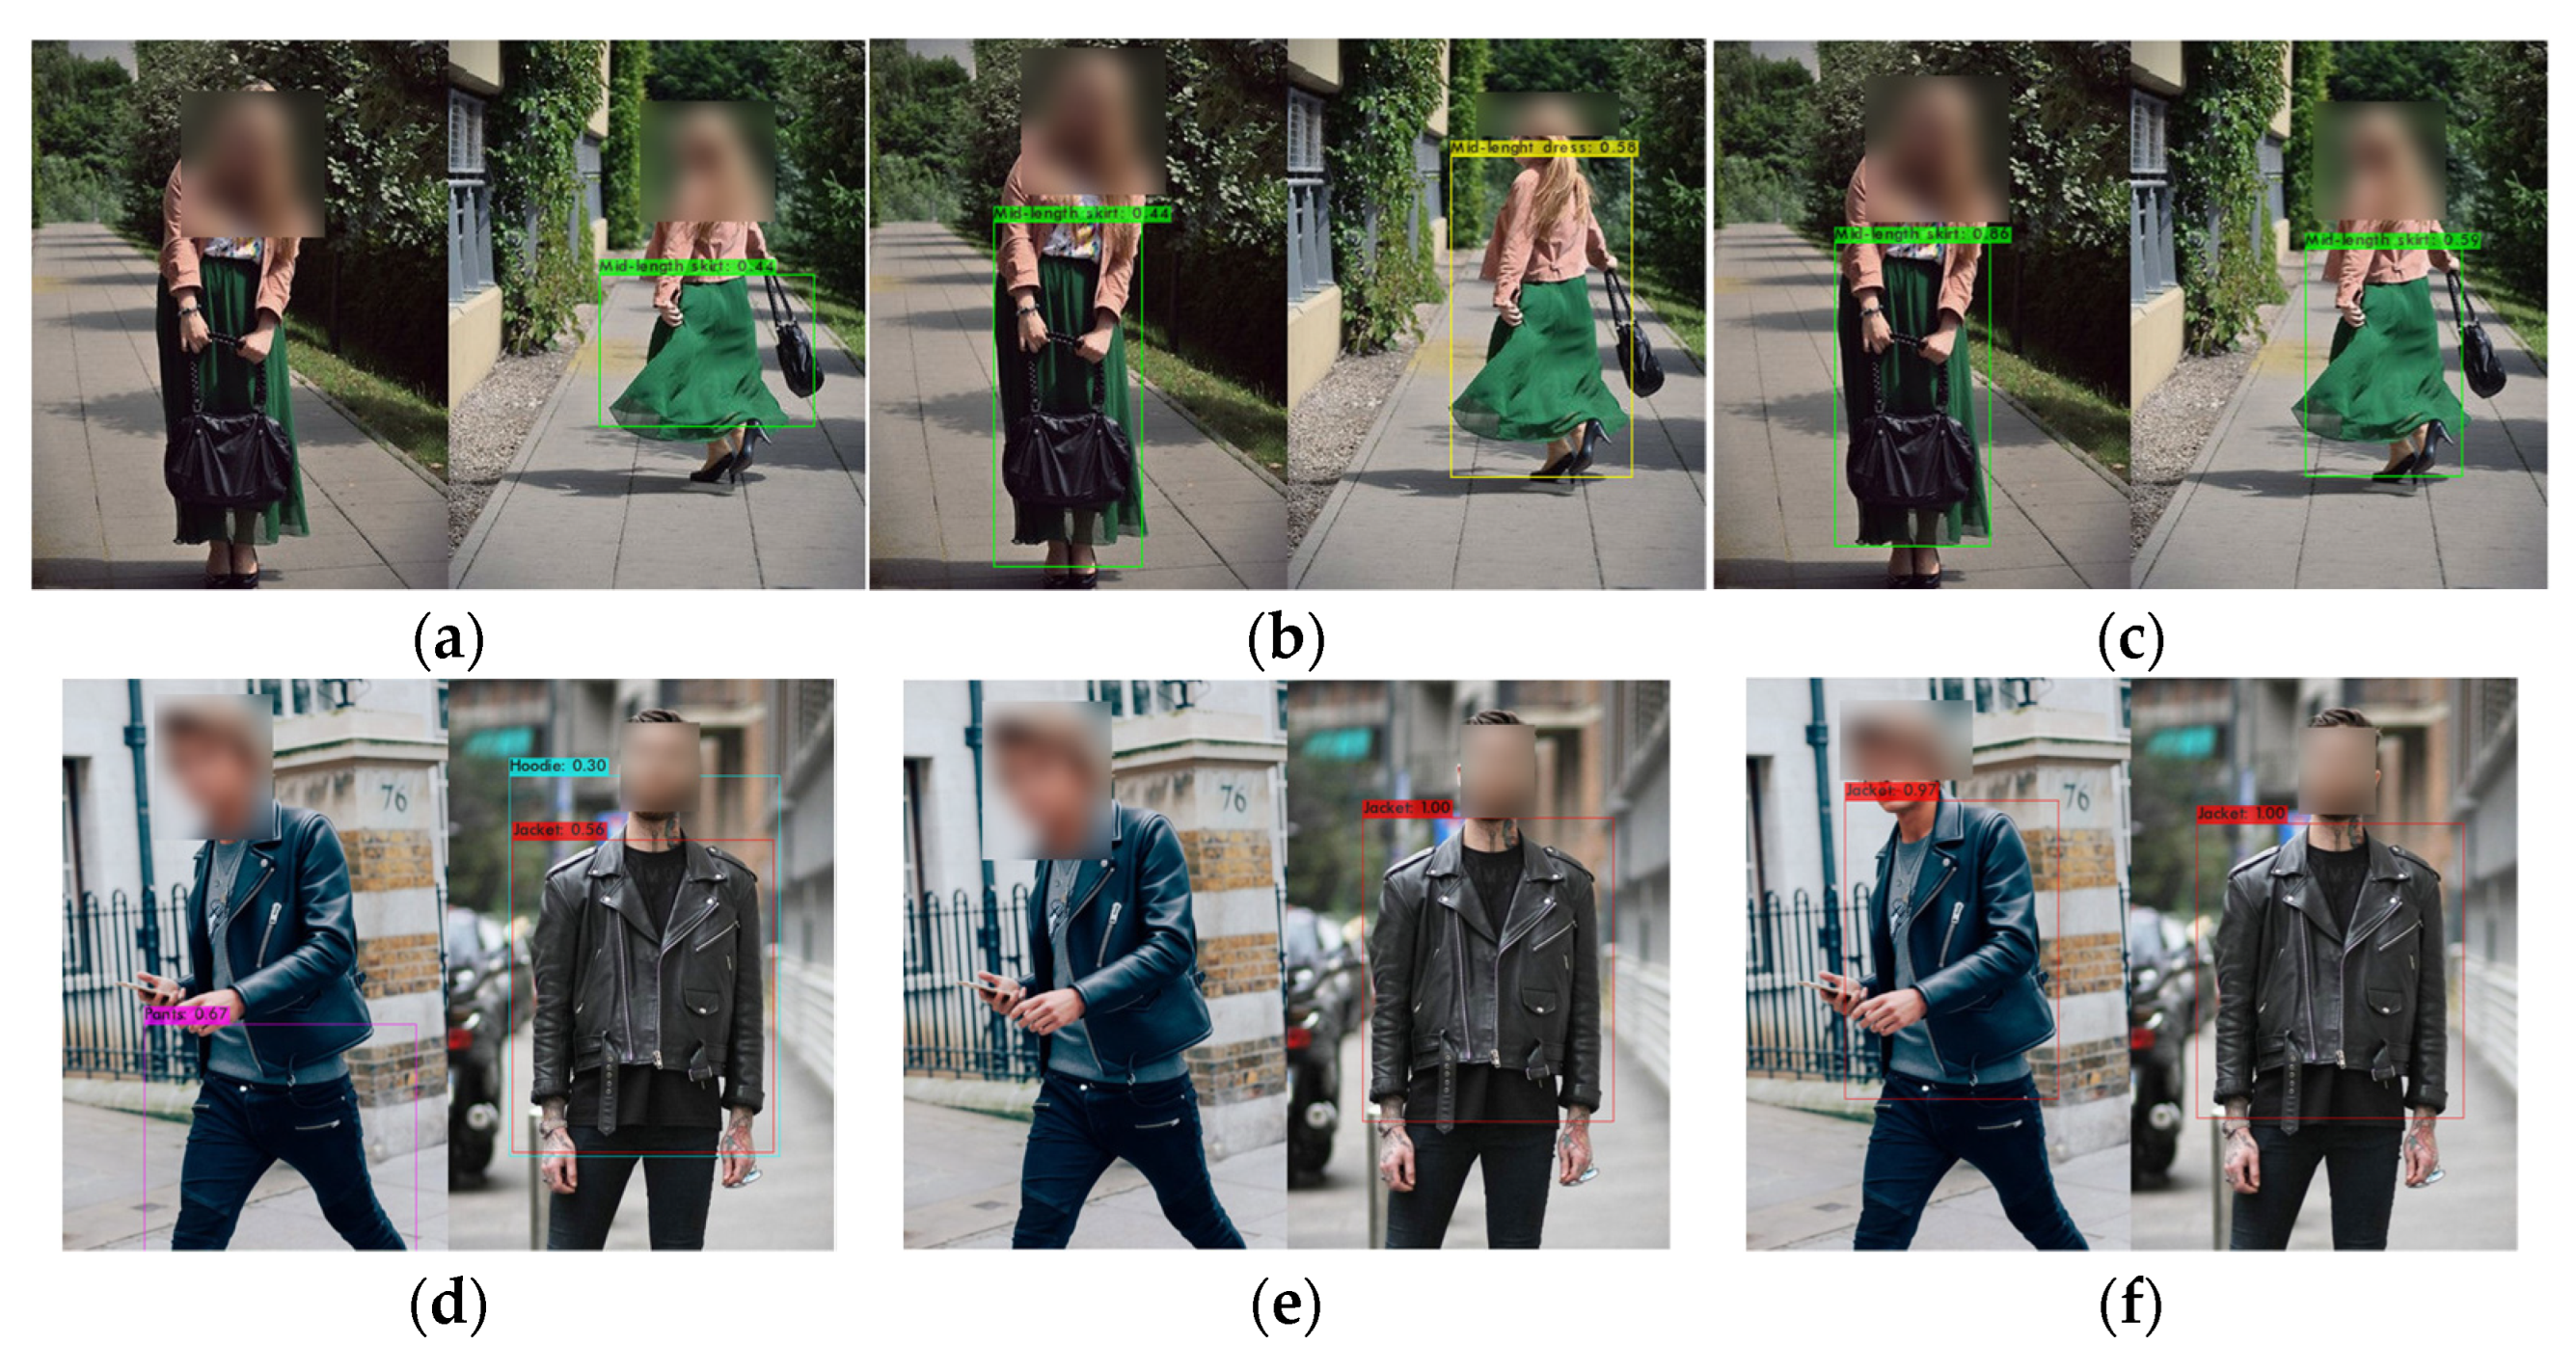
  • As demonstrated in Figure 1c, the same category can look different due to varying perspectives and illumination, cluttered backdrops, and being partially obscured by other things or people.
Figure 1. Visualization of the fashion categories. (a) different point of view image; (b) different photo model position image; (c) different perspectives and illumination image.
Applsci 12 08068 g001
Based on these problems, we require the product dataset directly collected from the multiple sellers on E-commerce platforms to aid in fashion category detection. From 2012 to 2020, there are 51 datasets in the fashion business, according to the study [68]. Datasets for clothes Parsing, clothing landmark identification, product retrieval, clothing generation, clothing recommendation, and fashion classification are covered. Only two datasets were developed for fashion categorization, according to the research [68]: Fashion MNIST [69], which originates from the shopping website named Zalando, and CBL [70], which was created from 25 clothing brands, and the other datasets used for object detection task are [9,71,72,73,74,75]. There are not many fashion classification datasets developed, particularly those gathered from E-commerce shopping platforms.
In this study, we proposed data acquired from Shopee E-commerce Thailand between October and December 2021. Researchers gathered information from E-commerce platforms for research purposes [76,77,78,79,80]. Shopee also provides data with the Shopee Open Platform [81] for developers to create Partner Apps that expand vendors’ businesses. We also utilized image data from the Shopee Thailand website for research purposes, as we also like to train our model using the most recent seller’s product style. The images of this study were collected using Shopee Data Scraper, a tool for extracting product data from the Shopee website. A total of 663 photos of products were obtained from the website as dataset A after deleting unnecessary images. We gathered images in various resolutions, with and without background noise, and images captured by vendors. On the other hand, we gathered E-commerce photos from Google images according to our categories, and 3453 pictures were gathered as part of dataset B. The images in Datasets A and B range in aspect ratio from 225*225 pixels to 800*800 pixels, and we aggregated the two datasets as Shopee Image Dataset (Thailand) [82]. Our dataset is published to the IEEE Data Port with the required annotation bounding box result files and picture data for usage by other researchers. Figure 2 depicts illustrations from the Shopee Image Dataset. Before training the model, annotating the training datasets with the YOLO format in the data pre-processing step is essential.
The process of labeling photos in a dataset in terms of training a machine learning model is called image annotation. Labeling pictures is critical as it informs the training model about the objects that must be detected. Our study accomplished this task using the LabelImg [83] tool. LabelImg is a free and open-source program for annotating graphical images. It creates bounding box annotations in the PASCAL VOC format. Additionally, it supports the YOLO and CreateML formats. Each XML file specifies the item’s class, coordinates, height, and breadth. Equation (1) illustrates how to annotate our image. L is a collection of the image’s bounding boxes; Bi is the bounding box for the ith object. When two items of clothing overlap in an image, we only draw the overlapping object if it comprises less than 50 percent of the other image, as shown in Figure 3a,c. We annotated photos with a single bounding box and images with multiple bounding boxes that had multiple categories, as shown in Figure 3b (Hoodies and Pant). Afterward, it allows the model to differentiate those things into new or never-seen-before objects.
L = {   L B 1 ,   L B 2 ,   ,   L B i } ,   B i B i + 1 < 0.5
In this research, when we choose a category, we select two categories that best match each pattern. Pant, dress, skirt, hoodie, and jacket are included. When gathering photographs, we collected various types of images uploaded by vendors in order from the website’s list. Typically, when sellers submit a product, they include a single design as well as variations of the product in the photograph. The number of photographs in each category is determined by the number of bounding boxes for each category within an image. Table 1 displays the number of photos and bounding boxes within each category for the total of Dataset A and Dataset B. The collected image collection includes a maximum of 14 bounding boxes per image, according to Table 2.
Each category contains a variety of designs, colors, and patterns. Figure 4 represents the visualization of the distribution of our obtained dataset. Our collection includes product photographs with indoor, outdoor, solid, and other backgrounds. We collected photographs from many perspectives, including back, front, side, and others. Some models are photographed while standing, while others are photographed while sitting and promoting the product. There are also products with hanging styles, especially in the Hoodie category. Due to the fact that it is a garment, we have collected product images with various colors, lengths, and patterns. Because the majority of products are advertised with models, the models’ accessories and hand positions cover a portion of the product. Lower-body garments, such as pants and skirts, are sometimes obscured by upper-body garments, resulting in partial occlusion. Depending on the model’s posture, particular pants have similar patterns to skirts. Therefore, it would be more difficult to distinguish types of clothing from others.

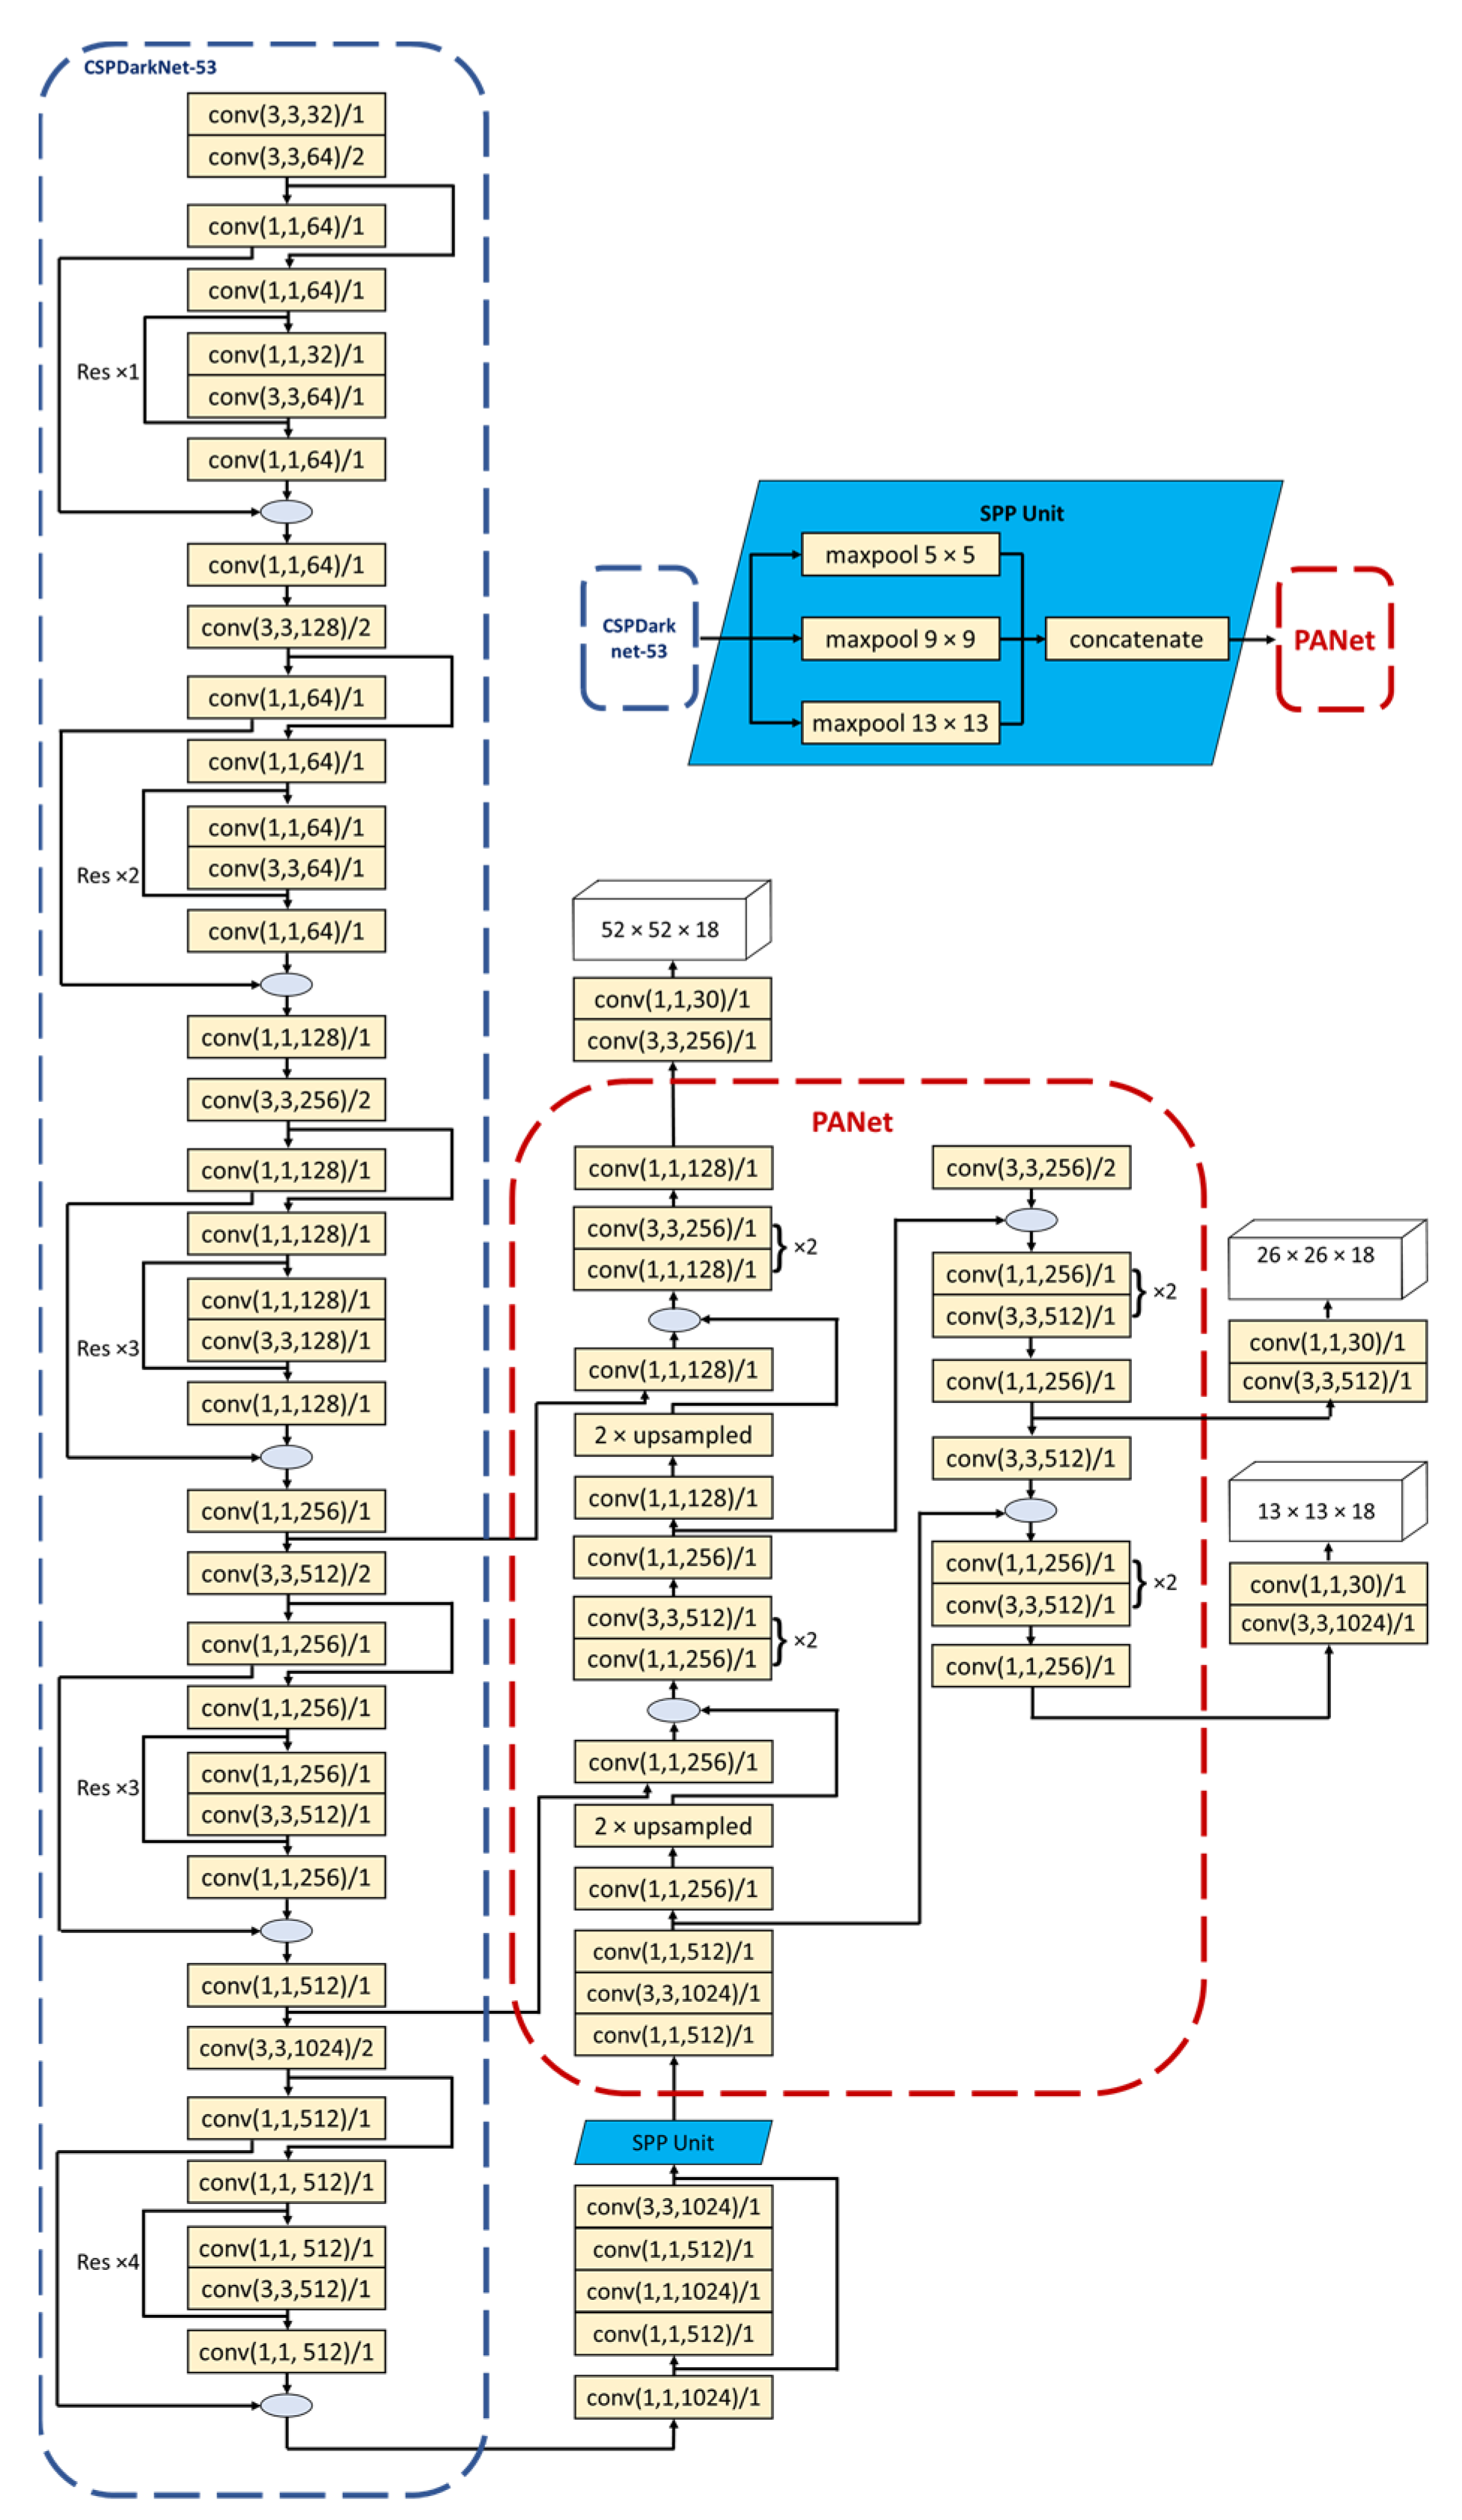
3.2. Traditional YOLOv4 Architecture

The following section describes the architecture of the traditional YOLOv4. YOLOv4, which Alexey Bochkovskiy and the other researchers introduced, integrates the most powerful optimization approaches in the CNN domain in recent years with the traditional YOLO series. It compromises detection speed and precision, which is noticeably better than YOLOv3. Three network components comprise the traditional YOLOv4 model: backbone, neck, and head. The “backbone” network component, which performs the role of a feature extractor, consists of an activation function, a standardization layer, and a convolutional layer. VGG16 [84], ResNet-50 [85], EfficientNet [86], CSPREsNeXt50 [87], and CSPDarknet53 [87] are currently more popular backbone detectors. We used CSPDarknet53 for our approach because it provided a greater frame rate than the others. It greatly expands the receptive field, isolates the most important context characteristics, and results in nearly no reduction in network operating speed [65]. CSPDarknet53 is composed of 29 convolutional layers, a 725 × 725 receptive field, and 26.6 M parameters.
The “neck” of the object detector is used to gather feature maps between the backbone and the head. After the CSPDarknet53, we add Spatial Pyramid Pooling or SPP [88] blocks to enhance the receptive field. It isolates the most critical context characteristics and has a negligible impact on network performance. The pooling cores have a diameter of 5 × 5, 9 × 9, and 13 × 13, respectively. We use Path Aggregation Networks or PANet [89] to aggregate parameters from various backbone levels for various detector levels. In the initial version of PANet, the current layer’s information is combined with that of a previous layer to create a new vector. In YoloV4 implementation, the input vector and the vector from the preceding layer are combined to form a new vector.
The “head” of a single-stage object detector is utilized for prediction. According to the output data, the bounding box and its confidence for the identified category can be established. Using anchor boxes, it generates output vectors with class probabilities, objectness scores, and bounding boxes. It runs seven anchors since it is a single-stage detector without an area proposal module. A single-stage object detector is quicker but has inferior performance compared to a two-stage detector.

3.3. Modified Part of Proposed FC-YOLOv4 Architecture

In traditional YOLOv4, three layers are selected from the output of the backbone network. After passing through three convolutional layers, the input is routed via an SPP network for pooling, as shown in Figure 5a. Pooling layers enable the downsampling of feature maps by enumerating the features present in patches of the feature map. The design objective of our suggested solution is to improve the output characteristics of backbone networks. The higher the risk of overfitting as well as the error rate, the deeper its backbone layer. As a result, we performed research to improve both the quality of the shown feature map and the model’s detection, as seen in Figure 5b. The architecture of such a Neck network can achieve specific, highly desirable properties. Figure 6 represents the overall network architecture of our proposed FC-YOLOv4 model.
Selecting the appropriate activation function is also critical for optimizing YOLOv4 detection accuracy. Activation functions are non-linear point-wise functions that introduce nonlinearity into the linear transformed input at the layer between the backbone and the head of a neural network. We also need to employ the optimal activation function in our FC-YOLOv4 to address computer vision issues such as object identification, segmentation, and classification. The major purpose of the activation function is to determine the nonlinear relationship between both the input and output variables to solve complex problems. We used the Mish activation function instead of ReLU in our study because it significantly improves the deeper network of the model. The LeakyRelu activation function remains throughout the rest of the network. Mish and LeakyRelu activation functions can be expressed as follows.
y m i s h = x   tan h ( ln ( 1 + e x )
y L e a k y   R e l u = { x ,     i f   x   0 λ x ,     i f   x < 0
We employed max-pooling in SPP Block, a pooling process determining the maximum, or most significant, value in each patch of each feature map. We expanded the convolutional layer and executed the procedure first on the middle two feature layers. The PANet was chosen for our model because of its ability to reliably store spatial information, which aids in properly locating pixels for mask creation. This procedure significantly expands the effective receptive field. We used class label smoothing to transform soft labels during training, increasing the model’s robustness. Regarding the bounding box regression loss function, we use the Complete-IoU [90] function because it results in a faster convergence rate and superior performance than the alternatives. CIoU loss is only effective when the anticipated bounding box overlaps with the target bounding box.

3.4. Experimental Setup and Procedure Description

Incomplete learning trains model parameters using partial points, and prediction accuracy are significantly worse than fully supervised learning. This is because a small number of labeled points cannot sufficiently describe the general distribution of the data. As a result, employing more training data can result in more accurate predictions. As a semisupervised learning approach, pseudo-labels may successfully utilize unlabeled data.
As shown in Figure 7, data collection is the first step in this study. The traditional YOLOv4 model is developed by manually labeling and training Dataset A, which is collected from Shopee Data. Testing is carried out on dataset B, which has not been labeled, using this model. The format conversion to the YOLO format is then performed based on the findings of the label prediction.
After labeling the image collection, it is necessary to feed the annotated data into the YOLOv4 model. The quantity of the training dataset is a critical aspect to consider when assessing the accuracy of the object recognition model. Even though several datasets are available, we cannot always train using them. Additionally, the data annotation process is manual, which explains why labeling a huge dataset takes so long. Pseudo-Labelling is one of the most effective methods for resolving this issue. Three types of learning exist; supervised, unsupervised, and semi-supervised. While supervised learning is the process of generating a model from labeled data, unsupervised learning is developing a model from unlabeled data. Semi-supervised learning is a strategy that entails training the model on a small set of labeled data and then predicting on a large set of unlabeled data. Pseudo-Labelling is semi-supervised learning.
In our research, we will also propose a Fashion category detector trained on our small dataset to identify categories with similar patterns. We utilized Google Colab Notebook Pro Version for this investigation, and our model was trained and validated on an NVIDIA-SMI 495.46 Telsa P100-PCIE server running NVIDIA Driver 460.32.03 and CUDA 11.2. We employed our YOLOv4 model with the CSPDarknet53. The parameters used to initialize the network are listed in Table 3. To improve the model’s detection accuracy and alter the input required by the Darknet framework, we utilized the size of the input images in our research to 416 × 416. To evaluate the training procedure, the batch size was set to 64, capturing 64 images every iteration for 8000 and 9000 training steps. Momentum, initial learning rate, weight decay regularization, and other parameters were the original parameters of the YOLOv4 model. We set the maximum batch size to 10,000 (the number of classes multiplied by 2000) and increase it in 80 and 90 percent increments. We apply filters based on the (number of classes + 5) * 3 formula. It will process 64 images every iteration during training and simultaneously transmit 24 subdivisions to the GPU.
YOLOv4 predicted the objects in the image using the detection output format, as shown in Figure 8. Therefore, it must be converted to YOLOv4 format. We captured the detection result in the (.txt) format with the same filename as the image after training with dataset A using YOLOv4. Figure 9a represents the detection result of the YOLOv4 model after training. When forecasting, the YOLO model specifies the top left corner coordinates, followed by the width (w) and height (h) of the enclosing box (h). The width and height of the original image are denoted by (W) and (H), respectively. This result will be the input for Figure 9b.
x ^ = l e f t _ x + w 2 W
y ^ = t o p _ y + h 2 W
W ^ = w W
H ^ = h H
Figure 9b is the YOLO format for retraining the model. The center point of the image is represented by x ^ , which is obtained from calculating Formulas (4) and (5). While the size of the image is represented by W ^ and H ^ as the width and height of the retrained results, which are obtained from Formulas (6) and (7). Furthermore, the results of this retraining will be the input for drawing the bounding box in Figure 9c. The estimated bounding box values must be computed in YOLO format according to the draw bounding box Equations (8)–(11), where, respectively, l , r , t , and b are the left, right, top, and bottom sides of the box.
l = ( x W ^ 2 ) * W
r = ( x + W ^ 2 ) * W
t = ( y H ^ 2 ) * H
b = ( y + H ^ 2 ) * H
Algorithm 1 is the pseudocode of pseudo-labeling to change from detection output to YOLO format. We define “classes” as an array of category lists for “pants,” “midlength dress,” “hoodie,” “jacket,” and “mid-length skirt.” After saving the result, we deleted some lines we did not need to calculate. B is an array of the total number of bounding boxes from the text file because some images have many categories to detect. For every bounding box, we put the values of the predicted class of B[i] to the “idx.” “left_x” is for the values of the left_x of B in the ith Bounding box, and top_y is for the values of top_y in ith Bounding Box. w and h are the width and height values of the bounding box in ith iterations shown in Algorithm 1. After that, we identify the actual value of the class that the LabelImg tool already defined by comparing the “classes” array. Furthermore, the conversion process from the detection output format into the YOLOV4 format begins by performing calculations to get the value of x ^ , y ^ , W ^ , and H ^ . These values are then executed using the boundingBoxYOLO function, which is concatenated with a, x ^ , y ^ , W ^ , and H ^ .
Algorithm 1 The pseudocode of pseudo-labeling to change from detection output format to YOLO format
Input: the image and its corresponding text File
Output: the text file with YOLO bounding box format
Procedure:
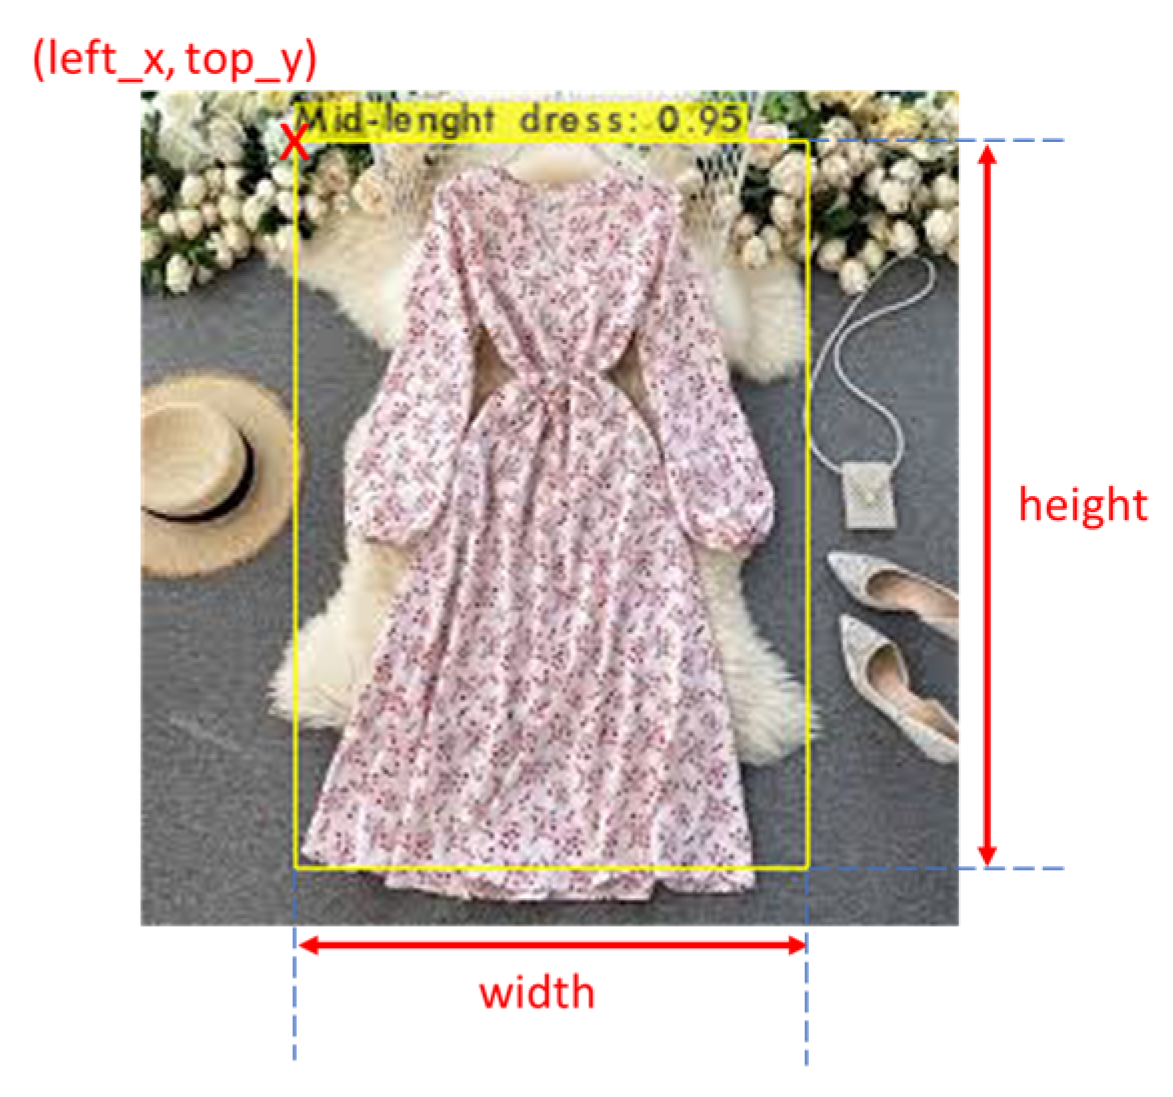
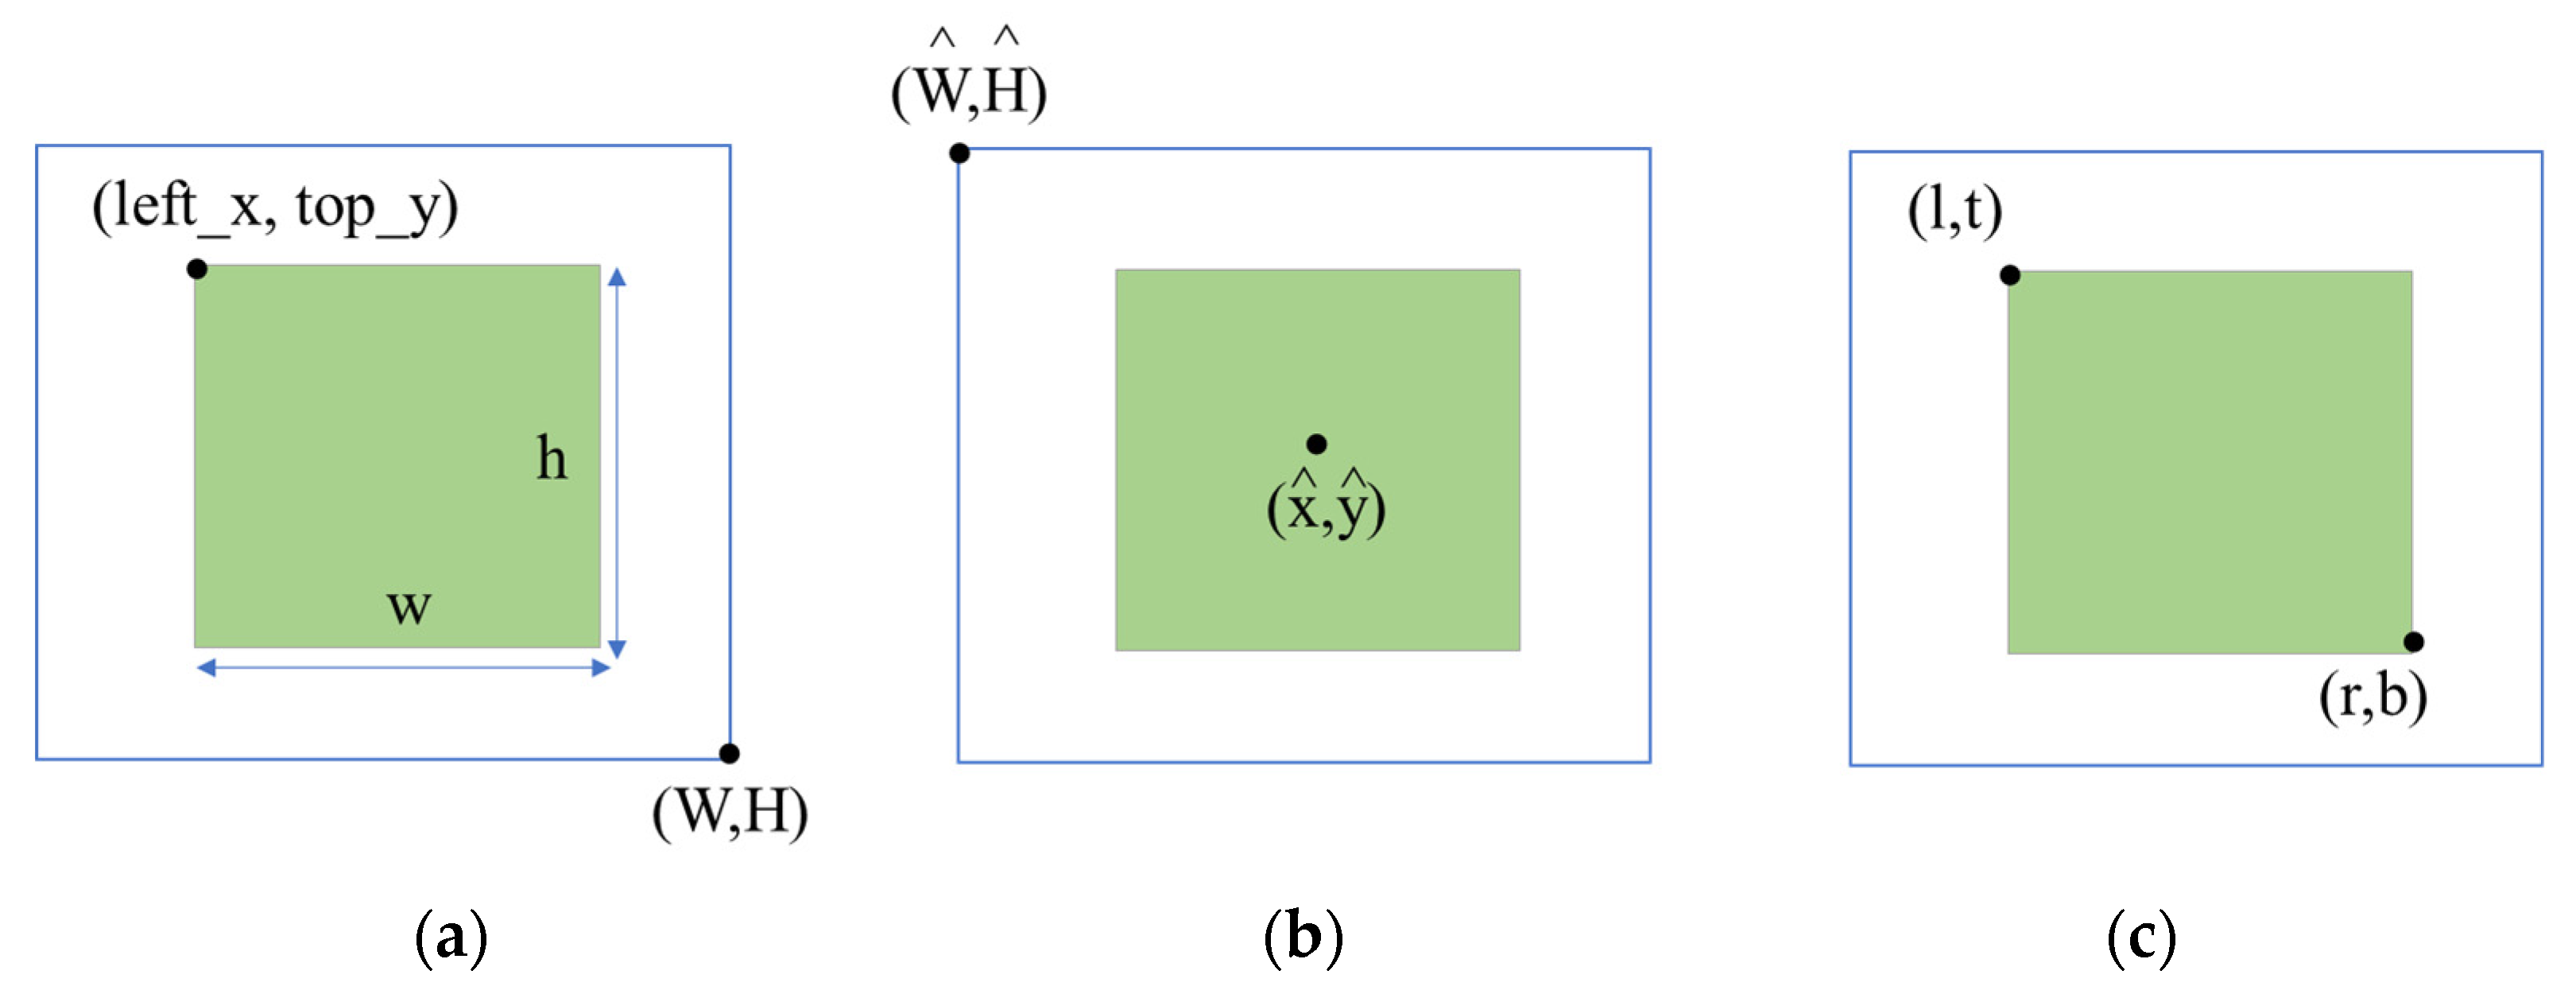
 1.  classes ← an array of categories list [’pants,’ ’mid-length dress,’ ’hoodie,’ ’jacket,’ ’mid-length skirt’]
 2.  H ← the height of the image
 3.  W ← the width of the image
 4.  read the text file
 5.  B ← an array of the total number of bounding box values from the text file
 6.  IF the length of B > 0:
 7.      FOR i = 0 to the length of B:
 8.         idx ← the value of the predicted classes of B[i]
 9.         left_x ← the value of the left_x of B[i]
 10.       top_y ← the value of the top_y of B[i]
 11.       w ← the value of the width of B[i]
 12.       h ← the value of the height of B[i]
 13.       a = the index of the idx value in classes []
 14.        x ^ = (left_x + w/2)/W
 15.        y ^ = (top_y + h/2)/H
 16.        W ^   = w / W
 17.        H ^ = h / H
 18.       boundingBoxYOLO ← concatenate ( a + "·" + x ^ + "" + y ^ + "·" + W ^ + "·" + H ^ )
 19.       write boundingBoxYOLO value in the text file
 20.  ENDIF
After the pseudo-labeling process, we annotated only 663 images and obtained a total of 3453 labeled images of Dataset A and Dataset B. We used image data augmentation techniques to obtain a larger image to improve the accuracy of the model. Only a few Shopee vendors photograph their products professionally in a studio. There is a risk, particularly for those who sell second-hand apparel, that the garments will be photographed with a cluttered background. As a result, it is critical to be able to add a variety of different sorts of objects to the training dataset to distinguish the categories clearly. To increase the richness of the experimental dataset, our images were pre-processed in terms of brightening, Mosaic, and Contrast Limited Adaptive Histogram Equalization (CLAHE), and the dataset was augmented.
We chose 0.6 and 1.4 as the lowest and maximum values for brightening the training photos. Three values were chosen from that collection, and three new photos with varying brightness levels were added to the training dataset. This method can imitate the state of clothing under various levels of illumination. Mosaic data augmentation was used to supplement the image collection further to augment the training images. Mosaic data augmentation combines four training photos in specific ratios to create a single image. This enables the model to acquire the ability to recognize items in a smaller size than usual. CLAHE is utilized as the final stage to increase the illumination of the garment pattern. Figure 10 shows the sample of training images after image augmentation. Table 4 represents the number of images generated by pseudo-labeling and image data augmentation. We labeled only 663 images, and 20,345 images were automatically labeled. The convention of our dataset naming is represented in Table 5. We trained our proposed FC-YOLOv4 model using obtained labeled images and assessed it by comparing the results to those obtained with YOLOv4 and YOLOv3.

4. Results and Discussion

The performance of the category detection model is compared to that of other approaches in this section. Meanwhile, the outcomes of fashion category prediction using YOLOv4 and YOLOv3 are compared and studied. The following indicators are used to assess the efficacy of neural network models: For binary classification issues, samples can be classified as true positive (TP), false positive (FP), true negative (TN), or false negative (FN) based on the model’s combined ground truth and predicted class. The detailed equations can be seen in (12) and (13).
P r e c i s i o n   ( P ) = T P T P + F P
R e c a l l   ( R ) = T P T P + F N

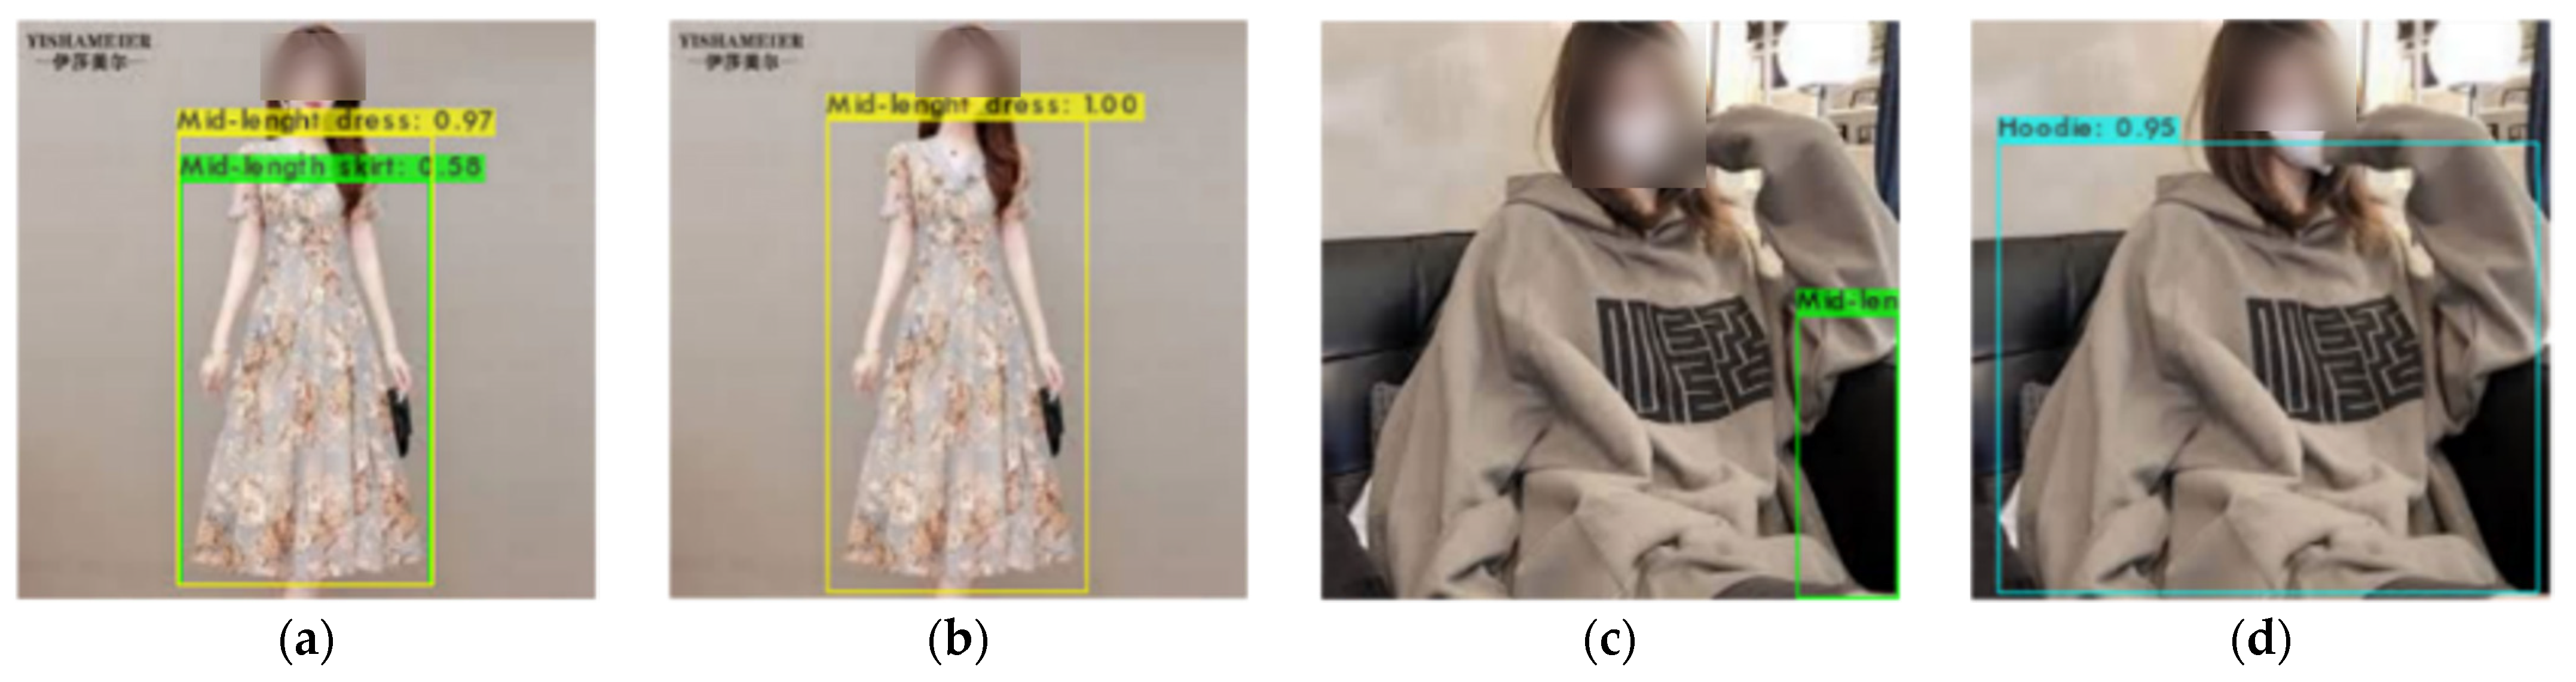
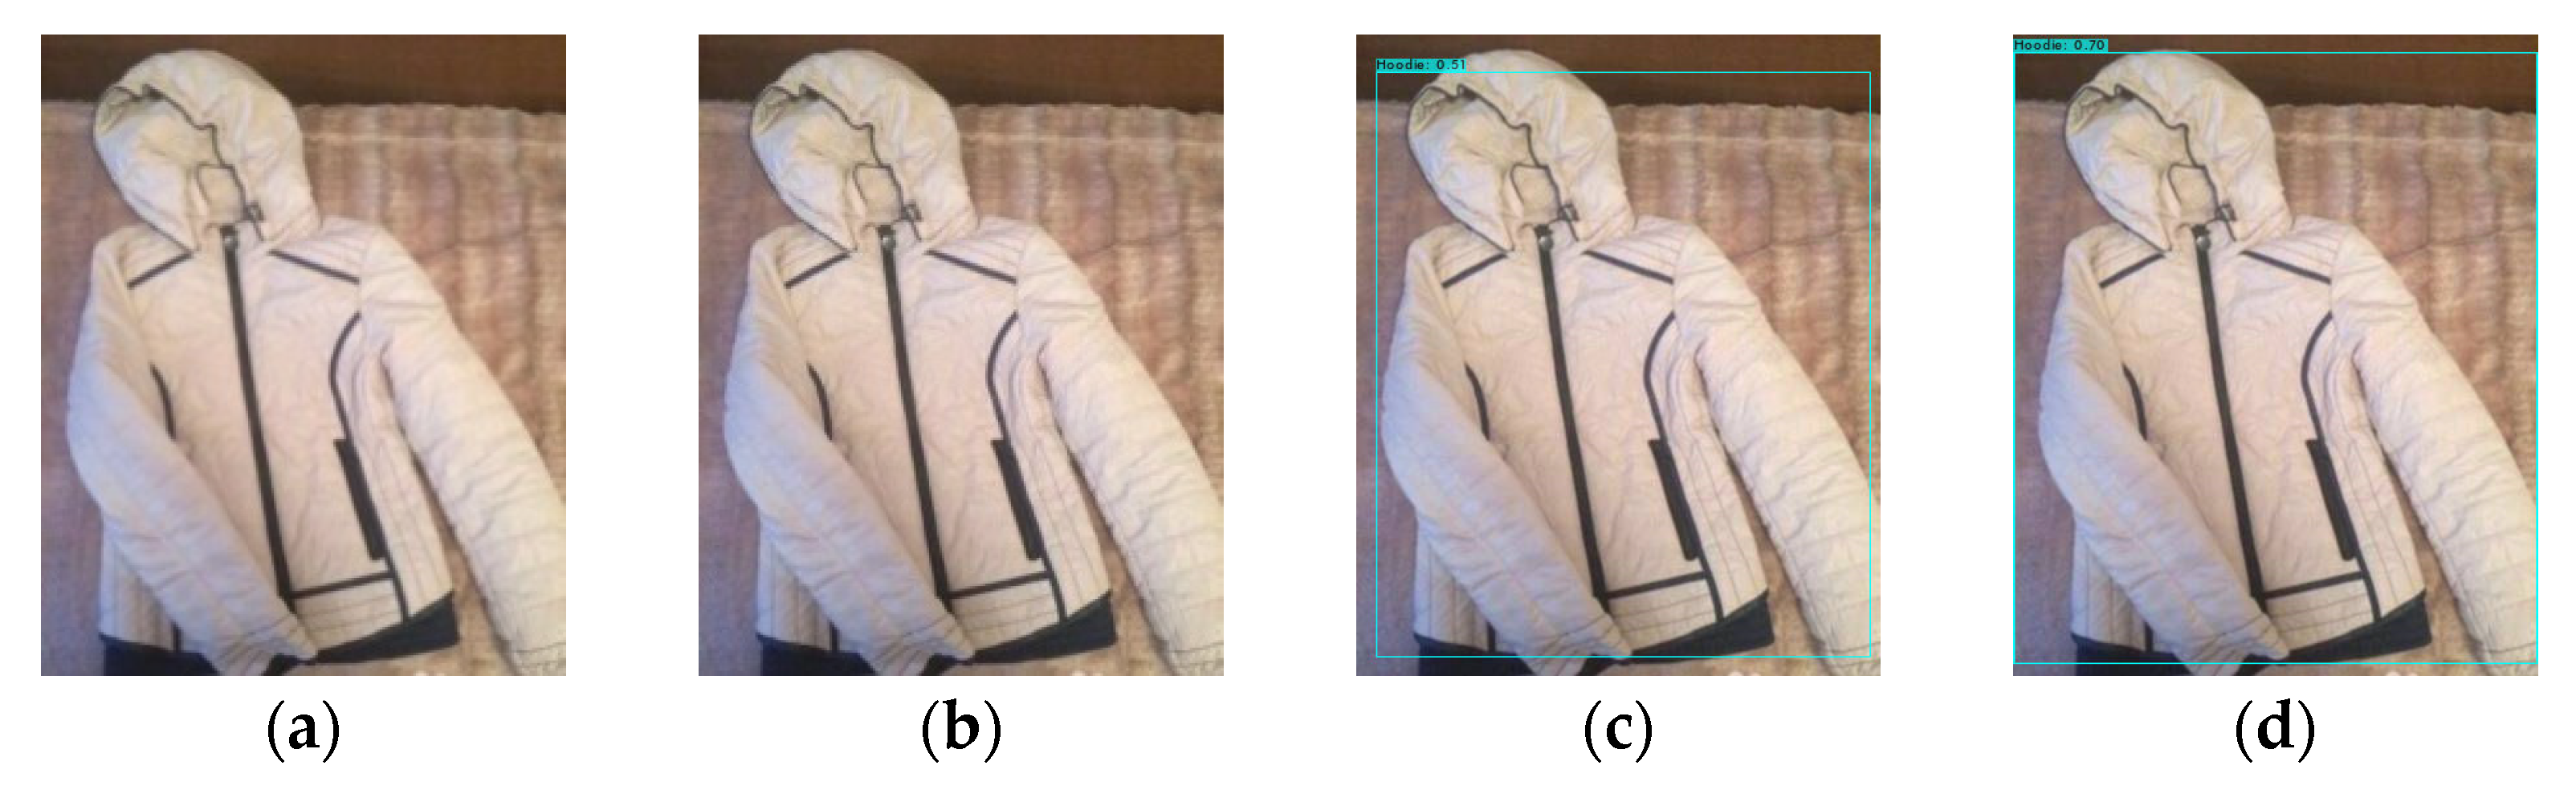
4.1. Comparison of before and after Pseudo-Labeling with YOLOv4

Ref. [91] studied that the performance of the models was considerably altered when alternate training and validation ratios were applied, demonstrating that a 70:30 ratio of training to testing datasets is optimal for the object detection model. Dataset A was partitioned into 90% for training and 10% for validation during the first training. After training, we predicted dataset B and converted the predicted output to YOLO format. Then, we mixed the labeled dataset A and predicted dataset B for the second training set, divided into 80 percent for the training set and 20 percent for the testing set, respectively.
To evaluate the influence of dataset size on detection outcomes, pictures from all categories were pooled before and after pseudo-labeling to train the model. We computed and assessed the performance of the model on dataset A, which includes Average Precision (AP), True Positive (TP), False Positive (FP), Recall, IOU, and Mean Average Precision (mAP). Table 6 shows the performance metrics before pseudo-labeling and after pseudo-labeling. In Class Mid-Length Dress, Hoodie, Jacket, and Mid-Length Skirt, there are considerable disparities in AP, TP, and FP results. Figure 11a,c are the detection results before pseudo-labeling and Figure 11b,d are the detection results after pseudo-labeling. Before pseudo-labeling, our model incorrectly predicted two identical categories in Figure 11a, but the bounding box could be predicted successfully. Even the bounding box in Figure 11c could not be adjusted appropriately. Following pseudo-labeling, the category and bounding box may be predicted precisely, as seen in Figure 11b,d. Overall, YOLOv4 has a good level of accuracy, with a 0.97 mAP after pseudo-labeling. This is because there are fewer datasets before and after pseudo-labeling.

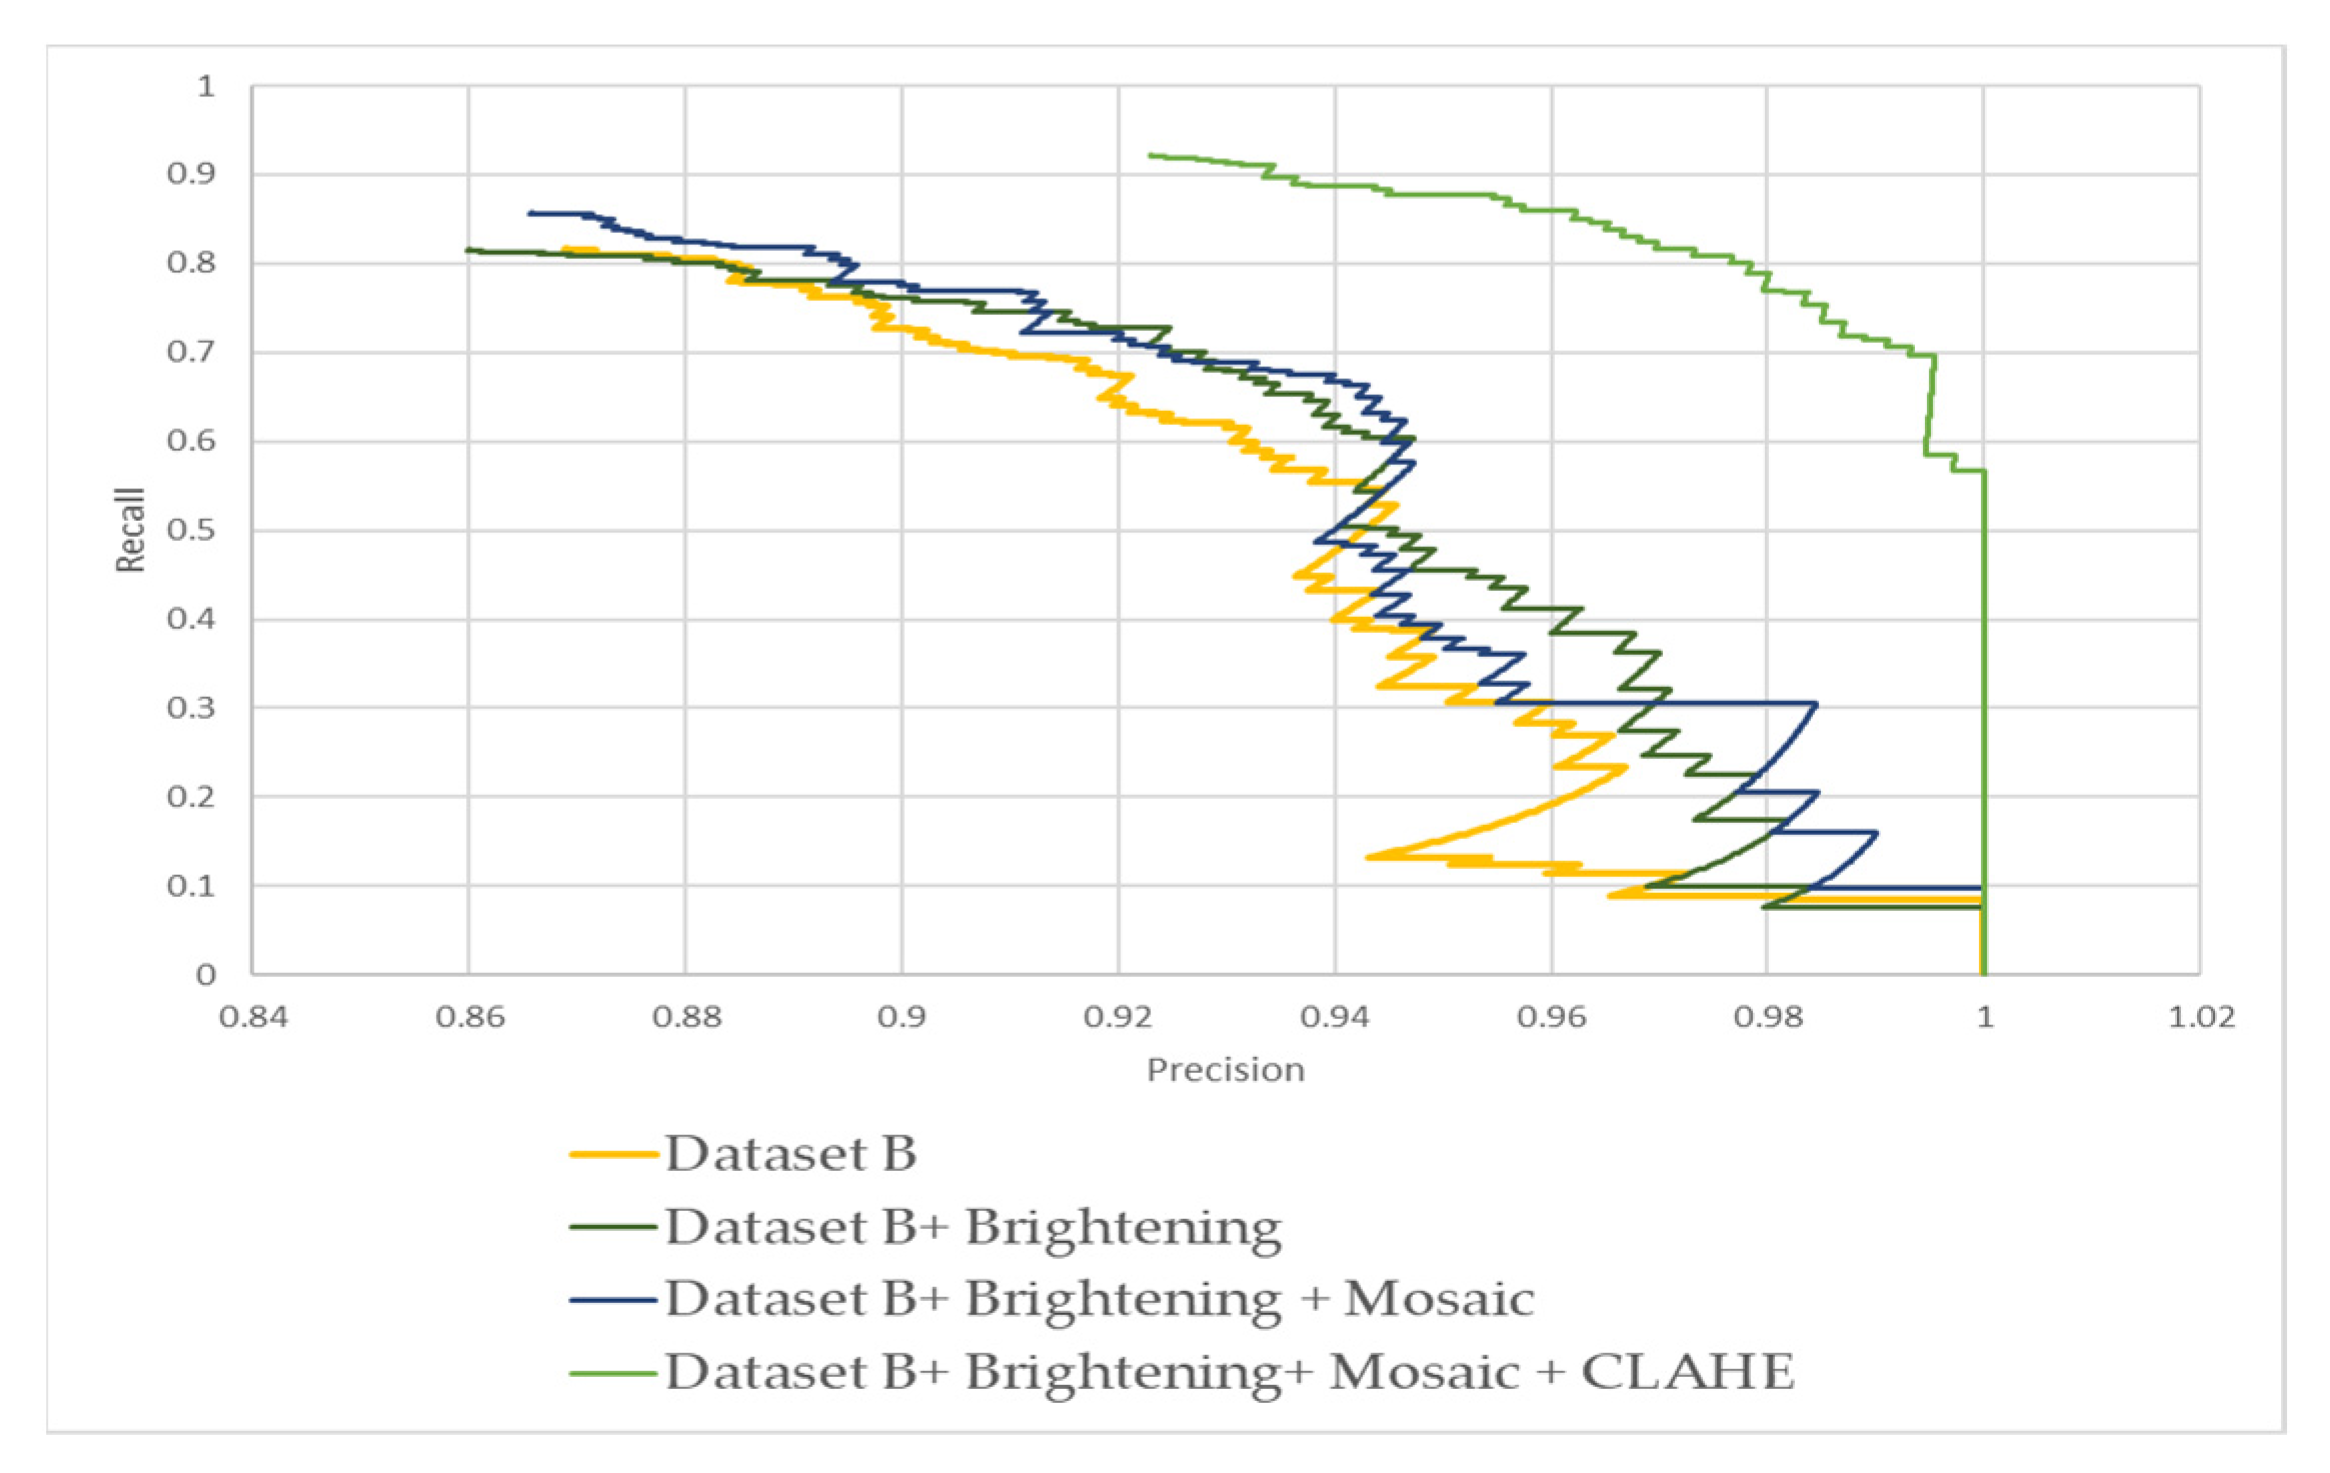
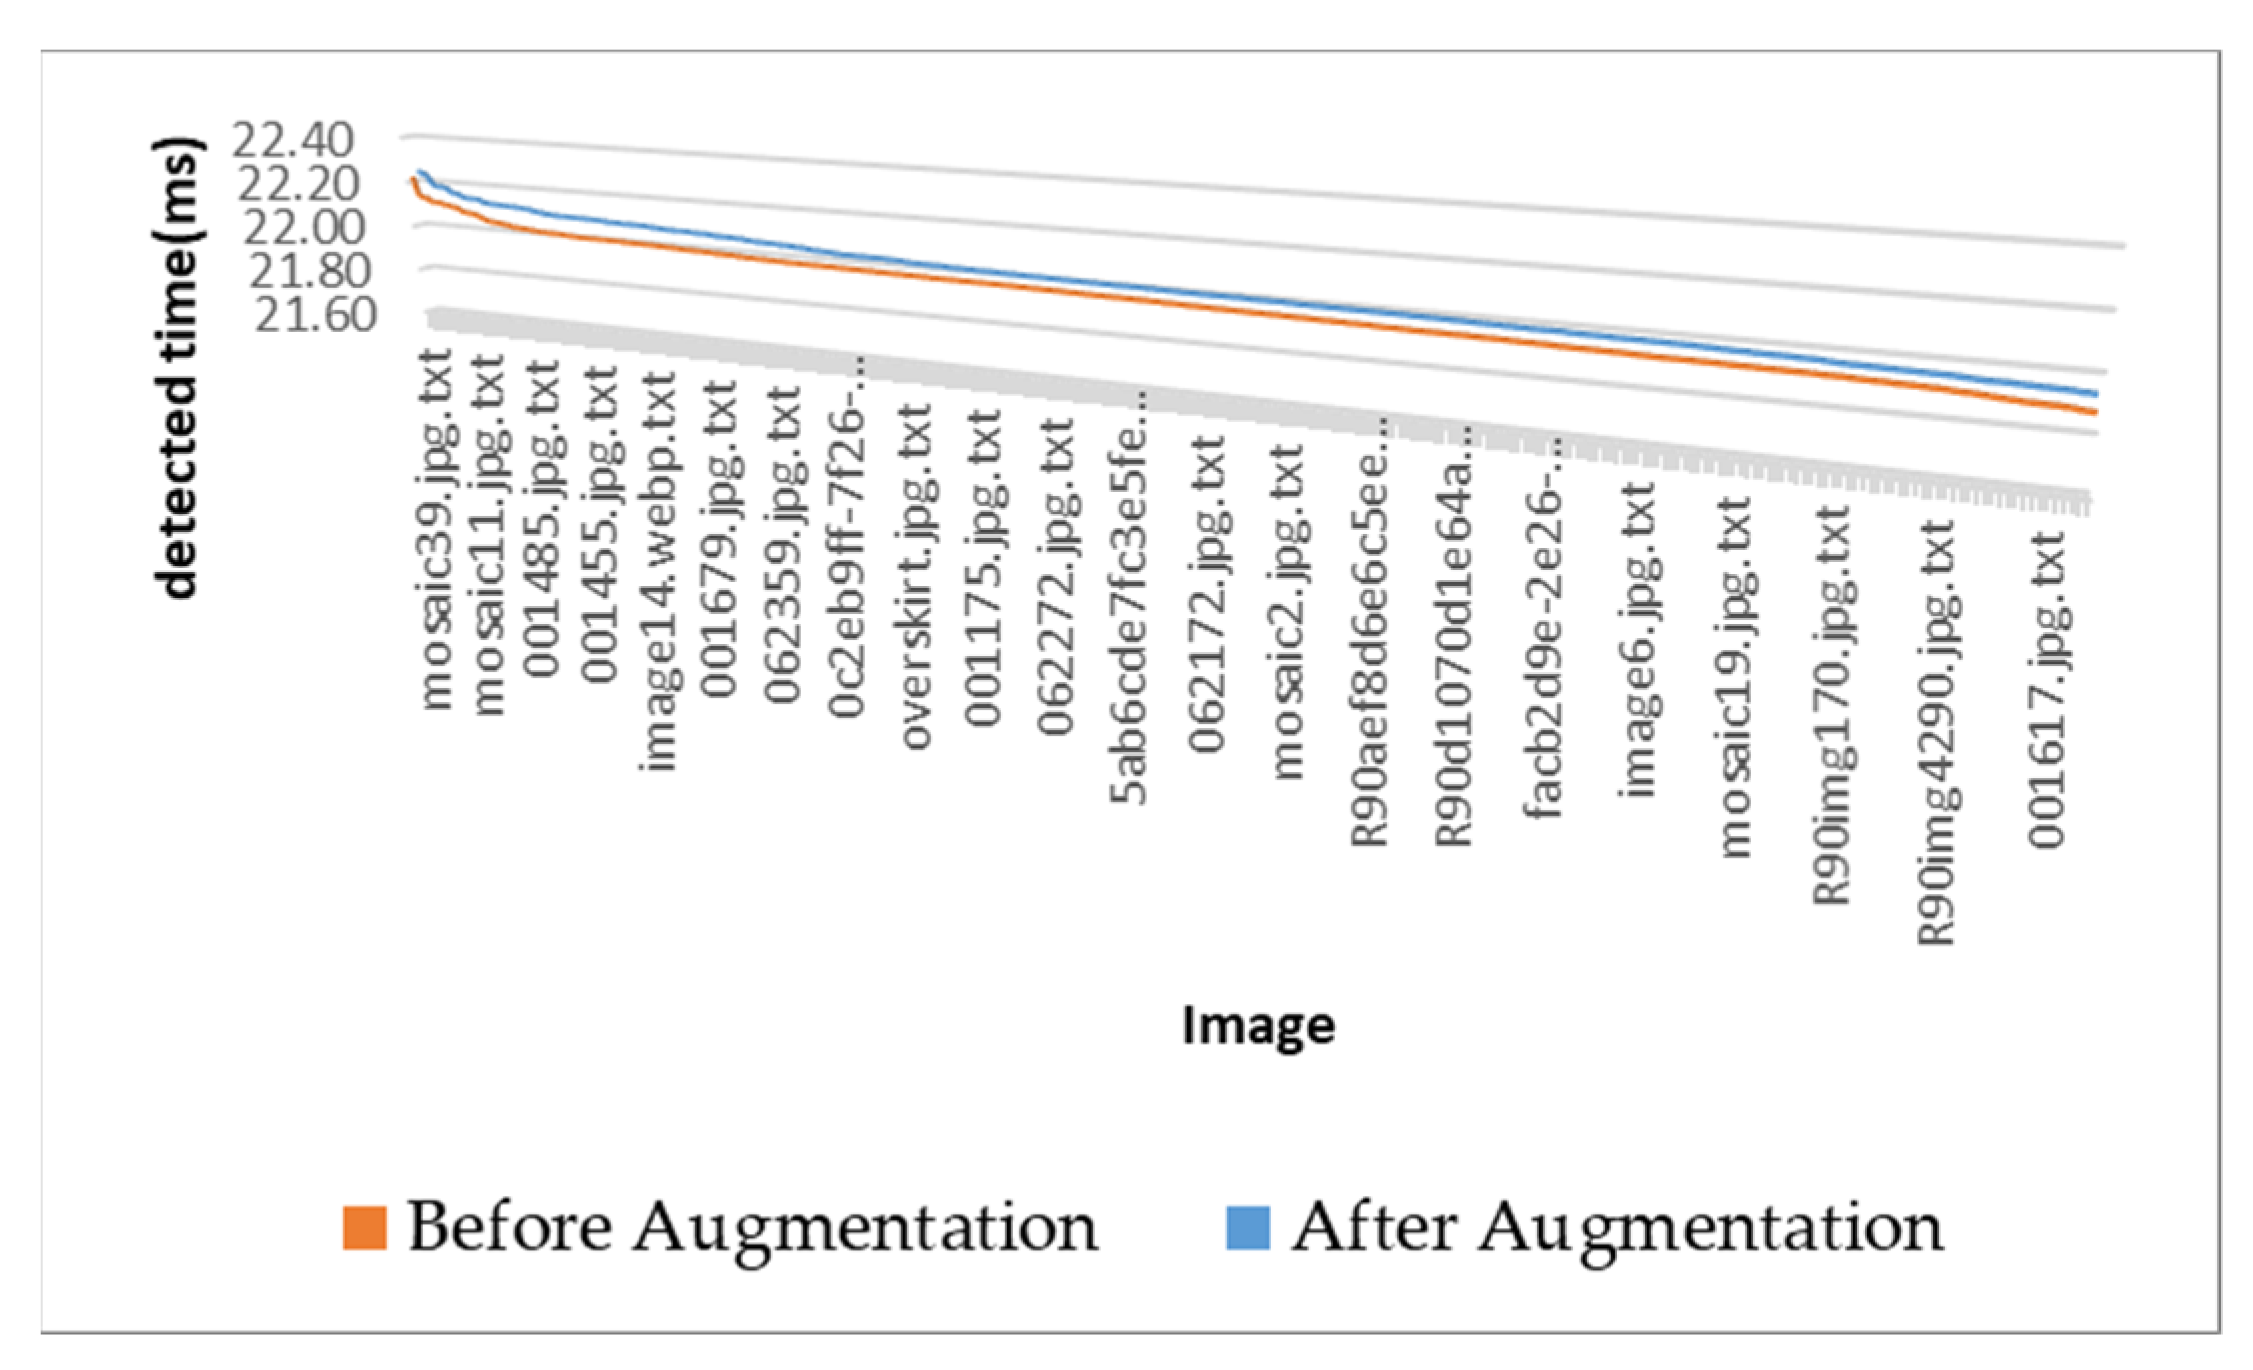
4.2. Comparison of Different Augmentation Effects on the Performance of FC-YOLOv4

We also investigate the effect of various image augmentation on detection outcomes. Our investigation utilized three distinct augmentations: Brightening, Mosaic, and CLAHE. We assess the influence of image enhancement on FC-YOLOv4 findings using four distinct datasets: Dataset B, Dataset C, Dataset D, and Dataset E. Figure 12a depicts the detection results following Dataset B training. Figure 12b illustrates the detection outcomes following training with Dataset C. Figure 12c depicts the detection results following Dataset D training. Figure 12d depicts the detection results following Dataset E training. The precision-recall curves for our model with different augmentation effects are depicted in Figure 13. It is clear that the combination of our proposed FC-YOLOv4 model with different augmentation effects has superior convergence and the potential to recognize clothing of diverse sizes and colors. There is a trade-off for implementing the proposed approach while we deviate from traditional practices. As depicted in Figure 14, the FC-YOLOv4 model’s detection time has increased slightly after training with the image augmentation dataset.

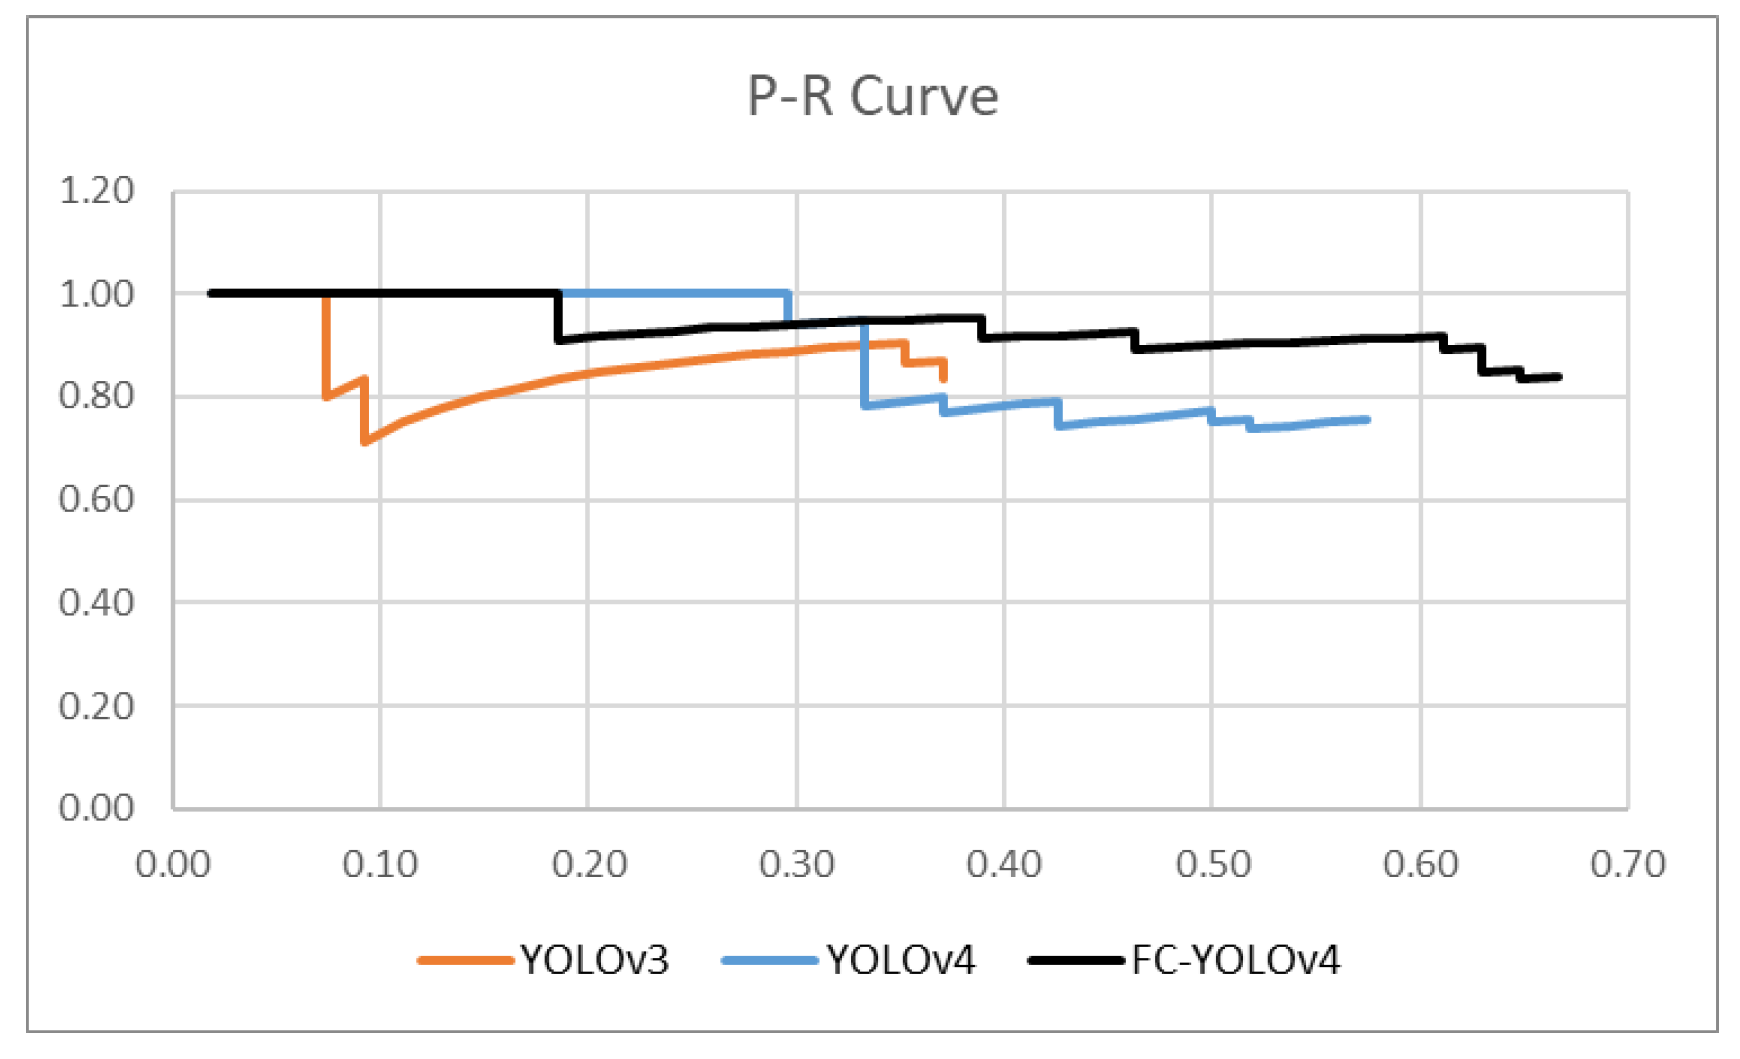
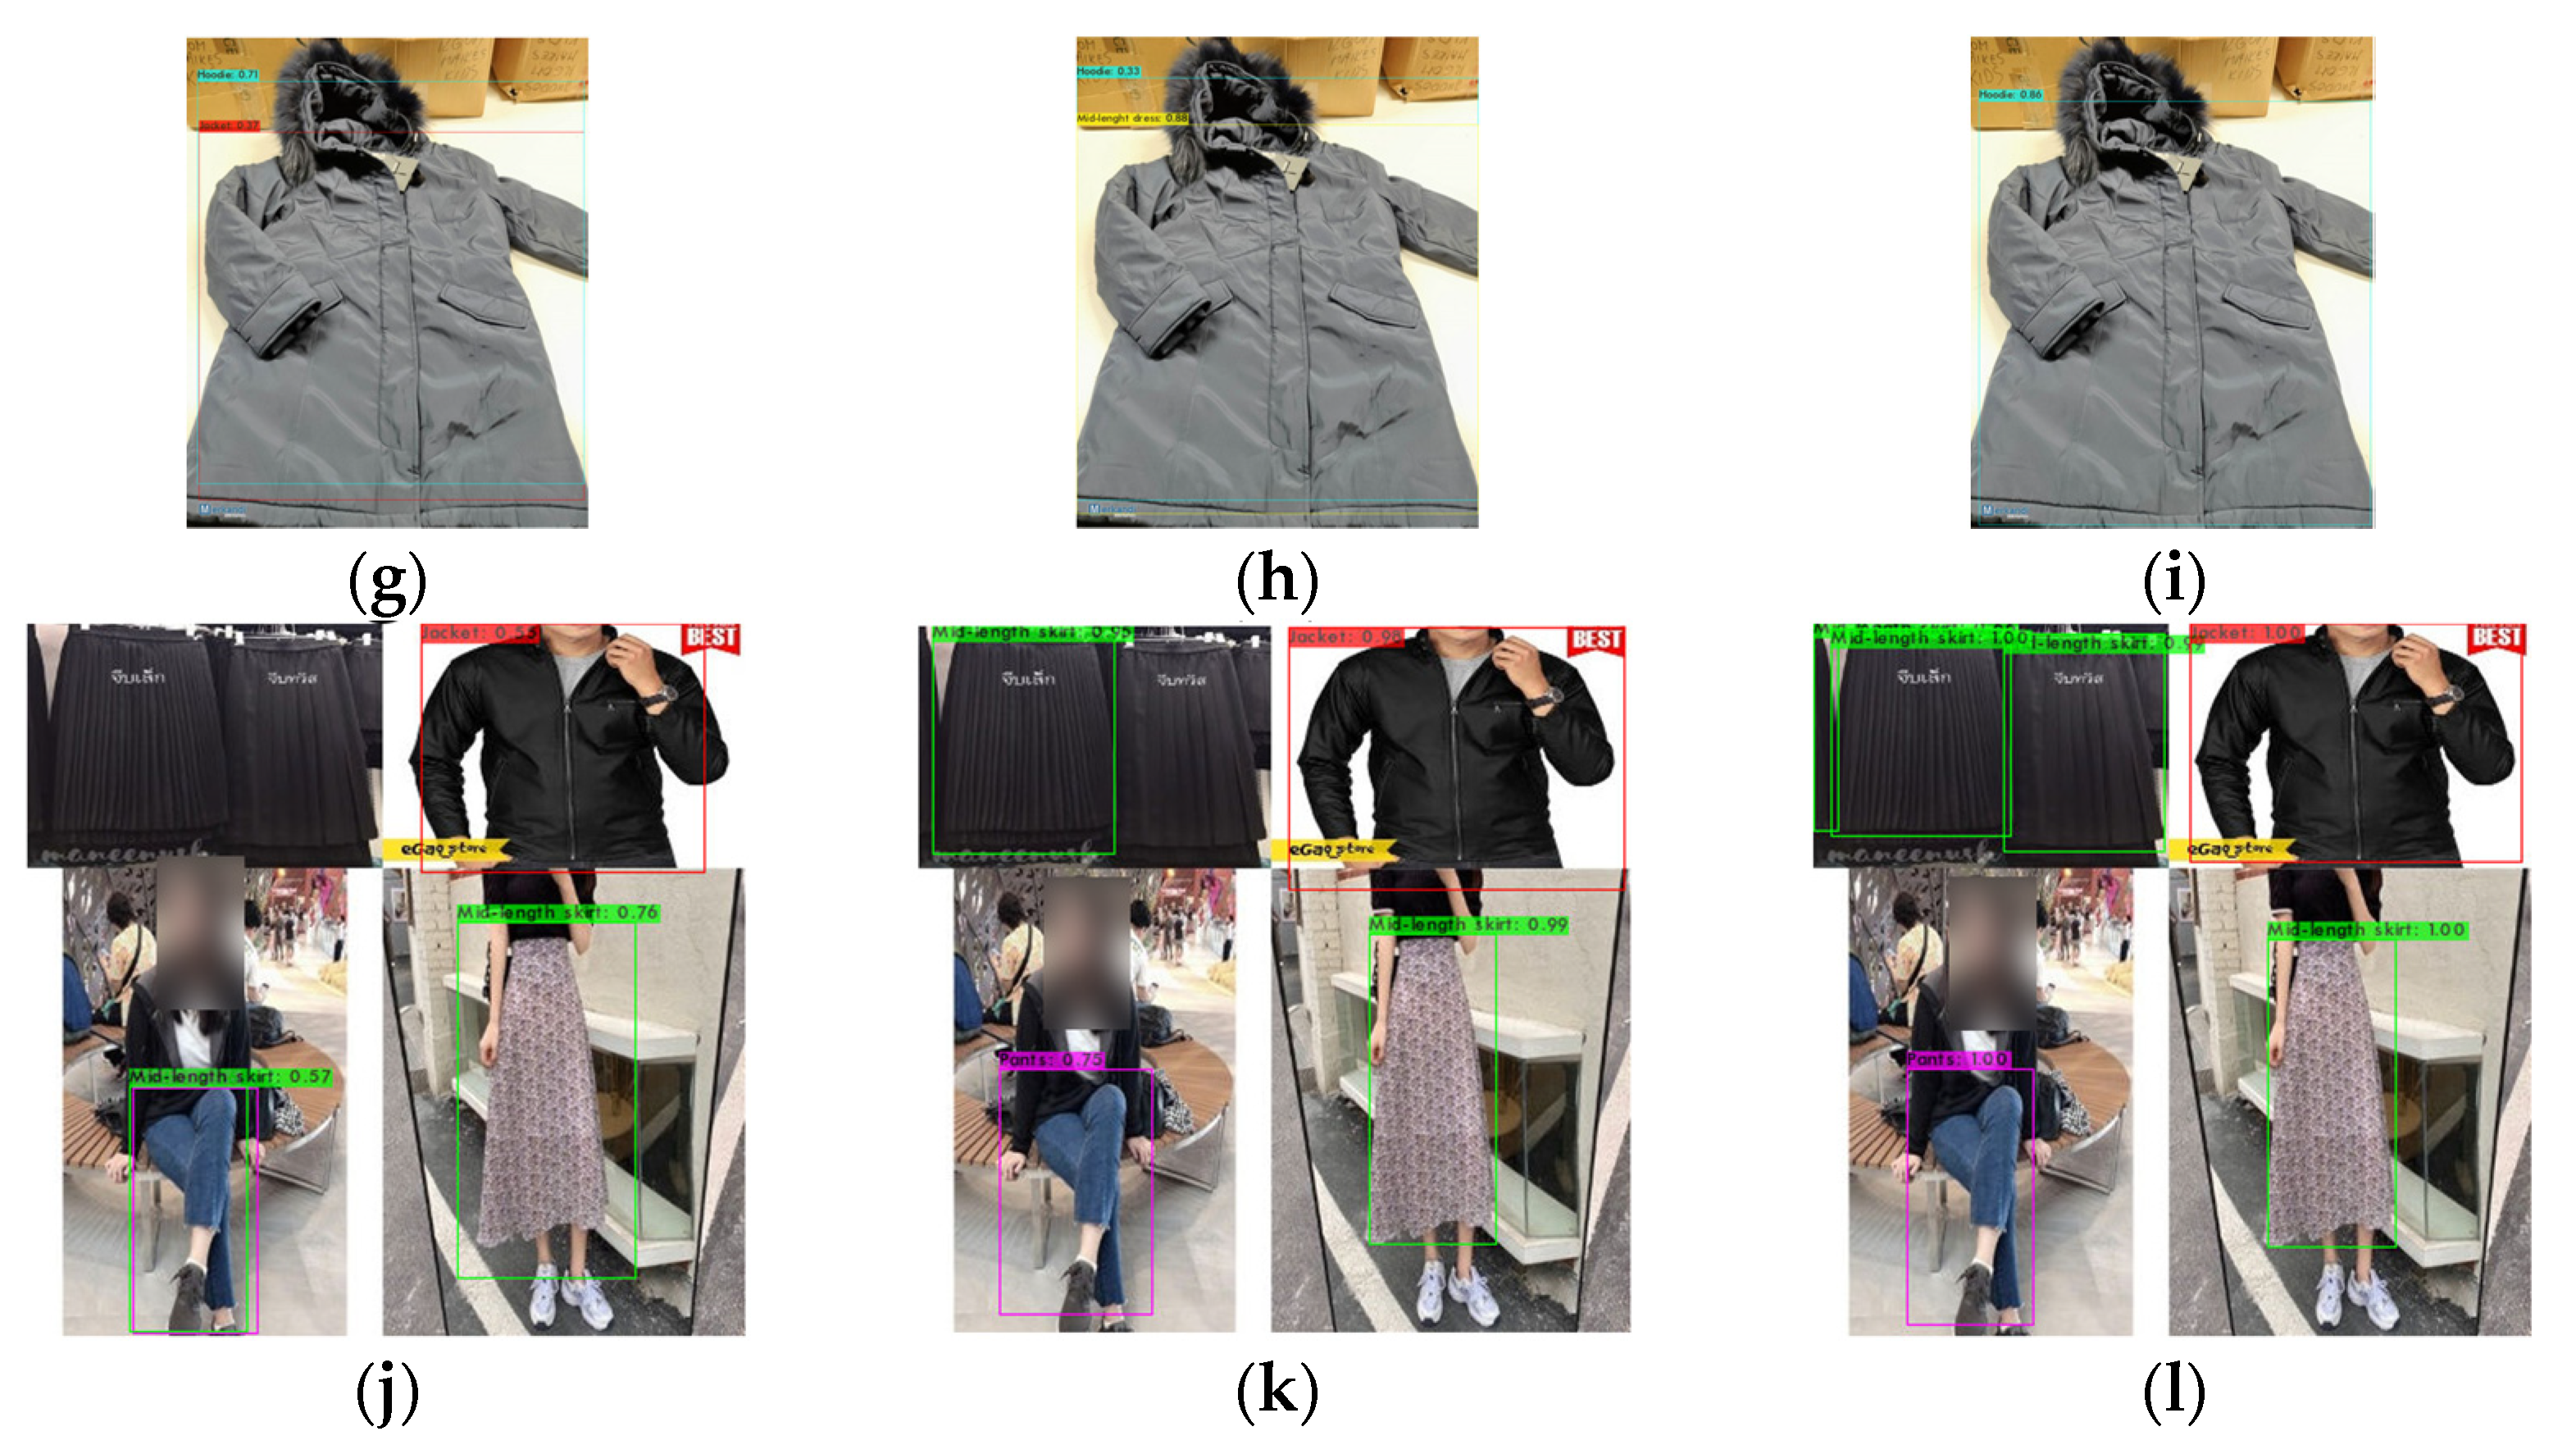
4.3. Comparison of Our FC-YOLOv4 with YOLOv4 and YOLOv3

In this part, we conducted a series of tests using the trained FC-YOLOv4 model and test images for validating the algorithm’s performance. We used 80 percent of the combination of datasets from before pseudo-labeling, after pseudo-labeling, Brightening, Mosaic, and CLAHE as training datasets, and a total of 16,276 images were used. We divided our dataset into training and testing subsets to ensure that the images in each category were balanced. For the testing dataset, we used the collection of the rest of 20 percent of our dataset and collection of the images from the DeepFashion2 dataset, second-hand images from Google Image, and Augmented images. When evaluating the model, we also collected clutter backdrop photos with multiple categories. The suggested model is compared against the YOLOv3 and YOLOv4 two-stage conventional models to demonstrate the proposed model’s superiority. The primary purpose of this research is that our model aims to be able to categorize the closest category when it detects an image that is not in the trained dataset.
The precision-recall curve, or P-R curve, can be generated by plotting the precision ratio against the recall ratio using the precision ratio as the vertical axis and the recall ratio as the horizontal axis. The precision-recall curves for our three models are depicted in Figure 15. While YOLOv4 is more accurate at lower IOU thresholds, our FC-YOLO v4 is more efficient at higher IOU thresholds. As shown in Table 7, after data augmentation, our proposed FC-YOLOv4 model gets 0.007 percent and 40.2 percent higher than the original YOLOv4 and YOLOv3 models with nearly the same detection time.
The detection results of our suggested model were compared to that of the YOLOv3 and Yolov4 conventional models. We evaluated photos with many categories to verify the model’s correctness. The detection results for the YOLOv3 model are described in Figure 16a,d,g. The detection findings for YOLOv4 are illustrated in Figure 16b,e,h, whereas the detection findings for our FC-YOLOv4 model are shown in Figure 16c,f,i. In Figure 16a–c, we discovered that our model could classify the pattern as a “skirt” and can recognize two bounding box skirts even when the training dataset has a different pattern and part of the skirt is covered by the coat. When we examine the findings of the three models in Figure 16d–f, we can see that even though one of the jackets was not photographed from the front view, only the FC-YOLOv4 model correctly detects it. In Figure 16g–i, our FC-YOLOv4 model correctly classifies items as “hoodies”, while the other two models’ bounding boxes overlap. Our FC-YOLOv4 model can also recognize multiple categories and adjacent items with the same color within an image with greater precision than the other two models, as shown in Figure 16j–l. Table 8 represents the number of true positive results with different thresholds. Our FC-YOLOv4 model has more True Positive numbers than another two models.
Figure 17 depicts the outcomes of our suggested FC-YOLOv4 model’s detection. As displayed in Figure 17a–d, our proposed model can detect overlapping clothing with varying hue/saturation levels. As illustrated in Figure 17e–g, our model can recognize even a white outfit with a high brightness level. Figure 17h–k illustrates that our suggested model can also be used to identify second-hand clothing with a cluttered background. As depicted in Figure 17l–n, our proposed model can accurately detect rotated images. Using the Mosaic Augmentation Method, we integrated four images with various categories into a single image to test the case of images containing more than one category. As seen in Figure 17o–q, our model can precisely identify the various categories inside each image.
In our research of how popular object detectors such as YOLOv4 can be modified to detect objects, we identified architectural modifications that yield a significant performance boost over the original model at a relatively cheap cost, as the new model retains speed. The scenario in which we applied the suggested approach, namely autonomous racing, might benefit significantly from such enhancements. We not only enhanced the performance of the base model greatly in this study but also discovered some specialized techniques that may be applied to various applications requiring the detection of objects. Consequently, a modified model with pseudo-labeling outperforms a YOLOv4 class model while keeping a detection speed suitable for fashion applications.
Finally, while this study reveals a sizeable empirical benefit of the recommended architectural adjustments, the study’s consistency and generalizability may and should be further studied. For instance, the analysis would benefit significantly from more testing with diverse data sets and the issues that may occur when detecting screen printing logo images, for example. While we have established the utility of the various strategies presented, they can only be improved and better understood via application to several diverse situations and places. This would be a huge step in developing a more robust system for detecting fashion objects. Additionally, several additional paths and strategies apply to this issue but were not studied; nonetheless, they will remain the focus of future research.

5. Conclusions

We collected a currently collected small dataset from Shopee E-commerce Thailand. Furthermore, we introduced a semi-supervised technique in this paper for predicting fashion product categories using minimum labeled data and a huge amount of unlabeled data. In contrast, the majority of previous work has concentrated on the performance of object identification models. We used FC-YOLOv4 to detect the product category in Shopee’s fashion category. The photos used in this study combine images from Shopee Thailand and Google Images. And then, we compared our FC-YOLOv4 model with YOLOv4 and YOLOv3 models using second-hand clothing, DeepFashion2, and augmented images. In the experiment, we found that model training accuracy is much greater after pseudo-labeling than before pseudo-labeling. When the performance of the three models is evaluated, our FC-YOLOv4 model detects more categories inside an image than the other two models. All verified measures, such as recall, accuracy, and IOU, improved in value. The obtained results are particularly useful for second-hand clothing or less professional marketplaces, where category information is difficult to be reliably available as opposed to vendor side properly photographed and category attributed data.
Using pseudo-labeling, we can minimize the amount of manual labeling necessary for data training and enhance model accuracy. Because pseudo-labeling is retrained from the model and re-labels the images, the main challenge with this study is that labeling mistakes may arise if the initially labeled dataset is too small or the model’s detection performance is inadequate. After pseudo-labeling, the annotated findings must be evaluated one by one. To improve object detection, the training dataset must have at least one object with a similar shape, side of the object, relative size, and rotation angle [92]. We utilized image augmentation to meet the objectives because fashion category recognition data is tough to acquire.
There are two major limitations in this study that could be addressed in future research. First, the study focused primarily on the category under “Women Clothes” main category. Second, this work focuses on predicting only the primary category; it does not attempt to forecast the hierarchical category tree. The number of product categories is growing daily on E-commerce platforms of the present day. The fact that the FC-YOLOv4 model could only recognize five groups under the Women Category is insufficient. Identification of the product variant is also required in the E-commerce platform.
In the future, we want to conduct more in-depth comparison assessments of several cutting-edge machine learning algorithms to greatly improve the performance of the product image classification architecture presented in this study. We would want to suggest that instead of detecting each product individually, we categorize them all at once into their respective categories. Additionally, we would like to focus on picture categorization that considers the hierarchical structure of garment categories.

Author Contributions

Conceptualization, A.T. and Y.T.; methodology, A.T. and Y.T; software, Y.T.; validation, N.J., A.T. and Y.T.; formal analysis, Y.T.; investigation, Y.T.; resources, Y.T.; data curation, Y.T.; writing—original draft preparation, Y.T.; writing—review and editing, Y.T.; visualization, Y.T.; supervision, N.J. and A.T.; project administration, Y.T. All authors have read and agreed to the published version of the manuscript.

Funding

This research received no external funding.

Institutional Review Board Statement

Not applicable.

Informed Consent Statement

Not applicable.

Data Availability Statement

All the data supporting this article are included in the main text.

Acknowledgments

We appreciate the Rajamangala University of Technology Thanyaburi for the participation, assistance, and computational resources utilized in our studies. Additionally, we appreciate the E-CUBE I scholarship program for allowing me to continue my research.

Conflicts of Interest

The authors declare no conflict of interest.

References

  1. Available online: https://www.Who.Int/News/Item/27-04-2020-Who-Timeline—COVID-19 (accessed on 12 January 2022).
  2. Kawasaki, T.; Wakashima, H.; Shibasaki, R. The Use of E-Commerce and the COVID-19 Outbreak: A Panel Data Analysis in Japan. Transp. Policy 2022, 115, 88–100. [Google Scholar] [CrossRef]
  3. Guthrie, C.; Fosso-Wamba, S.; Arnaud, J.B. Online Consumer Resilience during a Pandemic: An Exploratory Study of e-Commerce Behavior before, during and after a COVID-19 Lockdown. J. Retail. Consum. Serv. 2021, 61, 102570. [Google Scholar] [CrossRef]
  4. Agus, A.A.; Yudoko, G.; Mulyono, N.; Imaniya, T. E-Commerce Performance, Digital Marketing Capability and Supply Chain Capability within E-Commerce Platform: Longitudinal Study Before and After COVID-19. Int. J. Technol. 2021, 12, 360–370. [Google Scholar] [CrossRef]
  5. Choshin, M.; Ghaffari, A. An Investigation of the Impact of Effective Factors on the Success of E-Commerce in Small- and Medium-Sized Companies. Comput. Hum. Behav. 2017, 66, 67–74. [Google Scholar] [CrossRef]
  6. Thwe, Y.; Tungkasthan, A.; Jongsawat, N. Quality Analysis of Shopee Seller Portal by Using Category Recommendation System Approach. In Proceedings of the 2021 19th International Conference on ICT and Knowledge Engineering (ICT&KE), Bangkok, Thailand, 24 November 2021. [Google Scholar]
  7. Liu, Z.; Luo, P.; Qiu, S.; Wang, X.; Tang, X. DeepFashion: Powering Robust Clothes Recognition and Retrieval with Rich Annotations. In Proceedings of the IEEE Conference on Computer Vision and Pattern Recognition, Nashville, TN, USA, 20–25 June 2021; pp. 1096–1104. [Google Scholar]
  8. Arulprakash, E.; Aruldoss, M. A Study on Generic Object Detection with Emphasis on Future Research Directions. J. King Saud Univ.—Comput. Inf. Sci. 2021, 33, 1–19. [Google Scholar] [CrossRef]
  9. Wu, H.; Gao, Y.; Guo, X.; Al-Halah, Z.; Rennie, S.; Grauman, K.; Feris, R. Fashion IQ: A New Dataset Towards Retrieving Images by Natural Language Feedback. In Proceedings of the IEEE/CVF Conference on Computer Vision and Pattern Recognition, Long Beach, CA, USA, 15–20 June 2019; pp. 11307–11317. [Google Scholar]
  10. Huang, E.; Su, Z.; Zhou, F.; Wang, R. Learning Rebalanced Human Parsing Model from Imbalanced Datasets. Image Vis. Comput. 2020, 99, 103928. [Google Scholar] [CrossRef]
  11. Li, J.; Zhao, J.; Wei, Y.; Lang, C.; Li, Y.; Sim, T.; Yan, S.; Feng, J. Multiple-Human Parsing in the Wild. arXiv 2017, arXiv:1705.07206. [Google Scholar]
  12. Zhang, X.; Chen, Y.; Zhu, B.; Wang, J.; Tang, M. Semantic-Spatial Fusion Network for Human Parsing. Neurocomputing 2020, 402, 375–383. [Google Scholar] [CrossRef]
  13. Wang, W.; Xu, Y.; Shen, J.; Zhu, S.-C. Attentive Fashion Grammar Network for Fashion Landmark Detection and Clothing Category Classification. In Proceedings of the IEEE Conference on Computer Vision and Pattern Recognition, Salt Lake City, UT, USA, 18–23 June 2018; pp. 4271–4280. [Google Scholar]
  14. Zhang, H.; Huang, W.; Liu, L.; Xu, X. Clothes Collocation Recommendations by Compatibility Learning. In Proceedings of the 2018 IEEE International Conference on Web Services (ICWS)—Part of the 2018 IEEE World Congress on Services, San Francisco, CA, USA, 5 September 2018; pp. 179–186. [Google Scholar]
  15. Liu, L.; Zhang, H.; Xu, X.; Zhang, Z.; Yan, S. Collocating Clothes with Generative Adversarial Networks Cosupervised by Categories and Attributes: A Multidiscriminator Framework. IEEE Trans. Neural Netw. Learn. Syst. 2020, 31, 3540–3554. [Google Scholar] [CrossRef]
  16. Mustaffa, M.R.; Wai, G.S.; Abdullah, L.N.; Nasharuddin, N.A. Dress Me up!: Content-Based Clothing Image Retrieval. In Proceedings of the 3rd International Conference on Cryptography, Security and Privacy, Trento, Italy, 19 January 2019; pp. 206–210. [Google Scholar]
  17. Park, S.; Shin, M.; Ham, S.; Choe, S.; Kang, Y. Study on Fashion Image Retrieval Methods for Efficient Fashion Visual Search. In Proceedings of the IEEE/CVF Conference on Computer Vision and Pattern Recognition Workshops, Long Beach, CA, USA, 16–17 June 2019. [Google Scholar]
  18. Kuang, Z.; Gao, Y.; Li, G.; Luo, P.; Chen, Y.; Lin, L.; Zhang, W. Fashion Retrieval via Graph Reasoning Networks on a Similarity Pyramid. In Proceedings of the IEEE/CVF International Conference on Computer Vision, Seoul, Korea, 27–28 October 2019; pp. 3066–3075. [Google Scholar]
  19. Gupta, M.; Bhatnagar, C.; Jalal, A.S. Clothing Image Retrieval Based on Multiple Features for Smarter Shopping. Procedia Comput. Sci. 2018, 125, 143–148. [Google Scholar] [CrossRef]
  20. Adhiparasakthi Engineering College. Department of Electronics and Communication Engineering; Institute of Electrical and Electronics Engineers. Madras Section; Institute of Electrical and Electronics Engineers. In Proceedings of the 2018 IEEE International Conference on Communication and Signal Processing (ICCSP), Melmaruvathur, India, 3–5 April 2018. [Google Scholar]
  21. Nascimento, J.C.; Marques, J.S. Performance Evaluation of Object Detection Algorithms for Video Surveillance. IEEE Trans. Multimed. 2006, 8, 761–773. [Google Scholar] [CrossRef]
  22. Hoda, M.N. INDIACom 10. In Proceedings of the 10th INDIACom; 2016 3rd International Conference on Computing for Sustainable Global Development, New Delhi, India, 16–18 March 2016. [Google Scholar]
  23. Joshi, K.A.; Thakore, D.G. A Survey on Moving Object Detection and Tracking in Video Surveillance System. Int. J. Soft Comput. Eng. 2012, 2, 44–48. [Google Scholar]
  24. Arnold, E.; Al-Jarrah, O.Y.; Dianati, M.; Fallah, S.; Oxtoby, D.; Mouzakitis, A. A Survey on 3D Object Detection Methods for Autonomous Driving Applications. IEEE Trans. Intell. Transp. Syst. 2019, 20, 3782–3795. [Google Scholar] [CrossRef]
  25. Wu, B.; Iandola, F.; Jin, P.H.; Keutzer, K. SqueezeDet: Unified, Small, Low Power Fully Convolutional Neural Networks for Real-Time Object Detection for Autonomous Driving. In Proceedings of the IEEE Conference on Computer Vision and Pattern Recognition Workshops, Honolulu, HI, USA, 21–26 July 2017; pp. 129–137. [Google Scholar]
  26. Li, B.; Ouyang, W.; Sheng, L.; Zeng, X.; Wang, X. GS3D: An Efficient 3D Object Detection Framework for Autonomous Driving. In Proceedings of the IEEE/CVF Conference on Computer Vision and Pattern Recognition, Long Beach, CA, USA, 15–20 June 2019; pp. 1019–1028. [Google Scholar]
  27. Li, J.; Liang, X.; Shen, S.; Xu, T.; Feng, J.; Yan, S. Scale-Aware Fast R-CNN for Pedestrian Detection. IEEE Trans. Multimed. 2018, 20, 985–996. [Google Scholar] [CrossRef]
  28. Angelova, A.; Krizhevsky, A.; Vanhoucke, V.; Ogale, A.; Ferguson, D. Real-Time Pedestrian Detection With Deep Network Cascades. In Proceedings of the British Machine Vision Conference (BMVC), Swansea, UK, 7–10 September 2015. [Google Scholar]
  29. Hosang, J.; Omran, M.; Benenson, R.; Schiele, B. Taking a Deeper Look at Pedestrians. In Proceedings of the IEEE Conference on Computer Vision and Pattern Recognition (CVPR), Boston, MA, USA, 7–12 June 2015; pp. 4073–4082. [Google Scholar]
  30. Hara, K.; Jagadeesh, V.; Piramuthu, R. Fashion Apparel Detection: The Role of Deep Convolutional Neural Network and Pose-Dependent Priors. In Proceedings of the 2016 IEEE Winter Conference on Applications of Computer Vision (WACV), Lake Placid, NY, USA, 7–10 March 2016. [Google Scholar]
  31. Zheng, S.; Hadi Kiapour, M.; Yang, F.; Piramuthu, R. ModaNet: A Large-Scale Street Fashion Dataset with Polygon Annotations. In Proceedings of the 2018 ACM Multimedia Conference, Seoul, Korea, 15 October 2018; pp. 1670–1678. [Google Scholar]
  32. Lao, B.; Jagadeesh, K. Convolutional Neural Networks for Fashion Classification and Object Detection. CCCV 2015 Comput. Vis. 2015, 546, 120–129. [Google Scholar]
  33. Brasoveanu, A.; Moodie, M.; Agrawal, R. Textual Evidence for the Perfunctoriness of Independent Medical Reviews. In Proceedings of the CEUR Workshop Proceedings, CEUR-WS, Bologna, Italy, 14–16 September 2020; Volume 2657. [Google Scholar]
  34. Hidayati, S.C.; You, C.W.; Cheng, W.H.; Hua, K.L. Learning and Recognition of Clothing Genres from Full-Body Images. IEEE Trans. Cybern. 2017, 48, 1647–1659. [Google Scholar] [CrossRef] [PubMed]
  35. Dong, Q.; Gong, S.; Zhu, X. Multi-Task Curriculum Transfer Deep Learning of Clothing Attributes. In Proceedings of the 2017 IEEE Winter Conference on Applications of Computer Vision (WACV), Santa Rosa, CA, USA, 11 May 2017; pp. 520–529. [Google Scholar]
  36. Do, T.T.; Nguyen, A.; Reid, I. Affordancenet: An end-to-end deep learning approach for object affordance detection. In Proceedings of the Institute of Electrical and Electronics Engineers 2018 IEEE International Conference on Robotics and Automation (ICRA), Brisbane, Australia, 21–25 May 2018; pp. 5882–5889. [Google Scholar]
  37. Xiao, Y.; Tian, Z.; Yu, J.; Zhang, Y.; Liu, S.; Du, S.; Lan, X. A Review of Object Detection Based on Deep Learning. Multimed. Tools Appl. 2020, 79, 23729–23791. [Google Scholar] [CrossRef]
  38. Zhao, Z.Q.; Zheng, P.; Xu, S.T.; Wu, X. Object Detection with Deep Learning: A Review. IEEE Trans. Neural Netw. Learn. Syst. 2019, 30, 3212–3232. [Google Scholar] [CrossRef]
  39. Cheng, R. A Survey: Comparison between Convolutional Neural Network and YOLO in Image Identification. In Journal of Physics: Conference Series; Institute of Physics Publishing: Bristol, UK, 2020; Volume 1453. [Google Scholar]
  40. Kim, H.J.; Lee, D.H.; Niaz, A.; Kim, C.Y.; Memon, A.A.; Choi, K.N. Multiple-Clothing Detection and Fashion Landmark Estimation Using a Single-Stage Detector. IEEE Access 2021, 9, 11694–11704. [Google Scholar] [CrossRef]
  41. Lee, C.H.; Lin, C.W. A Two-Phase Fashion Apparel Detection Method Based on Yolov4. Appl. Sci. 2021, 11, 3782. [Google Scholar] [CrossRef]
  42. Li, N.; Cheng, B.; Zhang, J. A Cascade Model with Prior Knowledge for Bone Age Assessment. Appl. Sci. 2022, 12, 7371. [Google Scholar] [CrossRef]
  43. Chen, H.; Gallagher, A.; Girod, B. Describing Clothing by Semantic Attributes. In European Conference on Computer Vision; Springer: Berlin/Heidelberg, Germany, 2012; pp. 609–623. [Google Scholar]
  44. Bossard, L.; Dantone, M.; Leistner, C.; Wengert, C.; Quack, T.; Gool, L.V. Apparel Classification with Style. In Asian Conference on Computer Vision; Springer: Berlin/Heidelberg, Germany, 2012; pp. 321–335. [Google Scholar]
  45. Zhou, T.; Qi, S.; Wang, W.; Shen, J.; Zhu, S.C. Cascaded Parsing of Human-Object Interaction Recognition. IEEE Trans. Pattern Anal. Mach. Intell. 2022, 44, 2827–2840. [Google Scholar] [CrossRef]
  46. Zhou, T.; Wang, W.; Liu, S.; Yang, Y.; Gool, L.V. Differentiable Multi-Granularity Human Representation Learning for Instance-Aware Human Semantic Parsing. In Proceedings of the IEEE/CVF Conference on Computer Vision and Pattern Recognition (CVPR), Nashville, TN, USA, 20–25 June 2021; pp. 1622–1631. [Google Scholar]
  47. Chen, M.; Qin, Y.; Qi, L.; Sun, Y. Improving Fashion Landmark Detection by Dual Attention Feature Enhancement. In Proceedings of the IEEE/CVF International Conference on Computer Vision Workshops, Seoul, Korea, 27–28 October 2019. [Google Scholar]
  48. Kumar Addagarla, S. Single Stage Deep Transfer Learning Model for Apparel Detection and Classification for E-Commerce. Int. J. Electron. Commer. Stud. 2022, 13, 69–92. [Google Scholar] [CrossRef]
  49. Jiao, L.; Zhang, F.; Liu, F.; Yang, S.; Li, L.; Feng, Z.; Qu, R. A Survey of Deep Learning-Based Object Detection. IEEE Access 2019, 7, 128837–128868. [Google Scholar] [CrossRef]
  50. Fu, L.; Duan, J.; Zou, X.; Lin, J.; Zhao, L.; Li, J.; Yang, Z. Fast and Accurate Detection of Banana Fruits in Complex Background Orchards. IEEE Access 2020, 8, 196835–196846. [Google Scholar] [CrossRef]
  51. Girshick, R.; Donahue, J.; Darrell, T.; Malik, J. Rich Feature Hierarchies for Accurate Object Detection and Semantic Segmentation. In Proceedings of the IEEE Conference on Computer Vision and Pattern Recognition (CVPR), Columbus, OH, USA, 23–28 June 2014; pp. 580–587. [Google Scholar]
  52. Girshick, R. Fast R-CNN. In Proceedings of the IEEE International Conference on Computer Vision (ICCV), Santiago, Chile, 7–13 December 2015; pp. 1440–1448. [Google Scholar]
  53. Ren, S.; He, K.; Girshick, R.; Sun, J. Faster R-CNN: Towards Real-Time Object Detection with Region Proposal Networks. IEEE Trans. Pattern Anal. Mach. Intell. 2017, 39, 1137–1149. [Google Scholar] [CrossRef] [PubMed]
  54. He, K.; Gkioxari, G.; Dollar, P.; Girshick, R. Mask R-CNN. In Proceedings of the IEEE International Conference on Computer Vision, Venice, Italy, 22 December 2017; Volume 2017. [Google Scholar]
  55. Lohia -Guise, A. Bibliometric Analysis of One-Stage and Two-Stage Object Detection. Libr. Philos. Pract. 2021, 4910. Available online: https://digitalcommons.unl.edu/libphilprac/4910 (accessed on 17 January 2022).
  56. Fujii, K.; Kawamoto, K. Generative and Self-Supervised Domain Adaptation for One-Stage Object Detection. Array 2021, 11, 100071. [Google Scholar] [CrossRef]
  57. Sermanet, P.; Eigen, D.; Zhang, X.; Mathieu, M.; Fergus, R.; LeCun, Y. OverFeat: Integrated Recognition, Localization and Detection Using Convolutional Networks. arXiv 2013, arXiv:1312.6229. [Google Scholar]
  58. Liu, W.; Anguelov, D.; Erhan, D.; Szegedy, C.; Reed, S.; Fu, C.-Y.; Berg, A.C. SSD: Single Shot MultiBox Detector. In Computer Vision—ECCV 2016; Springer: Berlin/Heidelberg, Germany, 2015; pp. 21–37. [Google Scholar] [CrossRef]
  59. Lin, T.-Y.; Goyal, P.; Girshick, R.; He, K.; Dollár, P. Focal Loss for Dense Object Detection. In Proceedings of the IEEE International Conference on Computer Vision (ICCV), Venice, Italy, 22–29 October 2017; pp. 2980–2988. [Google Scholar]
  60. Law, H.; Deng, J. CornerNet: Detecting Objects as Paired Keypoints. In Proceedings of the European Conference on Computer Vision (ECCV), Munich, Germany, 8–14 September 2018; pp. 734–750. [Google Scholar]
  61. Redmon, J.; Divvala, S.; Girshick, R.; Farhadi, A. You Only Look Once: Unified, Real-Time Object Detection. In Proceedings of the IEEE Conference on Computer Vision and Pattern Recognition (CVPR), Boston, MA, USA, 7–12 June 2015; pp. 779–788. [Google Scholar]
  62. Redmon, J.; Farhadi, A. YOLO9000: Better, Faster, Stronger. In Proceedings of the IEEE Conference on Computer Vision and Pattern Recognition (CVPR), Las Vegas, NV, USA, 27–30 June 2016; pp. 7263–7271. [Google Scholar]
  63. Redmon, J.; Farhadi, A. YOLOv3: An Incremental Improvement. arXiv 2018, arXiv:1804.02767. [Google Scholar]
  64. Feng, Z.; Luo, X.; Yang, T.; Kita, K. An object detection system based on YOLOv2 in fashion apparel. In Proceedings of the Institute of Electrical and Electronics Engineers 2018 IEEE 4th International Conference on Computer and Communications (ICCC), IEEE, Chengdu, China, 7–10 December 2018; pp. 1532–1536. [Google Scholar]
  65. Bochkovskiy, A.; Wang, C.-Y.; Liao, H.-Y.M. YOLOv4: Optimal Speed and Accuracy of Object Detection. arXiv 2020, arXiv:2004.10934. [Google Scholar]
  66. Chai, E.; Ta, L.; Ma, Z.; Zhi, M. ERF-YOLO: A YOLO Algorithm Compatible with Fewer Parameters and Higher Accuracy. Image Vis. Comput. 2021, 116, 104317. [Google Scholar] [CrossRef]
  67. Gai, R.; Chen, N.; Yuan, H. A Detection Algorithm for Cherry Fruits Based on the Improved YOLO-v4 Model. Neural Comput. Appl. 2021, 33, 1–15. [Google Scholar] [CrossRef]
  68. Mameli, M.; Paolanti, M.; Pietrini, R.; Pazzaglia, G.; Frontoni, E.; Zingaretti, P. Deep Learning Approaches for Fashion Knowledge Extraction from Social Media: A Review. IEEE Access 2022, 10, 1545–1576. [Google Scholar] [CrossRef]
  69. Xiao, H.; Rasul, K.; Vollgraf, R. Fashion-MNIST: A Novel Image Dataset for Benchmarking Machine Learning Algorithms. arXiv 2017, arXiv:1708.07747. [Google Scholar]
  70. Liu, K.H.; Liu, T.J.; Wang, F. Cbl: A Clothing Brand Logo Dataset and a New Method for Clothing Brand Recognition. In Proceedings of the 2020 28th European Signal Processing Conference (EUSIPCO), Amsterdam, The Netherlands, 24 January 2021; Volume 2021, pp. 655–659. [Google Scholar]
  71. Jia, M.; Shi, M.; Sirotenko, M.; Cui, Y.; Cardie, C.; Hariharan, B.; Adam, H.; Belongie, S. Fashionpedia: Ontology, Segmentation, and an Attribute Localization Dataset. In European Conference on Computer Vision; Springer: Cham, Switzerland, 2020; pp. 316–332. [Google Scholar]
  72. Tiwari, G.; Bhatnagar, B.L.; Tung, T.; Pons-Moll, G. SIZER: A Dataset and Model for Parsing 3D Clothing and Learning Size Sensitive 3D Clothing. In European Conference on Computer Vision; Springer: Cham, Switzerland, 2020. [Google Scholar]
  73. de Souza Inácio, A.; Lopes, H.S. Epynet: Efficient Pyramidal Network for Clothing Segmentation. IEEE Access 2020, 8, 187882–187892. [Google Scholar] [CrossRef]
  74. Yang, X.; Zhang, H.; Jin, D.; Liu, Y.; Wu, C.-H.; Tan, J.; Xie, D.; Wang, J.; Wang, X. Fashion Captioning: Towards Generating Accurate Descriptions with Semantic Rewards. In European Conference on Computer Vision; Springer: Cham, Switzerland, 2020. [Google Scholar]
  75. Yamaguchi, K.; Hadi, M.; Luis, K.; Ortiz, E.; Berg, T.L. Parsing Clothing in Fashion Photographs. In Proceedings of the 2012 IEEE Conference on Computer Vision and Pattern Recognition, Providence, RI, USA, 16–21 June 2012; pp. 3570–3577. [Google Scholar]
  76. Tang, Y.; Li, Y.; Borisyuk, F.; Liu, Y.; Malreddy, S.; Kirshner, S. Msuru: Large Scale e-Commerce Image Classification with Weakly Supervised Search Data. In Proceedings of the 25th ACM SIGKDD International Conference on Knowledge Discovery and Data Mining, Anchorage, AK, USA, 4–8 August 2019; pp. 2518–2526. [Google Scholar]
  77. Zhou, M.; Ding, Z.; Tang, J.; Yin, D. Micro Behaviors: A New Perspective in E-Commerce Recommender Systems. In Proceedings of the 11th ACM International Conference on Web Search and Data Mining, Marina Del Rey, CA, USA, 2 February 2018; Volume 2018, pp. 727–735. [Google Scholar]
  78. Sarwar, B.; Karypis, G.; Konstan, J.; Riedl, J. Analysis of Recommendation Algorithms for E-Commerce. In Proceedings of the 2nd ACM Conference on Electronic Commerce, Minneapolis, MN, USA, 17–20 October 2000; pp. 158–167. [Google Scholar]
  79. Paraschakis, D.; Nilsson, B.J.; Hollander, J. Comparative Evaluation of Top-N Recommenders in e-Commerce: An Industrial Perspective. In Proceedings of the 2015 IEEE 14th International Conference on Machine Learning and Applications (ICMLA), Miami, FL, USA, 9–11 December 2015; pp. 1024–1031. [Google Scholar]
  80. Lin, Y.C.; Das, P.; Trotman, A.; Kallumadi, S. A Dataset and Baselines for E-Commerce Product Categorization. In Proceedings of the 2019 ACM SIGIR International Conference on Theory of Information Retrieval, Santa Clara, CA, USA 2–5 October 2019; pp. 213–216. [Google Scholar]
  81. Available online: https://Open.Shopee.Com/ (accessed on 17 January 2022).
  82. Yamin Thwe Shopee Image Dataset (Thailand). IEEE Dataport 2022.
  83. Tzutalin LabelImg. Available online: https://github.com/heartexlabs/labelImg (accessed on 17 January 2022).
  84. Simonyan, K.; Zisserman, A. Very Deep Convolutional Networks for Large-Scale Image Recognition. arXiv 2014, arXiv:1409.1556. [Google Scholar]
  85. He, K.; Zhang, X.; Ren, S.; Sun, J. Deep Residual Learning for Image Recognition. In Proceedings of the IEEE Conference on Computer Vision and Pattern Recognition, Boston, MA, USA, 7–12 June 2015; pp. 770–778. [Google Scholar]
  86. Tan, M.; Le, Q.V. EfficientNet: Rethinking Model Scaling for Convolutional Neural Networks. In Proceedings of the International Conference on Machine Learning, Long Beach, CA, USA, 9–15 June 2019; pp. 6105–6114. [Google Scholar]
  87. Wang, C.-Y.; Liao, H.-Y.M.; Yeh, I.-H.; Wu, Y.-H.; Chen, P.-Y.; Hsieh, J.-W. CSPNet: A New Backbone That Can Enhance Learning Capability of CNN. In Proceedings of the IEEE/CVF Conference on Computer Vision and Pattern Recognition Workshops, Long Beach, CA, USA, 16–17 June 2019; pp. 390–391. [Google Scholar]
  88. He, K.; Zhang, X.; Ren, S.; Sun, J. Spatial Pyramid Pooling in Deep Convolutional Networks for Visual Recognition. IEEE Trans. Pattern Anal. Mach. Intell. 2014, 37, 1904–1916. [Google Scholar] [CrossRef]
  89. Liu, S.; Qi, L.; Qin, H.; Shi, J.; Jia, J. Path Aggregation Network for Instance Segmentation. In Proceedings of the IEEE Conference on Computer Vision and Pattern Recognition, Salt Lake City, UT, USA, 18–23 June 2018; pp. 8759–8768. [Google Scholar]
  90. Zheng, Z.; Wang, P.; Ren, D.; Liu, W.; Ye, R.; Hu, Q.; Zuo, W. Enhancing Geometric Factors in Model Learning and Inference for Object Detection and Instance Segmentation. IEEE Trans. Cybern. 2020, 52, 8574–8586. [Google Scholar] [CrossRef]
  91. Nguyen, Q.H.; Ly, H.B.; Ho, L.S.; Al-Ansari, N.; van Le, H.; Tran, V.Q.; Prakash, I.; Pham, B.T. Influence of Data Splitting on Performance of Machine Learning Models in Prediction of Shear Strength of Soil. Math. Probl. Eng. 2021, 2021, 4832864. [Google Scholar] [CrossRef]
  92. Available online: https://Github.Com/AlexeyAB/Darknet (accessed on 17 January 2022).
Figure 2. Samples of our Dataset.
Applsci 12 08068 g002
Figure 3. Image Labelling Process. (a) Overlapping Dress Image; (b) Multiple Category Within One Image; (c) Overlapping Hoodie Image.
Applsci 12 08068 g003
Figure 4. Visualization of the Distribution for Dataset.
Applsci 12 08068 g004
Figure 5. Neck network structure (a) Traditional YOLOv4 (b) our proposed FC-YOLOv4.
Applsci 12 08068 g005
Figure 6. The network architecture of FC-YOLOv4.
Applsci 12 08068 g006
Figure 7. Research Methodology.
Applsci 12 08068 g007
Figure 8. Detection result of the YOLOv4 traditional model (Mid-length dress: 95% (left_x: 42 top_y: 13 width: 142 height: 196)).
Applsci 12 08068 g008
Figure 9. Conversion from Detection Output to YOLO Form. (a) YOLOv4 Detection Result; (b) Pseudolabeling Result; (c) Input Result for YOLOv4.
Applsci 12 08068 g009
Figure 10. Samples of training images after image augmentation (a) Brightening, (b) Mosaic, and (c) CLAHE results.
Applsci 12 08068 g010
Figure 11. Detection results of before and after pseudo-labeling. (a) Dress Detection Result Before Pseudolabeling; (b) Dress Detection Result After Pseudolabeling; (c) Hoodie Detection Result Before Pseudolabeling; (d) Hoodie Detection Result After Pseudolabeling.
Applsci 12 08068 g011
Figure 12. Detection results with different augmentation results. (a) Result After Training with Dataset B; (b) Result After Training with Dataset C; (c) Result After Training with Dataset D; (d) Result After Training with Dataset E.
Applsci 12 08068 g012
Figure 13. Precision-Recall Curve for different image augmentation.
Applsci 12 08068 g013
Figure 14. Detection time comparison for Before and After Augmentation.
Applsci 12 08068 g014
Figure 15. P-R curve.
Applsci 12 08068 g015
Figure 16. Detection results of YOLOv3, YOLOv4, and our proposed FC-YOLOv4. (a,d,g,j) YOLOv3 Detection Results; (b,e,h,k) YOLOv4 Detection Results; (c,f,i,l) FC-YOLOv4 Detection Results.
Applsci 12 08068 g016aApplsci 12 08068 g016b
Figure 17. Detection results of our proposed FC-YOLOv4. (ad) FC-YOLOv4 Overlaping Detection; (eg) High Brightness Overlaping Detection; (hk) Cluttered Background Detection; (ln) Rotated Images Detection; (oq) Multiple Categories Detection.
Applsci 12 08068 g017
Table 1. The number of pictures and bounding boxes per category.
CategoriesNumber of ImagesNumber of Bounding Boxes
Pants7411212
Dress6991048
Hoodie10591843
Jacket684977
Skirt9331685
Total41166765
Table 2. The number of images according to the bounding boxes per category.
Categories1234567891011121314
Pants428173761912434 2
Dress4851424111574 1
Hoodie725177544625185462 2
Jacket561623922911 1
Skirt60517763181913167431211
Table 3. Initialization parameters of YOLOv4.
Input Image SizeBatchMomentumInitial Learning RateDecayTraining Steps
416 × 416640.9490.0010.00058000, 9000
Table 4. The number of images generated by pseudo-labeling and data augmentation.
Before Pseudo-Labelling (Dataset A)After Pseudo-Labelling (Dataset B)BrighteningMosaicCLAHETotal
663345312,348428345320,345
Table 5. Dataset Naming Convention.
Dataset NameDataset Content
Dataset ABefore Pseudo-labelling
Dataset BAfter Pseudo-labelling
Dataset CDataset B + the Brightening Augmented Dataset
Dataset DDataset C + Mosaic
Dataset EDataset D + CLAHE
Table 6. Performance metrics on YOLOv4 before pseudo-labeling and after pseudo-labeling.
Before Pseudo-LabellingAfter Pseudo-Labelling
CategoriesAPTPFP[email protected]APTPFP[email protected]
Pants94.06%7902120.6297.55%808540.97
Mid-length dress46.68%2825896.80%71642
Hoodie50.09%38814296.53%88240
Jacket61.75%2702297.19%51236
Mid-length skirt60.23%86435499.32%152658
Table 7. Comparison of parameters, detection time, accuracy, and size of three models.
Total ParametersDetection TimeAccuracy (mAp)Size
FC-YOLOv463,959,22633 milliseconds95.87%266 MB
YOLOv463,959,22632 milliseconds95.80%244 MB
YOLOv361,545,27432 milliseconds55.67%234 MB
Table 8. The number of true positive results with different thresholds.
IOUFC-YOLOv4YOLOv4YOLOv3
0811180916119
0.1774577664263
0.2758375753674
0.3744474403301
0.4730772923008
0.5713271272733
0.6695769612442
0.7673767052155
0.8640363581794
0.9568756131324
Publisher’s Note: MDPI stays neutral with regard to jurisdictional claims in published maps and institutional affiliations.

