Article

Statistical Analysis of Vertical and Torsional Whipping Response Based on Full-Scale Measurement of a Large Container Ship

1
Graduate School of Engineering Science, Yokohama National University, Yokohama 240-8501, Japan
2
Professor, Faculty of Engineering, Yokohama National University, Yokohama 240-8501, Japan
3
Design Division, Japan Marine United Corporation, Yokohama 220-0012, Japan
*
Author to whom correspondence should be addressed.
Appl. Sci. 2020, 10(8), 2978; https://doi.org/10.3390/app10082978
Submission received: 30 December 2019 / Revised: 22 February 2020 / Accepted: 21 April 2020 / Published: 24 April 2020
(This article belongs to the Special Issue Ships and Marine Structures)

Abstract

:
In this study, as a preliminary attempt to reveal the whipping response of large container ships in actual seaways, the stress monitoring data of an 8600 TEU large container ship were analyzed. The measurement lasted approximately five years, and using a large amount of data, we investigated how the sea state and operational conditions affected the whipping response. In addition, the midship longitudinal stresses were decomposed into hull girder vertical bending, horizontal bending, and torsional and axial components. Thereafter, we found that the whipping magnitude on the torsional and horizontal bending components is much smaller than that on the vertical bending component. Future research would include the analysis of a larger amount of data, analysis of other sensor data, and effects of various patterns of vibrational response on the ultimate strength and fatigue strength. The obtained results will benefit the future design and operation of large container ships for safer navigation.

1. Introduction

In recent years, container vessels have become larger as the amount of seaborne cargo has increased with the development of the world economy. Hydroelasticity has become an important issue in the marine industry with the increase in container vessel size. The hydroelastic response can be classified into springing and whipping. Springing is the vibrational response that occurs when the natural frequency of the hull resonates with a wave encounter. This hull vibrational response is likely to occur in a large ship wherein the natural frequency is generally low. Whipping is a hull vibration caused by the slamming load generated when a ship plunges into the free surface. This hull vibrational response is a temporary response that is likely to occur under severe sea conditions. Considerable research has been conducted on these hydroelastic issues to establish the hull design in terms of safety and other relevant aspects.
As an early example of a full-scale measurement campaign of large container ships, Okada et al. [1] performed full-scale measurements of a post-Panamax container ship during the three years from 1999 to 2002. They reported that the presence of whipping stress doubles the fatigue damage. Meanwhile, in 2013, a large container ship broke its back while navigating in the Indian Ocean [2,3]. One of the possible causes of this accident was reported to be the effect of whipping on the longitudinal bending strength of the hull girder, which is still difficult to estimate quantitatively, and necessitates further research.
In addition, while the major research activities on whipping have so far focused only on the hull girder vertical bending, the recent increase in the size of container ships has also raised concerns regarding torsional whipping responses. In fact, some recent container ship measurement campaigns have focused on torsional vibratory responses. Ki et al. [4] used the full-scale measurement data of a 14,000 TEU container ship to compare the design values with the extreme values at each moment. Regarding fatigue damage, it was shown that the vibration damage constituted approximately 50% of the total damage for the measured hull stress, or even higher. In addition, it was concluded that the vertical bending mode vibration contributed more to fatigue damage than the torsional mode vibration. Kim et al. [5] compared the fatigue damage of the cases with and without vibration by analyzing full-scale measurements of a 9400 TEU container ship. The fatigue damage increased by approximately 70–85% owing to vibrations, particularly in the vertical bending mode. Kim et al. [6] investigated the effect of torsional vibration on fatigue damage due to the longitudinal stress of a 13,000 TEU container ship. It was found that the effect of vertical bending stress was dominant in the high-frequency fatigue damage, and the effects of the horizontal bending and warping stresses were small. Storhaug et al. [7] assessed two post-Panamax container ships (8600 and 8400 TEU) with focus on the vibration contribution to fatigue and the extreme loading from torsional vibration. The effect of torsional vibration on fatigue damage ranged from 14% to 16% for an 8600 TEU container ship. In contrast, the effect of torsional vibration on fatigue damage increased to approximately 52% to 55% for an 8400 TEU container ship. The effect of torsional vibration on fatigue damage differs depending on the ship. Therefore, further study is required regarding torsional vibration.
Consequently, in this research, we conducted a full-scale measurement of an 8600 TEU container ship for approximately five years, where the hull longitudinal stresses at various locations were measured in combination with ship speed, ship position, ship direction angle, and other conditions. [8,9]. Wave forecast data corresponding to the ship position were also obtained from the Japan Meteorological Agency. We performed a preliminary analysis of the huge amount of data and observed the relationship between the whipping magnitude and the corresponding sea state and ship operational data such as ship speed and relative wave direction. Based on the observation results, we can identify the sea and ship conditions that induce excessive whipping responses, thus supporting the safe operation of large container vessels in the future.
In addition, in most cases of the referenced literature, it was reported that torsional vibration had little effect on fatigue damage, and the effect of vertical bending was dominant. However, in some cases, the effect of torsional vibration is not negligible, and there are still some unknown factors. Therefore, in this study, the influence of torsional vibration was investigated from the vast quantity of measurement results over five years. For this purpose, we decomposed the longitudinal stresses into vertical bending stress, horizontal bending stress, warping stress due to torsion, and axial stress, using the longitudinal stresses at the four corners of the midship section. Then, the whipping responses in the torsional mode were investigated quantitatively in detail.

2. Full-Scale Measurement

2.1. Sensor Arrangement and Data Obtained Onboard
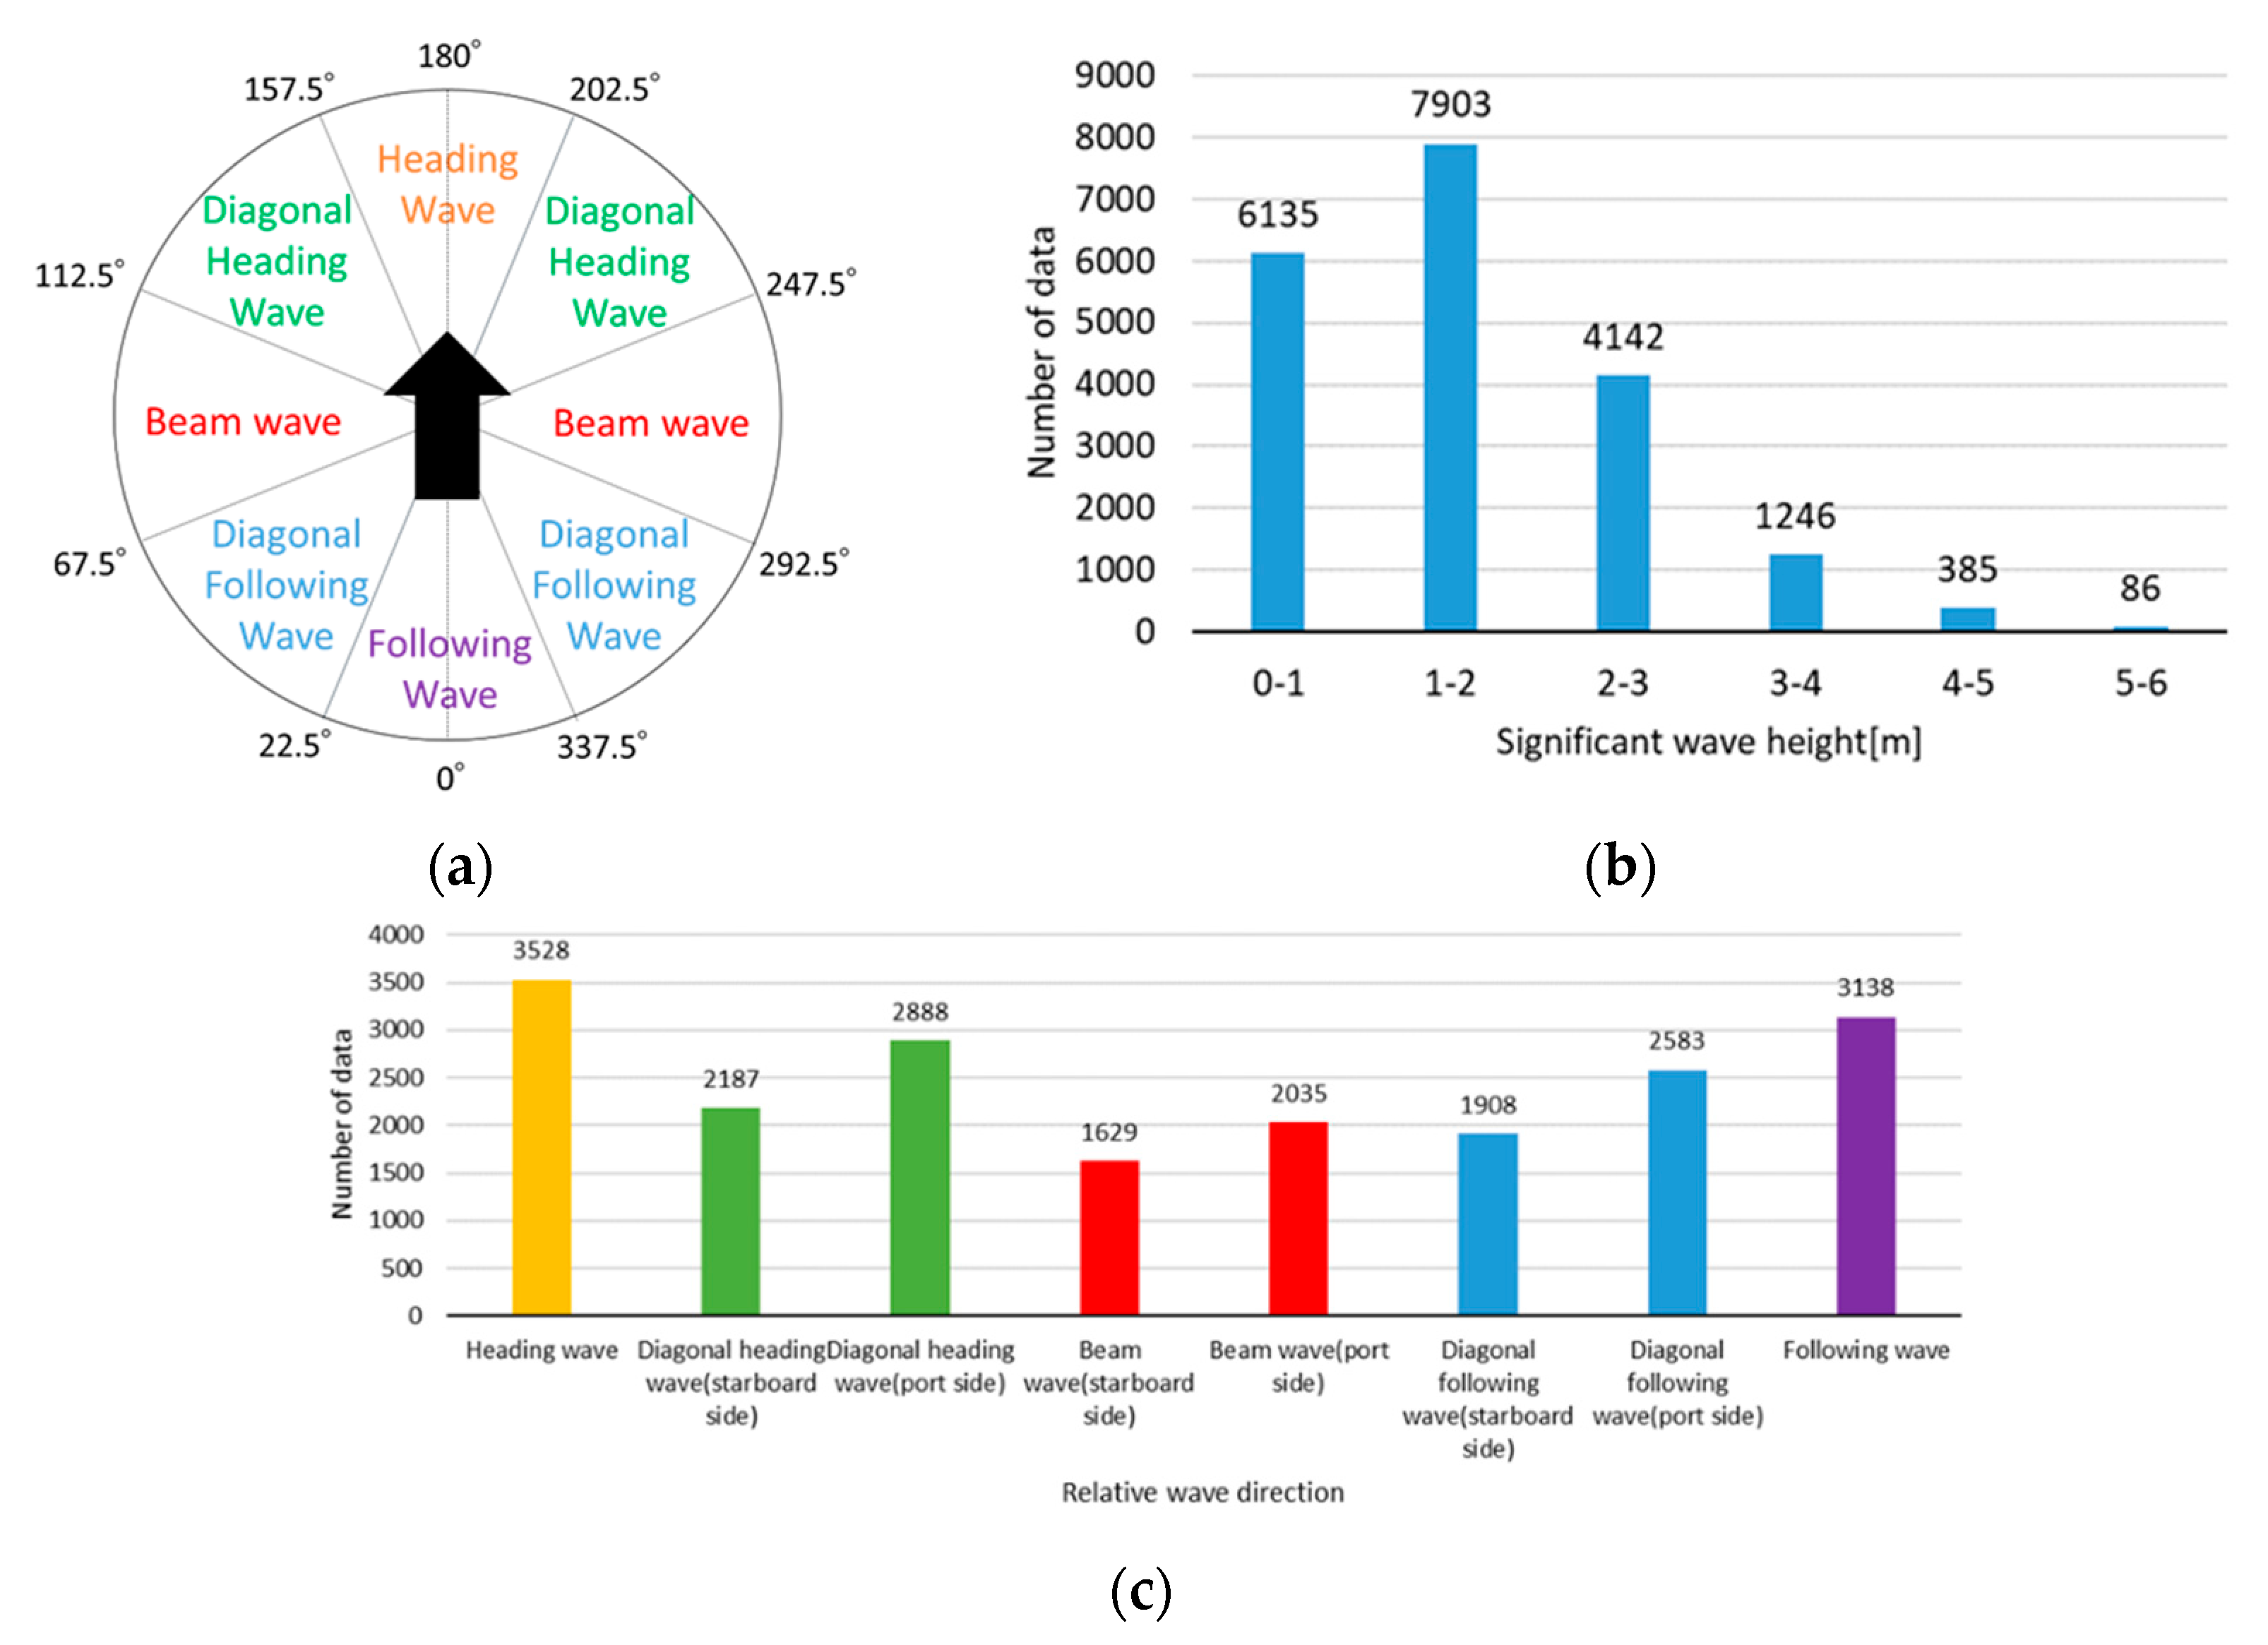
The target ship of our full-scale measurement is an 8600 TEU container ship with overall length of approximately 335 m, breadth of 45.6 m, depth of 24.4 m, and maximum service speed of 24.5 kt, as listed in Table 1. The stresses were measured at 12 points, as shown in Figure 1, and the details are included in Table 2. In this study, we employed the stresses measured at the midship four corners (shown in blue points) for further analysis. The sampling frequency of the stress measurement was 20 Hz. In addition to the stress data, the ship’s speed and direction were recorded in the onboard monitoring data.

2.2. Weather Data

The significant wave height, average wave period, and wave direction were obtained from the wave forecast data provided by the Japan Meteorological Agency. These data are used to assess the relationship between the whipping factors and sea state.

3. Data Analysis Methodology

3.1. Method of Analysis of the Whipping Factor

To quantitatively evaluate the whipping response generated on the hull, the whipping factor γ is calculated for every one-hourly stress time-series data point. The whipping factor is given by Equation (1), and is defined as the ratio of the maximum expected value of the raw stress time-series data, including the whipping response component, to the maximum expected value of the wave response component, excluding the whipping response component [10].
γ = σ r , 1 / 1000 σ w , 1 / 1000
where
σ r , 1 / 1000 : 1/1000 maximum expected value of raw data of the stress time series
σ w , 1 / 1000 : 1/1000 maximum expected value of the wave response component
σ r , 1 / 1000 and σ w , 1 / 1000 are calculated in accordance with the flow chart shown in Figure 2. Each step of the flowchart is explained as follows:
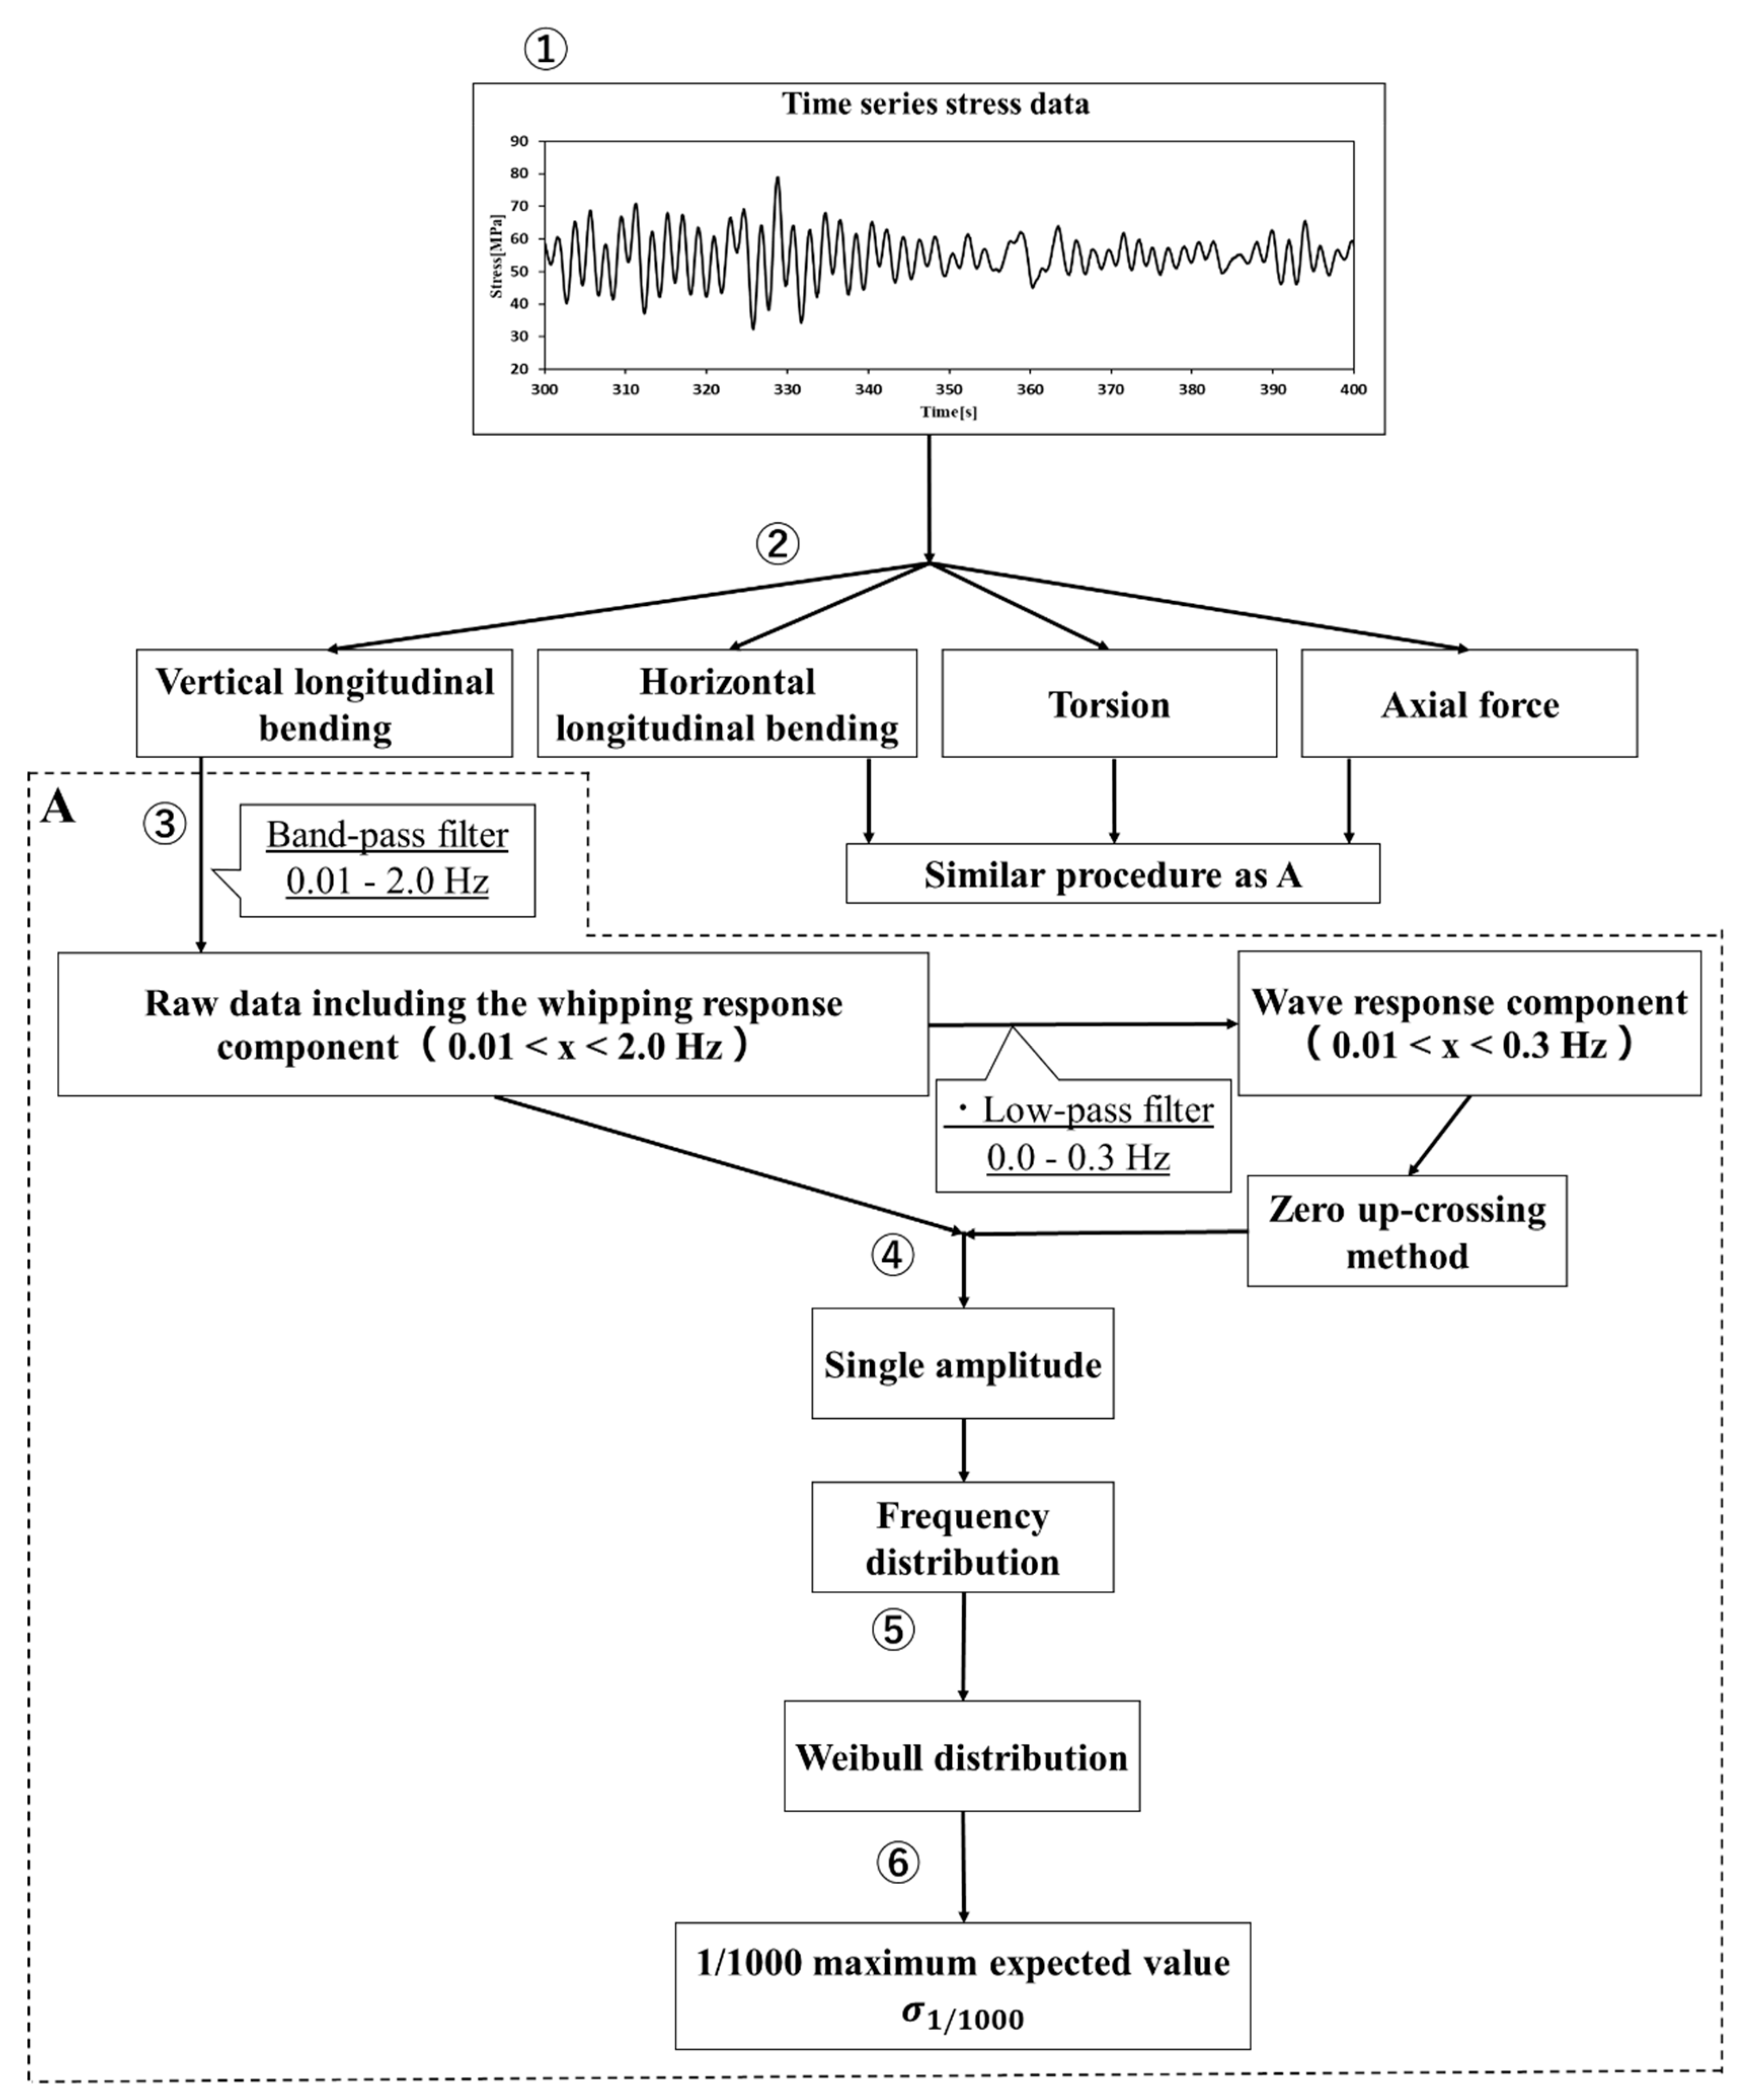
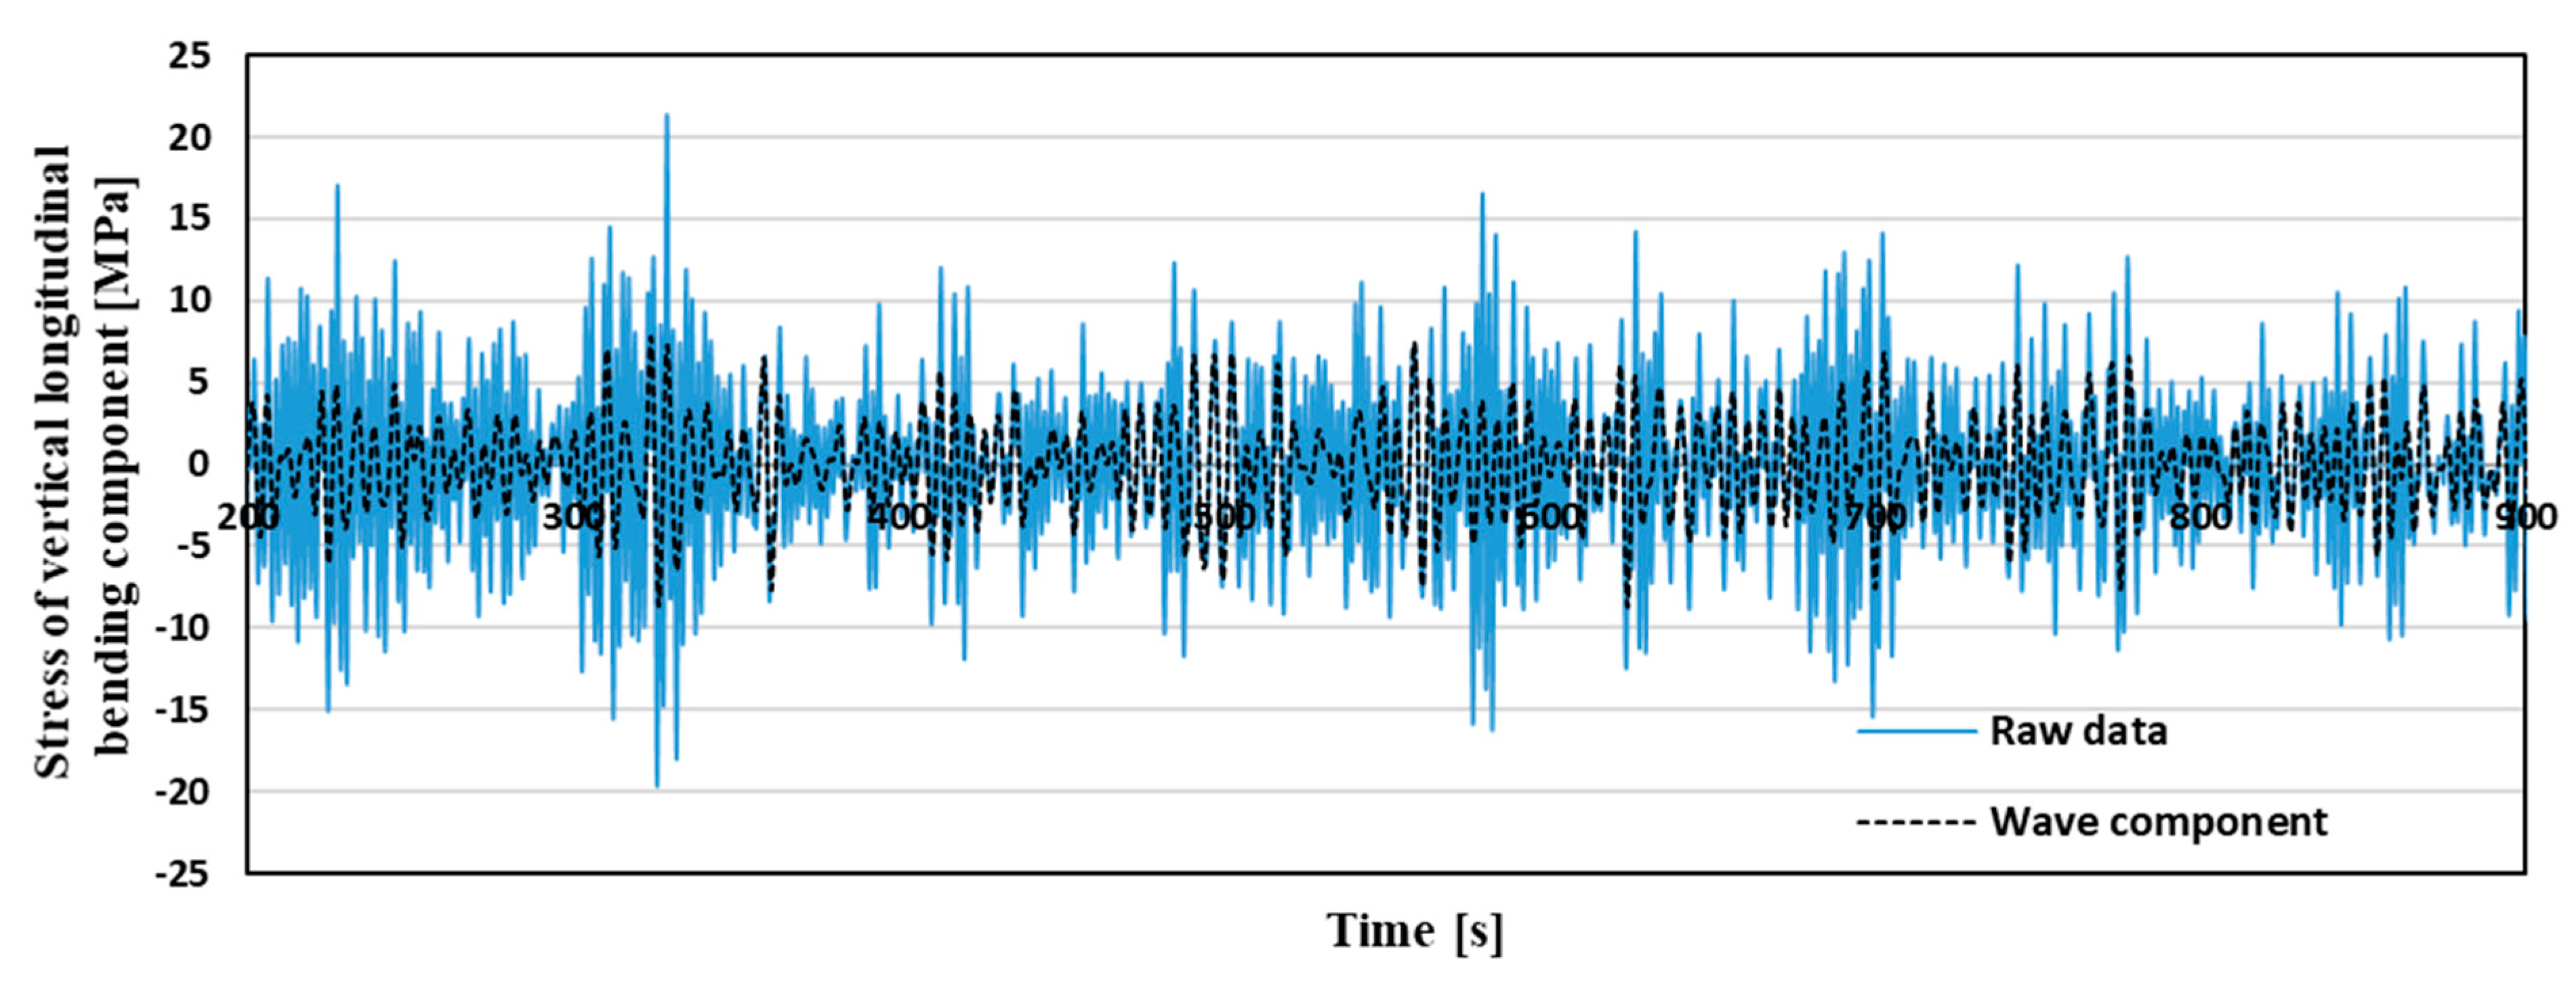
  • Time-series stress data measured at the four corners of the midship are prepared. An example of the time-series data is shown at the top of Figure 2.
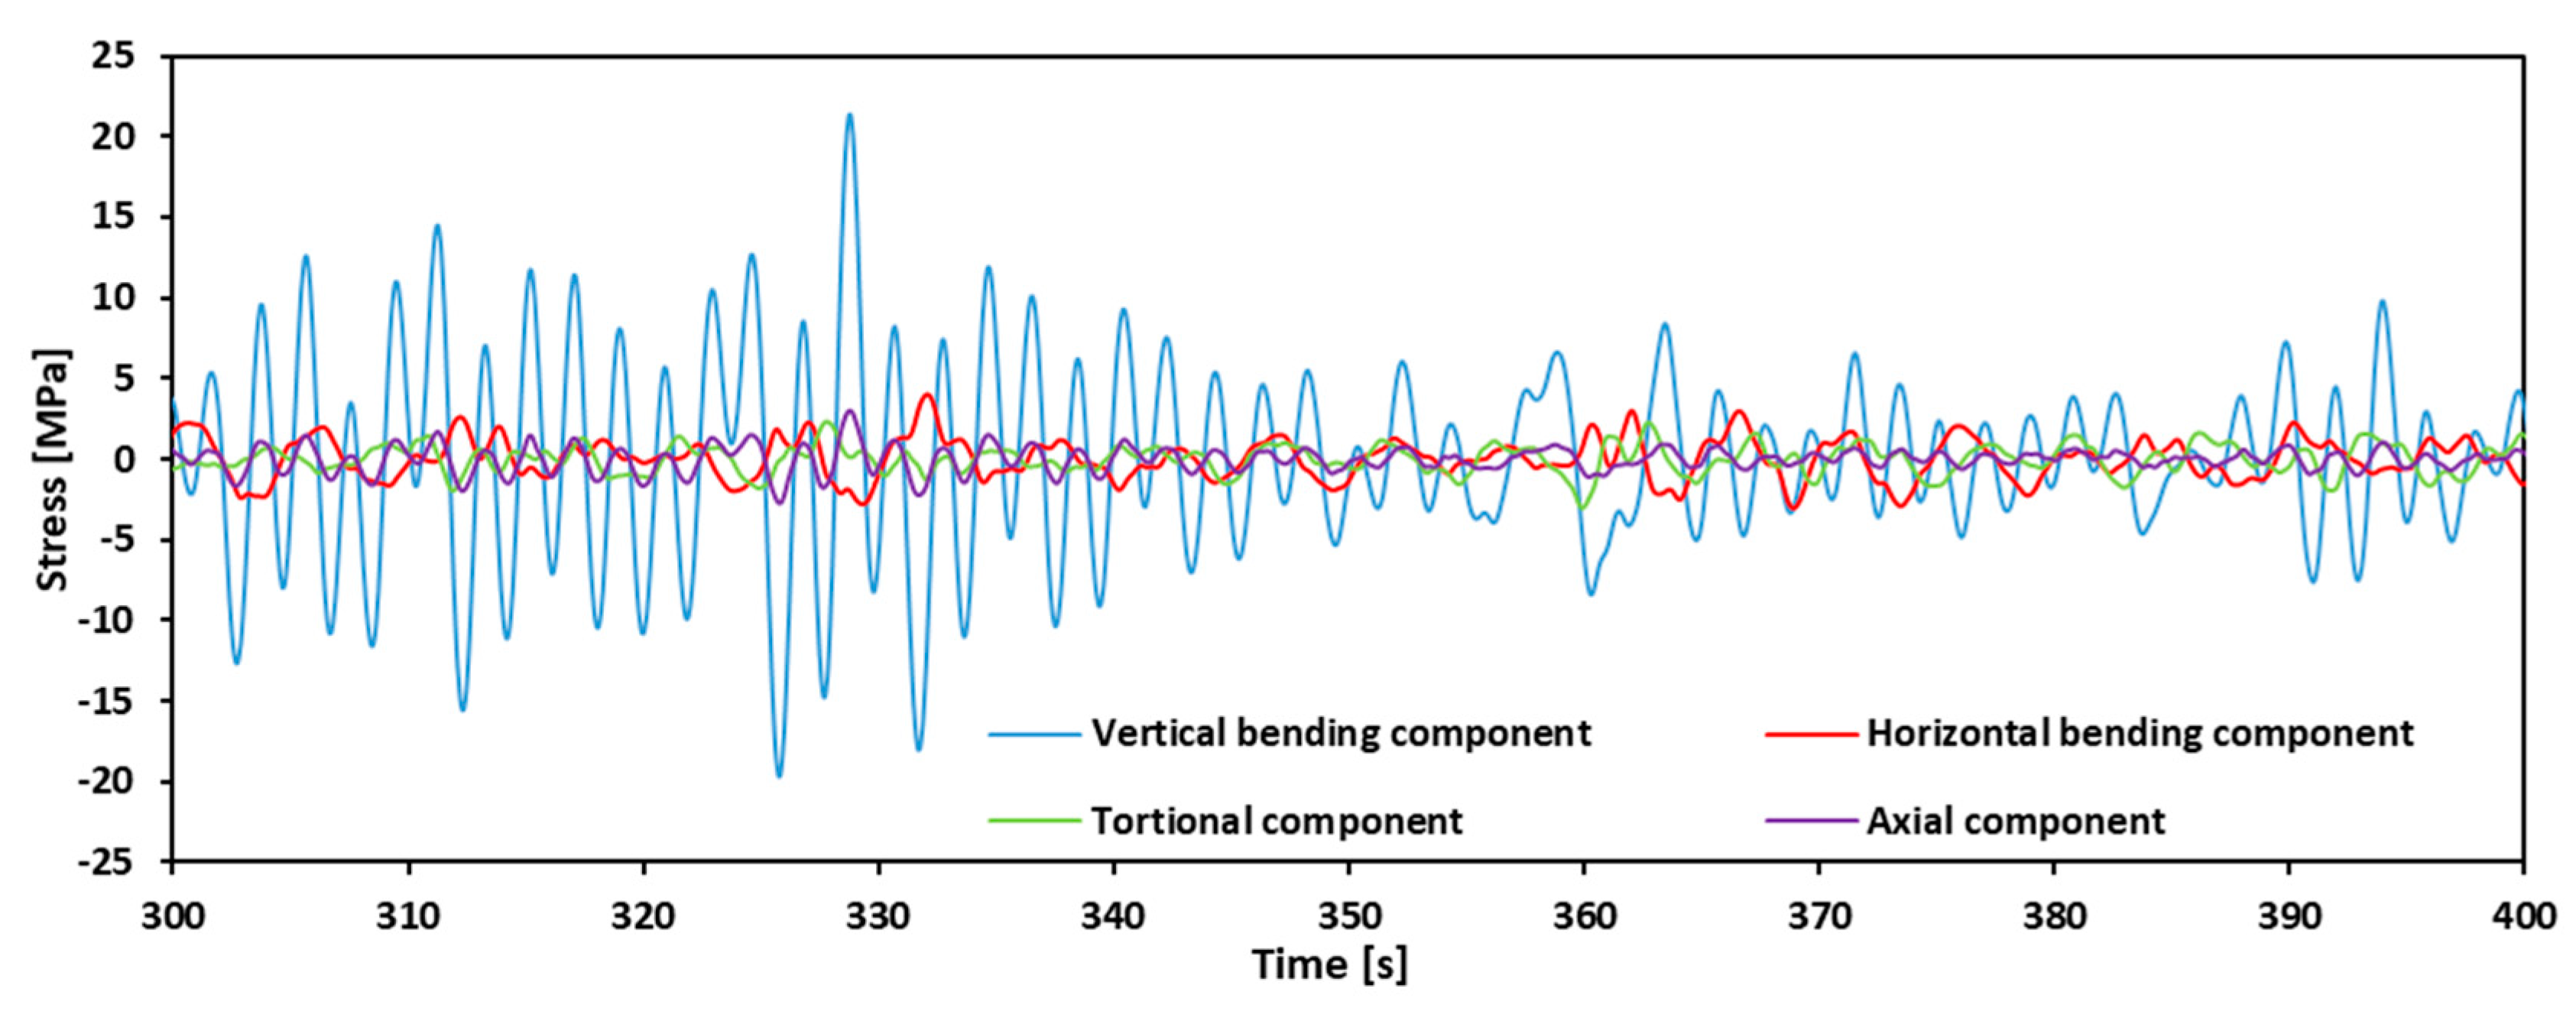
  • The time-series data is decomposed into four components: vertical bending, horizontal bending, torsion, and axial force. An example of the decomposed time-series data is shown in Figure 3.
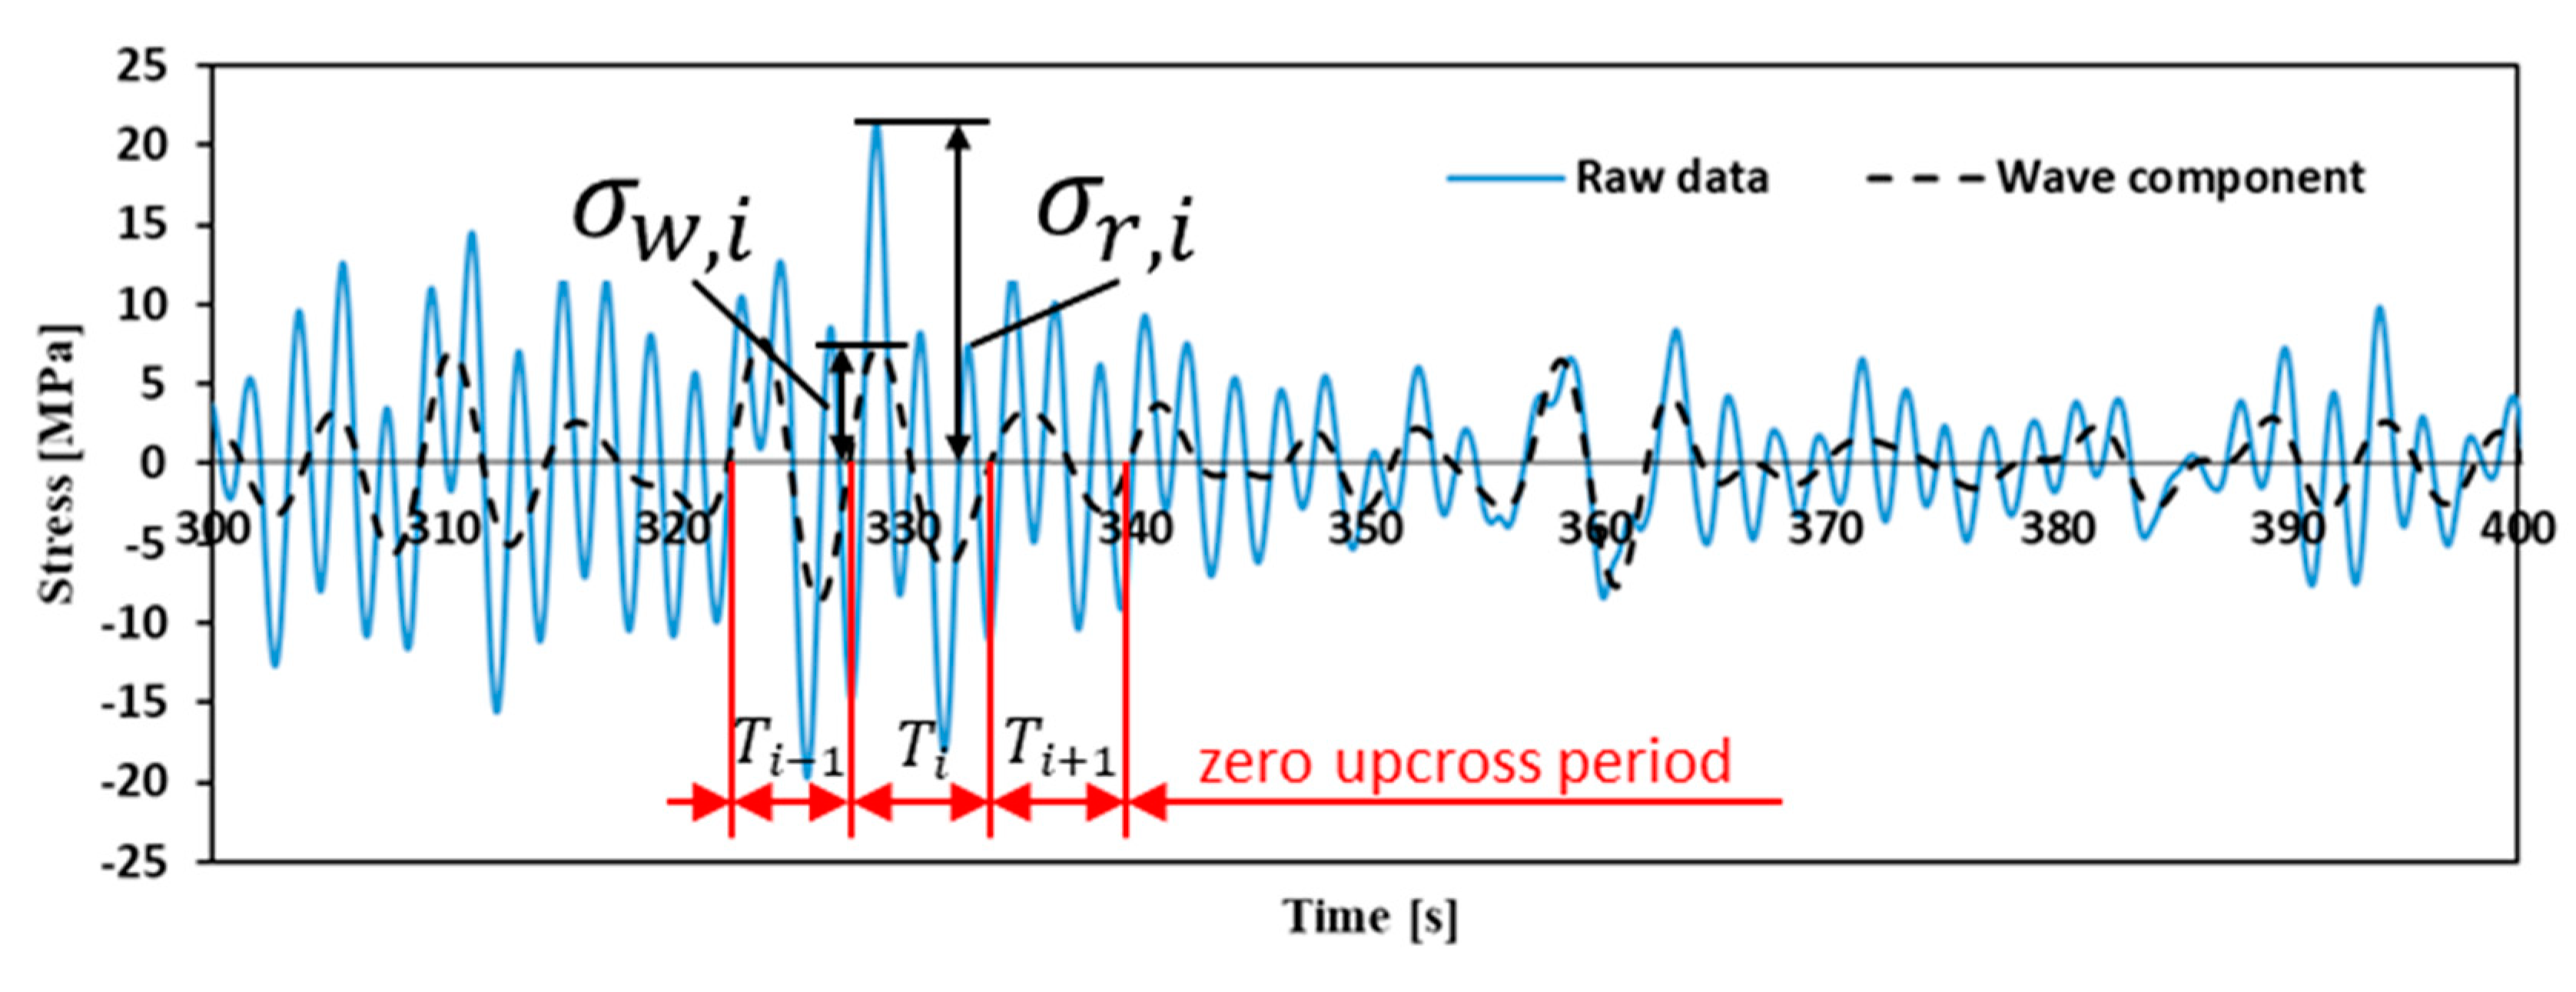
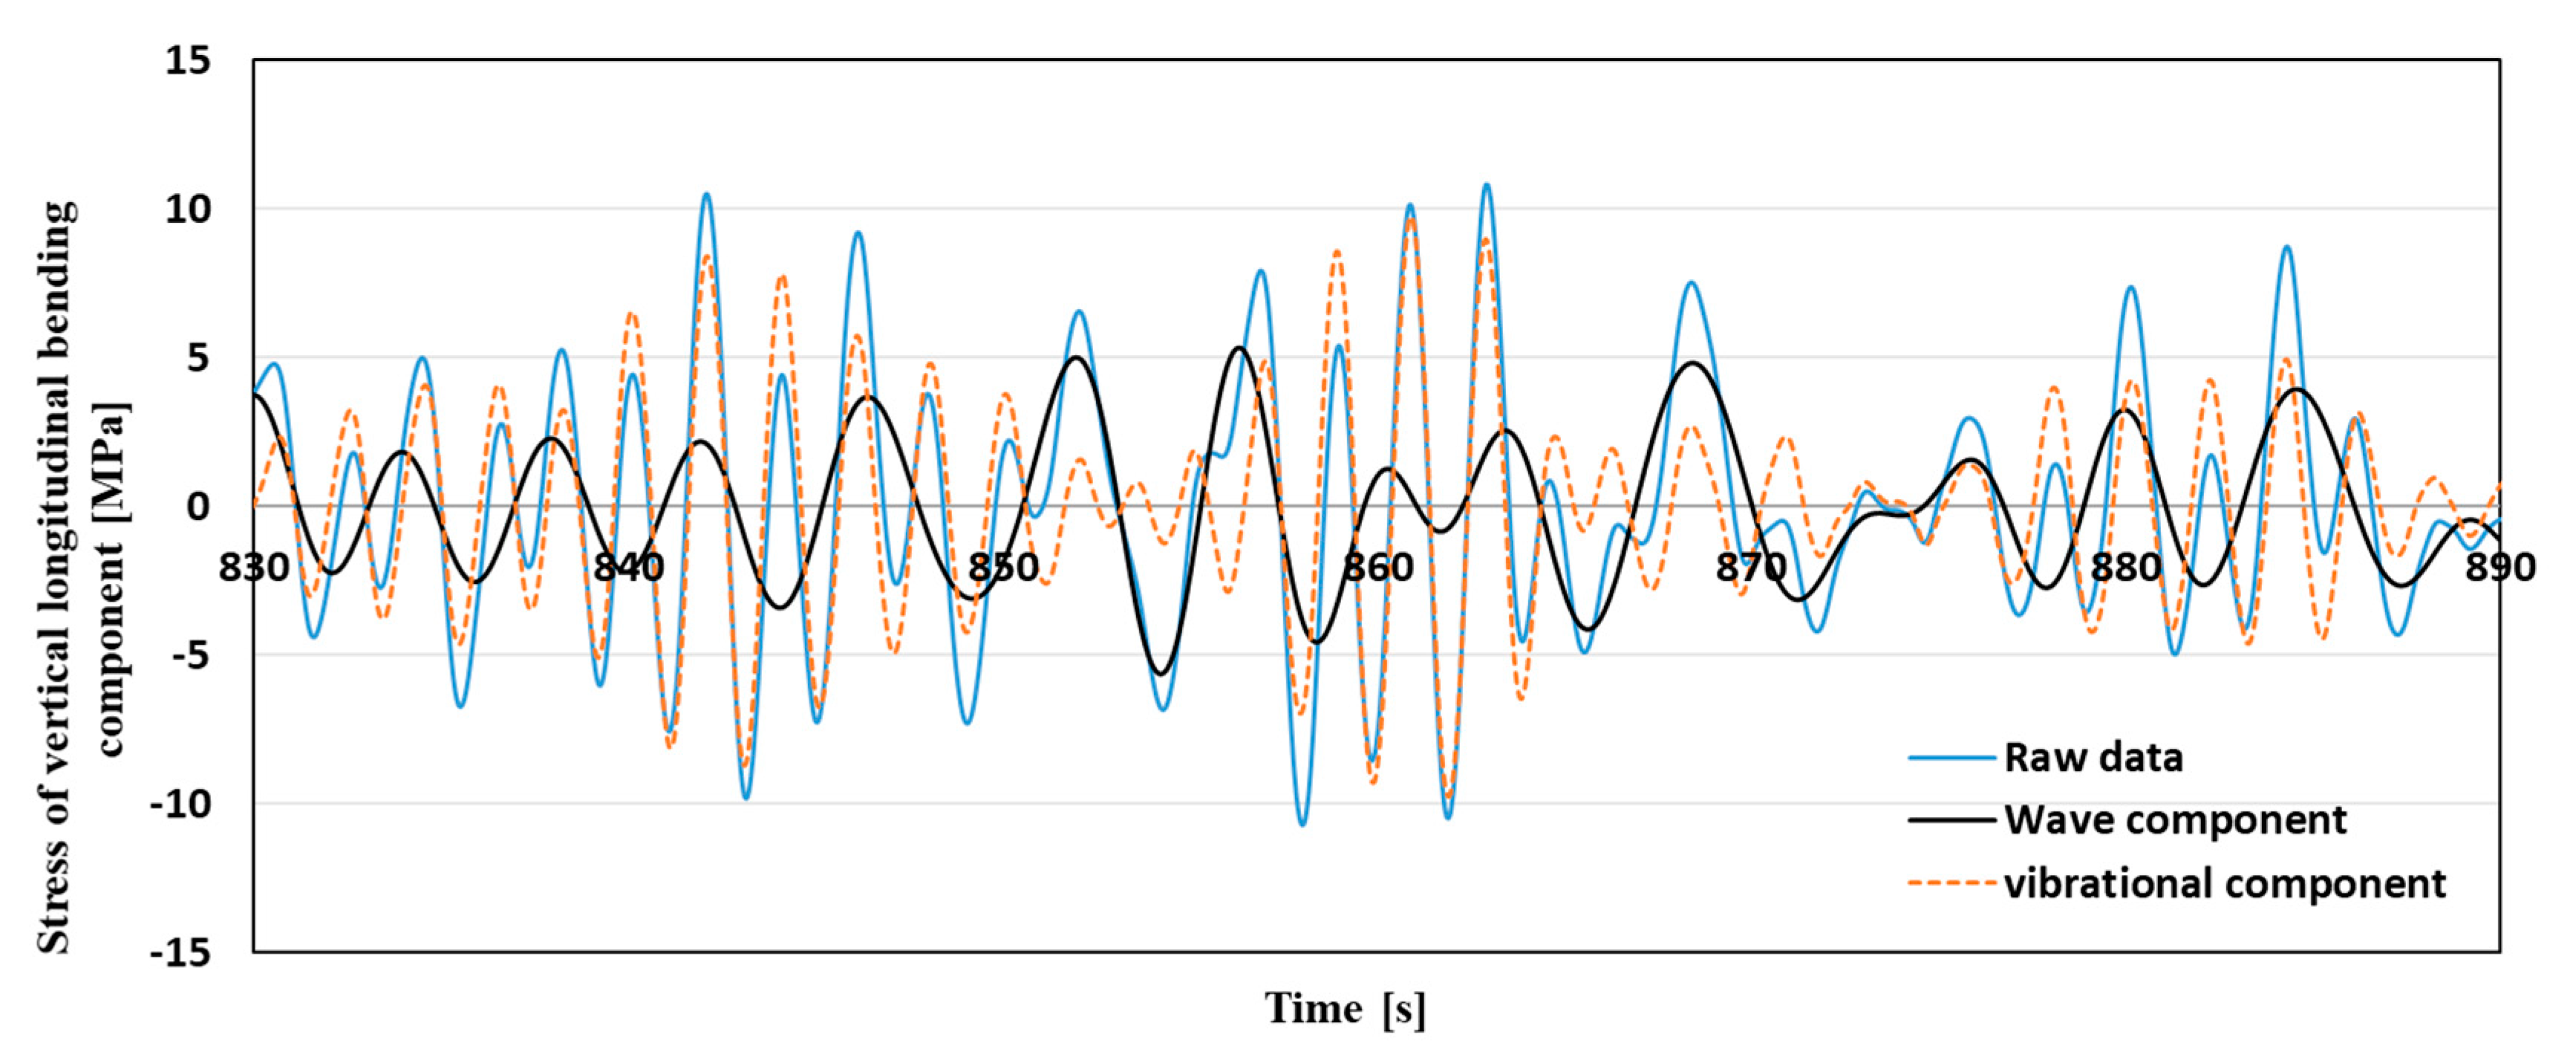
  • From the four time-series stress data obtained, a low-frequency component, less than 0.01 Hz, and a high-frequency component, greater than 2.0 Hz, are removed by a band-path filter to remove the mean value drift and noise. The obtained time-series stress data, including the frequency range of 0.01–2.0 Hz, are used as the raw data. Then, a low-pass filter is applied to the raw data with a cutoff frequency of 0.3 Hz to obtain the wave response component. An example time series of the raw data and the extracted wave component are included in Figure 4 to show how the low-frequency component is decomposed from the raw data.
  • For the obtained wave response component, the zero up-crossing period is determined using the zero up-cross method, and the peak value, σw,i, in hogging is determined for each period i. The peak value of the raw data, σr,i, is also determined for the same period obtained from the zero up-crossing of the wave response component. This procedure is illustrated in Figure 4.
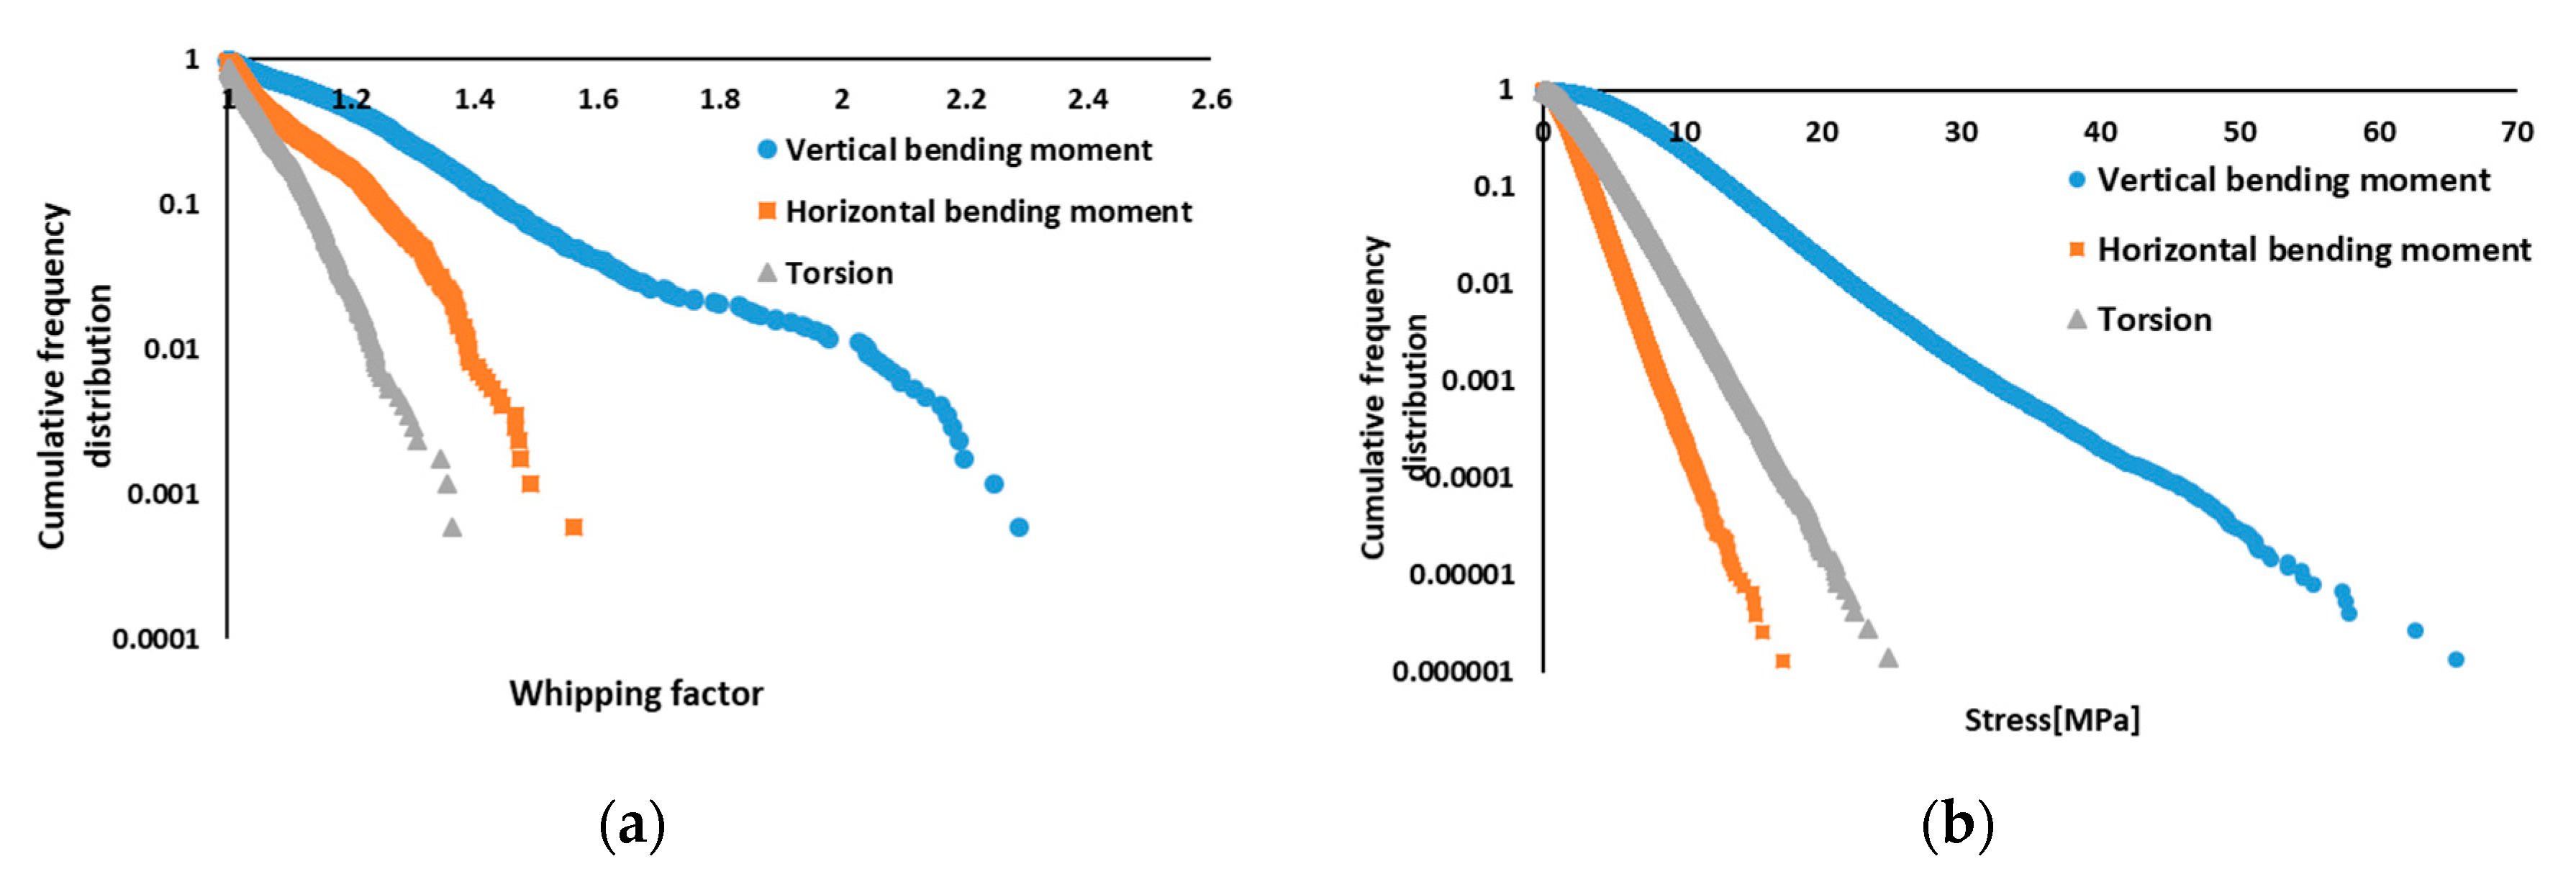
  • These single-amplitude extrema, both for the wave response component and for the raw data, are statistically represented in the frequency distribution, and are approximated by the Weibull distribution. Weibull fitting is performed using the least squares method on the data of the top 20% of the single-amplitude extrema. Each curve shown in Figure 5 was obtained using the Weibull approximation.
  • Then, 1/1000 maximum expected values are calculated for both the wave response component and the raw data, as shown in Figure 5. Finally, as depicted, the whipping factor is calculated by taking the ratio of the 1/1000 maximum expected value of the raw data to the 1/1000 maximum expected value of the wave response component.

3.2. Decomposition of Stress into Four Components

Let us assume that σ D M S σ B M P are the measured stresses at the four corners of the midship, as shown below:
σ D M S : Time-series stress data on the starboard side, upper deck
σ D M P : Time-series stress data on port side, upper deck
σ B M S : Time-series stress data on the starboard side and bottom
σ B M P : Time-series stress data on port side, bottom
Then, they can be expressed by a linear combination of the four components of hull girder stresses, that is, the vertical longitudinal bending, horizontal longitudinal bending, warping, and axial stresses, as shown in Equations (2)–(5).
σ D M S = σ V σ H σ W + σ A
σ D M P = σ V + σ H + σ W + σ A
σ B M S = α σ V σ H + β σ W + σ A
σ B M P = α σ V + σ H β σ W + σ A
where
σ V : Vertical longitudinal bending component
σ H : Horizontal longitudinal bending component.
σ W : Torsional component
σ A : Axial force component
α , β : Decomposition coefficient
By writing Equations (2)–(5) in matrix form and solving it for the vector [ σ V , σ H , σ W , σ A ]T, Equation (6) is obtained [11].
[ σ V σ H σ W σ A ] = [ 1 1 1 1 1 1 1 1 α 1 α 1 β 1 β 1 ] 1 [ σ D M S σ D M P σ B M S σ B M P ]
α is the decomposition coefficient for the vertical longitudinal bending component, which is represented by the ratio of the vertical distance between the bottom measurement point and the neutral axis to the vertical distance between the upper deck measurement point and the neutral axis of the ship. β is the decomposition coefficient for the torsional component and was obtained by vibrational eigenmode analysis using an entire ship FEM model. In the case of this ship, α = 0.614 and β = 0.933 were applied.

4. Results of Whipping Factor Analyses for Each Stress Component

The total number of short-term (one-hourly) data points during the measurement period of approximately five years was 31,416. Among these, some data were excluded when the ship changed its course by more than 15° or when the ship changed its speed by more than 2 kt within 1 h. Because of this exclusion, we performed a whipping factor analysis for 19,897 one-hourly data points in total. The relative wave direction is divided into five categories, as shown in Figure 6a, and each short-term data set was classified into one of the categories.
To clarify the details of the data used in the analysis, the data after exclusion, the relative wave direction, and the significant wave height are summarized in Figure 6b,c. Figure 6b shows the frequency distribution of the significant wave height data. From this figure, it is observed that approximately 91% of the data were in the wave height of less than 3 m. Therefore, this ship was navigating in relatively calm sea conditions. Figure 6c shows the frequency distribution of the relative wave direction data. We can observe that the ship navigated in head or following seas more frequently than in other relative wave directions. In addition, when the sea state is relatively calm, it is known that springing becomes dominant rather than whipping, and the calculated whipping factor becomes large due to the small magnitude of the wave response component. Therefore, we focused on the 1717 short-term sea state data points where the significant wave height was 3.0 m or more, although all the sea states, including benign seas, are included in the tables.
Table 3 and Table 4 present the average whipping factors for these components, respectively, calculated for the sea states categorized into each significant wave height and average wave period range, in a manner similar to that employed in ref. [12]. The figures in parentheses are the number of one-hourly data points with the corresponding significant wave height and mean wave period. Because the vertical bending response is known to be prominent in head seas, and the torsional and horizontal bending responses are known to be prominent in bow quartering seas, these tables summarize the whipping factors in head and bow quartering seas only.
From these tables, the whipping factor is observed to be larger in the vertical longitudinal bending component than in the torsional and horizontal longitudinal bending components, in both the bow quartering and head seas.

5. Analyses and Discussion of the Whipping Factor

5.1. Comparison Results of the Vertical Bending, Torsional, and Horizontal Bending Components

In Section 4, we showed the average whipping factor in each component under head or bow quartering seas as the analysis results. In this section, we will compare each stress component in detail. Figure 7a shows the cumulative frequency distribution of the whipping factor of the data with a significant wave height of 3.0 m or higher. It can be observed in Figure 7a that the maximum value of the whipping factor is approximately 2.35 in the vertical longitudinal bending component. However, the maximum values of the whipping factor in the torsional and horizontal bending components reached only approximately 1.4 and 1.6, respectively, and were mostly small. It transpires that the whipping factor in the torsional and horizontal bending components is considerably smaller than that in the vertical longitudinal bending component.
Figure 7b shows the exceedance probability distribution of the longitudinal stress peak values of the raw data with a significant wave height of 3.0 m or higher. The vertical bending, horizontal bending, and torsional components are plotted in this figure. It is observed that the torsional component is approximately one-third of the vertical longitudinal bending component. Therefore, the torsional component in whipping is not large. Moreover, it is observed that the horizontal bending component is approximately one-fifth of the vertical longitudinal bending component. Therefore, its influence is considered to be considerably small. From these results, it was found that the torsional and horizontal bending components in whipping were not dominant.
These results may be because the wave impact pressure works in the vertical direction and the action position is not so far from the hull centerline, so that torsion and horizontal loads are not induced significantly.

5.2. Discussion on the Vertical Longitudinal Bending Component

From Section 5.1, it was found that the vertical longitudinal bending component is dominant in elastic vibration. Therefore, it is important to investigate the correlation between whipping in the vertical longitudinal bending component and the sea state and ship operational conditions. Figure 8a shows the correlation between the whipping factor and the mean wave period, Figure 8b presents the correlation between the whipping factor and ship speed, and Figure 8c shows the correlation between the whipping factor and the encounter wave period. In each figure, the data with different relative wave directions are distinguished with different marker colors, with linear regression results shown with solid straight lines.
As shown in Figure 8a, there is a slight downward trend in the head, beam, and following waves. The slope of the approximately straight line is smaller in the case of beam waves than in the other cases. In the head and following seas, the wave period corresponding to the wave length equal to the ship length causes a greater hull girder wave-induced bending moment. In the case of this ship, it is approximately 14 s. Therefore, we can observe the tendency of the whipping factor to decrease toward a wave period of 14 s because of the larger wave response component. Under beam seas, such effects cannot be expected, and this may explain the smaller slope of the regression curve for the beam sea. In Figure 8c, the plot points shift to the left in the head waves and shift to the right in the following waves compared with those in Figure 8a. By plotting the data for the encounter wave period, it was more apparent that the whipping factor tended to decrease when the encounter wave period increased. Next, looking at Figure 8b, in the head wave, the whipping factor increased as the ship speed increased, and the correlation was positive, with a correlation coefficient of 0.452. In addition, in the case of the beam and following waves, the approximately straight line is level or descends, and the whipping factor also decreases as the ship speed increases. The correlation coefficients were 0.149 and −0.085, respectively. It is considered that this occurs because the impact from the seawater applied to the bow becomes stronger as the ship speed increases in the head sea, but, in contrast, it becomes milder in the following sea.
In the vertical bending component, the whipping factor was found to exceed 2.0 in some cases. To determine the mechanism to induce such a large whipping factor, we made a close-up observation of those data. Table 5 includes the sea state in which the whipping factor of 2.199 was calculated. As presented here, the ship navigated in head seas with a forward speed of 19 kt. Figure 9 shows the longitudinal bending stress time series, showing occasionally large whipping responses. The Weibull distribution plot of the peak values is shown in Figure 10, where we can observe the large whipping factor.
For a close-up observation of the time-series response when the large whipping was observed, Figure 11 shows the time zone in which the stress was maximum in the time-series stress data shown in Figure 9. The vibrational component is also plotted in the figure. The vibrational component is defined as the high-frequency response within 0.3–2.0 Hz, which is obtained by subtracting the wave component from the raw data. The figure shows that at approximately 310 s, whipping occurred and the amplitude of the vibrational component increased due to the impact force of the waves. Thereafter, it attenuated until 325 s, following which, the vibrational response suddenly increased again at approximately 328 s, presumably due to the impact of a large wave, which excited the bow part accidentally in the phase to accelerate the existing whipping response.
Next, we look at another time zone in the same one-hourly short-term data in Figure 12. It can be seen from this figure that, at approximately 858 s, whipping occurred and the amplitude of the vibrational component increased due to the impact force of the waves. From 861 s, it attenuated, but thereafter, the vibrational response suddenly decreased at approximately 865 s, presumably due to the impact of a wave, which acted in the bow direction in the antiphase to reduce the whipping response.
These phenomena were observed several times within this one-hour short-term period. The number of occurrences of the whipping response was evaluated through visual observation of the time-series data, and it was 68, where 11 of these occurrences were the superposition phenomena and 13 of these occurrences were the phenomena of cancellation. These percentages were approximately 13% and 19%, respectively, showing quite frequent chances of such superposition or cancellation of whipping to the existing free decay vibration.
It was confirmed that this whipping superposition phenomenon also occurred in other short-term sea conditions, and the whipping factor in these cases was relatively large.

6. Conclusions

In this study, we analyzed the measured hull girder longitudinal stresses onboard an 8600 TEU container ship to reveal the whipping behavior. We decomposed the longitudinal stresses at the four corners of the midship into the vertical bending, horizontal bending, torsional, and axial force components. Then, the whipping factors were calculated for each one-hour sea state with regard to the vertical bending, torsional, and horizontal bending components. The following findings were drawn from this study:
  • It was found that the whipping factors in the torsional and horizontal bending components were much smaller than the whipping factors in the vertical longitudinal bending component. In addition, the magnitude of the torsional component was approximately one-third of the vertical bending component, and the magnitude of the horizontal bending stress was approximately one-fifth of the vertical bending stress in terms of raw data extreme values. Thus, it is considered that the torsional and horizontal bending stresses have considerably less influence on the whipping than the vertical longitudinal bending stress.
  • We studied the correlation between the whipping factors of the vertical bending component and the corresponding sea state and ship operational conditions. As a result, it was found that the whipping factor slightly decreased as the wave period increased. In addition, the whipping factor tends to be larger in head seas, and larger ship speeds result in greater whipping factors in head seas. In contrast, a larger ship speed does not affect or even slightly reduces the whipping factor in following seas.
  • Excessively large whipping is sometimes observed due to successive wave impact that accidentally accelerates the existing whipping vibration of the hull girder. Conversely, when whipping works to cancel the vibrational component, the vibrational component may suddenly decrease.
This study remains a preliminary data analysis. We focused on the response at the midship section, where the longitudinal stress tends to be maximum, and therefore, is the most critical. As the next step, we plan to analyze the measured stress data in the fore and aft sections. To precisely reveal the whipping responses and identify their effect on the ultimate strength of the hull girder and hull fatigue strength, it is necessary to analyze an even larger number of measured data points to distinguish between whipping and springing, to examine their effect on the hull strength, and to investigate accurate estimation methods of whipping

Author Contributions

Conceptualization, T.M. and T.O. Resources (measured data preparation), T.M. Software, R.H. and T.M. Validation, R.H., T.O., Y.K., and T.M. Formal analysis, R.H. and T.M. Investigation, R.H. and T.M. Writing—original draft preparation, R.H. Writing—review & editing, T.O. and Y.K. Visualization, R.H. Supervision, T.O. and Y.K. Project Administration, T.O. All authors have read and agreed to the published version of the manuscript.

Funding

This work was partly supported by JSPS KAKENHI, Grant Number 18H01637.

Acknowledgments

We would like to thank Editage (www.editage.com) for English language editing.

Conflicts of Interest

The authors declare no conflicts of interest.

References

  1. Okada, T.; Takeda, Y.; Maeda, T. On board measurement of stresses and deflections of a post-panamax containership and its feedback to rational design. Mar. Struct. 2006, 19, 141–172. [Google Scholar] [CrossRef]
  2. Sumi, Y.; Fujikubo, M.; Fujita, H.; Kawagoe, Y.; Kidogawa, M.; Kobayashi, K.; Nakano, T.; Iwano, J.; Takahira, T.; Tamura, K. Final Report of Committee on Large Container Ship Safety; Committee on Large Container Ship Safety: Japan, 2015. [Google Scholar]
  3. ClassNK. Investigation Report on Structural Safety of Large Container Ships; The Investigation Panel on Large Container Ship Safety: Japan, 2014. [Google Scholar]
  4. Ki, H.G.; Park, S.G.; Jang, I.H. Full scale measurement of 14k TEU containership. In Proceedings of the 7th International Conference on Hydro elasticity in Marine Technology, Split, Croatia, 16–19 September 2015; pp. 311–328. [Google Scholar]
  5. Kim, Y.; Kim, B.H.; Choi, B.K.; Park, S.G.; Malenica, S. Analysis on the full-scale measurement data of 9400TEU container carrier with hydroelastic response. Mar. Struct. 2018, 61, 25–45. [Google Scholar] [CrossRef]
  6. Kim, Y.; Kim, B.H.; Park, S.G.; Choi, B.K.; Malenica, S. On the torsional vibratory response of 13000 TEU container carrier – full scale measurement data analysis. Ocean Eng. 2018, 158, 15–28. [Google Scholar] [CrossRef]
  7. Storhaug, G.; Kahl, A. Full scale measurements of torsional vibrations on Post-Panamax container ships. In Proceedings of the 7th International Conference on Hydroelasticity in Marine Technology, Split, Croatia, 16–19 September 2015. [Google Scholar]
  8. Miyashita, T.; Okada, T.; Seki, N.; Kawamura, Y. A comparative study of whipping response of a large container ship based on numerical analysis and full-scale measurements. In Proceedings of the 32nd Asian-Pacific Technical Exchange and Advisory Meeting on Marine Structures (TEAM 2018), Wuhan, China, 15–18 October 2018; pp. 510–517. [Google Scholar]
  9. Miyashita, T.; Okada, T.; Seki, N.; Kawamura, Y.; Hanada, R. Statistical characteristics of whipping response of a large container ship under various sea states and navigational conditions based on full-scale measurements. In Proceedings of the 14th International Symposium on Practical Design of Ships and Other Floating Structures (PRADS 2019), Yokohama, Japan, 22–26 September 2019. [Google Scholar]
  10. Kawabe, H.; Shigemi, H.; Matsumoto, T.; Ishibashi, K.; Toyoda, K. Quantitative estimation method for vertical wave-induced bending moments of very large container ships in consideration of the effects of whipping. J. Jpn. Soc. Nav. Archit. Ocean Eng. 2016, 22, 477–482. [Google Scholar]
  11. Nitta, A.; Yuasa, M. Measurements and long-term predictions on the longitudinal strength of container ship. J. Soc. Nav. Archit. Jpn. 1977, 141, 160–166. [Google Scholar] [CrossRef]
  12. Niki, R.; Chen, X.; Okada, T.; Kawamura, Y.; Higashimoto, M. Whipping response evaluation based on monitoring data of 14,000TEU large container ships. J. Jpn. Soc. Nav. Archit. Ocean Eng. 2018, 26, 275–280. [Google Scholar]
Figure 1. Stress measurement points (orange and blue circles are measurement points). (a) Top view and side view, (b) sectional view of the starboard side at the midship.
Applsci 10 02978 g001
Figure 2. Data analysis flowchart.
Applsci 10 02978 g002
Figure 3. Time-series stress data of raw data after separation of the four components.
Applsci 10 02978 g003
Figure 4. Time-series stress data of the vertical bending component after filtering.
Applsci 10 02978 g004
Figure 5. Weibull approximation and 1/1000 maximum expected value.
Applsci 10 02978 g005
Figure 6. (a) Classification of the relative wave directions, (b) frequency distribution of the significant wave height, (c) frequency distribution of the relative wave direction.
Applsci 10 02978 g006
Figure 7. (a) Cumulative frequency distribution of whipping factor (H1/3 > = 3.0 m), (b) exceedance probability distribution of longitudinal stress (H1/3 > = 3.0 m).
Applsci 10 02978 g007
Figure 8. Comparison of whipping factor and (a) mean wave period, (b) ship speed, (c) encounter wave period.
Applsci 10 02978 g008aApplsci 10 02978 g008b
Figure 9. Time-series stress data of the vertical longitudinal bending component.
Applsci 10 02978 g009
Figure 10. Weibull distribution plot of the peak values of raw data and wave response component of one-hourly data.
Applsci 10 02978 g010
Figure 11. Time-series stress data during 290–350 s of the vertical longitudinal bending component.
Applsci 10 02978 g011
Figure 12. Time-series stress data during 830–890 s of the vertical longitudinal bending component.
Applsci 10 02978 g012
Table 1. Main specifications of the container ship used in this study.
LOA334.5 m
Breadth45.6 m
Depth24.4 m
Design Draft14.0 m
Gross Tonnage97,000 ton
Max. service speed24.5 knot
Table 2. Location details of each strain sensor.
DFP/DFSDeck at fore port/starboard
BFP/BFSLower longitudinal bulkhead at fore port/starboard
DMP/DMSDeck at midship port/starboard
BMP/BMSLower longitudinal bulkhead at midship port/starboard
DAP/DASDeck at aft port/starboard
BAP/BASLower longitudinal bulkhead at aft port/starboard
Table 3. Statistics table of whipping factor in head sea, (a) vertical bending component, (b) torsional component, (c) horizontal bending component.
(a)
Average Wave Period [s]
2.0–4.04.0–6.06.0–8.08.0–10.010.0–
Significant Wave Height [m]0.0–1.03.358(214)4.171(612)2.303(325)1.321(139)1.222(70)
1.0–2.03.146(194)2.067(551)1.347(247)1.182(183)
2.0–3.01.634(339)1.242(245)1.224(73)
3.0–4.01.429(45)1.314(193)1.255(30)
4.0–5.01.455(1)1.380(24)1.232(8)
5.0–6.01.235(11)
6.0–
(b)
Average Wave Period [s]
2.0–4.04.0–6.06.0–8.08.0–10.010.0–
Significant Wave Height [m]0.0–1.02.191(214)2.113(612)1.458(325)1.221(139)1.245(70)
1.0–2.01.558(194)1.211(551)1.085(247)1.061(183)
2.0–3.01.080(339)1.048(245)1.061(73)
3.0–4.01.090(45)1.070(193)1.079(30)
4.0–5.01.063(1)1.094(24)1.085(8)
5.0–6.01.052(11)
6.0–
(c)
Average Wave Period [s]
2.0–4.04.0–6.06.0–8.08.0–10.010.0–
Significant Wave Height [m]0.0–1.02.066(214)2.167(612)1.506(325)1.233(139)1.261(70)
1.0–2.01.660(194)1.270(551)1.117(247)1.082(183)
2.0–3.01.151(339)1.077(245)1.099(73)
3.0–4.01.146(45)1.142(193)1.104(30)
4.0–5.01.390(1)1.214(24)1.158(8)
5.0–6.01.184(11)
6.0–
Table 4. Statistics table of whipping factor in bow quartering sea, (a) vertical bending component, (b) torsional component, (c) horizontal bending component.
(a)
Average Wave Period [s]
2.0–4.04.0–6.06.0–8.08.0–10.010.0–
Significant Wave Height [m]0.0–1.03.45(162)3.32(563)1.91(315)1.25(137)1.26(106)
1.0–2.02.67(221)1.68(793)1.23(677)1.19(435)
2.0–3.01.42(328)1.29(367)1.18(303)
3.0–4.01.53(67)1.32(143)1.20(207)
4.0–5.01.07(1)1.22(70)1.23(87)
5.0–6.01.02(6)1.34(16)
6.0–
(b)
Average Wave Period [s]
2.0–4.04.0–6.06.0–8.08.0–10.010.0–
Significant Wave Height [m]0.0–1.02.14(162)1.75(563)1.29(315)1.13(137)1.12(106)
1.0–2.01.38(221)1.11(793)1.05(677)1.05(435)
2.0–3.01.06(328)1.04(367)1.03(303)
3.0–4.01.09(67)1.07(143)1.07(207)
4.0–5.00.98(1)1.09(70)1.07(87)
5.0–6.01.00(6)1.11(16)
6.0–
(c)
Average Wave Period [s]
2.0–4.04.0–6.06.0–8.08.0–10.010.0–
Significant Wave Height [m]0.0–1.02.608(162)1.718(563)1.321(315)1.137(137)1.110(106)
1.0–2.01.430(221)1.139(793)1.071(677)1.065(435)
2.0–3.01.119(328)1.078(367)1.049(303)
3.0–4.01.169(67)1.148(143)1.087(207)
4.0–5.01.011(1)1.121(70)1.099(87)
5.0–6.01.019(6)1.085(16)
6.0–
Table 5. Sea state in which a large whipping factor was measured.
DateWhipping FactorSignificant Wave Height [m]Average Wave Period [s]Relative Wave Direction [°]Ship Speed [knot]
2012/5/22 11:00-11:592.1993.18.4188.119

