Article

Ultrahigh Resolution Pulsed Laser-Induced Photoacoustic Detection of Multi-Scale Damage in CFRP Composites

1
School of Electrical and Computer Engineering, University of Oklahoma, Norman, OK 73019, USA
2
School of Aerospace and Mechanical Engineering, University of Oklahoma, Norman, OK 73019, USA
*
Authors to whom correspondence should be addressed.
Appl. Sci. 2020, 10(6), 2106; https://doi.org/10.3390/app10062106
Submission received: 15 February 2020 / Revised: 6 March 2020 / Accepted: 11 March 2020 / Published: 20 March 2020
(This article belongs to the Special Issue Novel Approaches for Nondestructive Testing and Evaluation)

Abstract

:

Featured Application

The developed photoacoustic nondestructive detection system is a novel approach for precise identification of embedded structural damage in composite laminates.

Abstract

This paper presents a photoacoustic non-destructive evaluation (pNDE) system with an ultrahigh resolution for the detection of multi-scale damage in carbon fiber-reinforced plastic (CFRP) composites. The pNDE system consists of three main components: a picosecond pulsed laser-based ultrasonic actuator, an ultrasound receiver, and a data acquisition/computing subsystem. During the operation, high-frequency ultrasound is generated by pulsed laser and recorded by an ultrasound receiver. By implementing a two-dimensional back projection algorithm, pNDE images can be reconstructed from the recorded ultrasound signals to represent the embedded damage. Both potential macroscopic and microscopic damages, such as surface notches and delamination in CFRP, can be identified by examining the reconstructed pNDE images. Three ultrasonic presentation modes including A-scan, B-scan, and C-scan are employed to analyze the recorded signals for the representation of the detected micro-scale damage in two-dimensional and three-dimensional images with a high spatial resolution of up to 60 µm. Macro-scale delamination and transverse ply cracks are clearly visualized, identifying the edges of the damaged area. The results of the study demonstrate that the developed pNDE system provides a non-destructive and robust approach for multi-scale damage detection in composite materials.

1. Introduction

High-performance carbon fiber-reinforced plastic (CFRP) composite materials are well known for their high strength to weight ratio, being light in weight, and resistance to corrosion [1,2]. However, aging-related damage and low-velocity impact damage in composites, such as fatigue cracks and delamination, can significantly reduce their structural integrity and durability. In addition, manufacturing imperfections can result in embedded defects, including voids, cracks, and inclusions [3,4]. Since the size, location, and properties of embedded defects in composites are generally unknown and difficult to detect, there is an urgent need to develop new non-destructive evaluation (NDE) and structural health monitoring (SHM) technologies to help assess the quality of composite products and to help provide accurate inspections throughout a composite’s service life. Early detection of embedded and barely visible damage in composites is imperative for long-term operation, risk management, and prognostics of complex composite structures.
Recent advance of NDE technologies has led to efficient damage detection in composites. Currently well-accepted NDE technologies include acoustic emission, infrared thermography, and ultrasonic testing. Acoustic emission identifies damage initiation and tracks damage growth by continuously analyzing elastic waves generated via energy release from localized sources within the tested structures [5]. This method can be potentially used for in situ damage characterization, since the failure events are detected as they occur. Infrared thermography has been used to detect subsurface cracking and embedded delamination in composites [6,7]. The obtained thermal patterns induced, either by directly heating the sample or applying a mechanical oscillatory load, have been analyzed to study embedded damage in composites. However, it is difficult to measure through-thickness locations of the damage using infrared thermography. Ultrasonic techniques are some of the most popular NDE methods for damage detection in composite structures and have been extensively reported in the literature [8,9,10]. For example, Kessler et al. used Lamb wave methods to detect delamination, transverse ply cracks and through-holes in quasi-isotropic graphite/epoxy composites [11]. Chang et al. developed a tomographic damage imaging approach by combining inverse acoustic wave propagation by combining the k-space method with the adjoint method [12]. Although NDE technologies have been used for a broad range of engineering applications, most of the NDE equipment cannot detect micro-scale damage initiation in composites in depth. High-frequency ultrasound can detect micro-scale damage. However, the detectable depth is limited.
Real-time NDE has been under investigation as a method to monitor the integrity of materials and structures over the past two decades. Progress has been made in developing and improving real-time NDE, which allows early detection of material defects, providing timely warning to those at stake [13,14,15,16,17]. Real-time NDE technologies utilizing advanced sensors (i.e., piezoelectric ceramic sensors [18,19], impedance-based sensors [20,21], piezoresistive sensors [22,23], and fiber Brag grating sensors [24,25]) have been referred to as structural health monitoring (SMH) and prognostics. In order to detect structural defects under regular load conditions, innovative signal processing and pattern recognition algorithms have been developed [26,27,28]. While progress has been made in the development of SHM and prognostics, this technology has not been implemented in industries that require large-scale applications, especially in the aerospace industry, due to limitations pertaining to the sensors, the power supplies, and real-time data processing.
Laser-induced ultrasound has been recognized as a promising technical solution for NDE and SHM of CFRP composites. Current laser-induced ultrasonic NDE systems use Q-switched lasers with nanosecond pulses and pulse energy levels of several millijoules (mJ), generating ultrasonic signal frequencies ranging from tenths of kilohertz (kHz) up to tens of megahertz (MHz) [29,30]. Both through-transmission and pulse-echo ultrasonic spectroscopy methods are able to detect CFRP composites up to several centimeters [31,32,33]. Although remote ultrasonic energy generation and data collection are the ideal approaches, complex and relatively expensive instruments are required for ultrasonic interferometric detection [34,35]. To the best of the authors’ knowledge, currently, sophisticated laser-based ultrasound imaging systems for remote evaluation of CFRP composites are expensive and technologically immature.
In this paper, we developed a picosecond pulsed laser-induced photoacoustic non-destructive evaluation (pNDE) system for the detection of multi-scale damage in CFRP composites using a picosecond pulsed laser and high-frequency ultrasound transducer. At the micro scale, the damage precursors of surface notches and matrix cracks were successfully detected and represented in 3D images. The size and position of the micro-scale defects in composites were evaluated with a high spatial resolution of 60 µm. Scanning electron microscopy (SEM) images were obtained to validate all micro-scale surface notches on composites. At the macro scale, both delamination and transverse ply cracks were successfully detected and represented using the developed pNDE system. The size of delamination at different depths and the locations of transverse ply cracks were accurately measured.

2. Materials and Methods

2.1. Materials and Experimental Procedure

CFRP composite samples were fabricated using commercial prepreg carbon fiber fabrics (#2511 semi-toughened epoxy resin-coated T700G-12K-31E carbon fiber fabrics) manufactured by Toray Industries, Inc. Each prepreg lamina had a standard resin content of 35.3 wt.% and fiber areal weight of 150.6 g/m2. Four plies of composite lamina were stacked in a [+45°/−45°]s sequence and manufactured using a hot press, following the vendor’s curing instructions. The scanned composite thickness is approximately 0.8 mm based on the measurement of a caliper. To generate micro-scale damage precursors in composites, shallow X-shaped notches were cut on the composite sample’s surface using a sharp razor blade. The dimensions of the notches were measured using SEM images. Macro-scale damage in composites was generated under the velocity impact load using an in-house developed drop-weight impactor. The impact energy absorbed by the composite sample was 4 J. Both embedded delamination and transverse ply cracks were generated in the composite sample due to the applied impact load.
Throughout the pNDE damage detection process, the scanned composite target was secured on a scanning platform (LMS203 Fast XY Scanning stage, Thorlabs, Newton, NJ, USA), which has a maximum linear translation speed of 100 mm/s and a peak acceleration of 10 m/s2 in both lateral directions. In addition, a step length of 0.01 mm was used during the pNDE detection. The position of the scanning stage is synchronized with the laser source excitation sequence.

2.2. Theory of pNDE Method

In this paper, the pNDE mechanism is based on the photoacoustic effect. Acoustic and ultrasonic waves are generated following the local temporal thermal elastic deformation and pressure caused by the optical absorption of pulsed laser in materials. The relationship between the generated photoacoustic pressure p(r, t) (at location r and time t) and the deposited pulsed laser heat H(r, t) is described using the following equation [36]:
( 2 1 v s 2   2 t 2   ) p ( r , t ) = β C p H ( r , t ) t
where v s is the compressional wave speed in CFRP composites, β is the thermal coefficient of volume, and C p represents the specific heat capacity at constant pressure. We designated the position of the transducer as the origin of the coordinate system for convenience. The acoustic pressure p (r, t) at transducer position r and time t is, therefore, expressed as:
p ( r , t ) = β 4 π C p d r r H ( r , t ) t | t = t r v s
Since optical absorption is proportional to acoustic signal strength in photoacoustic imaging, the absorption difference between an undamaged solid material and a damaged area with material vacancy provides the imaging contrast. In a photoacoustic microscopy image, the optical absorption at each illuminated point can be derived from the time of flight of the acoustic wave detected at each ultrasound transducer location. Therefore, the micro-structure within the composite can be mapped with photoacoustic microscopy in 3D to reveal any underlying defects.

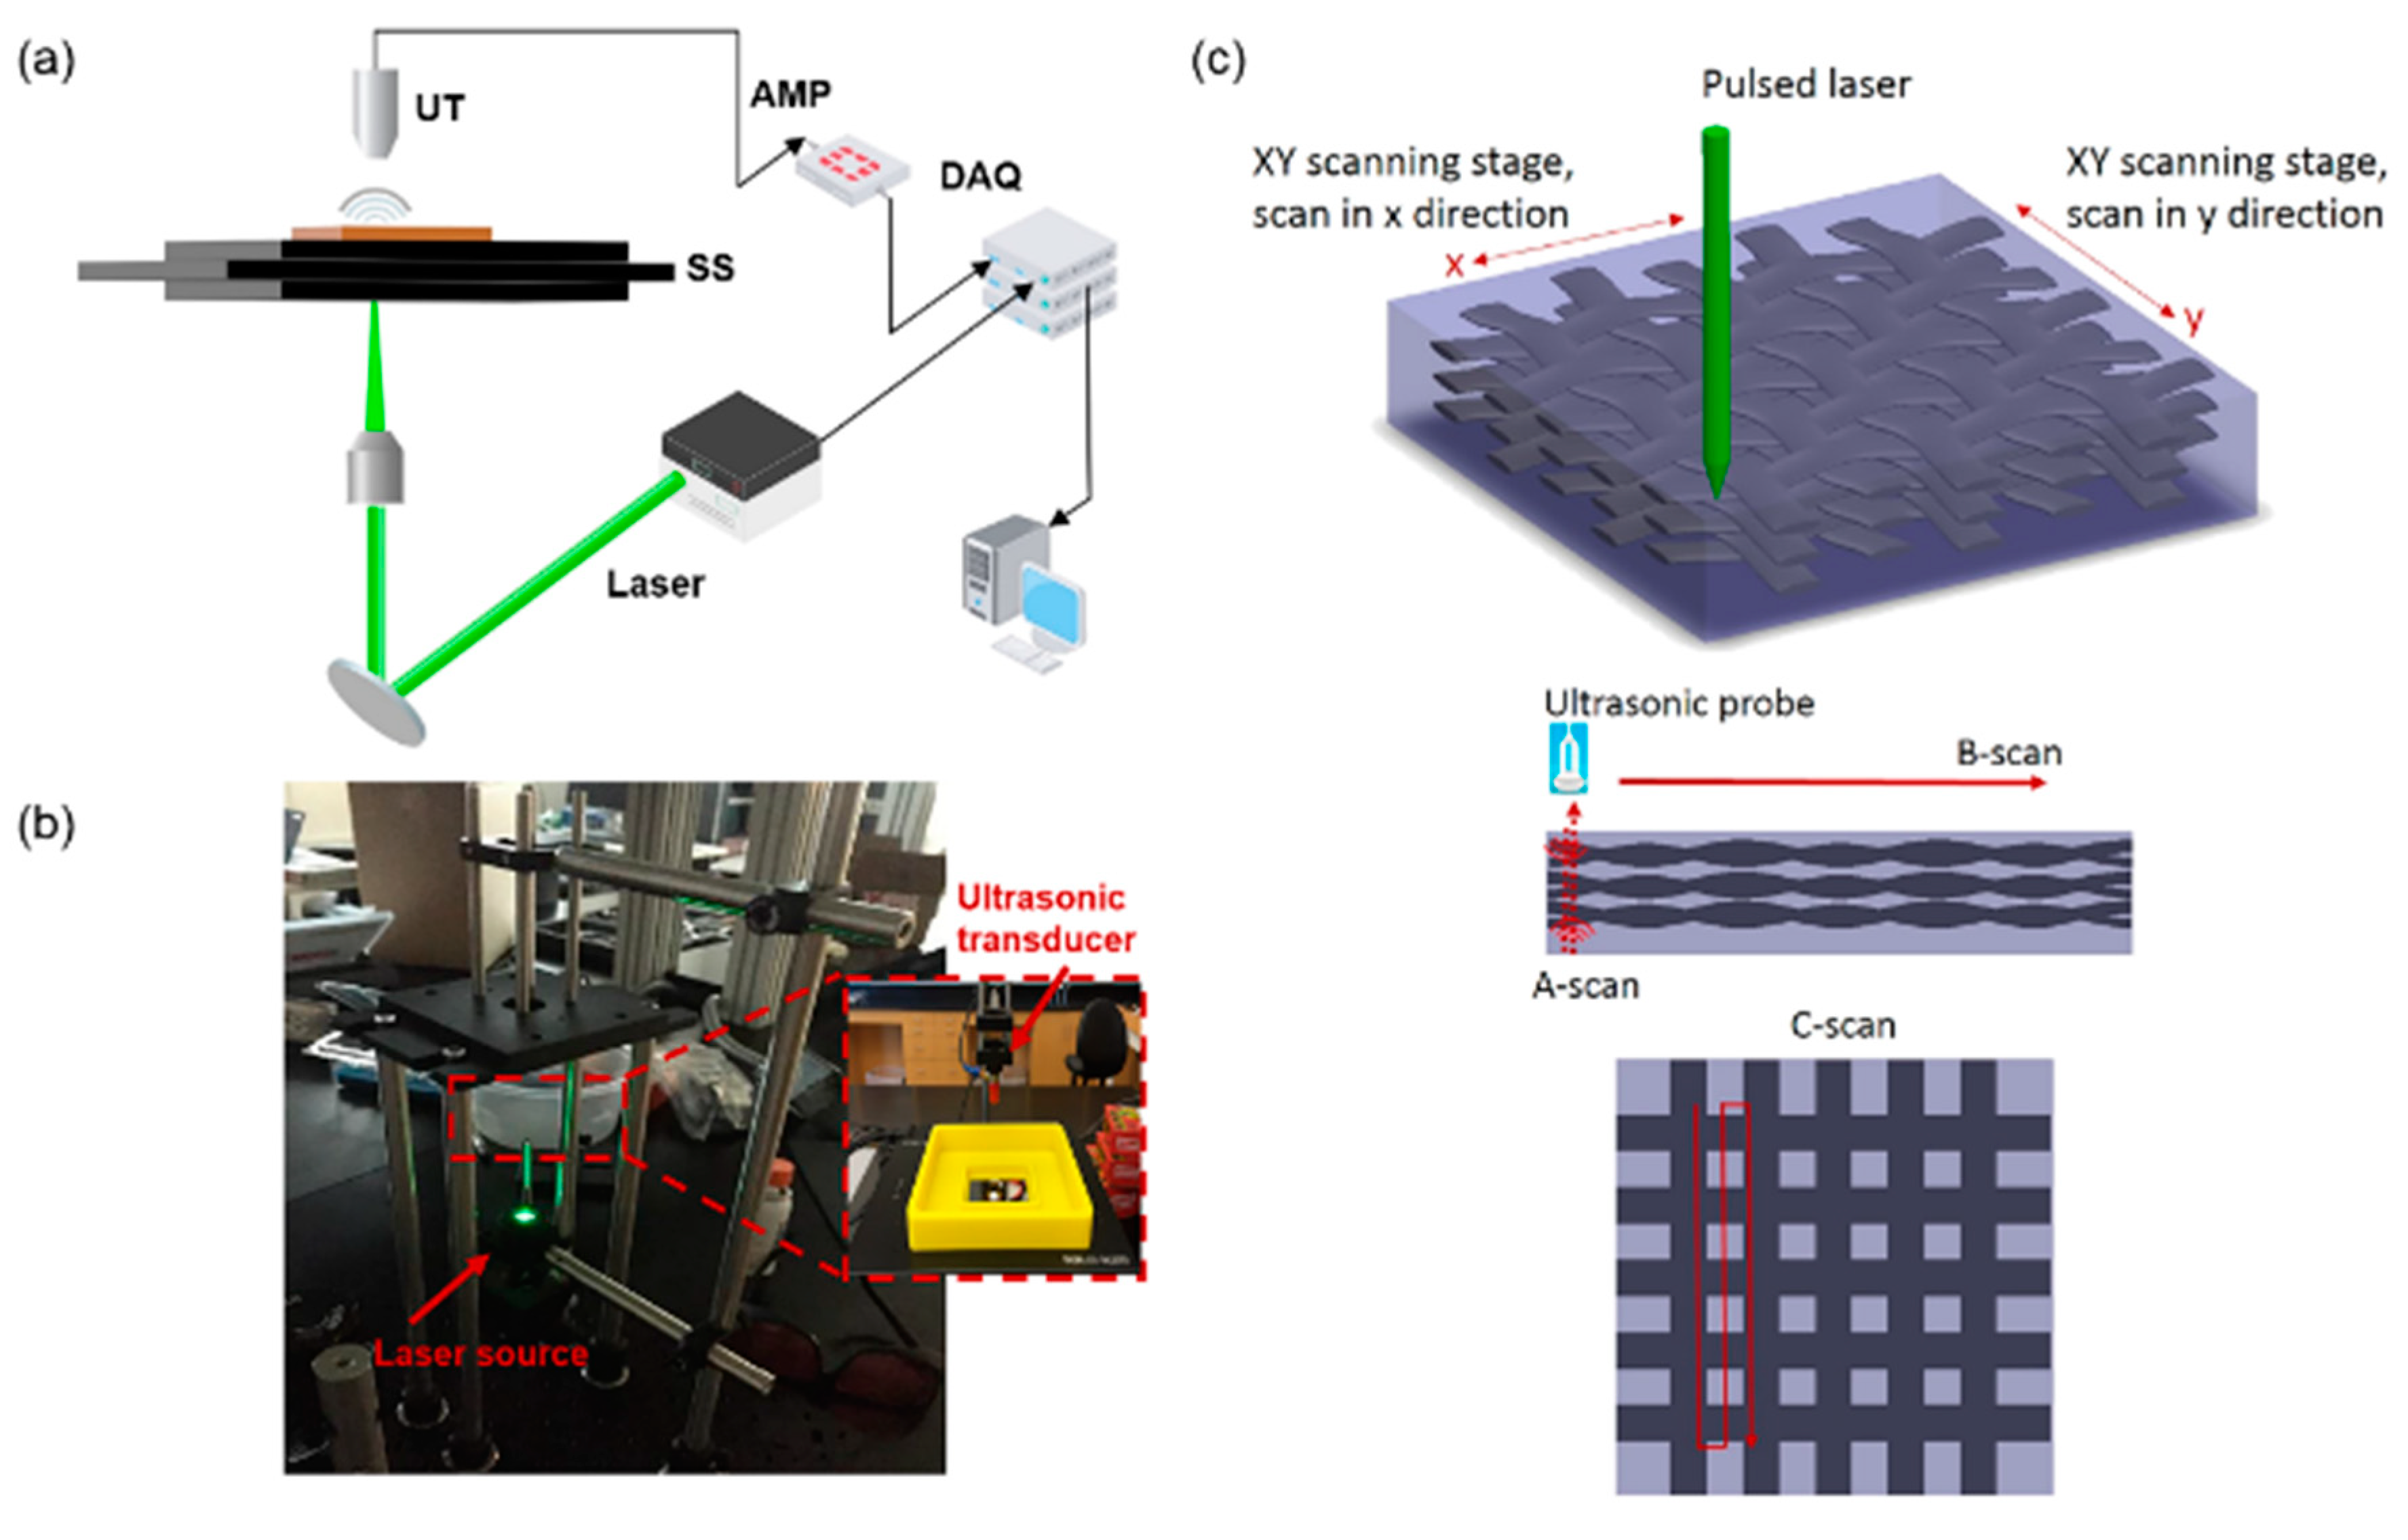
2.3. pNDE Imaging System

The developed pNDE system consisted of three major components: (i) a picosecond pulsed laser for the generation of ultrasound signals in composite samples, (ii) a PZT ultrasonic receiver and signal amplifiers, and (iii) a data acquisition, processing, and imaging subsystem. A picosecond laser (COMPILER 532/266, Passat, Ltd., Vaughan, ON, Canada) was used to provide ultrafast laser pulses with a pulse duration of less than 7 ps. The laser pulse repetition rate (PRR) was adjusted between 1 and 400 Hz. The generated photoacoustic signals were captured by two PZT ultrasound transducers in the experiments. In the multi-scale damage detection test, a transducer (V2062, Olympus NDT, Waltham, MA, USA) with a center frequency of 125 MHz and a bandwidth greater than 87% −6 dB was used for high spatial resolution. In the macro-scale damage detection test, a transducer (U8517149, Olympus NDT) with a center frequency of 20 MHz and a bandwidth greater than 50% −6 dB was used. A low-noise preamplifier (ZFL-1000LN+, Mini-Circuits, Brooklyn, NY, USA) with a bandwidth of 0.1–1000 MHz at −3 dB and a typical gain of 20 dB was used to prepare weak electrical signals from the transducer and deliver the noise-tolerant output signals to the second-stage amplifier (ZFL-500+, Mini-Circuits) with a bandwidth of 0.05–500 MHz at −3 dB, and a gain of 25 dB to further improve the signal-to-noise ratio (SNR). Finally, the pre-processed ultrasonic signals were recorded by the data acquisition card (NI PCI-5153EX, National Instruments, Austin, TX, USA). The schematic diagram of the developed pNDE system is shown in Figure 1a. In addition, Figure 1b illustrates the developed pNDE hardware system.
For micro-scale damage detection, the CFRP composite samples were horizontally placed on the bottom glass window of the 3D-printed water container (Figure 1b). The ultrasound transducers were submerged in the water to keep good coupling of the ultrasound propagation between the sample and the transducer. The PPR of the laser was set at 30 Hz so that an adequate signal-to-noise ratio was obtained. A sampling rate of 500 MHz was used to record the ultrasonic signals during data collection at each scanning location. One set of pNDE damage detection data included 500 × 500 positions with a step length of 10 µm per step and detected micro-scale damage in an area of 5 mm × 5 mm. All the ultrasonic data was collected when the scanning stage (LMS203 Fast XY Scanning stage, Thorlabs) traveled in the X-Y plane and was controlled using an in-house LABVIEW software. Back projection-based photoacoustic reconstruction was performed in MATLAB [37,38,39,40]. It is noted that both the pulsed laser beam and ultrasound transducer were kept stationary, while the composite sample was shifted on a 2D translation stage at an average translation speed of 0.05 mm/s. The position-synchronized output of the translator triggered the pulsed laser and turned the laser on and off during the scanning. Similar experimental procedures were adopted for the pNDE detection of macro-scale impact-induced damage in composites. The PRR of the laser was set at 30 Hz, a sampling rate of 500 MHz was used to record the ultrasonic signals, and the translation speed of the stage was 0.05 mm/s. Laser-induced ultrasonic signals were generated and then recorded using an ultrasonic probe. The pNDE damage detection area was 15 mm × 15 mm, and the recorded data included 500 × 500 positions with a step length of 30 µm per step.
Accurate 3D imaging of the measured microstructures and potential damage in composites is critical in order to demonstrate the developed system for NDE applications. In our study, all the collected pNDE data was studied in the ultrasonic A-scan, B-scan, and C-scan presentation modes. A schematic of the three ultrasonic presentation modes is shown in Figure 1c. Each presentation mode provided a different way to evaluate the inspected region. A-scan displayed the ultrasonic signal energy as a function of time in the ultrasonic propagation direction. B-scan provided the display of ultrasonic signal energy regarding the linear position of the transducer, resulting in the plot to show the transverse cross-section of the detected composite plate. C-scan allowed a plan-type view of the location and size of damage in the detected sample. The combination of the three ultrasonic presentation modes allowed a comprehensive demonstration of the detected multi-scale damage in the composite structures.

3. Multi-Scale Damage Detection Results Using pNDE

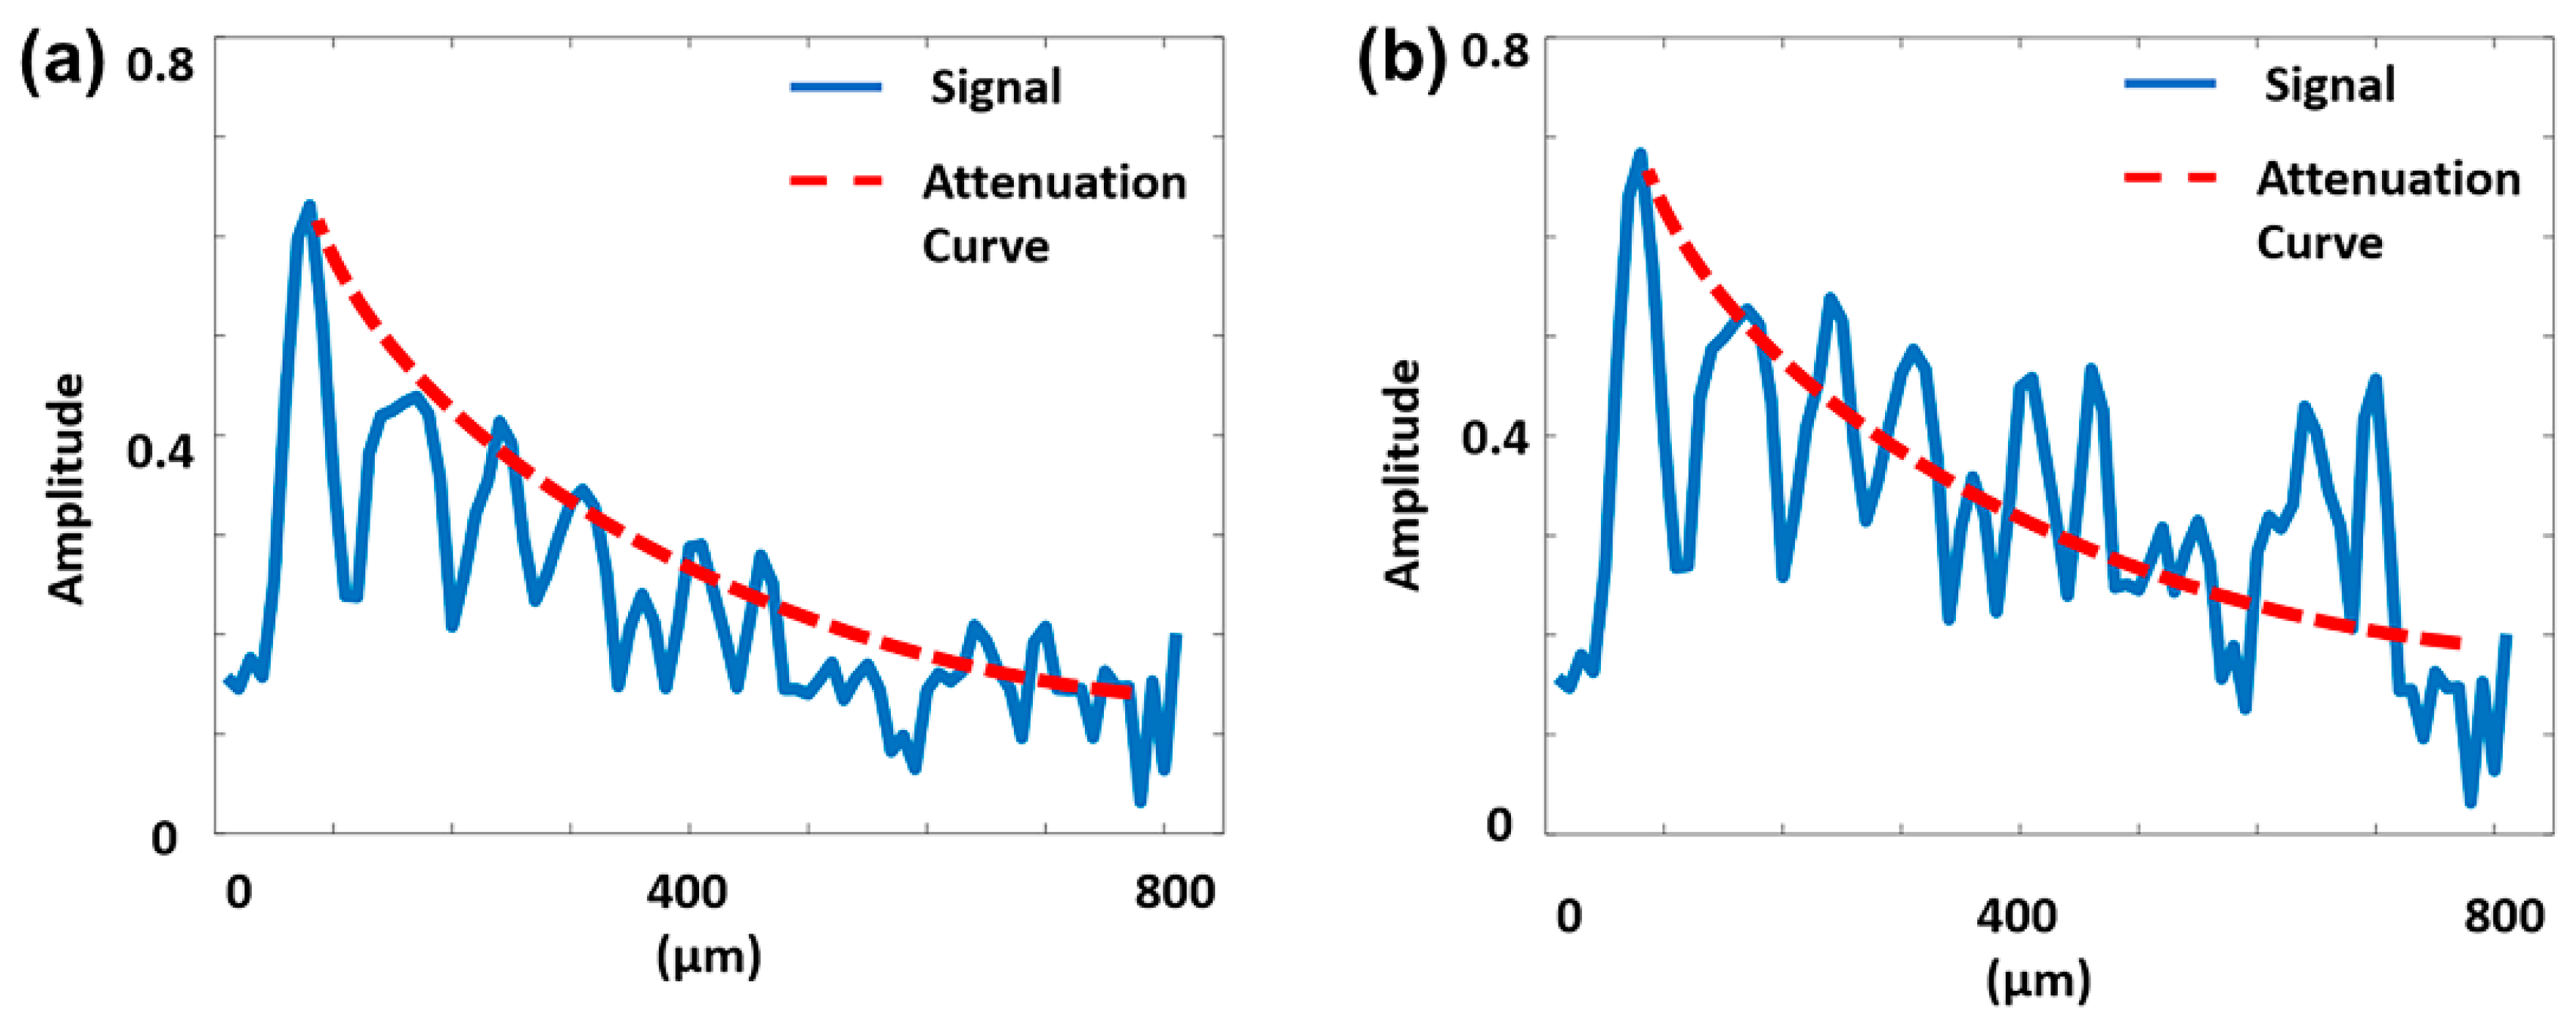
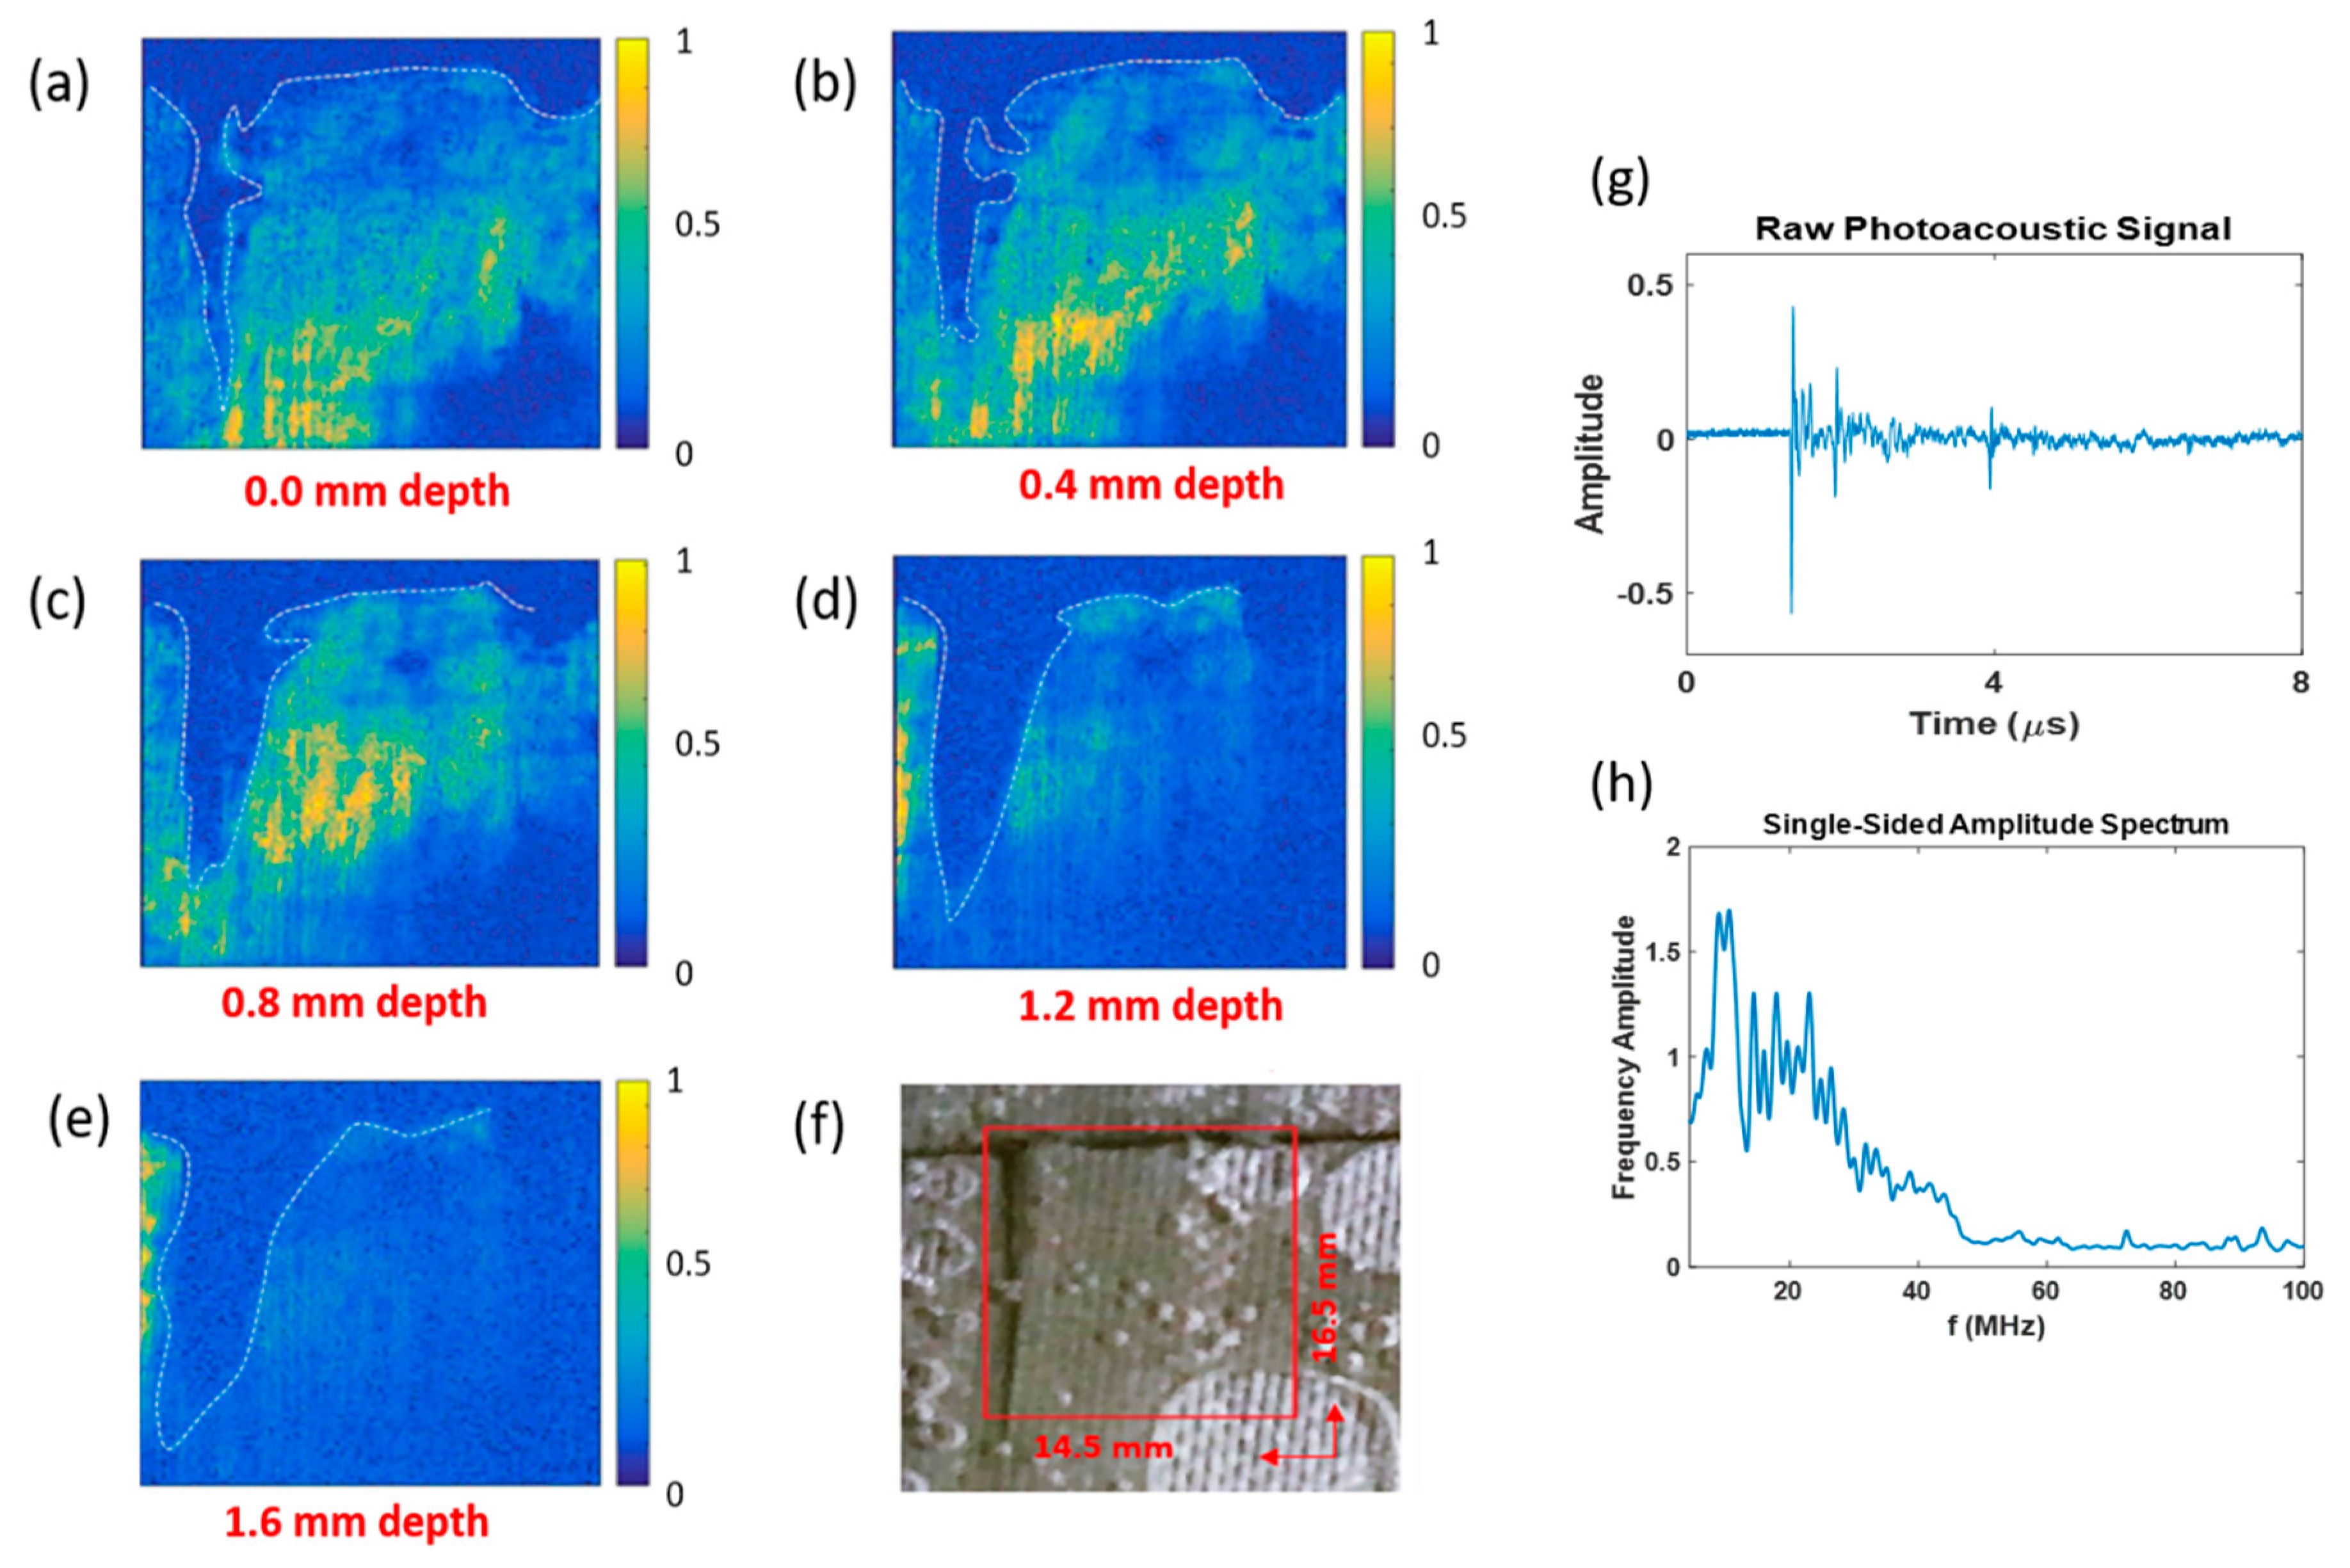
3.1. Typical A-Scan and Correction for Micro-Scale Damage Detection

A typical photoacoustic A-scan signal obtained during experiment is shown in Figure 2a. The beginning and the end of the ‘A’ lines were cut such that images only show the reconstruction of the CFRP. For acoustic attenuation compensation in the scanned material, a time gain correction (TGC) function was applied to all recorded photoacoustic signals as shown in Figure 2b. The ultrasound attenuation compensation was derived the exponential law [41]:
A T G C ( z k ) = A 0 ( z k ) exp ( 2 α ( z k z 0 ) )
where the first corrected sample along the z-direction was denoted as z 0 , corresponding to the frame of the CFRP board reconstruction. The last corrected sample was denoted as z k , corresponding to the last frame of the CFRP board reconstruction. The acoustic attenuation coefficient α was measured to be 5.64 cm-1 for all A-scans [41].

3.2. Ultrasonic C-Scan for Micro-Scale Damage Detection

Figure 3 shows pNDE C-scan images in the X-Y plane parallel to the top surface of the composite sample at various depths. As illustrated in Figure 3a, the pNDE C-scan image clearly represented the X-shaped notches on the tested CFRP sample. The width of the X-shape notch shown on the C-scan matched well with that measured in the SEM image, indicating the maximum width of the notch was approximately 270 μm, as shown in Figure 3b. In addition, the tow orientation and the woven structures of the carbon fiber fabrics were visible in the reconstructed images. The photoacoustic signal profile across two grid lines on the surface of the material was extracted along the solid blue line shown in Figure 3a. Based on the extracted grid line profiles, the lateral resolution of the system is estimated to be approximately 60 µm, corresponding to the smaller full width at half maximum (FWHM) of the line spread function in Figure 3c.
Figure 4a–e shows the typical pNDE C-scans in the horizontal cross-sections (X-Y plane) that were parallel to the top surface of the composite structure at different depths. The C-scan presentation provided the top view of the locations and sizes of the defects featured in the tested CFRP composites. In the C-scan images of Figure 4a,b, the X-shape notch was clearly visible. Only partial micro-scale matrix cracks can be visualized in Figure 4a,b because of the scanning plane (X-Y plane) is not strictly parallelized to the surface of the composite plate. In Figure 4e, the dense and highly distributed micro-scale matrix cracks, which lead to potential delamination, were detected. Due to the distribution of microscale matrix cracks throughout the entire layer in the composites, the ultrasonic signals were dispersed. Therefore, carbon fiber fabric yarns were not observed in this layer. In Figure 4f, the photoacoustic maximum-amplitude image projected from the top view of the CFRP composite indicated the complex microstructure inside the sample. Both the surface notches and embedded matrix cracks were shown in this image. The 3D image of the detected composite structure with micro-scale notch damage is shown in Figure 4g.

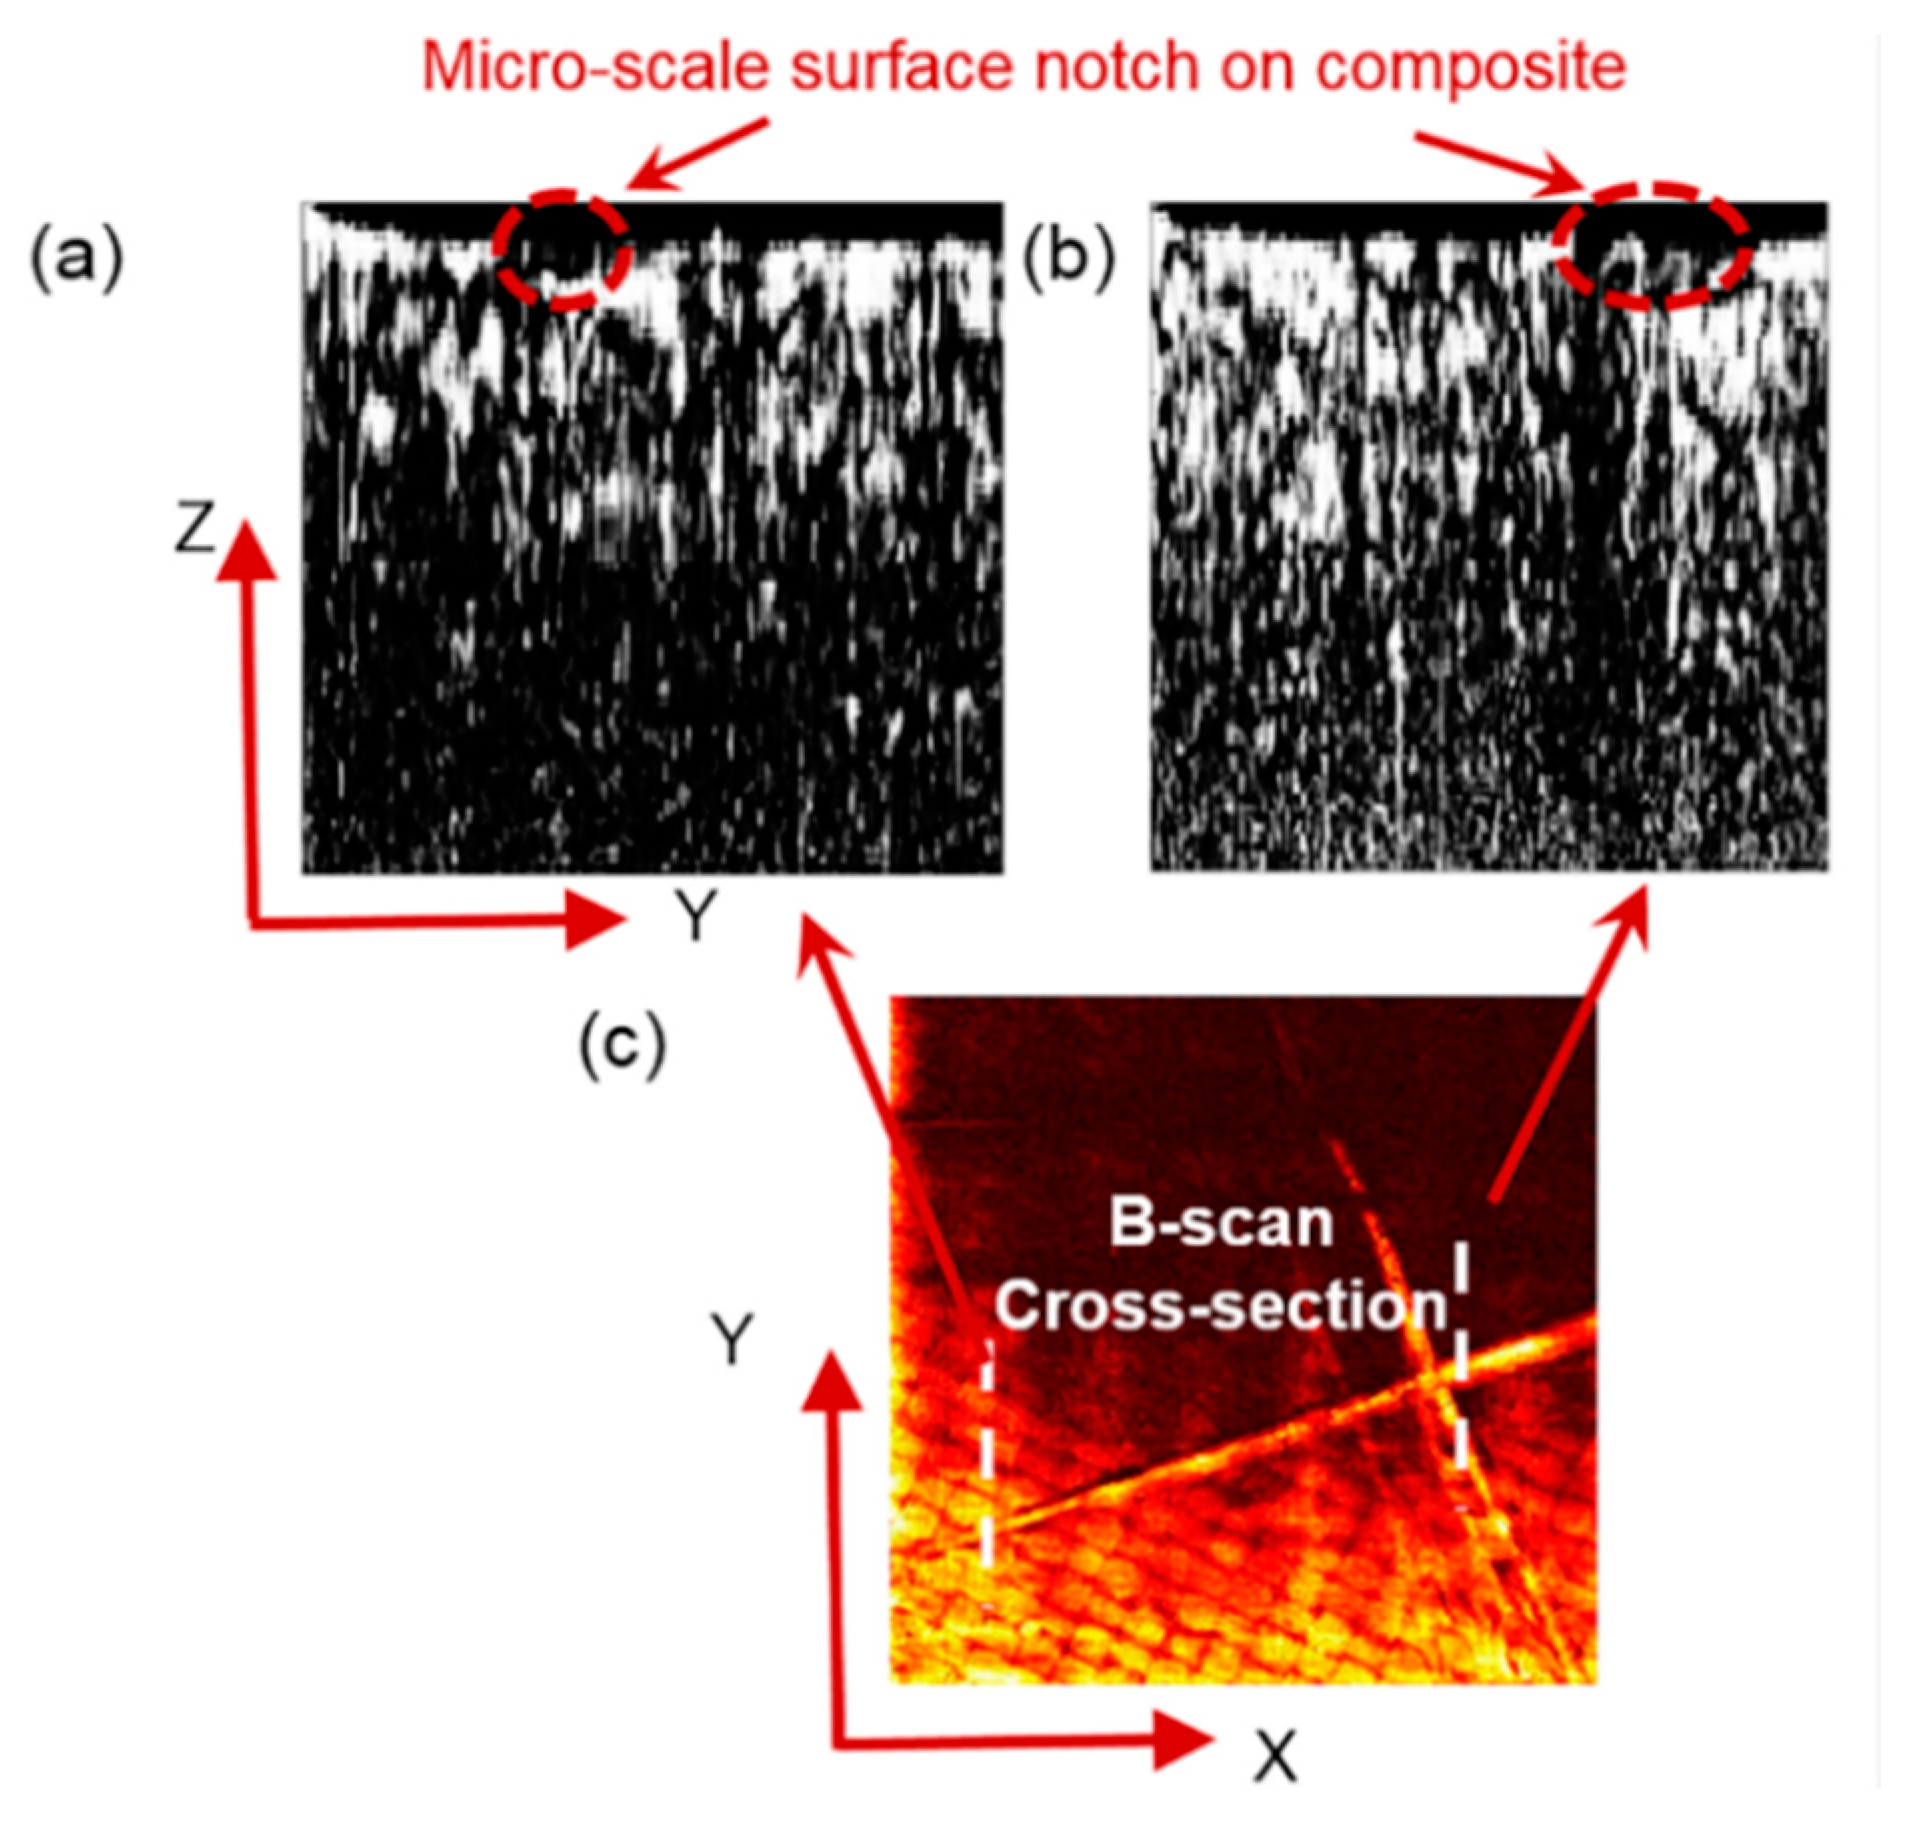
3.3. Ultrasonic B-Scan for Micro-Scale Damage Detection

A typical B-scan image in the vertical cross-section (Y-Z plane, perpendicular to the top surface) of the tested composite structure is shown in Figure 5. Each B-scan image was generated by analyzing the ultrasonic A-scan data in the same cross-section in the vertical cross-section. Since high accuracy A-scan steps were enabled by a LABVIEW programmed stepper motor, the pulsed laser was precisely triggered on the predefined detection position, and accurate B-scan images were created to represent the cross-section conditions in composites. Figure 5a,b shows the typical B-scan images from two x positions in the Y-Z plane. The surface notches were observed from multiple B-scan images. One or two notches were visualized in the selected B-scan images. The B-scan images matched with the C-scan results, indicating accurate pNDE detection of micro-scale damage in the composite sample with notches on the surface.

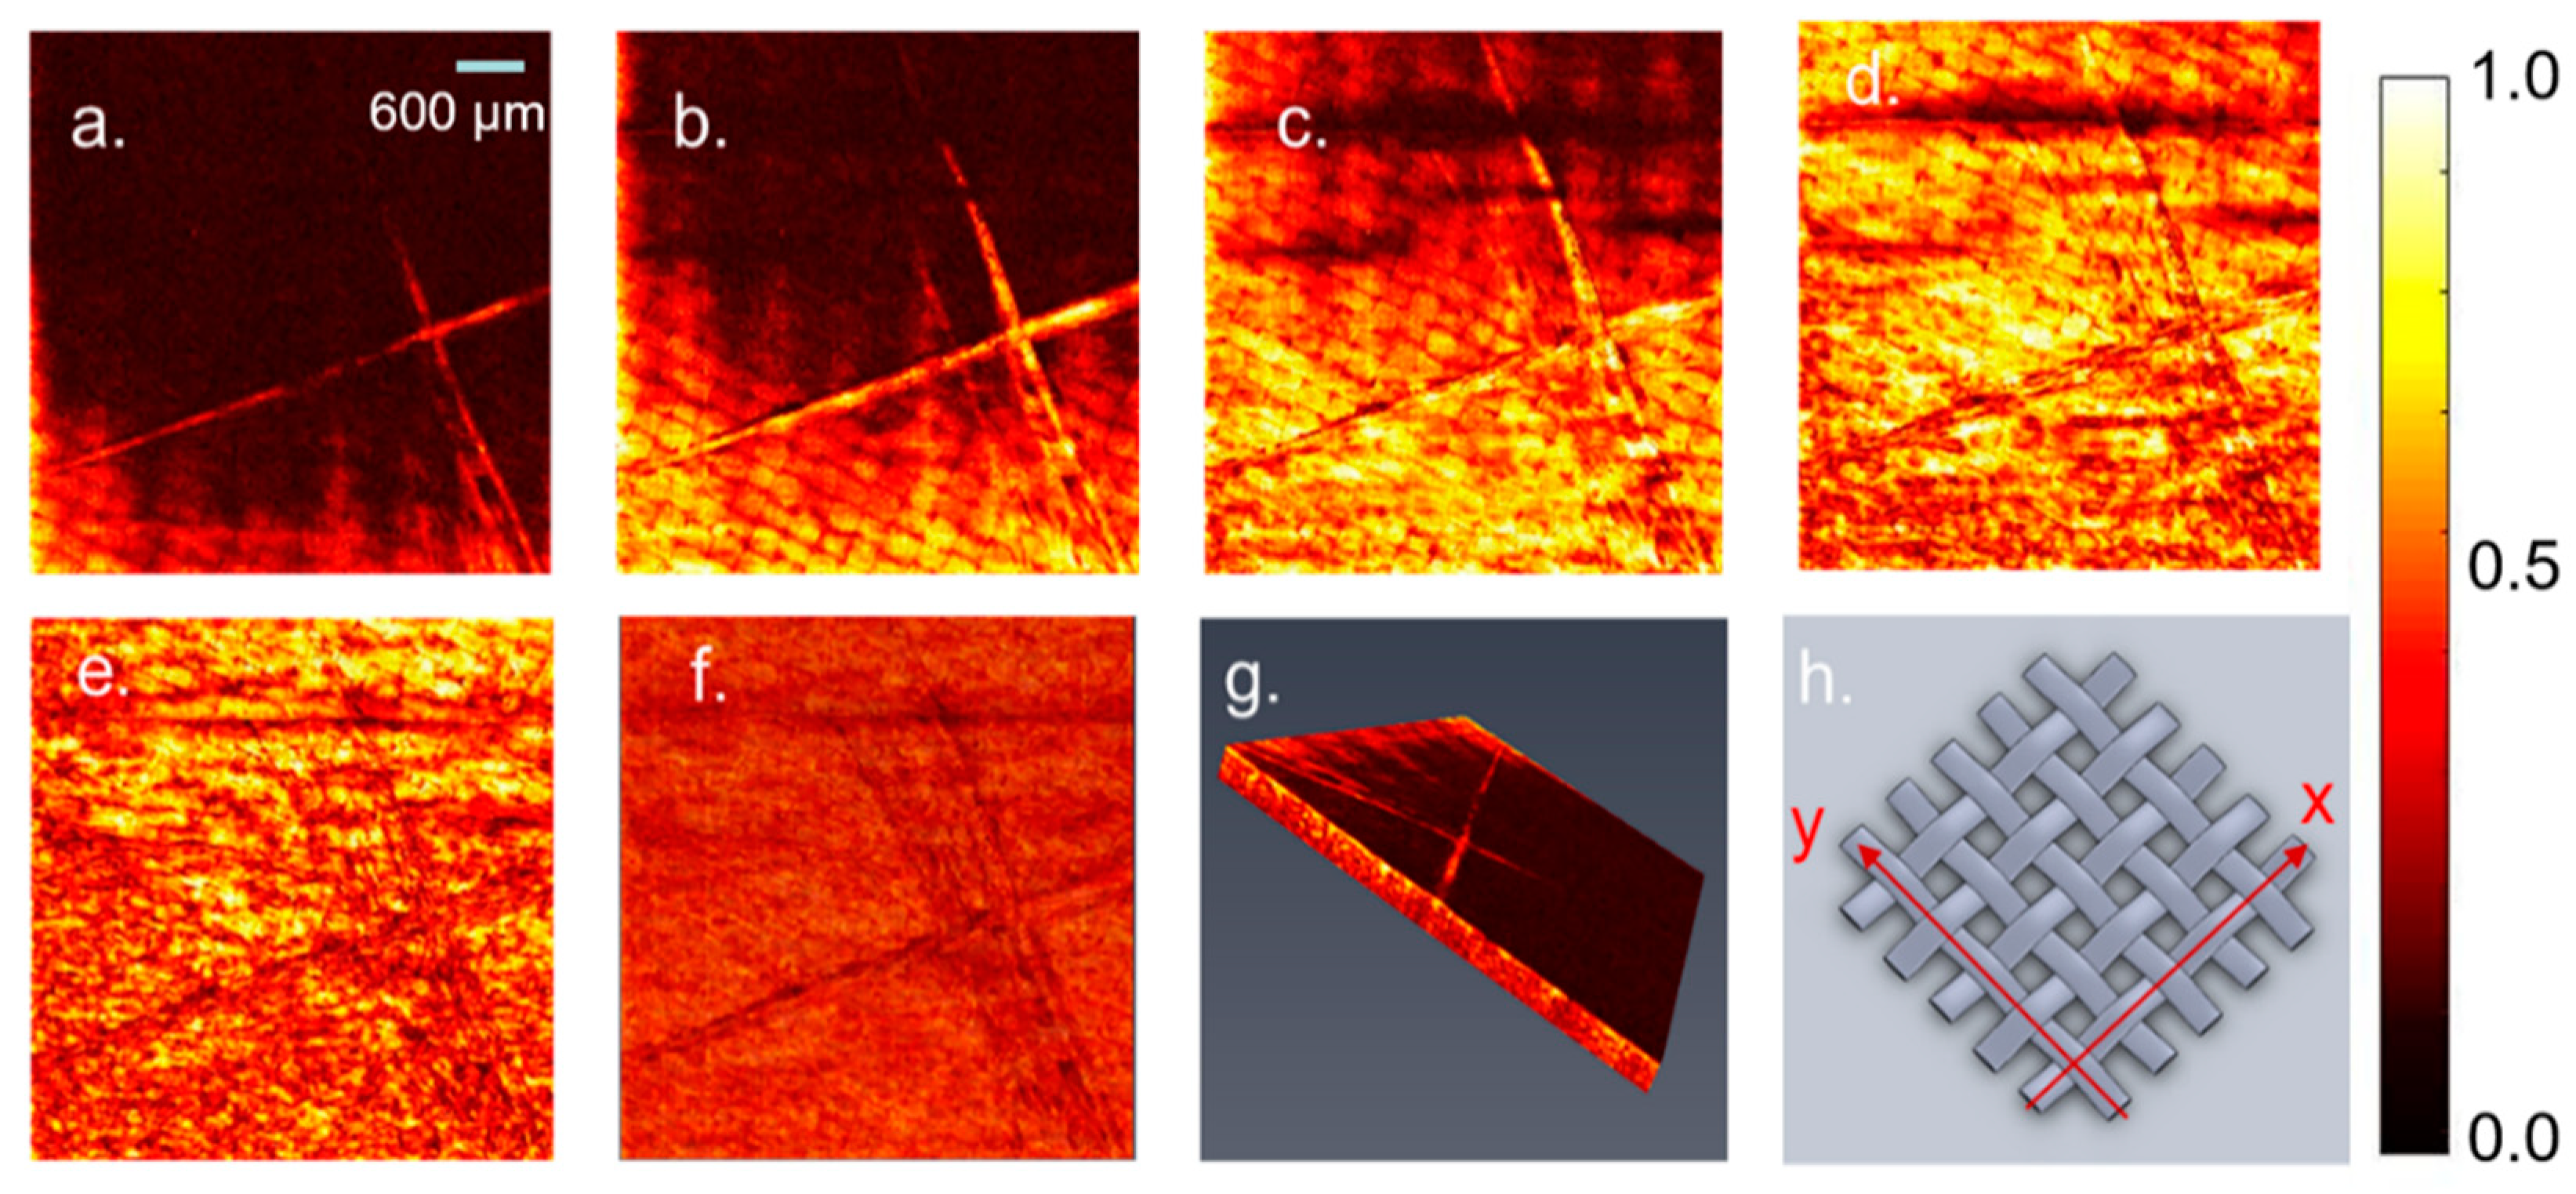
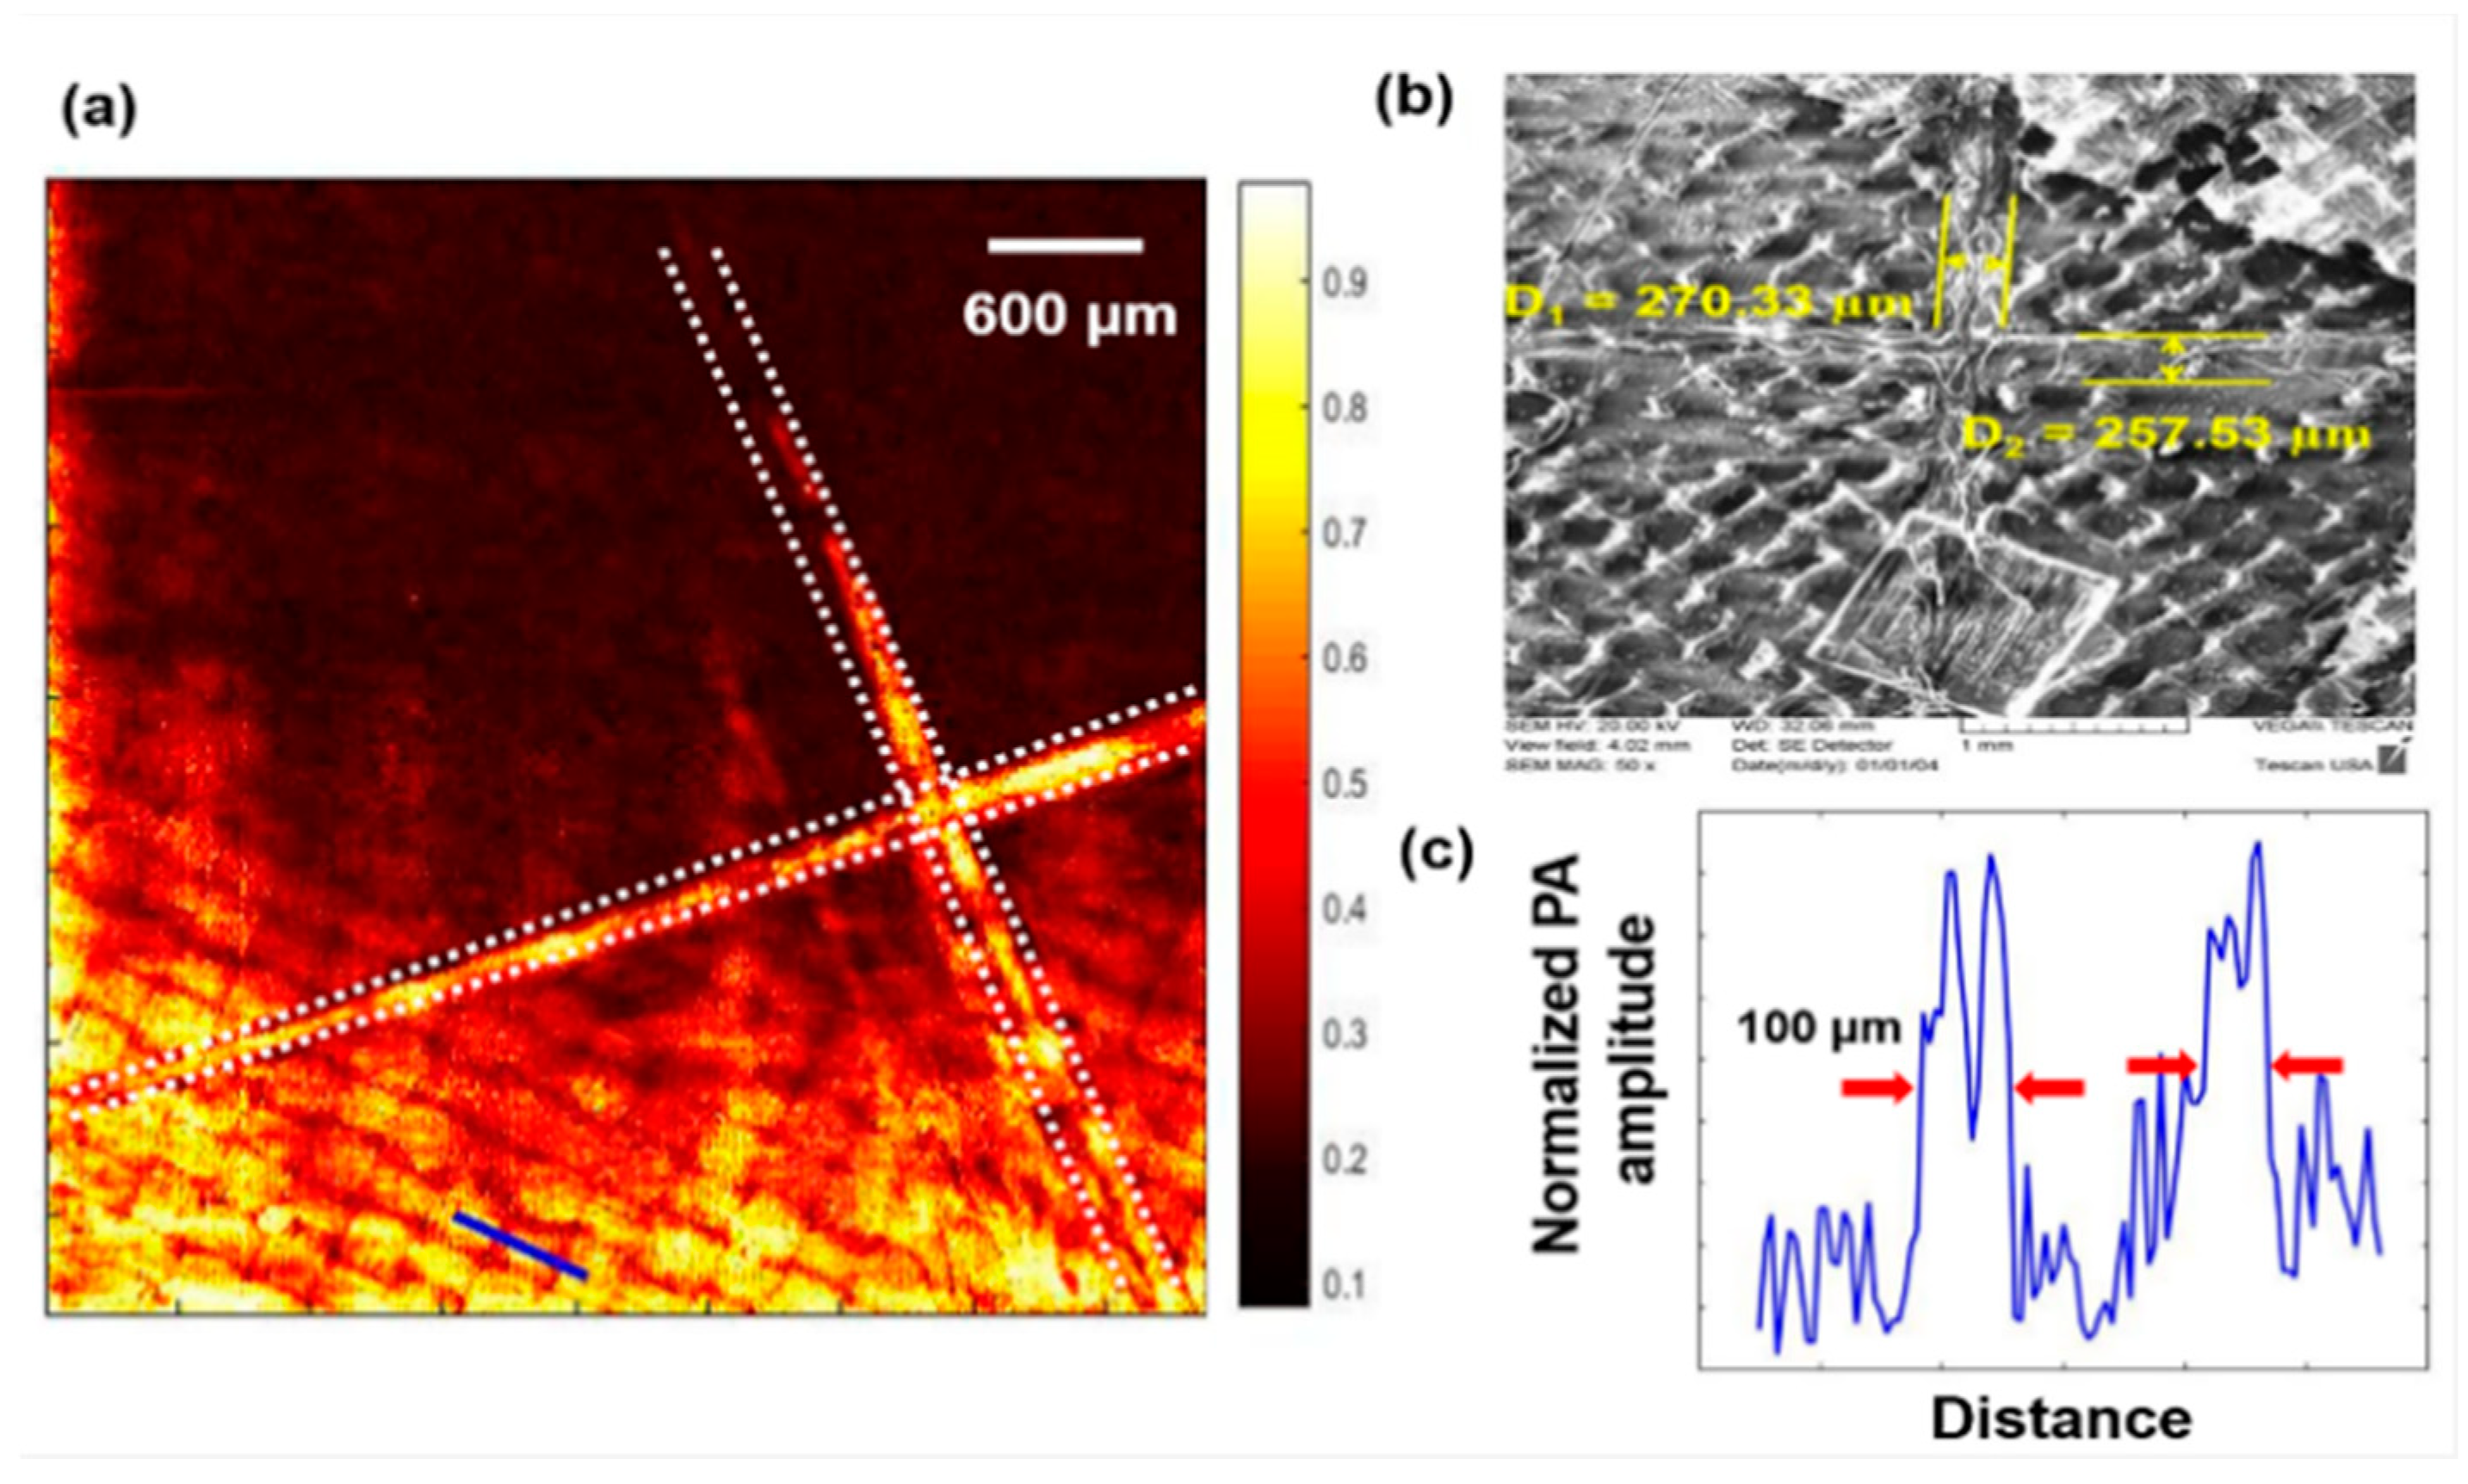
3.4. Macro-Scale Damage Detection in Composites

Low-velocity impact load can cause severe structural damage, such as delamination and transverse ply crack, in composite laminates. Demonstration of the reliable detection of macro-scale damage in composites using the developed pNDE method is critical for the engineering application. As shown in Figure 6, the macro-scale delamination and transverse ply cracks were successfully detected and represented using C-scan images at 5 different depths in the range 0–1.6 mm. The edge of transverse ply cracks was clearly drawn using the dashed line. In addition, the area of delamination at different depths was also highlighted in each subfigure. In Figure 6a–e, the size of the delamination area gradually reduced, indicating that the size of delamination was relatively large near the composite surface. This observation was reasonable since the excitation energy was reduced as it penetrated deep into composites, resulting in reduced delamination area as the depth increased. The detected macro-scale delamination and transverse ply cracks matched with the optical image of the damaged composite sample shown in Figure 6f. A typical photoacoustic signal received by the 20 MHz center frequency transducer is shown in Figure 6g. The corresponding single-sided photoacoustic signal frequency amplitude spectrum is also shown in Figure 6h. Due to the increased scan steps, the spatial resolution of macro-scale pNDE scanning was lower than that of the micro-scale pNDE detection. This is reasonable, since the extremely high spatial resolution was not necessary to identify macro-scale damage in composites. In addition, the optimization of pNDE parameters for macro-scale damage detection was able to significantly increase the scanning speed by choosing the relatively large scanning step length during the detection. Therefore, it is critical to adjust the pNDE parameters following the potential damage size and required spatial resolution, allowing the developed system to be suitable for both micro- and macro-scale damage detection in composites.

4. Discussion

Detection sensitivity is a major parameter in pNDE. Our theoretical model and calculations showed that the pulse width of the excitation laser beam was a crucial factor for the effective generation of photoacoustic waves. Mathematical analysis revealed that the resultant photoacoustic pressure was proportional to the time derivative of the excitation pulse [42,43]. Compared to the typical laser-induced ultrasound system (nanoseconds pump laser) [44,45], the implementation of the 7 picosecond pulsed laser can produce an increase in photoacoustic signal conversion efficiency, which will lead to improved detection sensitivity. Further, a higher frequency photoacoustic signal will lead to better depth resolution when paired with a high-frequency ultrasound transducer.
The lateral resolution of pNDE was estimated by the diffraction-limited spot size of the optical focus [42]. For a wavelength of 532 nm and a numerical aperture (NA) of 0.10, the lateral resolution of the pNDE micro-scale scan was theoretically determined to be 2.71 μm. This resolution was sufficient to resolve individual carbon fibers (diameter: 7–10 μm) inside the CFRP composite in a non-invasive manner (Figure 3a). The axial resolution in the depth direction was jointly determined by the laser pulse width and detection bandwidth of the ultrasonic transducer. In the macro-scale damage detection experiment, a 20 MHz ultrasonic transducer was used, which resulted in an axial imaging resolution of approximately 0.30 mm in the depth direction. In future studies, lateral resolution of the pNDE scan can be further improved by (i) increasing the NA of the objective lens, and (ii) using a shorter excitation source wavelength with the maximum imaging depth scaled accordingly. If a higher frequency transducer is employed, submicrometer spatial resolution can be achievable. This analysis indicates a new approach for microstructural determination inside CFRP composites with photoacoustic imaging for future research.
The current pNDE detection speed was limited by the single ultrasonic probe for signal collection during the scanning. However, implementing a pair of galvanometer mirrors with optical scanning can dramatically improve the imaging speed (up to 30 kHz, the limitation of a galvanometer) and should be much faster than any mechanical scanning imaging system. Further increase in laser PRR has been limited mostly by the time required to store raw data and the ultrasound propagation time inside the CFRP composites. Additionally, the system can be further optimized for real-time imaging in field applications by increasing the laser PRR of the developed pNDE system, and the goal is to reach the multi-kHz laser PRR range.
Conventional ultrasound methods and thermography are only capable of providing a contour of the damaged area rather than the detailed layer-by-layer distribution information demonstrated in the resulted images of the pDNE test [46]. Although current ultrasound-based non-destructive evaluation technologies can detect barely visible and embedded geometries, they do not have the adequate lateral resolution to identify micro-scale damage initiation in composites, especially for complex layered materials like CFRP composites. Our proposed technology has the advantage of being able to focus the excitation source to achieve a much higher lateral resolution than the ultrasound-based imaging system. Thus, the pNDE scanning method described in this paper shows great potential compared to current methods for the characterization of impact damage at multiple length scales via in situ imaging within the upper part of an in-depth damage distribution. With future hardware modifications, pNDE scans can theoretically be completed within minutes.

5. Conclusions

In this paper, we developed a pNDE system for the detection of multi-scale damage with extremely high resolution in CFRP composites. Micro-scale damage precursors in composite laminate samples were identified and represented using 2D and 3D images with a high spatial resolution of 60 µm. SEM images taken from the same location were used to validate the length and width of the detected notches on the composite surface. By adjusting the pNDE scanning parameters, the macro-scale impact damage, including delamination and transverse ply cracks, was quickly detected and represented using the ultrasonic C-scan mode. Experimental results and high-resolution 3D images generated by the described technology can be further used in complex mechanical models for prediction of the deep-layer damage propagation of composites and to evaluate the remaining useful life of composites subjected to impact and fatigue loads. Therefore, the developed pNDE system shows great potential for damage detection and quality assessment in a broad range of engineering applications, including aerospace, automobile, and civil industries.

Author Contributions

Conceptualization, L.X. and Y.L.; methodology, S.W.; software, J.E.; validation, L.T.; formal analysis, S.W. and K.P.; writing—original draft preparation, S.W. and K.P.; writing—review and editing, L.X. and Y.L. All authors have read and agreed to the published version of the manuscript.

Funding

This research received no external funding.

Conflicts of Interest

The authors declare no conflict of interest.

References

  1. Mouritz, A.P.; Bannister, M.K.; Falzon, P.; Leong, K. Review of applications for advanced three-dimensional fibre textile composites. Compos. Part A Appl. Sci. Manuf. 1999, 30, 1445–1461. [Google Scholar] [CrossRef]
  2. Agarwal, B.D.; Broutman, L.J.; Chandrashekhara, K. Analysis and Performance of Fiber Composites; John Wiley & Sons: Hoboken, NJ, USA, 2017. [Google Scholar]
  3. Croft, K.; Lessard, L.; Pasini, D.; Hojjati, M.; Chen, J.; Yousefpour, A. Experimental study of the effect of automated fiber placement induced defects on performance of composite laminates. Compos. Part A Appl. Sci. Manuf. 2011, 42, 484–491. [Google Scholar] [CrossRef] [Green Version]
  4. Heslehurst, R.B. Defects and Damage in Composite Materials and Structures; CRC Press: Boca Raton, FL, USA, 2014. [Google Scholar]
  5. Dahmene, F.; Yaacoubi, S.; Mountassir, M.E. Acoustic emission of composites structures: Story, success, and challenges. Phys. Procedia 2015, 70, 599–603. [Google Scholar] [CrossRef] [Green Version]
  6. Kordatos, E.; Aggelis, D.; Matikas, T. Monitoring mechanical damage in structural materials using complimentary NDE techniques based on thermography and acoustic emission. Compos. Part B Eng. 2012, 43, 2676–2686. [Google Scholar] [CrossRef]
  7. Steinberger, R.; Leitão, T.V.; Ladstätter, E.; Pinter, G.; Billinger, W.; Lang, R. Infrared thermographic techniques for non-destructive damage characterization of carbon fibre reinforced polymers during tensile fatigue testing. Int. J. Fatigue 2006, 28, 1340–1347. [Google Scholar] [CrossRef]
  8. Scott, I.; Scala, C. A review of non-destructive testing of composite materials. NDT Int. 1982, 15, 75–86. [Google Scholar] [CrossRef]
  9. Su, Z.; Ye, L.; Lu, Y. Guided Lamb waves for identification of damage in composite structures: A review. J. Sound Vib. 2006, 295, 753–780. [Google Scholar] [CrossRef]
  10. Birt, E.; Smith, R. A review of NDE methods for porosity measurement in fibre-reinforced polymer composites. Insight Non Destr. Test. Cond. Monit. 2004, 46, 681–686. [Google Scholar] [CrossRef]
  11. Kessler, S.S.; Spearing, S.M.; Soutis, C. Damage detection in composite materials using Lamb wave methods. Smart Mater. Struct. 2002, 11, 269. [Google Scholar] [CrossRef] [Green Version]
  12. Chang, Q.; Peng, T.; Liu, Y. Tomographic damage imaging based on inverse acoustic wave propagation using k-space method with adjoint method. Mech. Syst. Signal Process. 2018, 109, 379–398. [Google Scholar] [CrossRef]
  13. Sohn, H.; Farrar, C.R.; Hemez, F.M.; Shunk, D.D.; Stinemates, D.W.; Nadler, B.R.; Czarnecki, J.J. A review of structural health monitoring literature: 1996–2001. Los Alamos Natl. Lab. USA 2003, 1–7, Technical Repts LA-13976-MS. [Google Scholar]
  14. Ou, J.; Li, H. Structural health monitoring in mainland China: Review and future trends. Struct. Health Monit. 2010, 9, 219–231. [Google Scholar]
  15. Farrar, C.R.; Worden, K. Structural Health Monitoring: A Machine Learning Perspective; John Wiley & Sons: Hoboken, NJ, USA, 2012. [Google Scholar]
  16. Peng, Y.; Dong, M.; Zuo, M.J. Current status of machine prognostics in condition-based maintenance: A review. Int. J. Adv. Manuf. Technol. 2010, 50, 297–313. [Google Scholar] [CrossRef]
  17. Liu, Y.; Nayak, S. Structural health monitoring: State of the art and perspectives. JOM 2012, 64, 789–792. [Google Scholar] [CrossRef]
  18. Duan, W.H.; Wang, Q.; Quek, S.T. Applications of piezoelectric materials in structural health monitoring and repair: Selected research examples. Materials 2010, 3, 5169–5194. [Google Scholar] [CrossRef] [PubMed] [Green Version]
  19. Liu, Y.; Chattopadhyay, A. Low-velocity impact damage monitoring of a sandwich composite wing. J. Intell. Mater. Syst. Struct. 2013, 24, 2074–2083. [Google Scholar] [CrossRef]
  20. Baptista, F.G.; Budoya, D.E.; de Almeida, V.A.; Ulson, J.A.C. An experimental study on the effect of temperature on piezoelectric sensors for impedance-based structural health monitoring. Sensors 2014, 14, 1208–1227. [Google Scholar] [CrossRef]
  21. Min, J.; Park, S.; Yun, C.-B.; Lee, C.-G.; Lee, C. Impedance-based structural health monitoring incorporating neural network technique for identification of damage type and severity. Eng. Struct. 2012, 39, 210–220. [Google Scholar] [CrossRef]
  22. Chiacchiarelli, L.M.; Rallini, M.; Monti, M.; Puglia, D.; Kenny, J.M.; Torre, L. The role of irreversible and reversible phenomena in the piezoresistive behavior of graphene epoxy nanocomposites applied to structural health monitoring. Compos. Sci. Technol. 2013, 80, 73–79. [Google Scholar] [CrossRef]
  23. Vertuccio, L.; Guadagno, L.; Spinelli, G.; Lamberti, P.; Tucci, V.; Russo, S. Piezoresistive properties of resin reinforced with carbon nanotubes for health-monitoring of aircraft primary structures. Compos. Part B Eng. 2016, 107, 192–202. [Google Scholar] [CrossRef]
  24. López-Higuera, J.M.; Cobo, L.R.; Incera, A.Q.; Cobo, A. Fiber optic sensors in structural health monitoring. J. Lightwave Technol. 2011, 29, 587–608. [Google Scholar] [CrossRef]
  25. Kinet, D.; Mégret, P.; Goossen, K.; Qiu, L.; Heider, D.; Caucheteur, C. Fiber Bragg grating sensors toward structural health monitoring in composite materials: Challenges and solutions. Sensors 2014, 14, 7394–7419. [Google Scholar] [CrossRef] [PubMed]
  26. Liu, Y.; Kim, S.B.; Chattopadhyay, A.; Doyle, D.T. Application of system-identification techniquest to health monitoring of on-orbit satellite boom structures. J. Spacecr. Rocket. 2011, 48, 589–598. [Google Scholar] [CrossRef]
  27. Liu, Y.; Mohanty, S.; Chattopadhyay, A. Condition based structural health monitoring and prognosis of composite structures under uniaxial and biaxial loading. J. Nondestruct. Eval. 2010, 29, 181–188. [Google Scholar] [CrossRef]
  28. Liu, Y.; Fard, M.Y.; Chattopadhyay, A.; Doyle, D. Damage assessment of CFRP composites using a time–frequency approach. J. Intell. Mater. Syst. Struct. 2012, 23, 397–413. [Google Scholar] [CrossRef]
  29. Scruby, C.B.; Drain, L.E. Laser Ultrasonics Techniques and Applications; CRC Press: Boca Raton, FL, USA, 1990. [Google Scholar]
  30. Gusev, V.E.; Karabutov, A.A. Laser optoacoustics. NASA STI/Recon Tech. Rep. A 1991, 93. [Google Scholar]
  31. Karabutov, A.; Podymova, N. Nondestructive evaluation of fatigue-induced changes in the structure of composites by an ultrasonic method using a laser. Mech. Compos. Mater. 1995, 31, 301–304. [Google Scholar] [CrossRef]
  32. Karabutov, A.; Podymova, N. Quantitative analysis of the influence of voids and delaminations on acoustic attenuation in CFRP composites by the laser-ultrasonic spectroscopy method. Compos. Part B Eng. 2014, 56, 238–244. [Google Scholar] [CrossRef]
  33. Karabutov, A.; Podymova, N. Nondestructive porosity assessment of CFRP composites with spectral analysis of backscattered laser-induced ultrasonic pulses. J. Nondestruct. Eval. 2013, 32, 315–324. [Google Scholar] [CrossRef]
  34. Monchalin, J.P. Laser-Ultrasonics: From the Laboratory to Industry. In Proceedings of the AIP Conference Proceedings; American institue of physics: College Park, MD, USA, 2004; pp. 3–31. [Google Scholar]
  35. Kim, J.; Jhang, K.-Y. Non-contact measurement of elastic modulus by using laser ultrasound. Int. J. Precis. Eng. Manuf. 2015, 16, 905–909. [Google Scholar] [CrossRef]
  36. Wang, L.V. Tutorial on photoacoustic microscopy and computed tomography. IEEE J. Sel. Top. Quantum Electron. 2008, 14, 171–179. [Google Scholar] [CrossRef] [Green Version]
  37. Lao, Y.; Xing, D.; Yang, S.; Xiang, L. Noninvasive photoacoustic imaging of the developing vasculature during early tumor growth. Phys. Med. Biol. 2008, 53, 4203. [Google Scholar] [CrossRef] [PubMed]
  38. Tang, S.; Chen, J.; Samant, P.; Stratton, K.; Xiang, L. Transurethral photoacoustic endoscopy for prostate cancer: A simulation study. IEEE Trans. Med Imaging 2016, 35, 1780–1787. [Google Scholar] [CrossRef] [PubMed]
  39. Yang, D.; Xing, D.; Yang, S.; Xiang, L. Fast full-view photoacoustic imaging by combined scanning with a linear transducer array. Opt. Express 2007, 15, 15566–15575. [Google Scholar] [CrossRef] [PubMed]
  40. Treeby, B.E.; Cox, B.T. k-Wave: MATLAB toolbox for the simulation and reconstruction of photoacoustic wave fields. J. Biomed. Opt. 2010, 15, 021314. [Google Scholar] [CrossRef]
  41. Pelivanov, I.; Ambroziński, Ł.; Khomenko, A.; Koricho, E.G.; Cloud, G.L.; Haq, M.; O’Donnell, M. High resolution imaging of impacted CFRP composites with a fiber-optic laser-ultrasound scanner. Photoacoustics 2016, 4, 55–64. [Google Scholar] [CrossRef] [Green Version]
  42. Wang, L.V.; Hu, S. Photoacoustic tomography: In Vivo imaging from organelles to organs. Science 2012, 335, 1458–1462. [Google Scholar] [CrossRef] [Green Version]
  43. Winkler, A.M.; Maslov, K.I.; Wang, L.V. Noise-equivalent sensitivity of photoacoustics. J. Biomed. Opt. 2013, 18, 097003. [Google Scholar] [CrossRef] [Green Version]
  44. Zhang, J.; Li, W.; Cui, H.-L.; Shi, C.; Han, X.; Ma, Y.; Chen, J.; Chang, T.; Wei, D.; Zhang, Y. Nondestructive evaluation of carbon fiber reinforced polymer composites using reflective terahertz imaging. Sensors 2016, 16, 875. [Google Scholar] [CrossRef] [Green Version]
  45. Dunkers, J.P.; Sanders, D.P.; Hunston, D.L.; Everett, M.J.; Green, W.H. Comparison of optical coherence tomography, X-ray computed tomography, and confocal microscopy results from an impact damaged epoxy/E-glass composite. J. Adhes. 2002, 78, 129–154. [Google Scholar] [CrossRef]
  46. Burch, S.; Bealing, N. A physical approach to the automated ultrasonic characterization of buried weld defects in ferritic steel. NDT Int. 1986, 19, 145–153. [Google Scholar] [CrossRef]
Figure 1. Developed photoacoustic non-destructive evaluation (pNDE) system. (a) A schematic of the pNDE system, showing the following key components: UT, ultrasonic transducer; SS, scanning stage; OL, objective lens; AMP, amplifiers; DAQ, data acquisition card; Laser, green laser (532 nm). (b) Experimental setup of the pNDE system, the transducer and the 3D-printed water container are further magnified to demonstrate the sample set up. (c) A schematic of A-scan, B-scan, and C-scan for ultrasonic signal presentation.
Applsci 10 02106 g001
Figure 2. Photoacoustic A-scan signal. (a) Typical full bandwidth signal with an assumed signal attenuation function (red dashed curve) and (b) corrected A-scan signal by normalizing using the exponent of Equation (3).
Applsci 10 02106 g002
Figure 3. X-Y plane image. (a) pNDE X-Y plane image; the ‘X’ marking is highlighted. (b) SEM image; the width of the ‘X’ marking is calculated. (c) Full width at half maximum (FWHM) measurements along the blue line on the pNDE image, which are taken as the lateral resolution of the image.
Applsci 10 02106 g003
Figure 4. The 3D C-scan images of micro-scale damage in composites. (ae) X-Y plane slices at a depth of 0.001, 0.025, 0.05, 0.065, and 0.15 mm, respectively. (f) The photoacoustic maximum-amplitude image projection (average) from the top of the carbon fiber-reinforced plastic (CFRP) composites. (g) A 3D C-scan image of a rotating 3D model. (h) Grid pattern explanation image.
Applsci 10 02106 g004
Figure 5. (a,b) Typical B-scan images showing the vertical cross-section of the detected notch in the composite plate, at positions: x = 1.6 and 4.1 mm, respectively (from left to right). (c) C-scan image showing the position of B-scan images in the X-Y plane.
Applsci 10 02106 g005
Figure 6. A pulsed laser-induced pNDE system to detect macro-scale delamination and transverse ply cracks in composites. (ae) The 2D C-scan images showing the size of delamination and transverse ply cracking. (f) Optical images using the detected impact damage of composites. (g) A plot of the raw photoacoustic signal. (h) Single-sided photoacoustic signal frequency amplitude spectrum plot.
Applsci 10 02106 g006

