The Design and Investigation of a Cooling System for a High Power Ni-MH Battery Pack in Hybrid Electric Vehicles


1
Jiangsu University, Zhenjiang 212000, China
2
Corun CHS Technology co., LTD, Shanghai 201501, China
3
Soochow University, Suzhou 215006, China
4
Nantong University, Nantong 226019, China
5
Shanghai Jiao Tong University, Shanghai 200240, China
*
Authors to whom correspondence should be addressed.
Appl. Sci. 2020, 10(5), 1660; https://doi.org/10.3390/app10051660
Submission received: 15 January 2020
/
Revised: 25 February 2020
/
Accepted: 26 February 2020
/
Published: 1 March 2020
(This article belongs to the Section Mechanical Engineering)
Abstract
:Featured Application
Authors are encouraged to provide a concise description of the specific application or a potential application of the work. This section is not mandatory.
Abstract
High power cylindrical Ni-MH battery cells have a heavy heat load because of their high discharge rate and large equivalent internal resistance. This heavy heat load, together with an imbalanced flow in parallel liquid cooling systems, can lead to variances in the temperature of each cell in the entire battery pack, thereby reducing the life cycle of the battery pack. In this paper, a parallel-series combined liquid cooling system for a 288V Ni-MH battery pack was designed, and several parameters that influence the flow balance of the system by heat transfer and fluid dynamics were calculated. Then, a thermal-fluid simulation was executed with different parameters using StarCCM+ software, and the simulation results were validated by a battery pack temperature experiment on a bench and in a vehicle. The results indicate that the cell’s temperature and temperature differences can be kept within an ideal range. We also determined that within the battery power requirements and structural spacing limits, the total flow rate of the cooling liquid, the cross-sectional area ratio of the main pipe to the branch pipes, and the number of internal supporting walls in each branch pipe need to be large enough to minimize the cell’s maximum temperature and temperature differences.
1. Introduction
In recent years, the market of novel energy vehicles, including electric vehicles and hybrid electric vehicles, has grown fast [1,2]. Power batteries, as one of the most important parts in electric vehicles (EVs) and hybrid electric vehicles (HEVs) [3], have attracted the majority of attention from researchers and engineers. A whole battery pack in a vehicle commonly contains several single cells connected serially or in parallel [4]. A large quantity of battery cells will generate a large amount of heat and cause temperatures to rise during the charge and discharge process [5,6]. A cell’s voltage, energy, efficiency, and life cycle are deeply influenced by its operating temperature [7,8]. Further thermal runaway and safety issues can occur if the heat is not able to be dissipated effectively [9]. In addition, the temperature difference between each cell can lead to a variable capacity descending rate, which also reduces the life cycle of a battery pack. At temperatures exceeding 50 °C, charging efficiency and battery life deteriorate the most rapidly due to heat [10,11]. Therefore, it is necessary to pay more attention to the research of battery thermal management system (BTMS), which is very important for battery performance, life and safety. Pesaran et al. [12] noted that Ni-MH and Li-ion batteries’ ideal operating temperatures range from 25 to 40 °C, and the temperature differences between the cells within a battery pack should be below 5 °C.
1.1. Literature Review
Plenty of works have been done in the field of battery thermal management system for commercially sold EVs and HEVs in the market, such as direct air cooling, liquid cooling, phase change material, heat pipes, hybrid cooling system and other emerging cooling technologies.
The air-cooling system uses air as the heat exchange medium to let the air sweep across the battery surface to take away the heat generated by the battery. The air-cooling system is the most widely used cooling mode with simple structure, light weight, low cost and convenient maintenance. Chen YF et al. [13] showed that the thermal conductivity of Li-ion battery was low, and air cooling alone could not meet the requirements of thermal management. Harmel et al. [14] and Chen et al. [15] analyzed the thermal balance of li-ion batteries and found that when the wind speed reached a certain degree, increasing the wind speed had little effect on the heat dissipation effect of the batteries. Nelson et al. [16] have shown that the cooling effect of an air-cooling system is poor when the ambient temperature is high. In addition, the air-cooling system has a large volume and poor protection level, which limits its application in battery packs with a large scale.
The liquid-cooling system uses the circulating flow of the coolant to take away the heat generated in the battery. The coolant has higher specific heat capacity and higher heat exchange efficiency, which makes it easier to meet the cooling and heating requirements of the battery comparing with air. The research of Pesaran et al. [7] and Nelson et al. [16] confirmed this point of view. The liquid-cooling system has been widely studied and applied in recent years because of its good cooling effect and reasonable cost, which has allowed the technology to develop rapidly. Huo et al. [17] showed that the number of channels, flow rate and liquid flow direction have an important impact on the cooling effect of the straight cooling channel, and gave suggestions on the number of channels and the requirement flow rate. Jarrett et al. [18] studied the influence of different serpentine structures on the temperature uniformity and average temperature of the cooling plate. However, their research only focuses on a single cooling plate corresponding to several cells, not on the real, large-scale battery thermal management system, which comprehensively considered the flow distribution, pressure drop and temperature difference. Moreover, the effect of heat generation and heat dissipation under different current ratio is worthy of further study.
The heat pipe is a technology of thermal management based on the principle of phase change heat transfer. Flexible geometry, low maintenance requirements and good thermal conductivity make it attractive as a BTMS option [19,20,21], however, the complex manufacturing process and high cost limit the large-scale use of heat pipe [22]. The PCM cooling system uses phase change materials to absorb the heat generated by the battery in the form of latent heat, which has the advantages of excellent uniform temperature effect and large heat storage capacity [23,24], but with the disadvantages of low thermal conductivity and volume change affecting the application and promotion of PCM [25]. The independent passive phase change material system and heat pipe system are only conducive to heat transfer and storage. For large-scale or high-power battery systems, it is difficult to transfer the heat to the outside of the battery pack by itself in the natural state. It is necessary to combine independent cooling technology into a hybrid heat management system [26], for example, PCM and air-cooling combination [27], PCM and liquid cooling combination [28], PCM, HP and air-cooling combination [29], etc. The hybrid thermal management system combines the advantages of various cooling technologies, but the design cost and material cost are too expensive, and the implementation of the system is very complex.
Several other emerging cooling technologies have been studied recently, such as thermoelectric coolers (TECs) [30], thermo–acoustic refrigerators (TARs) [31], active magnetic regenerators (AMRs) [32], and internal cooling in battery cells [33]. These techniques offer many advantages, but they require much more works before they can be commercially applied in vehicles. Technology readiness level (TRL), designed by NASA in the late 1990s is a useful evaluation towards the market (Table 1). The TRL index can be used as a rough estimation of the required costs, time to market, risks taken, and so on [34]. With the increase of TRL, the technical is more mature and close to mass production.
In conclusion, although different thermal management systems have their own advantages and disadvantages, liquid cooling is generally the best solution of thermal management systems. Qu [35] evaluated the battery thermal management system by the analytic hierarchy process (AHP) proposed by Saaty [36], a famous American operational research scientist. The results also prove the advantages of a liquid-cooling system comprehensively considering technology, maturity, consumption, cost and other factors. The global market sales data shows the absolute advantages of air-cooling and liquid- cooling systems. The battery pack of HEVs is small and arranged inside the vehicle, and air cooling is basically adopted, such as in the Toyota Prius; the battery pack of EVs and PHEVs is large and arranged outside the vehicle, and liquid-cooling system is basically adopted, such as in the Tesla Model 3.
The research object of this paper is a Ni-MH battery pack applied to a hybrid sport utility vehicle (SUV), which has a higher current ratio than Prius and is mounted on the bottom of the chassis to obtain a flat trunk space. In order to achieve better thermal management performance, a liquid-cooling system is selected and applied.
1.2. Contributions and Organization
Pesaran et al. [37] systematically put forward the design process of BTMS: (1) determine the design objective and layout boundary; (2) determine the heat generation rate and thermal characteristic parameters of the battery; (3) determine the channel structure and preliminary formulation scheme; (4) determine the feasibility scheme through numerical simulation; and (5) experiment verification and design optimization.
In this paper, a performance-optimized and engineering-oriented properly liquid cooled plate was designed to meet the requirements of a battery pack in a certain hybrid SUV. In addition to the five steps before, this paper particularly emphasizes the role of theoretical calculation, which, together with numerical simulation, effectively reduces development costs, shortens development cycle, and improves development success probability and maturity. The organization of this study is introduced in Figure 1.
The internal parameters of this cooling plate, including the cross-sectional area ratio of the main pipe to the branch pipes and the number of internal supporting walls in the branch pipe, were analyzed and studied. In addition to these inner parameters, the boundary conditions for the flow uniformity, pressure loss, flow rate, differential currents, differential inlet temperatures, and temperature performance of the pipe-based mixed parallel-series liquid-cooling system were also analyzed and studied. Three-dimensional finite element models of the packs’ cooling systems and batteries were set up and numerically simulated. Then, a temperature test platform with the battery pack, battery tester, and cooling tank was established to verify the theoretical design and simulation.
2. Preliminary Design
2.1. Parameters of the Battery Pack
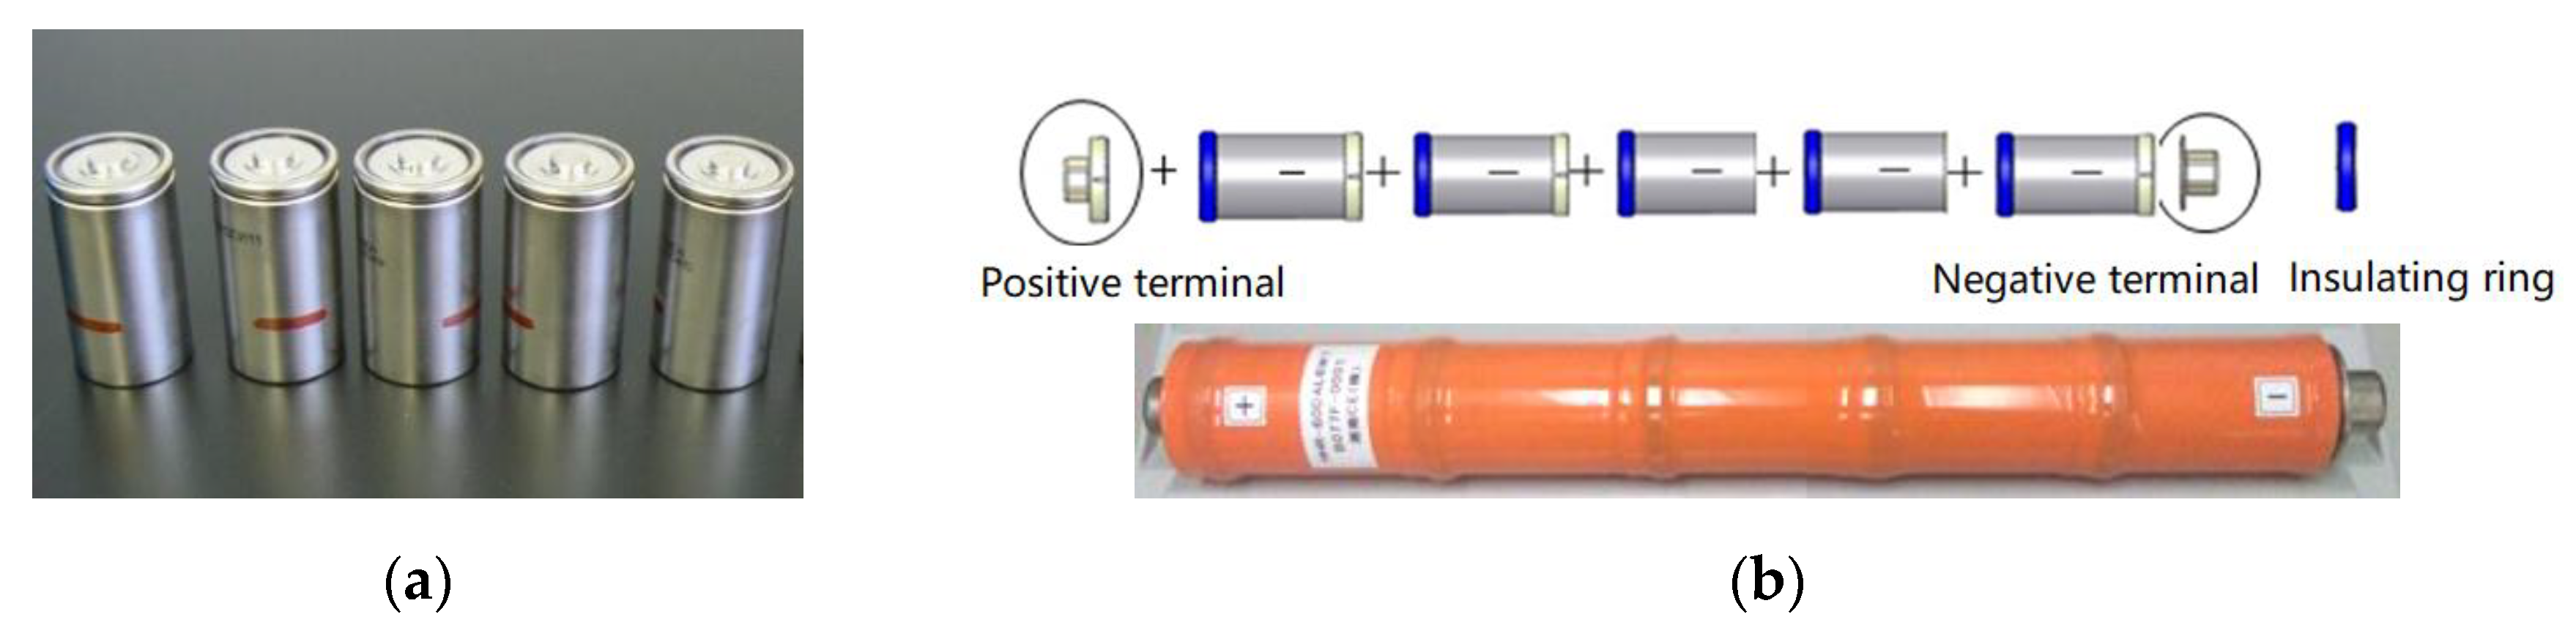
The battery pack was installed in a fully hybrid SUV, in which the electric power system requires a voltage rating of 288 V and 40 kW peak power. Considering the safety of NiMH batteries and the advantages of a wide temperature range, a NiMH battery was selected to meet the system requirement of the vehicle in this research project. Each single battery cell was a cylinder type and is used in HEVs, including the Toyota Prius I, Honda Insight, and Honda Civic; about 600 thousand sets have been mass produced so far. The manufacturer of this battery used to be Shonan Corun Energy Co., Ltd. (Kanagawa, Japan), but it was acquired and is now produced by Hunan Co-power EV Battery co., Ltd. (Changsha, China). The shape of the battery cells are shown in Figure 2a, and the electrical parameters are shown in Table 2. Each cell has a 6 Ah rated capacity, a 1.2 V rated voltage, and a peak discharge power of 185 W. A total of 240 battery cells were connected in serial to meet the system requirements of the vehicle. To improve the integration efficiency, a commercial L5 module, formed by welding five cells in series, and a total of 48 L5 modules, were used. These L5 modules are designed to be installed in two identical battery modules. Each battery module contains 24 L5 modules, which are arranged in two layers with 12 L5 modules in each layer. One of the two battery modules with a cooling plate is shown in Figure 2b.
2.2. Structure of the Cooling Plate
To ensure a long life cycle, good capacity performance, and good power performance, the battery is designed to operate at a target temperature range (25 to 45 °C), and the temperature difference between the cells should be within 5 °C. Considering the overall cost, system complexity, heat transfer performance, etc., a liquid-cooling system was designed and is presented in Figure 3.
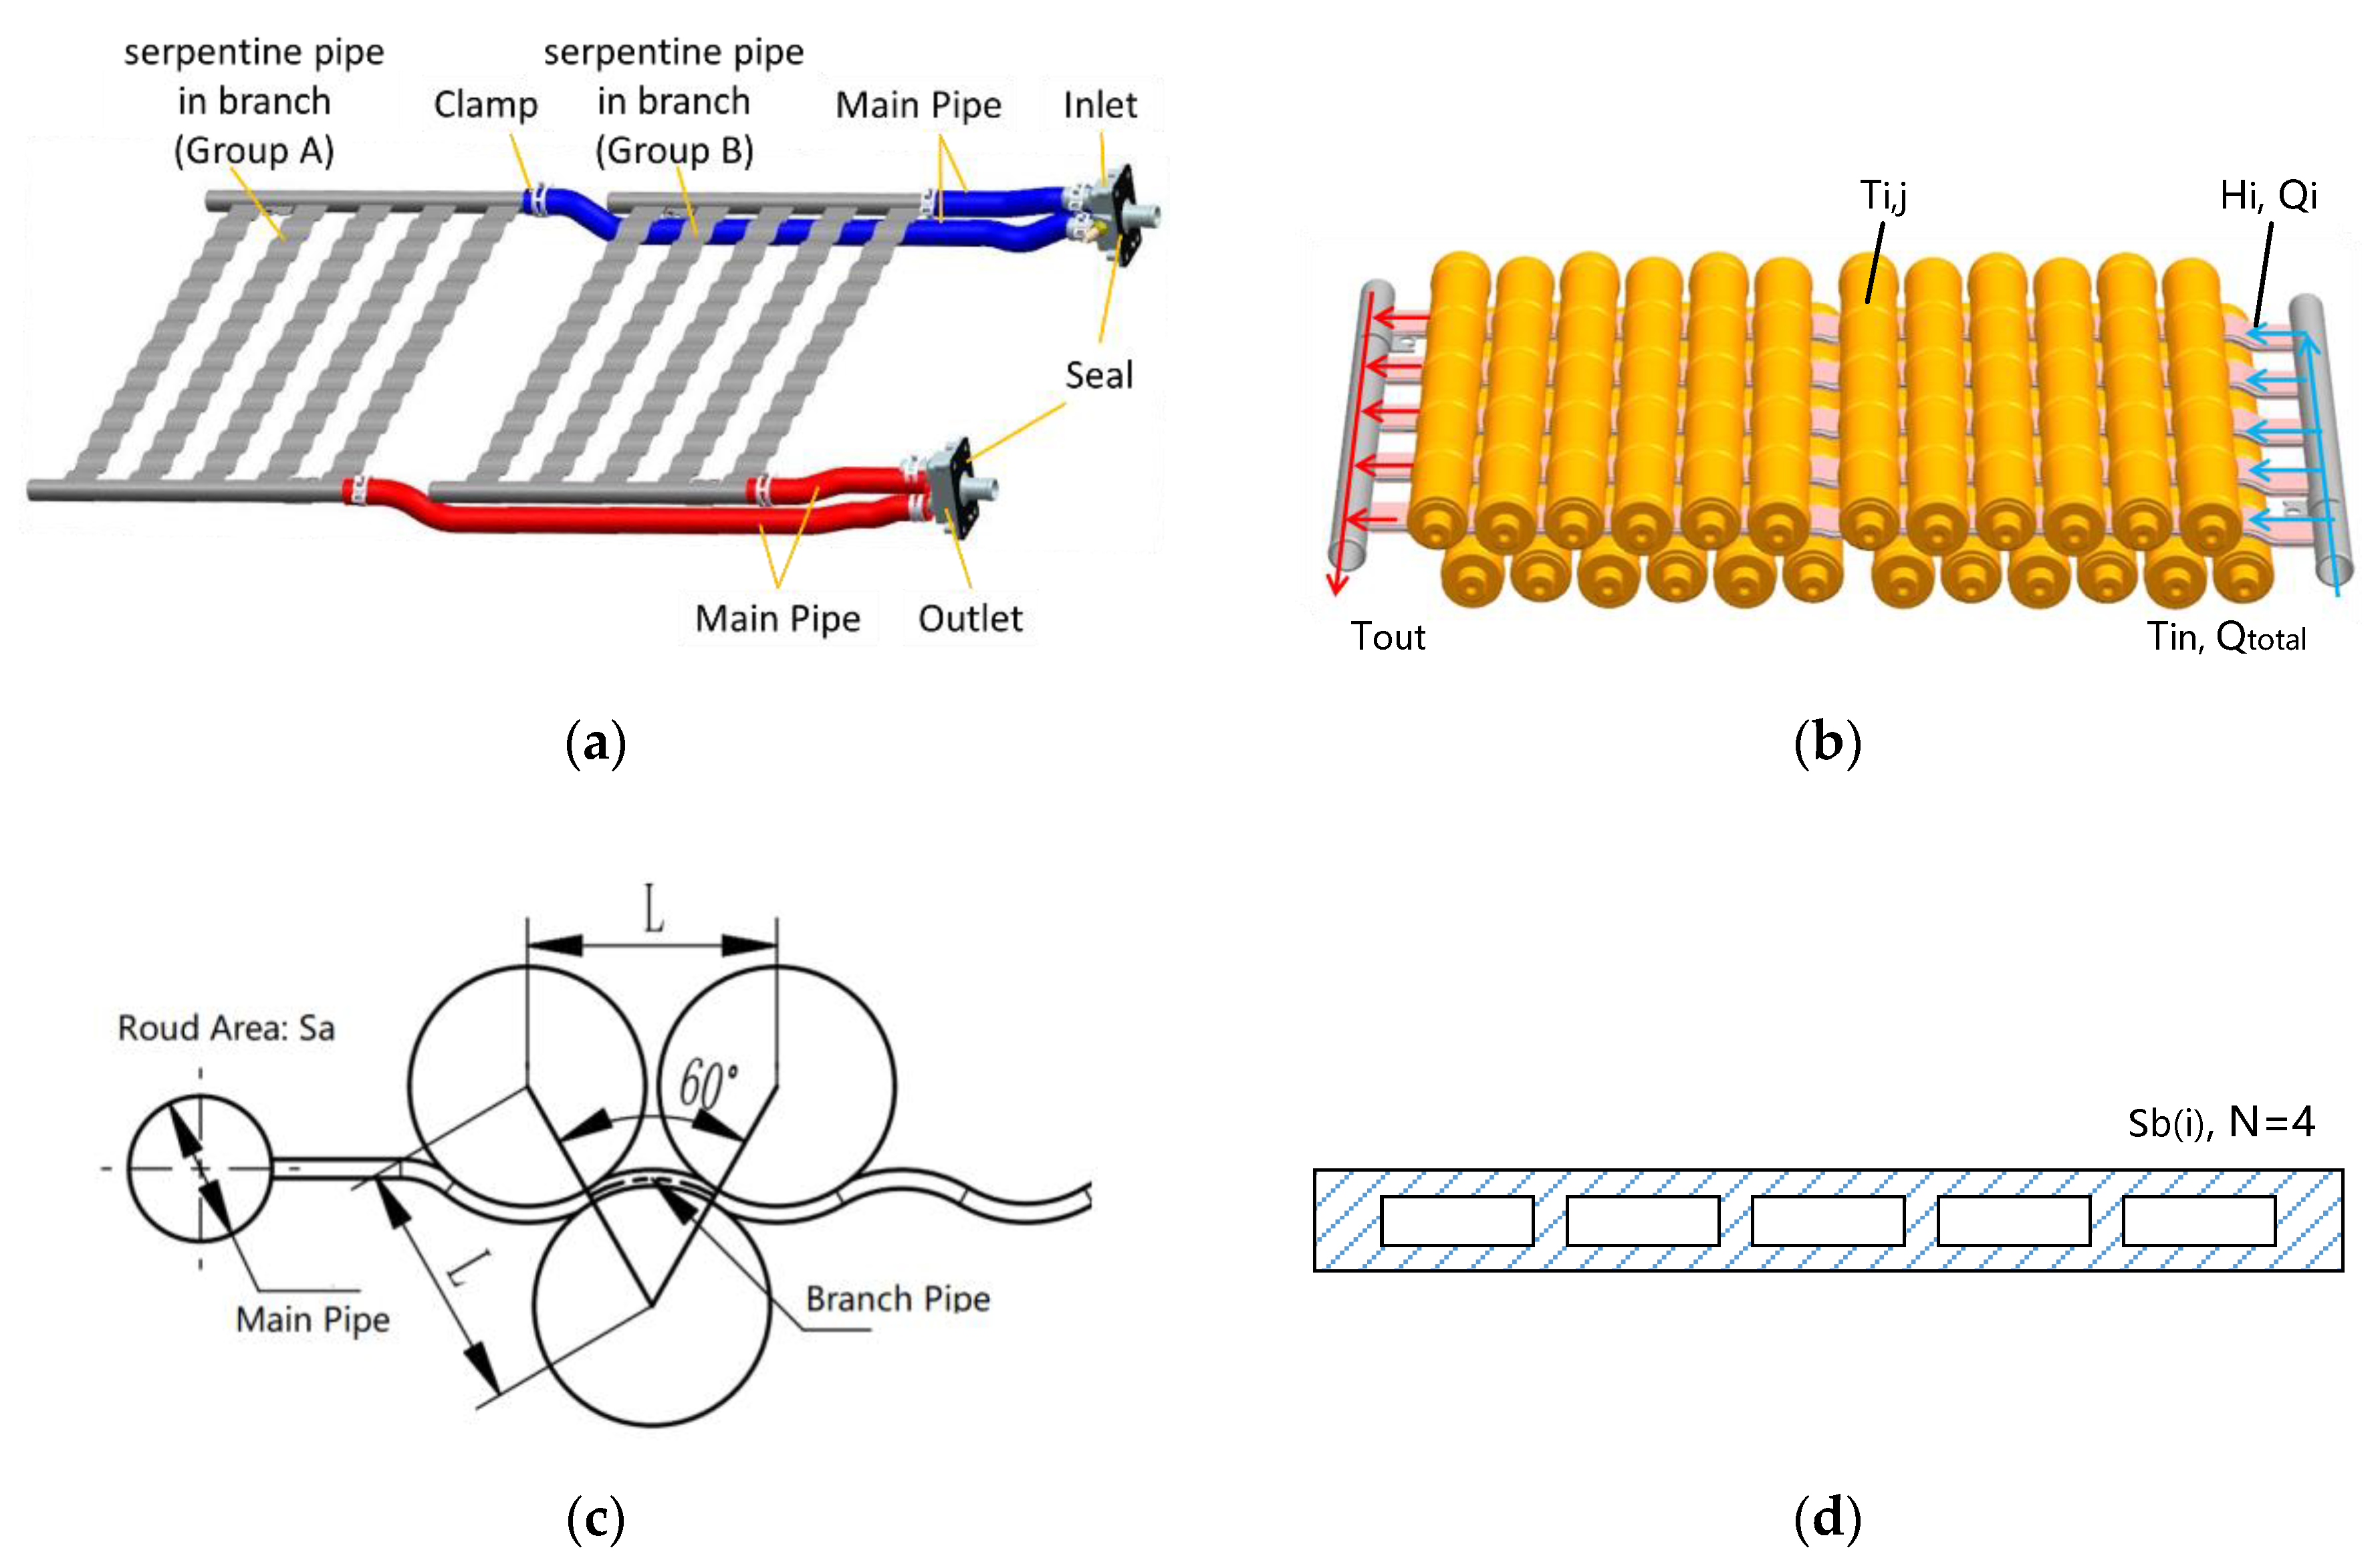
The whole battery pack consists of two battery modules, and the cooling system also includes two cooling modules. The two cooling modules were connected in parallel, as shown in Figure 3a. Each cooling module cools one battery module, as shown in Figure 3b. The cooling module consists of one inlet pipe, one outlet pipe, and five serpentine pipes. Five serpentine pipes were connected in parallel, and the inlet was designed at a lower horizon than the outlet to facilitate expelling bubbles. A total of 24 battery cells were placed in contact with each serpentine pipe and cooled one by one in series, and thermal silica gel pads were added between the cells and cooling pipes to improve the thermal contact. This structure forms a mixed parallel-series cooling system.
In addition, because the cross-section was rectangular with a large width to height ratio (30 × 2.75 mm), this structure required support walls inside to prevent deformation under stress. This stress occurs because of two phenomena: the first is that the straight pipe is extruded into the curved pipe during the production process, and the other is that the pipe is always under the pressure of the battery cells and the bracket during the operation process. According to the section size of the pipes mentioned in this paper, about 3~4 internal supporting walls can overcome this stress to prevent deformation. The internal supporting walls will divide the flow into several independent flow paths and form a harmonica-like structure. Parameter N represents the number of internal walls within one serpentine pipe (e.g., in Figure 3d N = 4). The number of internal walls will affect the heat transfer and pressure drop of the pipes. How to choose a suitable number of internal walls is of great significance and will be studied and analyzed in Section 4.
3. Theoretical Analysis
To improve the temperature’s uniformity and reduce the maximum temperature between battery cells, despite the assembly errors and production errors of cells and structural components, it is necessary to reduce the flow unevenly between pipes and increase the temperature along each pipe. Since the serpentine pipe cannot be changed much, only the inner diameter (D) of the main (in/out) pipe was adjusted to improve flow consistency.
We next define the cross-sectional area ratio δ:
where Sa and Sb are the cross-sectional area of the main pipe and serpentine pipe, respectively.
The bias rate of flow β is defined as the maximum relative flow rate difference between each branch (Qi denotes the mass flow rate in branch i):
In this section, a thermal model of the heat transfer process of each cell at a steady state is developed, and then the thermal–hydraulic performance of each cooling channel is investigated. The related symbols are defined in Nomenclature.
3.1. Heat Generation Process
As shown in formula (3), the heat generation of Ni-MH batteries includes electrochemical reaction heat (Φr), polarization heat (Φp), side reaction heat (Φs), and Joule heat (Φj) [38]. The operation process is divided into two phases: the normal charge–discharge phase and the overcharge phase. The calorific value is related to the magnitude and direction of the current (I). Because the SOC working range is controlled within 30%~70% to avoid overcharging in HEVs, the sub reaction heat is approximately zero. According to the exothermic charge and endothermic discharge, the total reaction heat can be ignored by using alternating current.
Therefore, the calorific value mainly comes from the polarization heat and Joule heat. Since the polarization resistance (Rp) and electronic resistance (Re) cannot be calculated directly, the total internal DC resistance (Rt) is used for the equivalent calculation, which is the sum of the polarization resistance and electronic resistance. The internal resistance of the cells is treated as a constant, which means that it does not vary with changes in the state of charge (SOC), temperature, or other parameters.
3.2. Heat Transfer Process
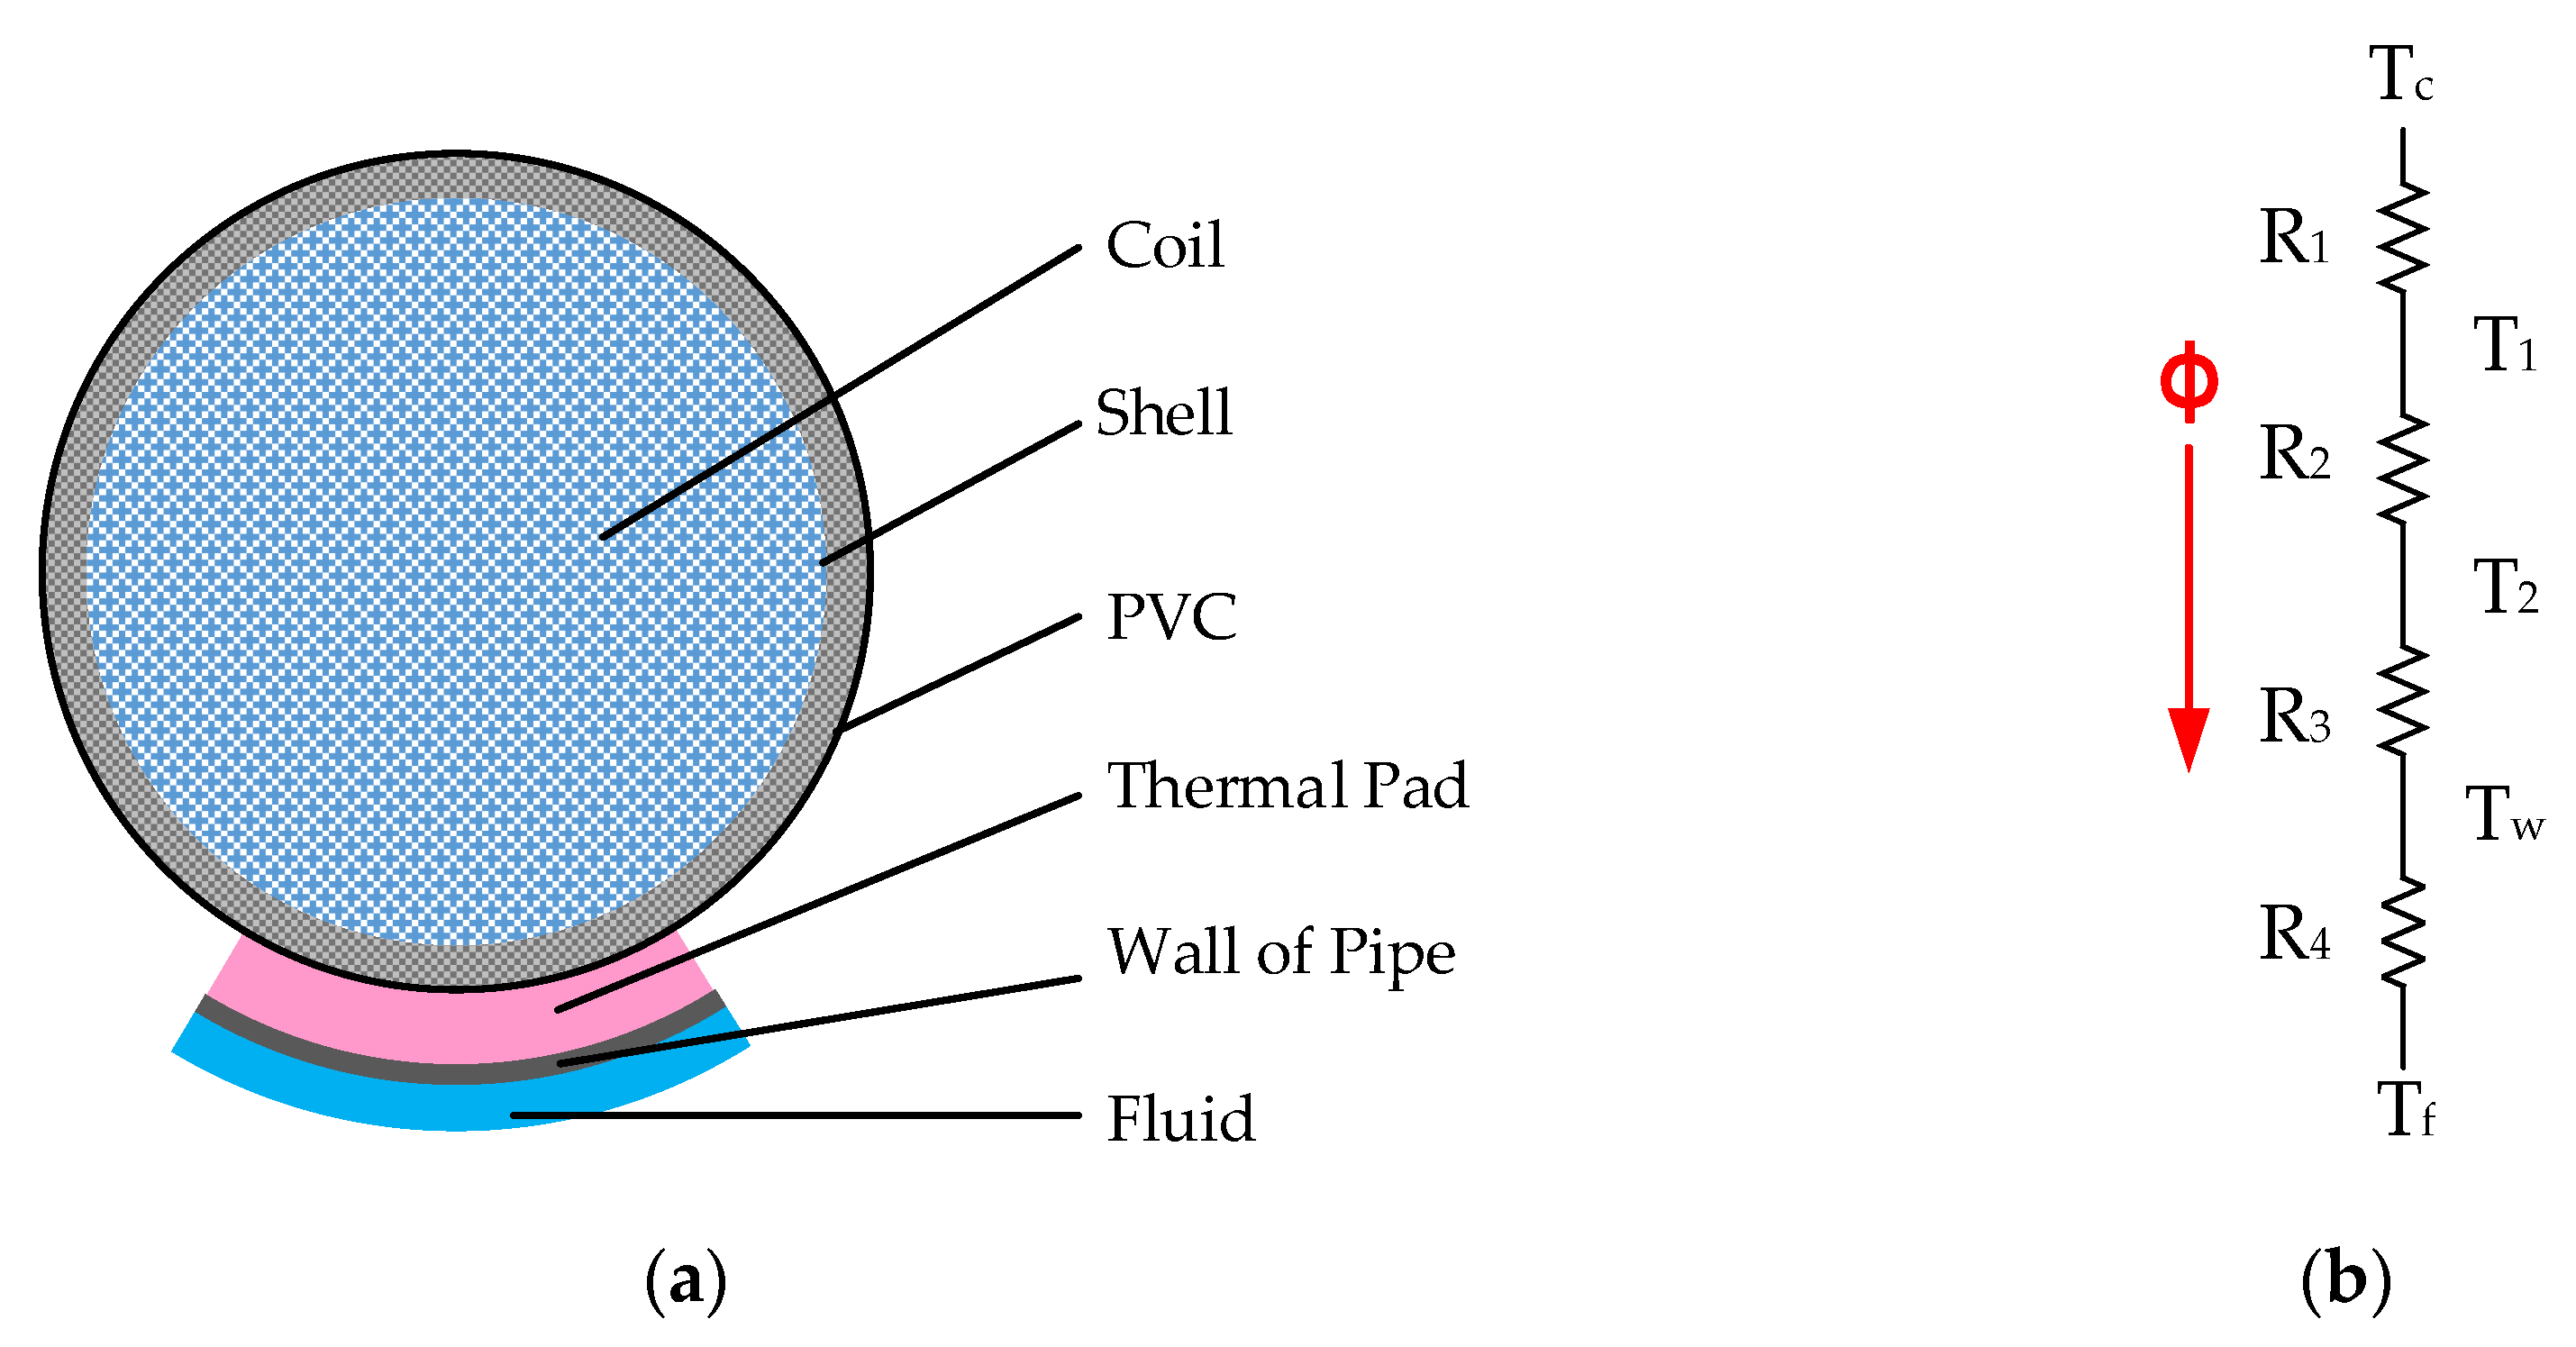
All heat generated in this process is transferred to and taken out by a coolant. The heat transferred from cell to cell and from cell to ambient is neglected. A schematic structure of the single cell cooling model is shown in Figure 4a, including the heat flow transferred from conduction in the cell, conduction in the silicon layer, conduction in the aluminum pipe wall, and convection at the solid–liquid interface. The heat transfer process from the cell–silicon interface to the coolant can easily be simplified to a one-dimensional heat transfer problem and represented as thermal resistance, as in Figure 4b. The heat transfers from the coil to the pipe by conduction. According to Fourier’s law of heat conduction, the heat flow is:
and the conduction heat resistance, R, is defined as:
where k, A, and t are the heat conductivity, heat conduction area, and thickness of the medium, respectively. Thus, for R1, R2, and R3, we find:
From pipe to fluid, the convection heat flow, using the equation from Newton’s law of cooling, is:
Thus, the convection heat resistance at the pipe–fluid interface, R4, is:
For a smooth rectangular pipe, the convective heat transfer coefficient at the inner wall of the pipe can be obtained from the Nusselt number Nu, its hydraulic diameter dH, and the heat conductivity of fluid kf, using Equation (8):
The laminar flow in pipes is calculated according to the Sieder and Tate correlation [39], where Nu is
Lb is the length of the branch pipe, and μ is the dynamic viscosity (subscript f and w represent the fluid temperature and wall temperature, respectively). The Reynolds number Re and Prandtl number (for the temperature of the fluid) Prf are:
For pipes with inner support, assuming the temperature on the supporting walls is uniform and neglecting the heat transfer at the opposite surface, R4 can also be calculated from Equations (7)–(10).
Additionally, inside the cell, ignoring the heat transfer in the axis direction, we find a two-dimensional conducting problem with the heat source. Since the temperature distribution within each cell is not investigated in this article, heat flow can be written as heat resistance:
where Rc is the equivalent heat resistance within the battery cell and is determined by the cell’s materials, components, and dimensions. Tc is the maximum temperature in the cell, Ts is the temperature of the battery’s steel shell, and Φ is the heat flow at the contact surface.
The bending characteristic is neglected in the thermal calculation. The serpentine pipe is considered to be straight. For one cell j on serpentine pipe i, the cell’s maximum temperature Tc,i,j, can be obtained by the following equation:
where the local fluid temperature at the corresponding battery is:
On each serpentine pipe, 24 cells are cooled in series, so:
In addition, the temperature rise of the coolant can be calculated by the following energy equation:
Putting Equations (4)–(16) together, we can determine the maximum temperature of each cell under a certain heat generation, coolant flow rate of the pipe, and inlet temperature. A pre-defined working state, heat generation, total coolant flow rate, and inlet temperature could be calculated to choose a reasonable range, but in order to obtain the temperature consistency of all the batteries, further calculations would be needed.
3.3. Thermal–Hydraulic Performance
In a parallel flow system with n branches, the pressure loss or head loss in each branch is equal according to the Bernoulli equation [40]:
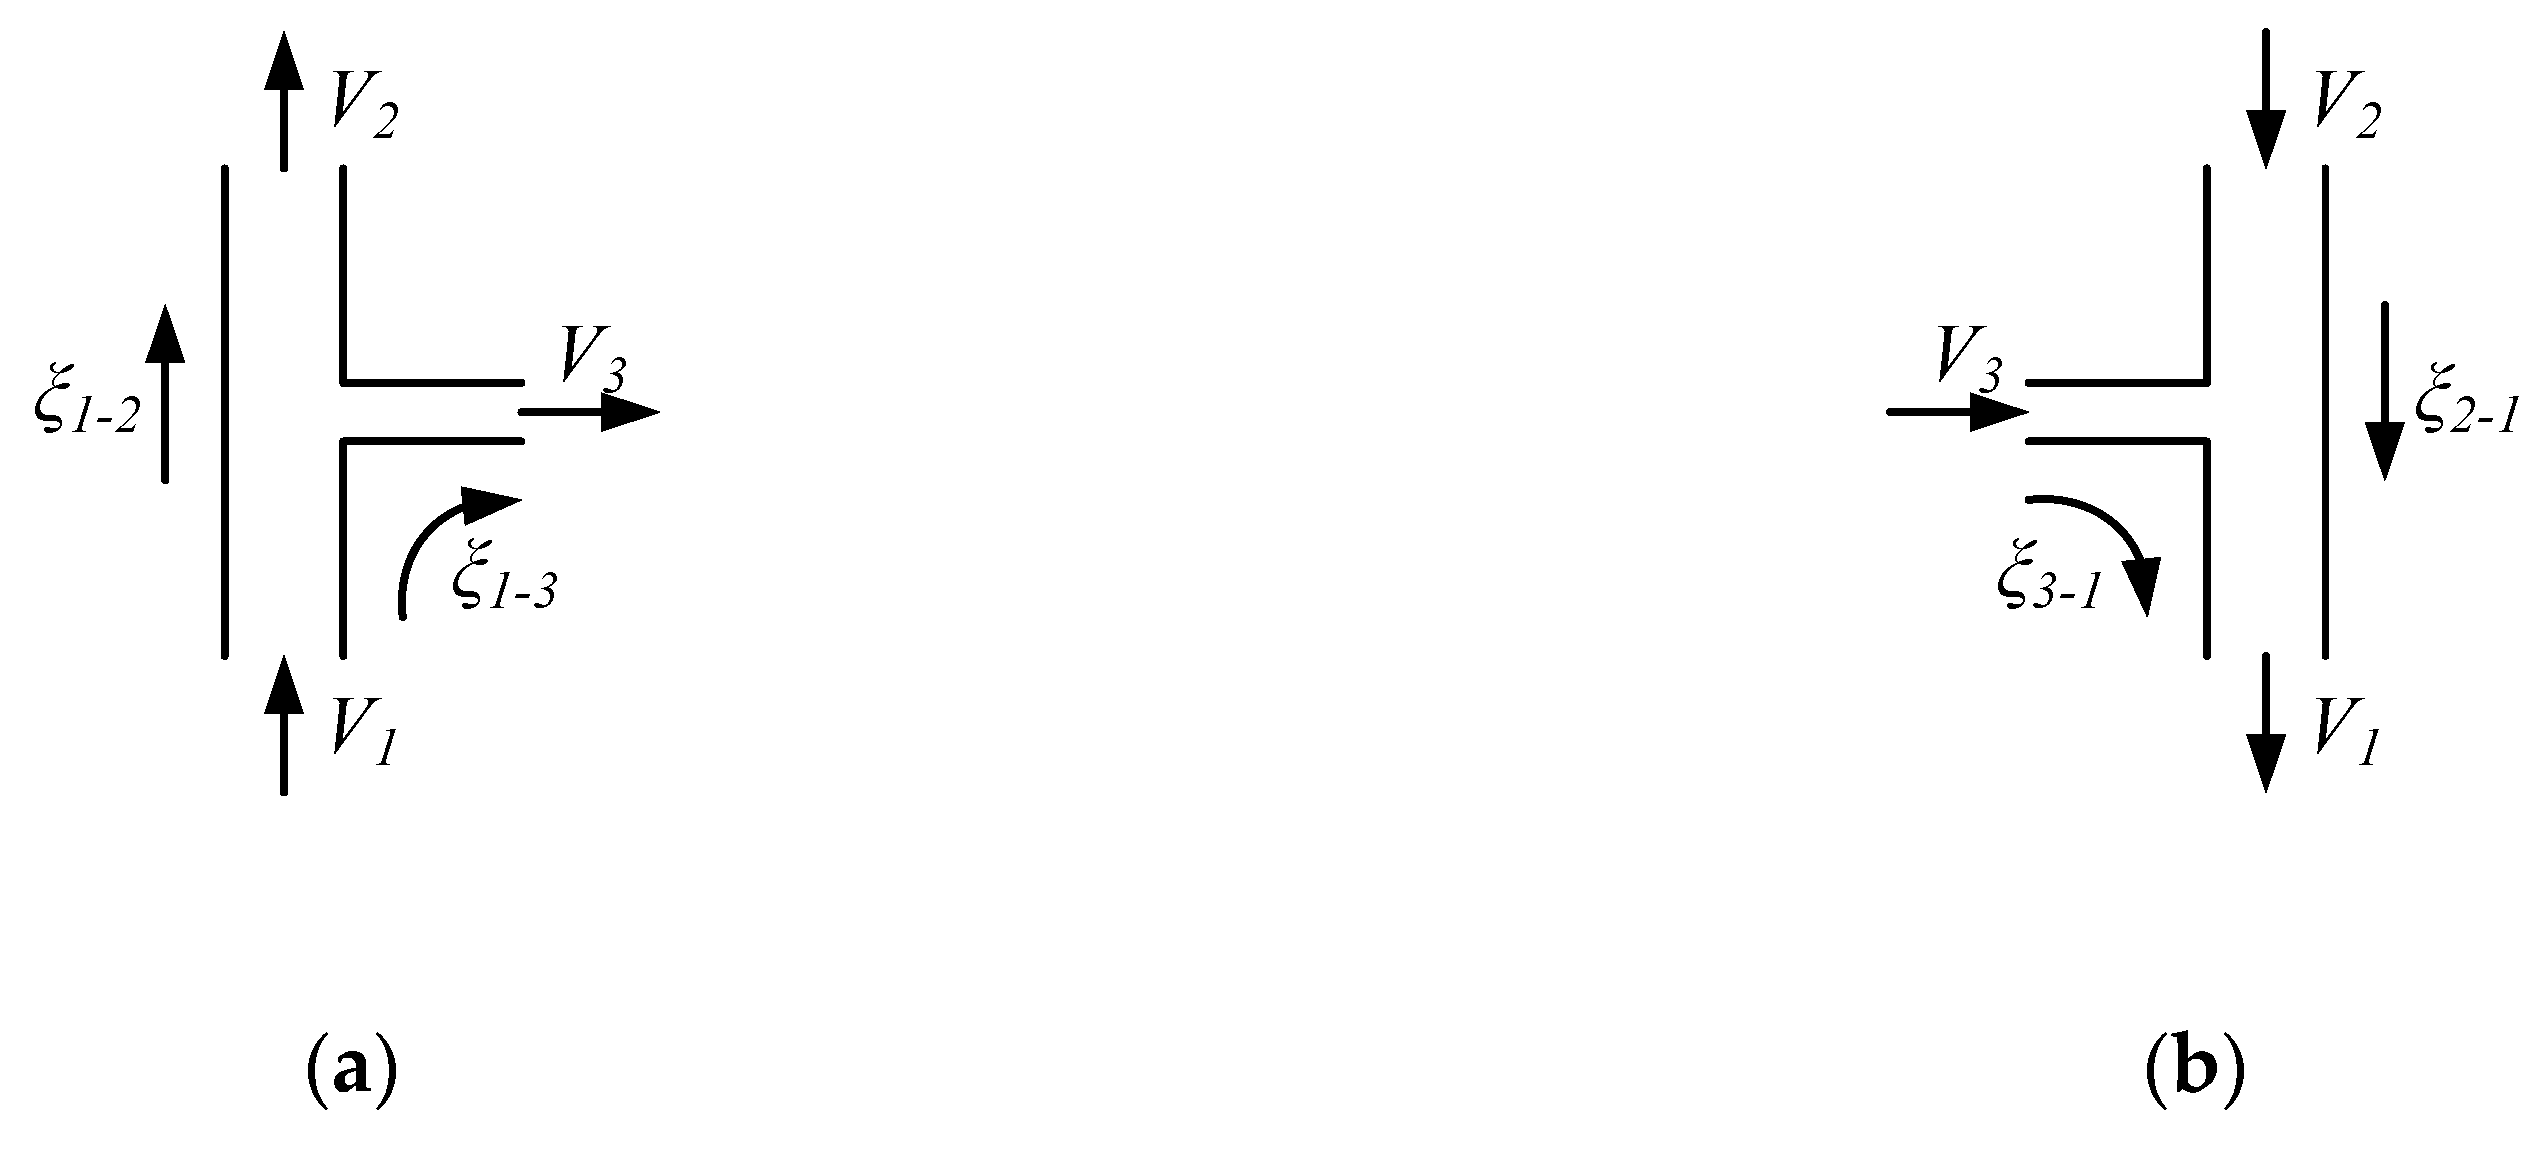
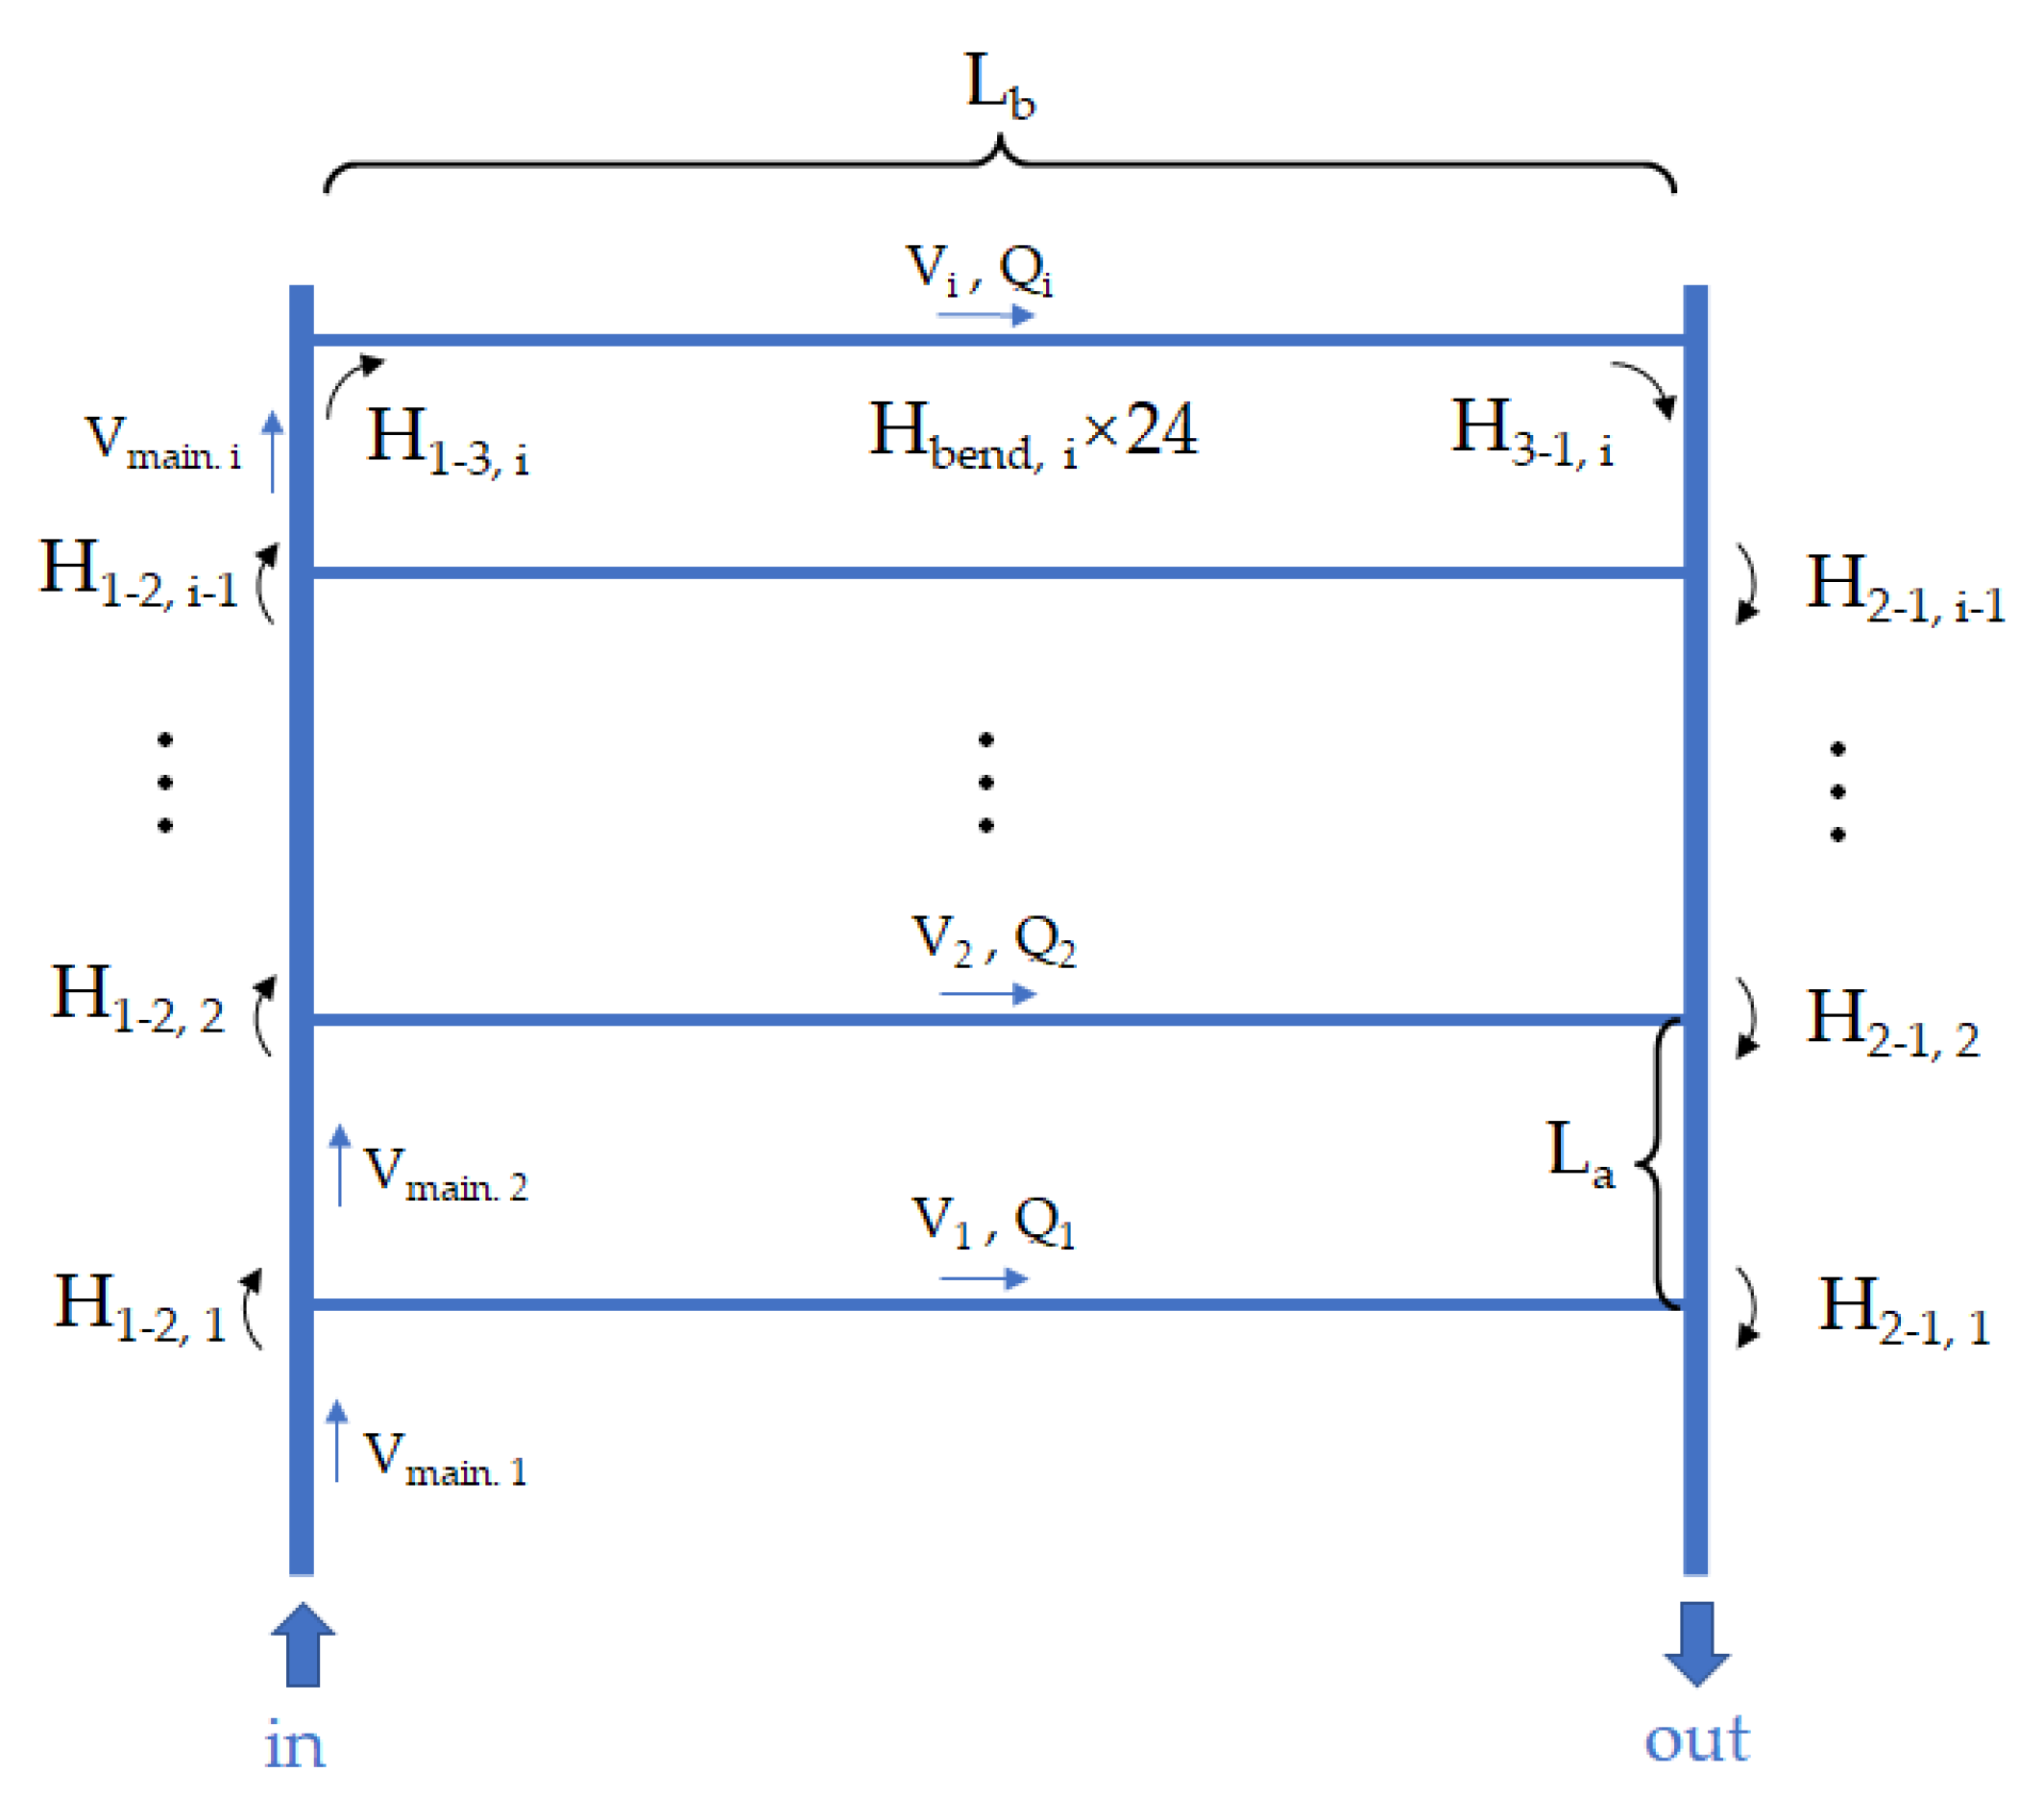
The head loss consists of two parts, the local loss and the friction loss. For the ith branch, the local loss contains the loss at two three-way connectors and at 24 bending positions on the serpentine pipe (in contact with the 24 battery cells, see Figure 3c) along the flow pass. A representation of the local loss factor ξ of the three-way connectors is shown in Figure 5. The loss for the ith branch is represented in Figure 6.
Then, the sum of the local head loss between in and out for branch i is:
where the local three-way loss is: (a–b represent 1–2, 1–3, 3–1, 2–1)
where the local loss factor ξa–b is calculated from the experimental equations in [42,43]:
The local loss at each bending position on the serpentine pipe is:
where the local loss factor ξbend is calculated from the experimental equations in [42,43]. L/2 is the bending radius (half of the cell’s center distance L in Figure 3c).
The sectional average speed V can be represented by the volumetric flow rate Q divided by the cross-sectional area Sa and Sb, so:
where
From Equations (20)–(25), the local head loss through the ith branch is:
The friction loss Hfri,i comprises the loss along each segment in the main pipe and branch pipe for the cooling plate in Group Set A:
For the cooling plate in Group Set B, there are two segments of additional main silicone tube inlets and outlets with a length of LC, so:
Since the coolant flow in our system is within the laminar range, the friction loss factor λ is:
From Equations (27)–(29), the friction head loss for the cooling plate in Group Set A is:
The friction head loss for the cooling plate in Group Set B is:
Thus, a mathematical relationship between Hi and Q1~Qn has been established, and the flow of different channels (the bias flow rate β) can be obtained by iterative calculations according to Equation (17). According to the heat transfer formula introduced in Section 3.2, the maximum temperature and temperature difference corresponding to different flows can also be calculated.
In this section, based on the cooling structure proposed in Section 2, heat transfer calculations and thermal hydraulic calculations are performed using theoretical Formulas (1)–(31). The design parameters of the cooling plate and the reasonable values of the boundary conditions are thus obtained, thereby providing theoretical guidance for the simulation and reducing the number of combinations required for the simulation. In order to ensure that the battery temperature does not exceed 45 °C, and the temperature consistency does not exceed 5 °C, the parameter range was estimated through theoretical calculations, as follows:
- Five diameters of the main pipe were used: D = 12 mm (δ = 0.484), D = 14.5 mm (δ = 0.707), D = 17 mm (δ = 0.973), D = 19.5 mm (δ = 1.278), and D = 22 mm (δ = 0.1627).
- The boundary conditions for the simulation were as follows: The maximum current must not exceed 35 A, the maximum inlet temperature of the coolant must not exceed 30 °C, and the coolant flow must be greater than 5 L/min.
Subsequently, three sets of currents (25 A, 30 A, 35 A), two sets of inlet coolant temperatures (25 °C, 30 °C), and two sets of coolant flow (5 L/min, 10 L/min) were orthogonally combined for simulation and verification.
4. Numerical Simulation
4.1. Geometry Model and Parameter Settings
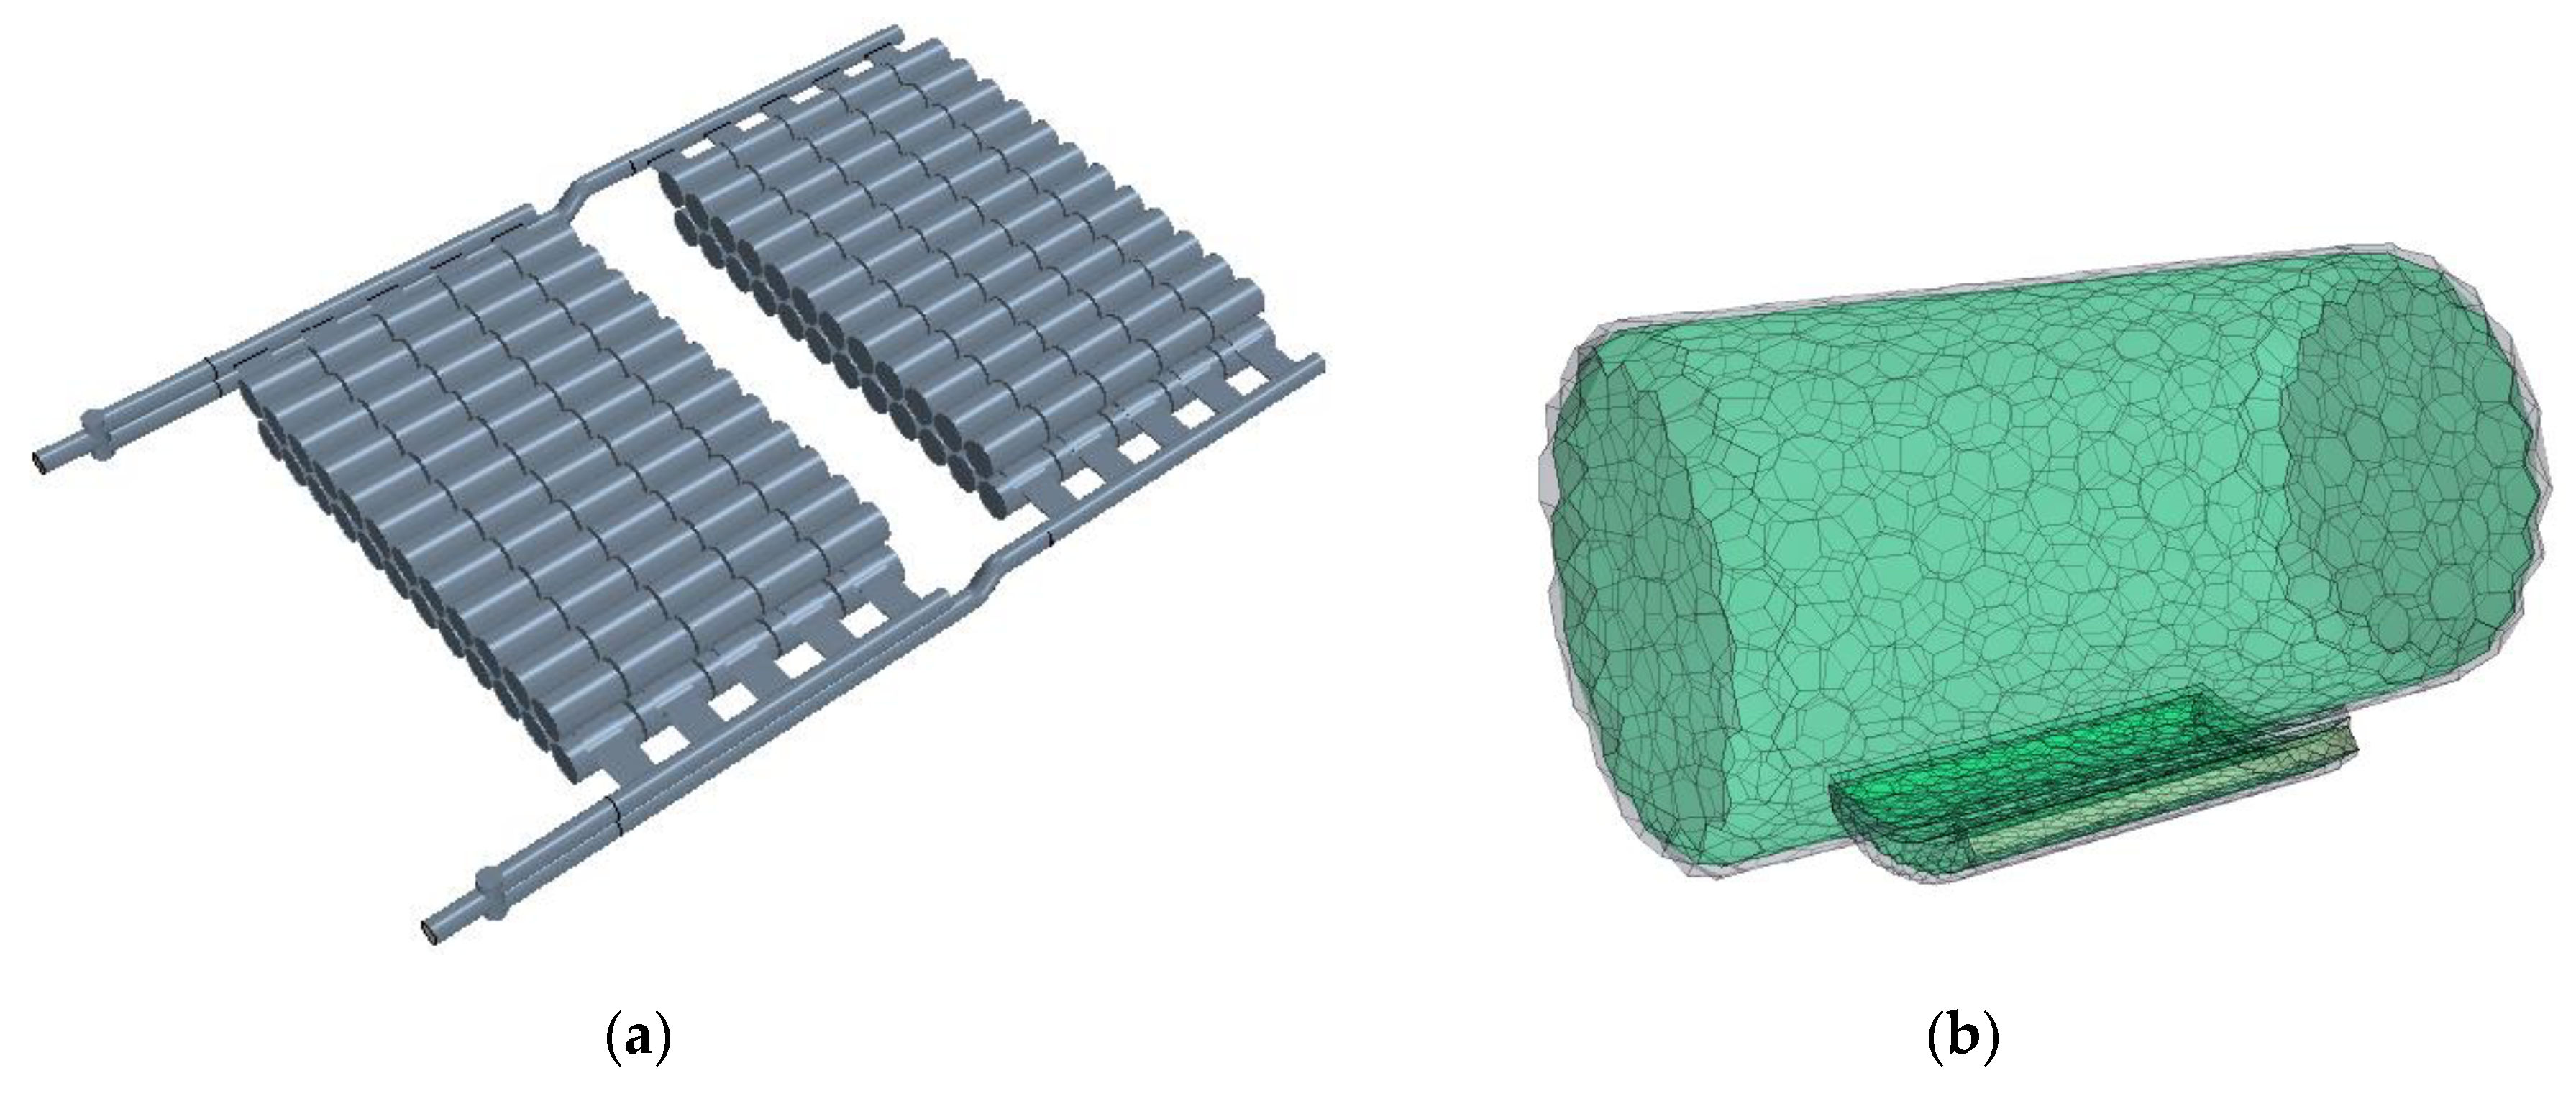
The battery model is divided into three parts: the PVC film, the steel shell, and the battery core. For thermal conductivity, the PVC film and steel shell are isotropic materials, and the battery core is an anisotropic material. The following four types of contact surfaces have coupled heat transfer relationships: the coolant liquid and aluminum alloy liquid cold plate, the aluminum alloy liquid cooling plate and thermal silica gel pad, the thermal silica gel pad and battery surface, and the battery core and aluminum alloy liquid cold plate. The relationship between the rest of the parts and the air in the box is a natural convective heat transfer relationship, which refers to a relationship between the shell and the external environment. The physical properties of the materials of each part of the model are shown in Table 3. The mesh system was generated in the commercial CFD software StarCCM+. A three-dimension finite element model of the packs’ cooling system and batteries was then set up and is shown in Figure 7a.
The boundary conditions in this study are as follows:
- A steady flow with a certain temperature at the inlet;
- Free flow at the outlet with zero pressure;
- A conjugated boundary at the solid–fluid interface;
- Uniform heat generation in the cells;
- Adiabatic at all other outer surfaces of the cells and pipes.
4.2. Grid Independence
A single-battery heat transfer model, Figure 7b, is applied to assess the grid independence of the computational domain. The meshes mainly consist of polyhedral meshes. Locale mesh refinement with prism layer meshes on the solid–liquid interface is applied within the narrow fluid domain to better compute the boundary layer flow and enhance accuracy. A grid independence study was conducted at the condition of Qtotal = 5 L/min, I = 25 A, N = 0. The seven different levels of grid systems, with grid numbers ranging from 3000 to 260,000, are presented in Table 4. Figure 8 shows a grid sectional view at the mid-symmetry plane of grid level 1, 4, and 7. The Nusselt number Nu, pressure loss Δp, and maximum temperature Tmax on the battery surface were selected to be the parameters of validation. The results obtained by these systems are shown in Figure 9a. It can be seen that when the grid number exceeds 50,000 (i.e., when the grid number increases significantly), all three parameters change slightly. Thus, to balance the accuracy and computational cost, a level 4 grid system was selected for the numerical models.
To verify the numerical model, a single-pipe model is established under constant wall temperature boundary conditions to compare the results from the numerical simulation and theoretical calculations, according to Equations (10) and (18) in Section 3. The results are shown in Figure 9b, where the theoretical results are represented as Nu0, Δp0, and the numerical results are represented as Nu, Δp. The results show good agreement, and the relative errors are within 10%. Further, the Nusselt number results for the numerical simulation are larger than those for the theoretical simulation based on Sieder–Tate correlation. The main reason that the pipe appears to be a straight pipe in Equation (10) but has a serpentine-like shape in practice is to enhance the heat exchange. The heat transfer coefficient or Nusselt number of a curved pipe’s surface is larger than that of a straight pipe under the same inlet conditions. Thus, the results are reasonable.
4.3. Study of Internal Parameters
The whole pack model is then set up and solved with different δ and N values, separately, at certain boundary conditions.
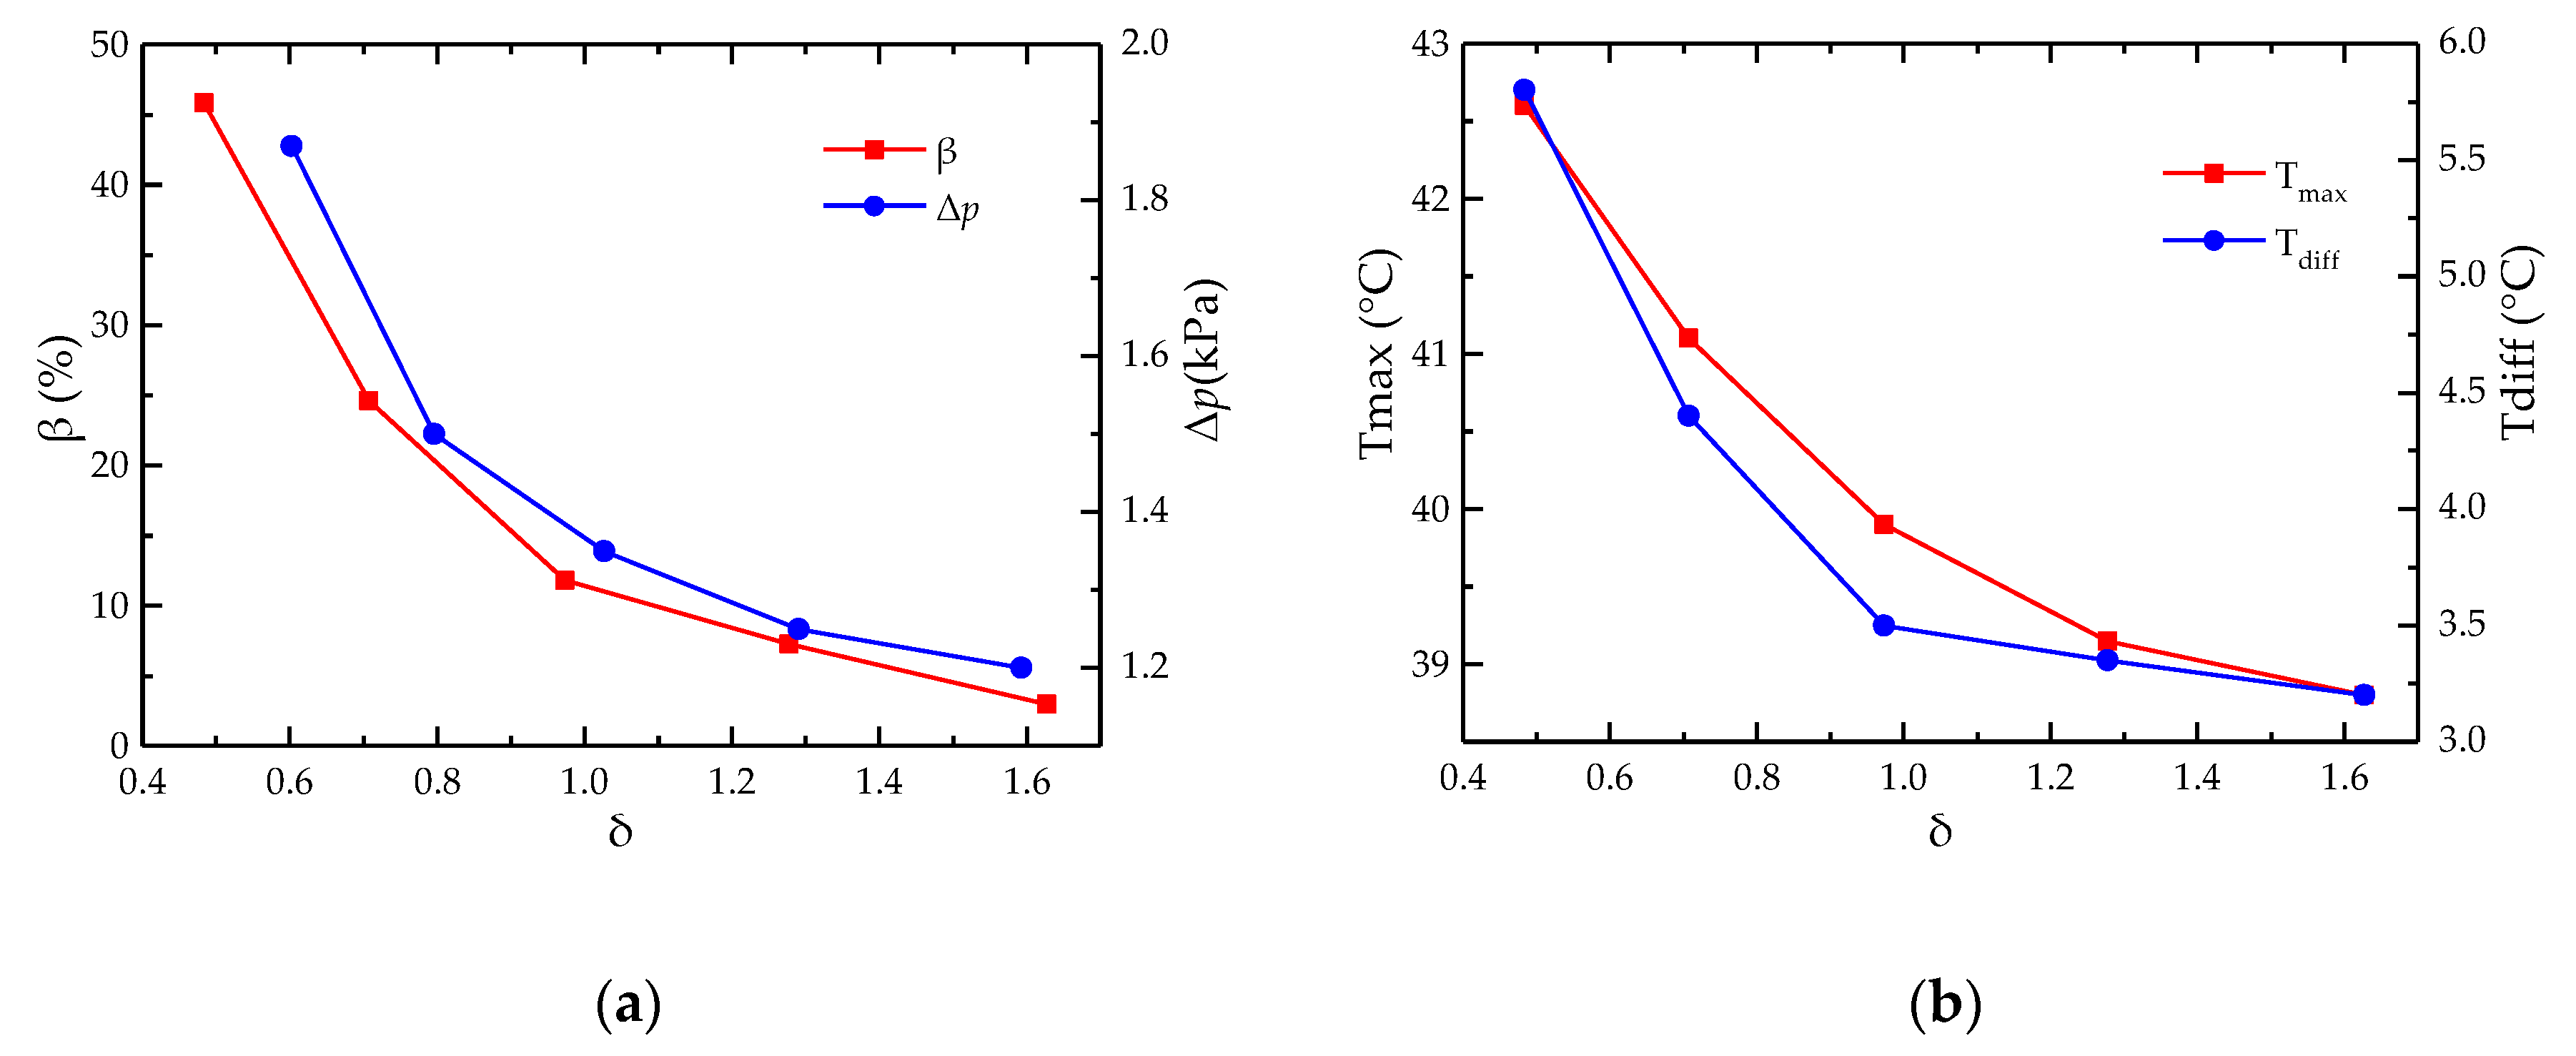
Figure 10 presents the influence of the cross-sectional area ratio δ on bias rate β, pressure loss Δp, and cell temperature Tmax and Tdiff at a flow rate of Q = 5 L/min when N = 0. When the cross-sectional area ratio δ increase, the bias rate β, the pressure loss Δp, the maximum temperature Tmax, and the temperature difference Tdiff all decrease. The bias rate β and pressure loss Δp tend to become smaller as δ increases, and when δ is large enough, the trend gradually becomes slower. Similarly, the maximum temperature Tmax and the temperature difference Tdiff also become smaller as δ increases; when δ = 0.484, Tmax exceeds 40 °C, and Tdiff exceeds 5 °C. Considering the influence of δ on the cooling performance and actual size of the main cooling pipe, the final selection of δ is 0.973.
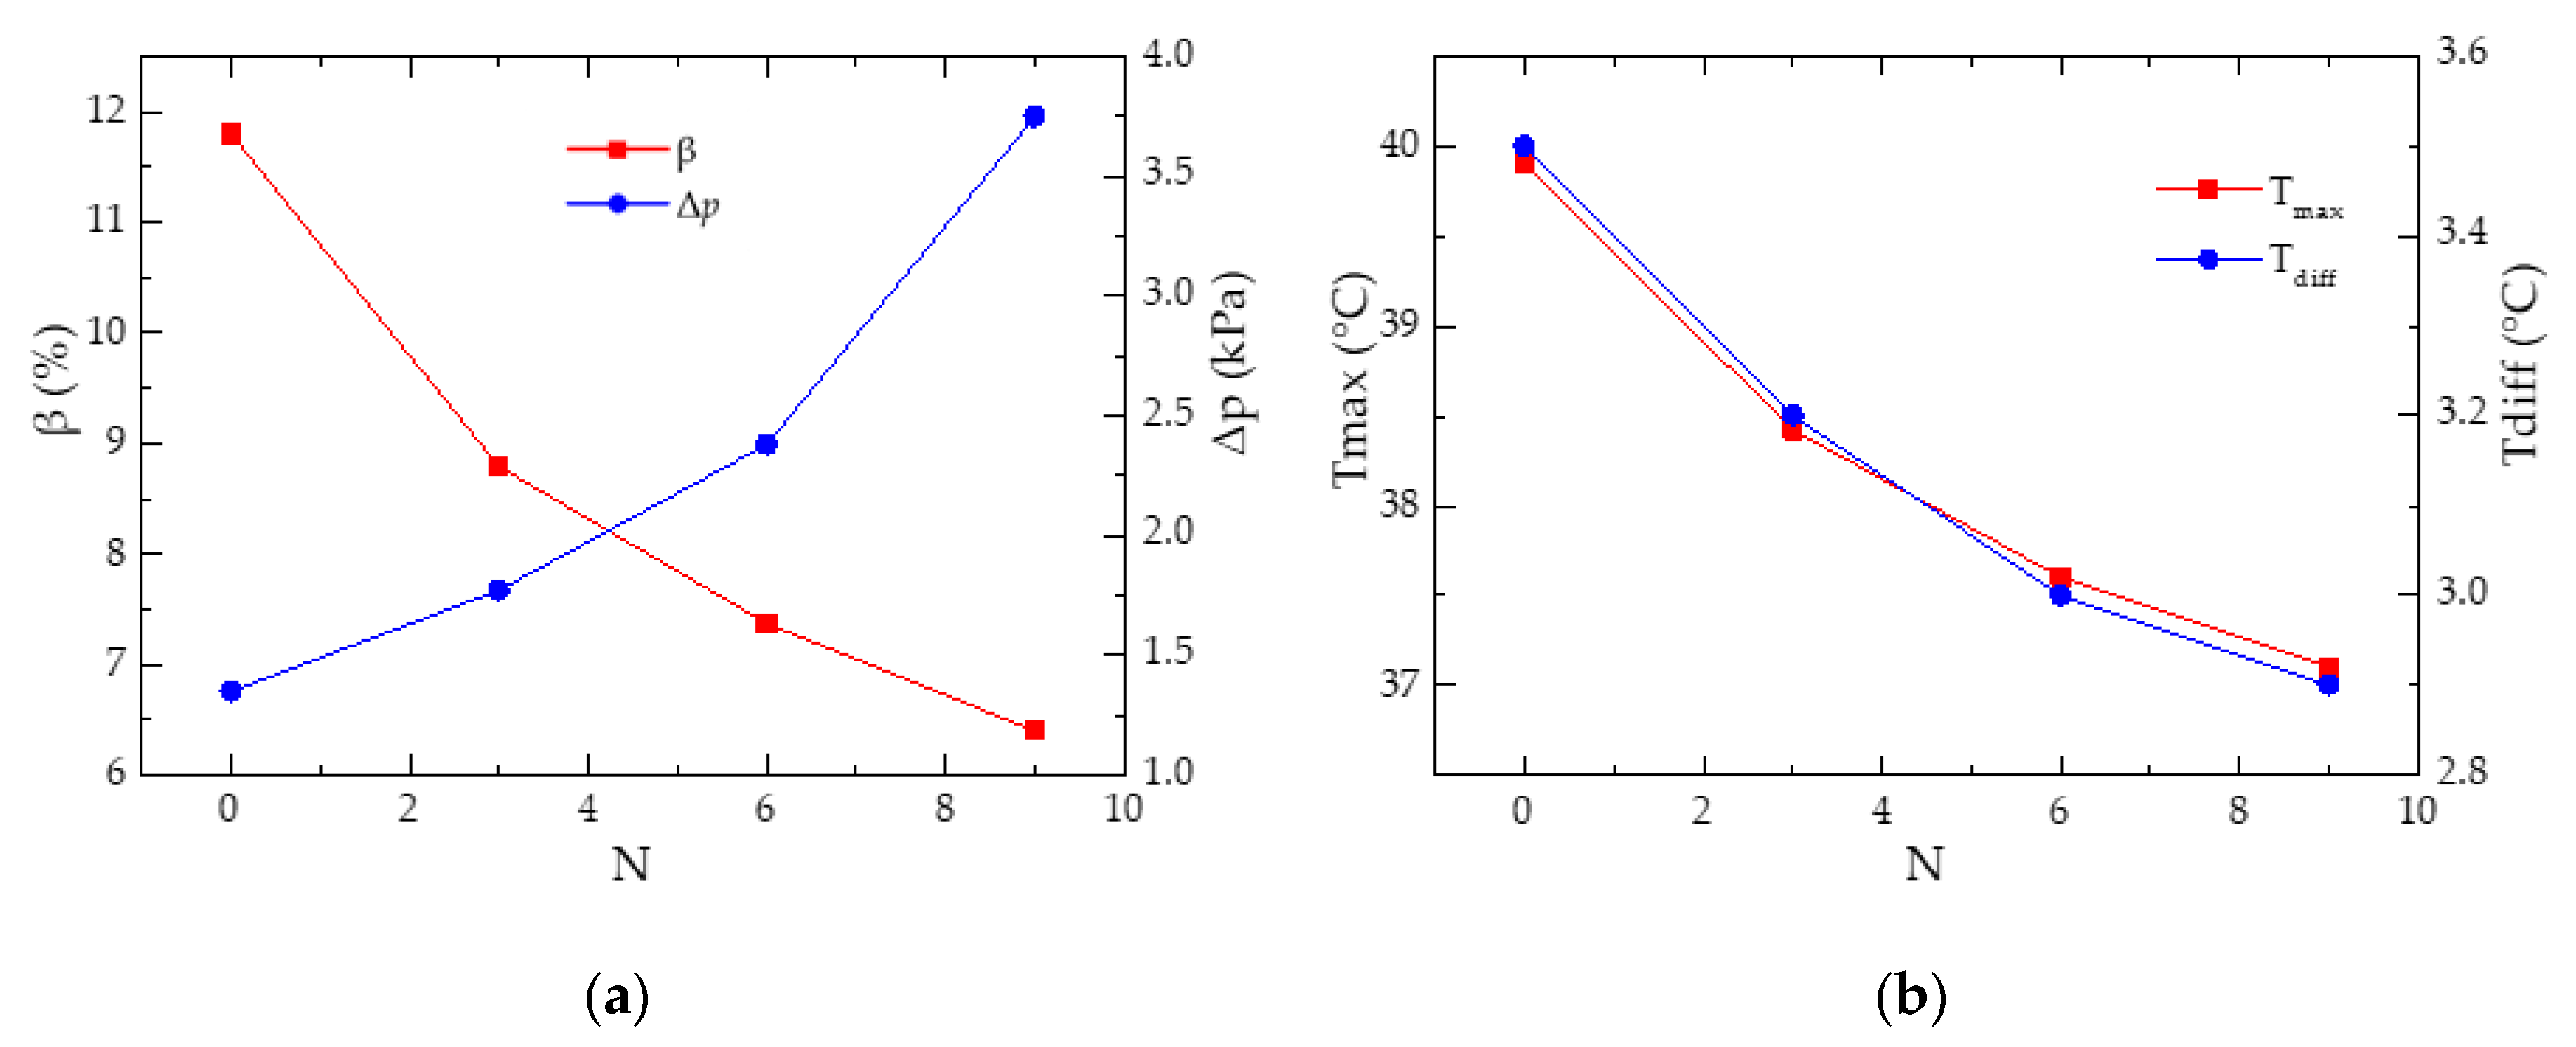
Next, the heat transfer enhancement and pressure drop increase with a different number of internal walls, N, is studied (Figure 11). In general, the effect of different walls N on the pressure drop Δp is larger than ratio δ, but the effects on β, Tmax, and Tdiff are smaller than ratio δ. When the wall number N increase, the bias rate β, the maximum temperature Tmax, and the temperature difference Tdiff all decrease, but the pressure loss Δp increases dramatically. When N = 9, the maximum pressure loss reaches 3.75 kPa, thereby exceeding the maximum acceptable pressure loss limit. Thus, we fixed N at medium number 6 to balance the maximum heat transfer and pressure loss.
4.4. Study of Boundary Conditions
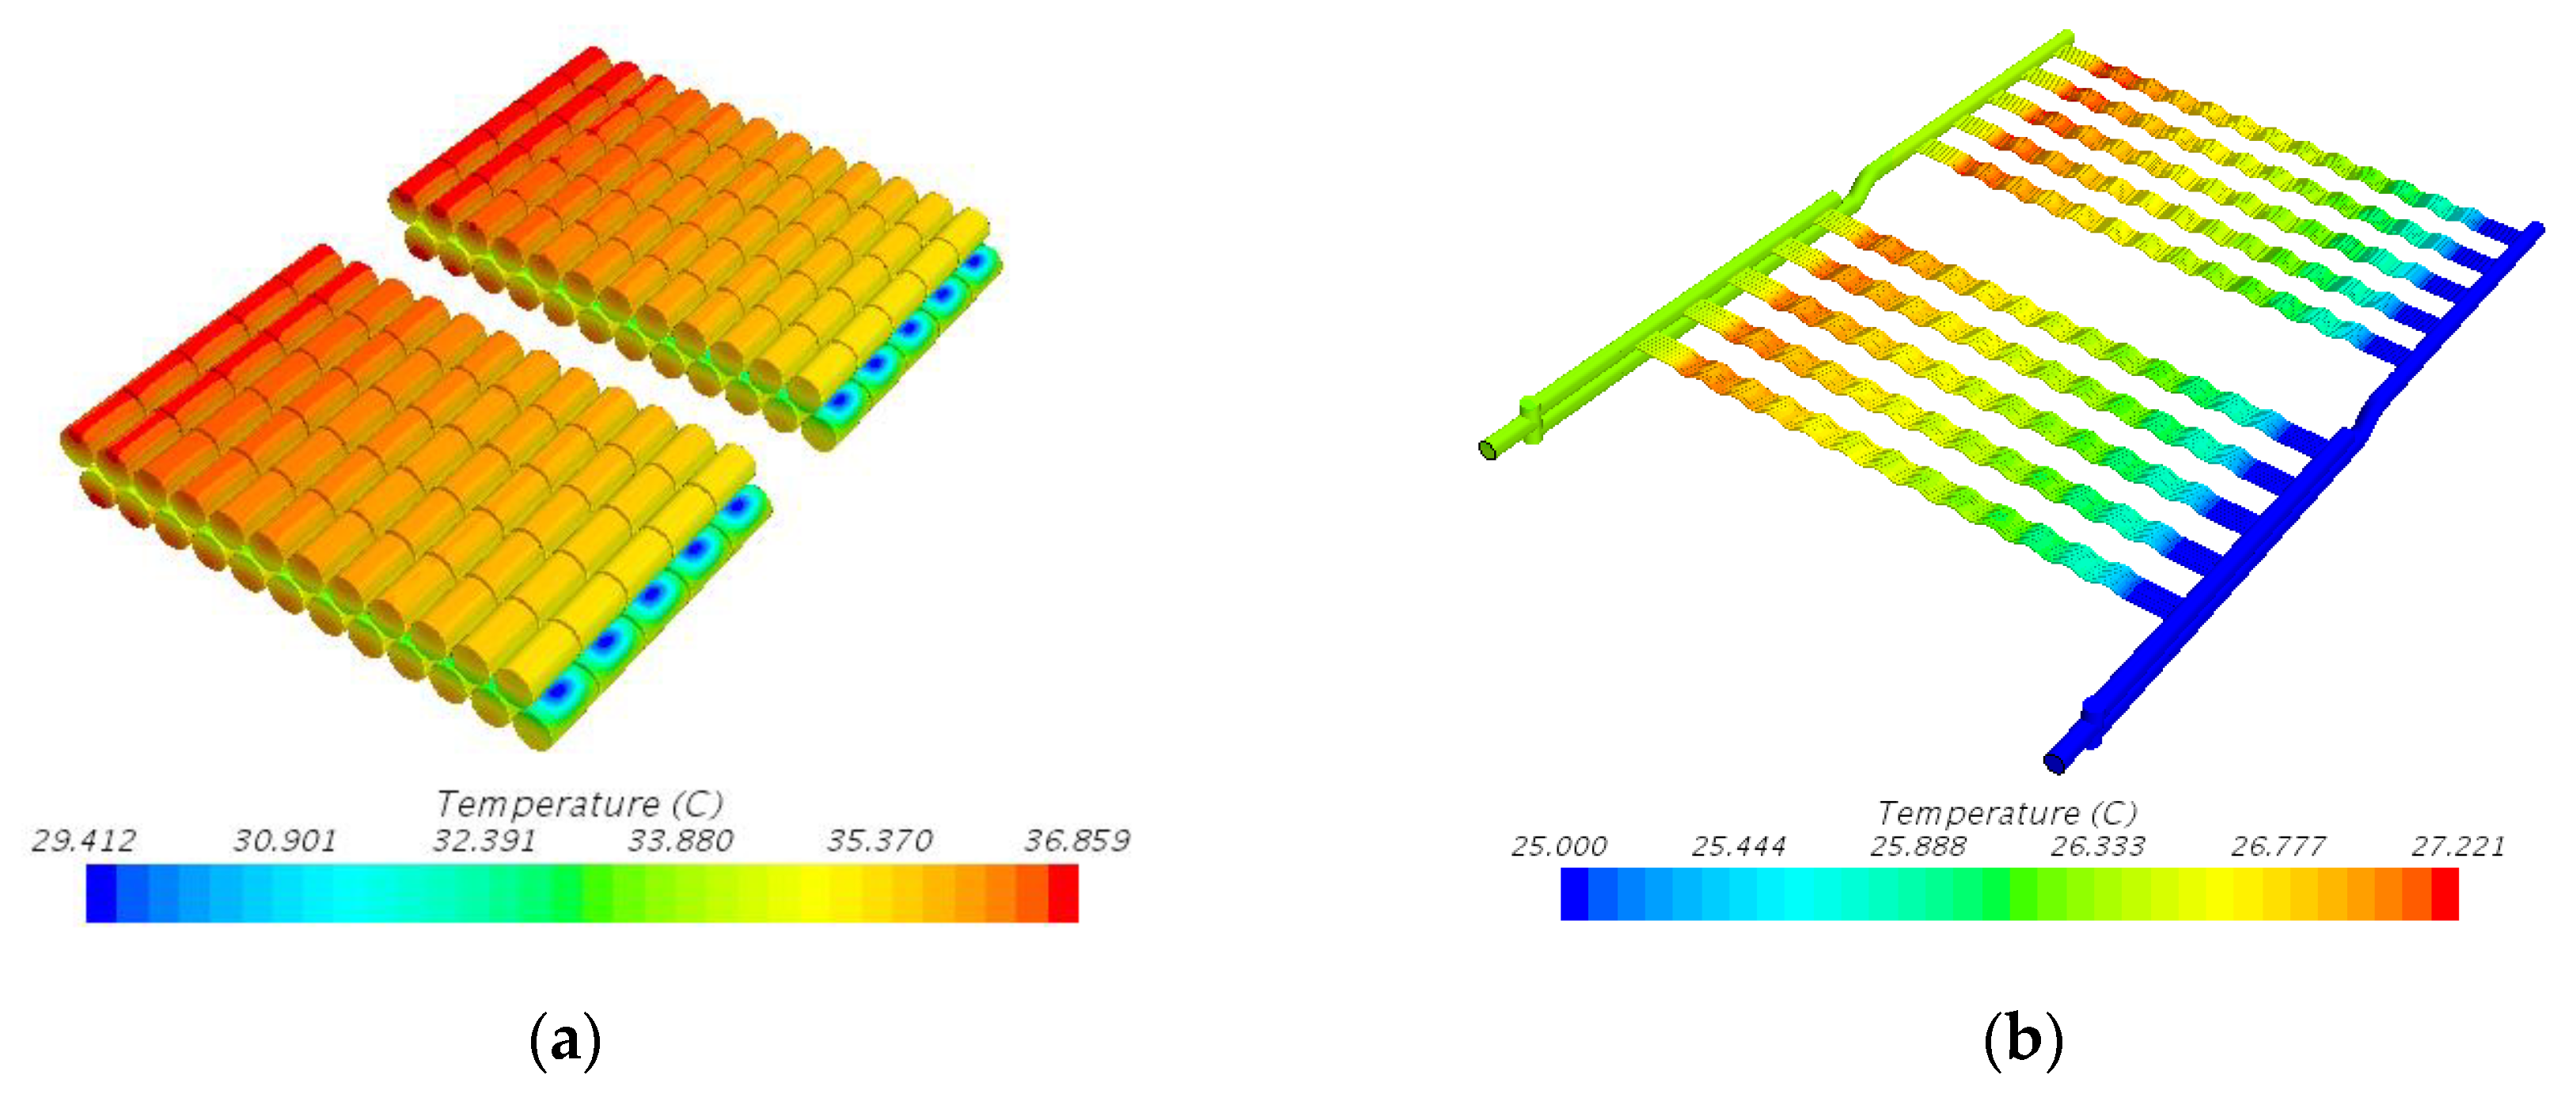
The temperature field of the batteries and coolant under a working condition of an effective current at 25 A and δ = 0.973, Q = 5 L/min, N = 6 is shown in Figure 12. It can be seen that the maximum temperature difference Tdiff on the same monitoring surface between the battery cells is below 3 °C, and the maximum temperature Tmax of the battery is 36.86 °C. The maximum and minimum cell temperatures (at the surface opposite the cooling area) exist at the two corners of the pack. Because the flow consistency in each branching serpentine pipe was optimized in the previous section, the temperature difference Ti between cells corresponding to the different branching serpentine pipes is well controlled. The temperature difference Tj between the cells increases as the temperature of the coolant in the cooling channel gradually increases, but the total temperature difference Tdiff correctly meets the design expectations.
Using the same methods and parameters, simulations were also performed at other boundary conditions, including different flow rates, different root mean square (RMS) currents, and different coolant temperatures. A matrix list of these simulations is shown in Table 5. The simulation results will be compared and discussed together with the test results in the next section of the experiment.
5. Experiment
5.1. Test Sample and Experiment Preparation
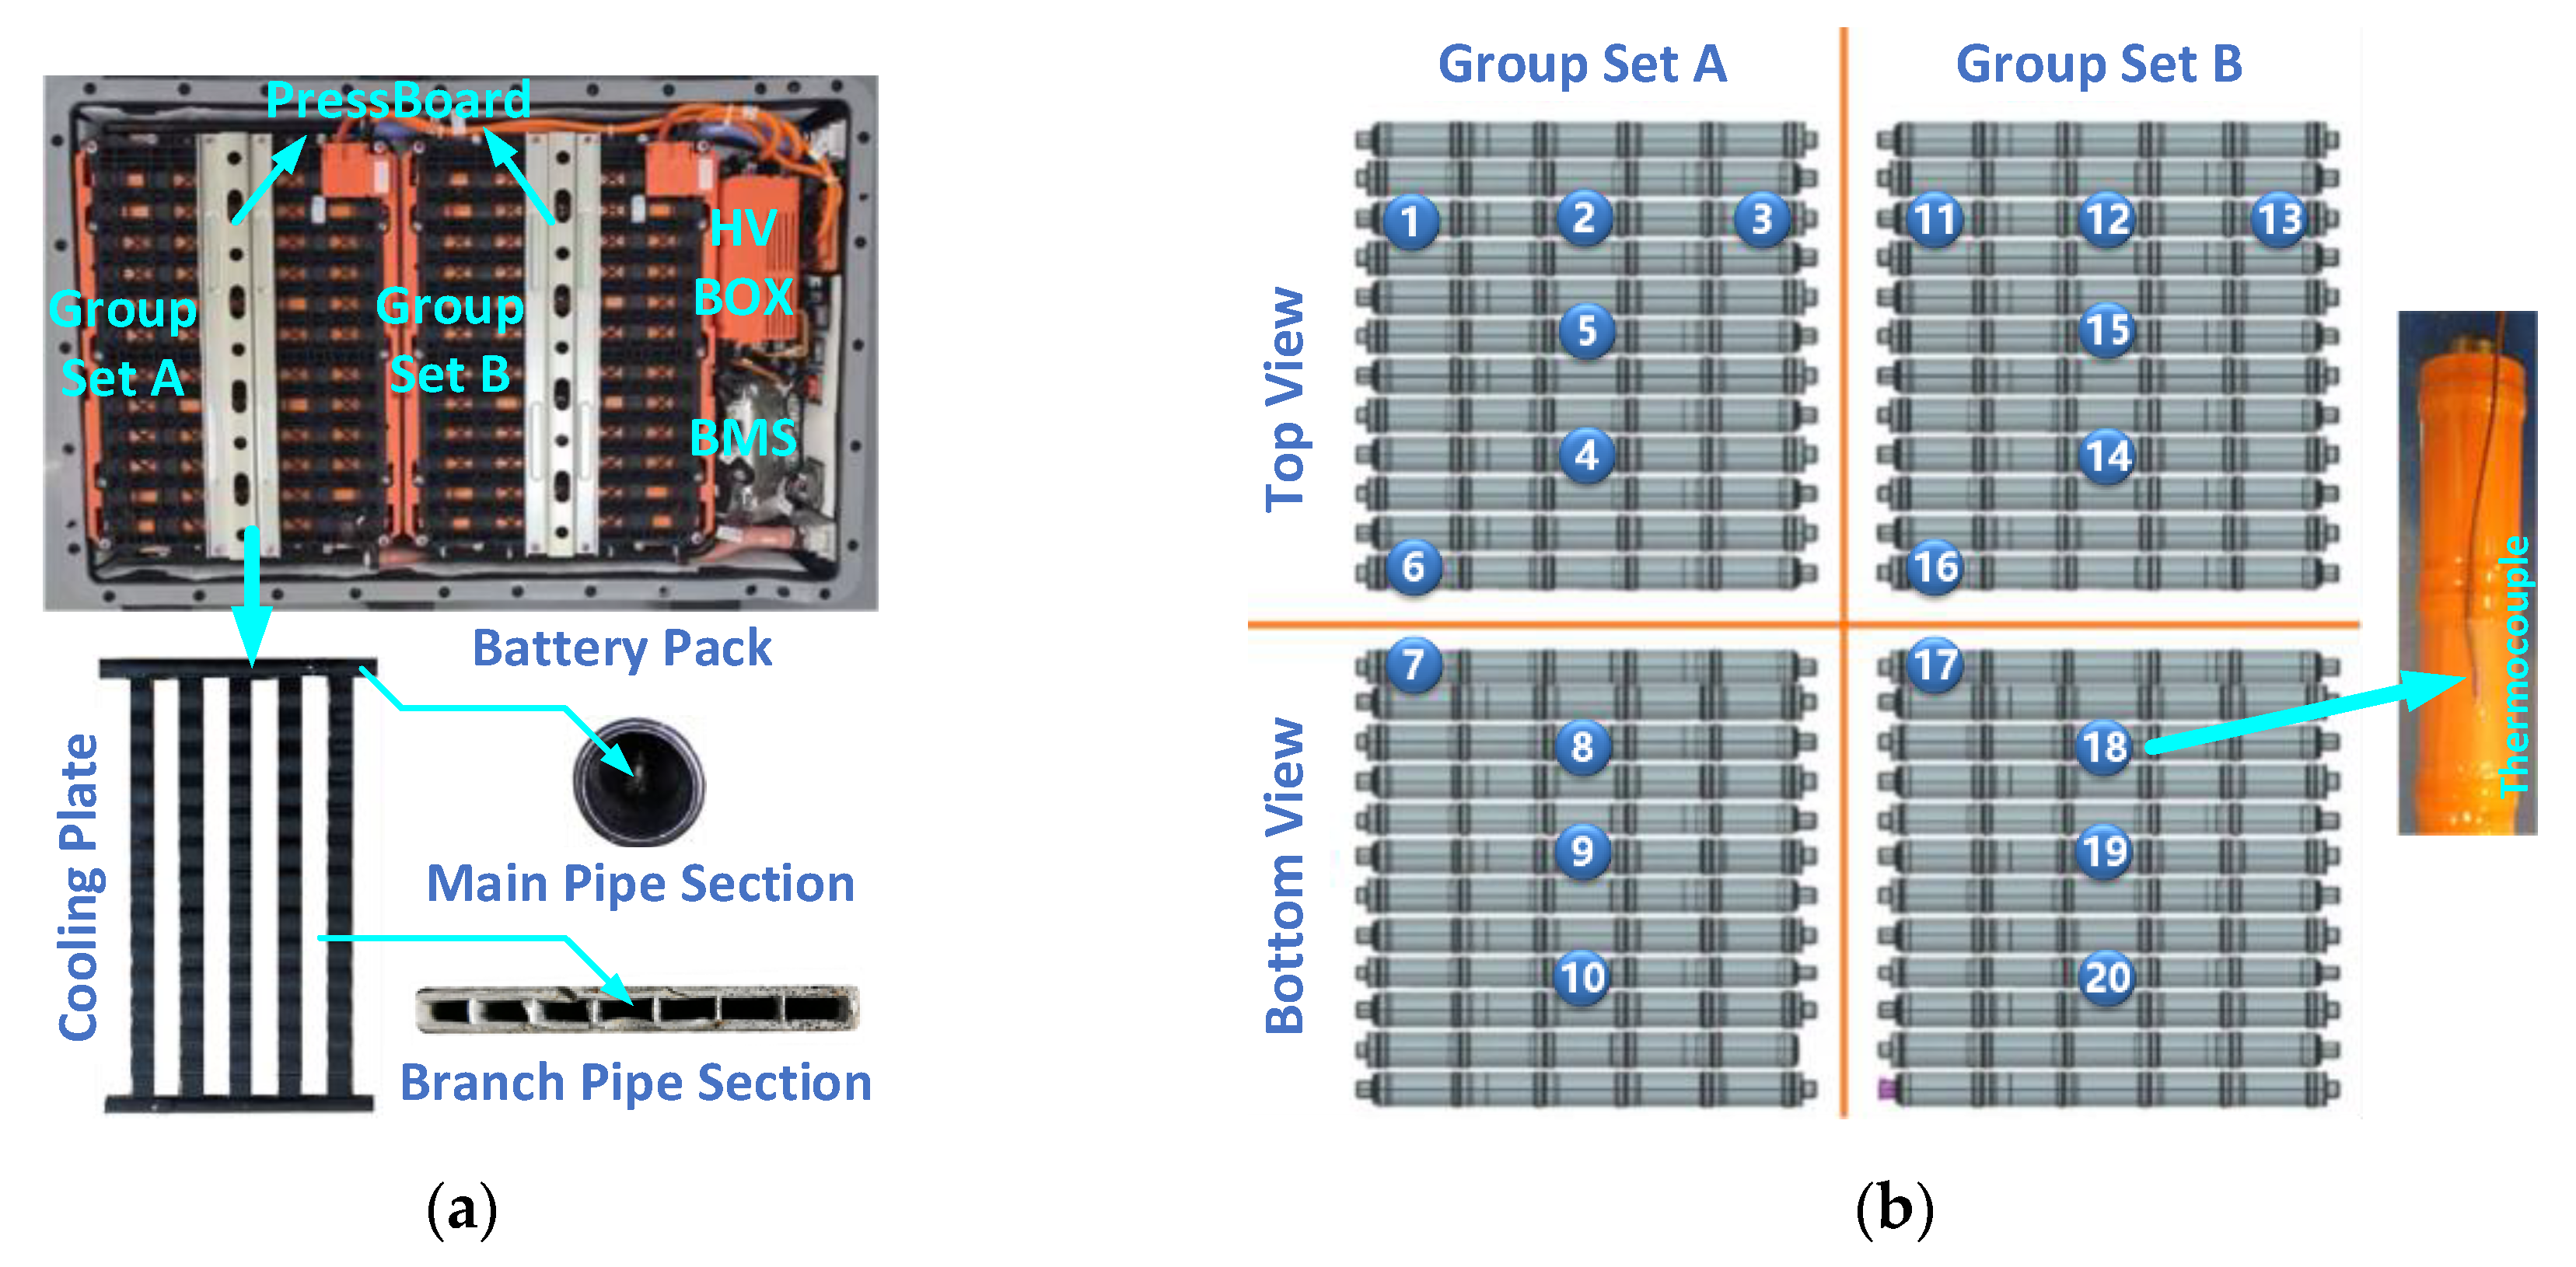
According to the research results of Section 3 and 4 of this paper, a cooling plate sample was made by selecting δ = 0.973, N = 6. The branch pipe width was 30 mm, the height was 2.75 mm, and the wall thickness was 0.45 mm. The main pipe diameter was 17 mm, and the wall thickness was 1.5 mm. Two cooling plates were connected in parallel and housed in two horizontally placed modules. The plastic mounting brackets with V0 class flame retardant capability and sufficient yield strength are used to fix the battery cells and cooling plate together within reasonable spacing, so as to ensure the mechanical performance and avoid thermal runaway of the battery pack [44]. Besides these two modules, the battery pack also included a high voltage box (HV BOX) and a battery management system (BMS). The HV BOX was used for high power output management, and the BMS was used to monitor the battery’s status in real time (as shown in Figure 13a).
To obtain the temperature field distribution of the battery pack under actual working conditions, the temperature monitoring distribution map was determined based on the simulation results of the battery pack temperature field, and the arrangement of the temperature points was minimized to reduce its influence on the heat transfer process (Figure 13b). Twenty T-type thermocouples (accuracy: ±0.5 °C) were distributed on the surface of the battery pack (separately on the upper and lower batteries of the two A/B battery modules).
5.2. Experiment Environment Setup
In order to verify the temperature performance under variable boundary conditions, an experimental platform was setup, as shown in Figure 14. The temperature data were displayed and recorded by a Hioki (LR8401) data recorder. The battery pack was operated in an environmental chamber. A Digatron (BTS-600) battery tester was used to provide charge/discharge power to the battery. Coolant (50% ethylene glycol solution) was supplied to cooling plate of battery pack by a Sentrick GE522A multifunction cooling tank at a constant temperature and flow rate.
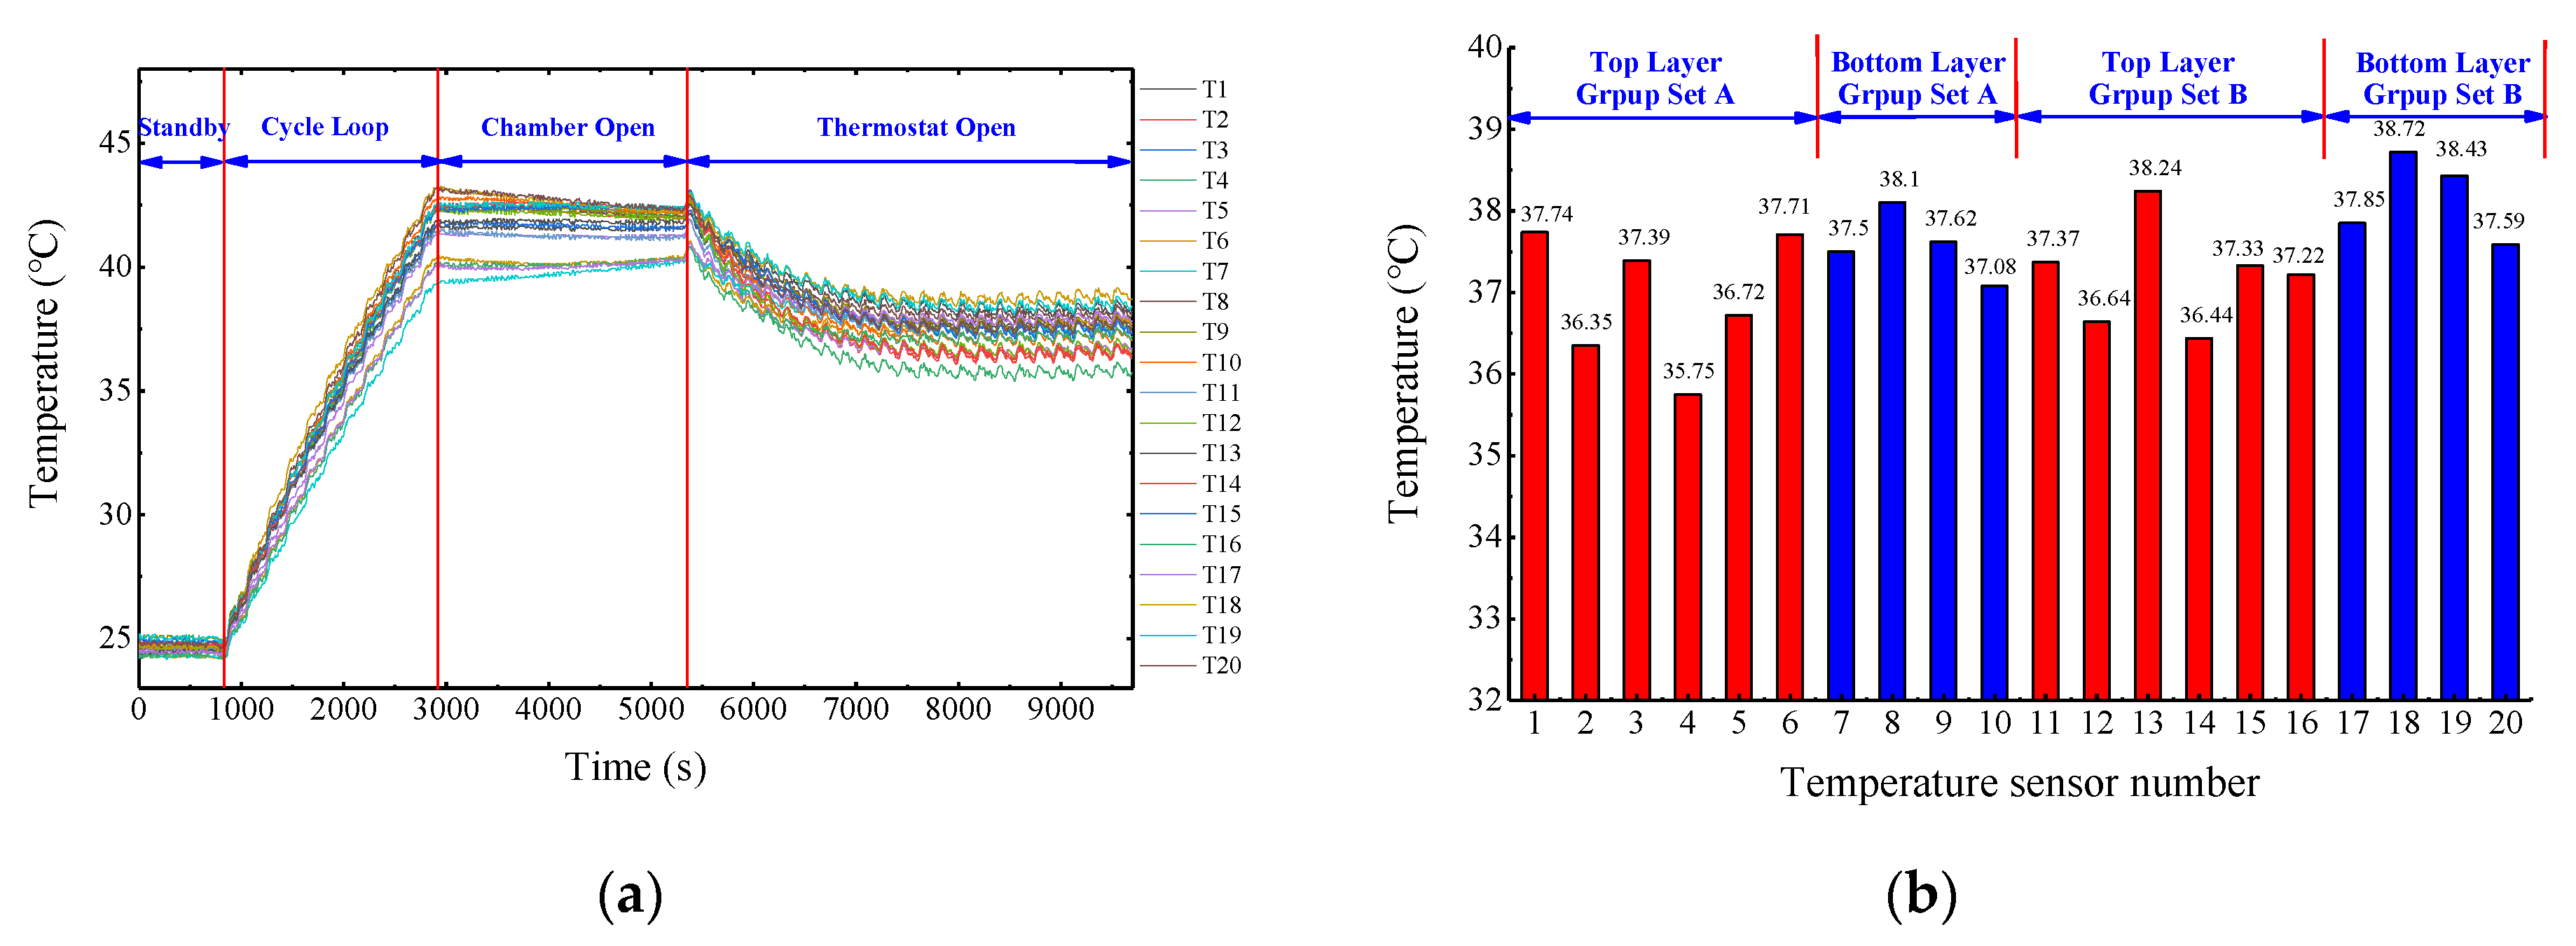
The experimental condition settings were the same as those of the matrix list for the simulation present in Table 5. A total of ten experiments were conducted. The whole battery pack was first put into an environmental chamber set at a temperature of 40 °C. Here, we will introduce in detail the experimental steps used during the first set of experiments. First, the battery was quickly self-heated to 40 °C by charging and discharging with a cycling working schedule, which has a current root mean square value of 25 A. The charging/discharging process was then stopped, and we waited for the difference in temperature to reduce to below 3 °C. Then, the working schedule was applied again, and the cooling tank was opened to provide the necessary coolant flow. After the system reached a thermally equivalent state, the temperature data were recorded, and the experiment was stopped. The whole process for the first set of experiments is shown in Figure 15a.
5.3. Bench Test Results
By providing a certain flow rate and a certain temperature to the coolant, we were able to decrease and stabilize the temperature of the battery. The temperature values of the 20 thermocouples after stabilization are shown in Figure 15b. The highest temperature was the thermocouple No. 18 (38.72 °C) and the cell located in the middle of the lower layer of Group Set B. The lowest temperature was found for the No. 4 thermocouple (35.75 °C) and the cell located in the middle of the upper layer of Group Set A. The maximum temperature difference was 2.97 °C.
Both the theoretical calculation and simulation analysis results show that the temperature of the coolant gradually increases along the water flow direction, and the temperature of the battery cells also gradually increase due to the heat exchange between the cells and the coolant; this trend is observable and objectively correct. However, we encountered two relatively large interference factors in practical application: one is the installation deviation of the temperature sensor on the surface of the cylindrical battery, which has a relatively small impact; the other is the deformation of the battery module mounting bracket, which leads to poor contact and has a large impact. Each battery module is fixed together by three plastic supports above and below the module. These brackets need to overcome the slight bending back force of the L5 battery module and the static pressure (at a 40% compression rate) of the thermal conductive silicone pad. Therefore, there is a certain deformation of the plastic bracket, especially at the 1/4 and 3/4 area of the module. Consequently, a press-board was design to be installed, as shown in Figure 13a. Although the measured temperature distribution was somewhat random, the maximum temperature and maximum temperature difference were kept within a reasonable range that was consistent with the simulation results.
Table 6 presents a comparison of all the experimental results and numerical results. The numerical results agree well with the experimental results, and the temperature difference between these two methods was within 2 °C. Considering manufacturing errors, assembling errors, and testing errors, this theoretical conclusion is reasonable in practice.
At the same time, the simulation and test results also showed that when the root mean square current is greater than 30 A, it is difficult to achieve the temperature control target by adjusting the coolant flow rate and temperature, and the temperature difference will be further amplified. Through simulation and experimentation, we have fully determined the heat dissipation capability of the battery pack cooling system, allowing the battery pack to be cooled and used more efficiently.
5.4. Experiment on a Vehicle
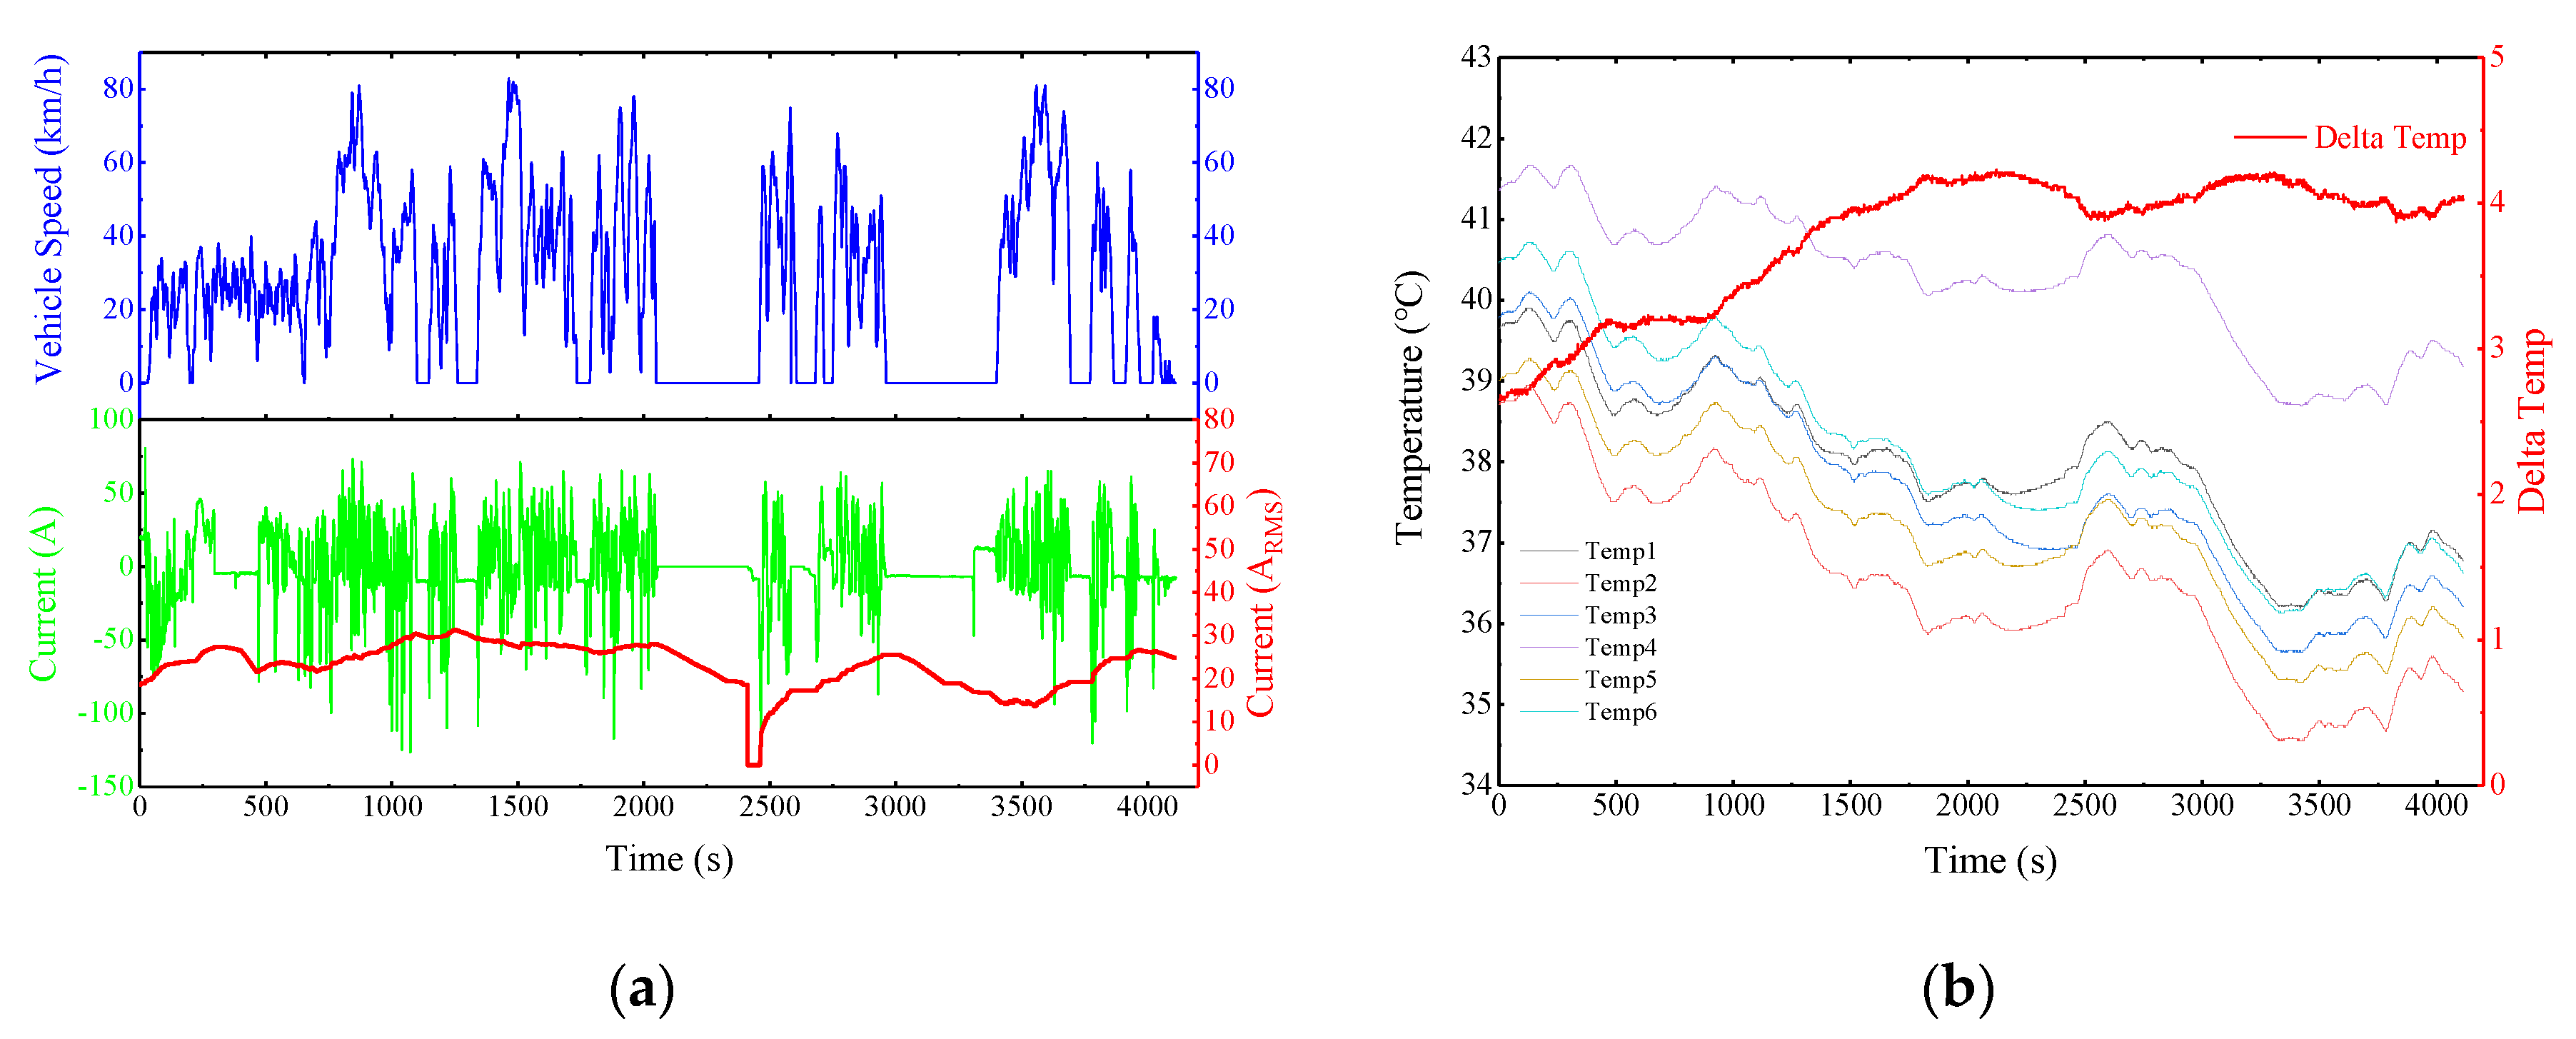
The previous simulation and bench tests were performed for the quantitative analysis at a constant heating power and a stable coolant temperature and cooling flow. In order to observe the battery pack temperature trends when these boundary conditions change dynamically, the battery pack was tested on a hybrid SUV. This experiment was carried out by driving 30 km (about 1.2 h in the summer) when the ambient temperature was 33 °C~39 °C. The vehicle speed and battery current curve are shown in Figure 16a. The maximum charging current was about 79.6 A, while the maximum discharging current was about −127.8 A. The root mean square current, including charging and discharging, was 26.5 A during the whole testing process. The cooling flow varied between 5 and 10 L/min, and the inlet temperature was dynamically adjusted between 25 and~30°C.
The temperature test positions in the battery pack were determined according to the results of the bench test, covering the highest and lowest temperature points. The temperature and temperature difference curves are shown in Figure 16b. At the beginning of the test, the maximum temperature of the battery pack was 41.3 °C. After the cooling system was turned on, the battery temperature dropped rapidly and eventually stabilized at around 39.3 °C. During the test, the temperature difference of the battery pack was 2.87 °C at first; then, the temperature difference gradually became larger, but eventually stabilized at 4 °C. This result shows that the maximum temperature and temperature difference of the whole battery pack were effectively controlled.
6. Conclusions
In this paper, a performance-optimized and engineering-oriented properly liquid cooled plate was designed to meet the requirements of a battery pack with a high C-rate current in a certain hybrid SUV. This plate is able to disperse heat and effectively minimize the temperature difference between each cell. The achievements of this research are as follows:
- A simplified one-dimensional heat transfer model from the battery interface to the coolant was established; the mathematical relationship between head loss Hi and coolant flow Q1~Qn was also established, and the flow Qi in each serpentine pipe was calculated iteratively. The design parameters of the cooling plate and reasonable ranges of boundary conditions were obtained through these two models, which provided theoretical guidance for the simulation and reduced the number of combinations required for the simulation.
- The cross-section ratio affects the flow rate deviation β and results in temperature differences. As the cross-section ratio δ increases from 0.484 to 1.627 at Qtotal = 5 L/min, the flow rate deviation β decreases by about 40%, and the temperature difference decreases by about 2.5 °C. The inner support wall N can enhance heat transfer to reduce the maximum temperature but will cause a definite increase of the pressure drop in the pipeline. The pressure drop in the pipe when N = 9 (Qtotal = 5 L/min) increases by 2.5 kPa compared to that when N = 0, while the maximum temperature decreases by 3 °C.
- The optimized cross-section ratio is δ = 0.973 (D = 17 mm), and the number of supporting walls is N = 6. The maximum RMS current allowed by the cooling plate does not exceed 30 A, the maximum inlet temperature of the coolant does not exceed 30 °C, and the coolant flow is greater than 5 L/min at least. The ranges of the solution at various input conditions provide the basic data for BMS dynamic control.
Under the constraint of the actual project implementation, the experiment also objectively gives an acceptable deviation, which is worth further research and improvement.
7. Patents
There is a Chinese utility patent resulting from the work reported in this manuscript.
- Patent: A kind of Power Battery Module;
- Applicant: Corun CHS Technology Co., Ltd. (2880 Wanfeng Road, Fengjing town, Jinshan District, Shanghai, China);
- Inventor: Minghuan Zhang, Faping Zhong, Aihua Chu, Chunhua Wu, Wei Tan, Chenquan Zhou, Yunpeng Zong;
- Application No.: 201720406483.4;
- Application Date: 2017-04-18
Author Contributions
A.C. and X.L. conducted the main work of the design, calculation, simulation, and analysis of the optimization results; A.C. designed the liquid cooling battery system and also wrote the paper; X.L. contributed to the modeling of cooling system and simulation process; C.Z. contributed to the battery pack testing and verification; J.Z. and Y.Y. provided insightful suggestions and revised the paper. All authors have read and agreed to the published version of the manuscript.
Funding
Advanced subject construction project of Jiangsu Province (BY2015047-2); National 863 Project (2011AA11A201); National Science and Technology Support Project (2011BAG02B10)
Acknowledgments
Thanks to Corun CHS Technology Co., Ltd. for allowing me to participate in this research project and providing test samples and test equipment. I am grateful to Associate Professor Peiyong Ni of Nantong University and Associate Professor Yelin Deng of Soochow University for helping to review the paper and provide valuable advice.
Conflicts of Interest
The authors declare no conflict of interest.
Nomenclature
| A | area of the contact region between the battery and serpentine pipe (m2) |
| Af | area of the pipe—fluid interface (m2) |
| Cp | heat capacity (J (kg K)−1) |
| d | diameter of the main pipe (m) |
| dH | hydraulic diameter of the serpentine pipe (m) |
| g | gravity acceleration (m s−2) |
| h | heat transfer coefficient of convection (W (m−2·K−1)) |
| H | head loss (m) |
| k | coefficient of heat conductivity (W (m−1·K−1)) |
| L | length (m) |
| mass flow rate (kg s−1) | |
| N | the number of internal walls within one serpentine pipe |
| Nu | Nusselt number |
| Δp | pressure loss (Pa) |
| Pr | Prandtl number |
| q | heat generation in the battery cell (W) |
| Qtotal | total volume flow rate in one water bag (m3·s−1) |
| Qi | volume flow rate in serpentine pipe i (m3·s−1) |
| Re | Reynolds number |
| Sa | Section area of the main pipe (m2) |
| Sb | Section area of the serpentine pipe (m2) |
| t | thickness of the serpentine pipe wall (m) |
| Ti,j | average temperature on cell j, serpentine i (K) |
| Tf,i,j | average fluid temperature corresponding to cell j, serpentine i (K) |
| Tin,i,j | average inlet temperature corresponding to cell j, serpentine i (K) |
| Tout,i,j | average outlet temperature corresponding to cell j, serpentine i (K) |
| V | velocity of fluid in the system (m·s−1) |
| DC-IR | DC internal resistance (Ω) |
| Greek letters | |
| β | bias rate of the flow in serpentine pipes |
| δ | ratio of the section area of the main pipe to the total section area of serpentine pipes |
| λ | frictional loss coefficient of pipes |
| μ | dynamic viscosity (Pa·s) |
| ν | kinematic viscosity (m2·s−1) |
| ξ | local loss coefficient of pipes |
| ρ | density (kg·m−3) |
| Subscripts | |
| a | main pipe |
| b | serpentine pipe |
| diff | difference |
| s | steel shell of battery |
| f | fluid |
| i | index of the serpentine pipe in one module |
| j | index of the cell along one serpentine line |
| max | maximum |
| pvc | Polyvinyl chloride layer of the battery |
| pad | thermal pad of Silicon layer |
| total | total |
| turn | turning of pipes |
| wall | wall of pipes |
References
- Pillot, C. Micro hybrid, HEV, P-HEV and EV market 2012–2025 impact on the battery business. In Proceedings of the 2013 World Electric Vehicle Symposium and Exhibition (EVS27), Barcelona, Spain, 17–20 November 2013. [Google Scholar]
- Pillot, C. The battery market for HEV P-HEV and EV 2010-2020. In Proceedings of the 28th International Battery Seminar and Exhibit, Fort Lauderdake, FL, USA, 14–17 March 2011. [Google Scholar]
- Broussely, M. Traction batteries. EV and HEV. In Industrial Applications of Batteries; Broussely, M., Pistoia, G., Eds.; Elsevier: Amsterdam, Netherlands, 2007; pp. 203–271. [Google Scholar]
- Koniak, M.; Czerepicki, A. Selection of the battery pack parameters for an electric vehicle based on performance requirements. In IOP Conference Series: Materials Science and Engineering; IOP Publishing: Bangkok, Thailand; Bristol, UK, 2017. [Google Scholar]
- Guo, L.S.; Wang, Z.R. Effects of the environmental temperature and heat dissipation condition on the thermal runaway of lithium ion batteries during the charge-discharge process. J. Loss Prevent. Proc. 2017, 49, 953–960. [Google Scholar] [CrossRef]
- Lai, Y.; Du, S. Insight into heat generation of lithium ion batteries based on the electrochemical-thermal model at high discharge rates. Int. J. Hydrogen Energy 2015, 40, 13039–13049. [Google Scholar] [CrossRef]
- Pesaran, A.A. Battery thermal management in EV and HEVs: Issues and solutions. Natl. Renew. Energy Lab. 2001, 43, 34–49. [Google Scholar]
- An, Z.; Jia, L. A review on lithium-ion power battery thermal management technologies and thermal safety. J. Therm. Sci. 2017, 26, 391–412. [Google Scholar] [CrossRef]
- Liu, G.; Ouyang, M. Analysis of the heat generation of lithium-ion battery during charging and discharging considering different influencing factors. J. Anal. Calorim. 2014, 116, 1001–1010. [Google Scholar] [CrossRef]
- Meng, B.; Wang, Y.; Mao, J.; Liu, J.; Xu, G.; Dai, J. Using SoC Online Correction Method Based on Parameter Identification to Optimize the Operation Range of NI-MH Battery for Electric Boat. Energies 2018, 11, 586. [Google Scholar] [CrossRef] [Green Version]
- Qiao, S.; Hu, M.; Fu, C.; Qin, D.; Zhou, A.; Wang, P.; Lin, F. Experimental Study on Storage and Maintenance Method of Ni-MH Battery Modules for Hybrid Electric Vehicles. Appl. Sci. 2019, 9, 1742. [Google Scholar] [CrossRef] [Green Version]
- Pesaran, A.A. Battery thermal models for hybrid vehicle simulations. J. Power Sources 2002, 110, 377–382. [Google Scholar] [CrossRef]
- Chen, Y.; Evans, J.W. Heat transfer Phenomena in Lithium/Polymer-electrolyte Batteries for Electric Vehicle Application. J. Electrochem. Soc. 1993, 140, 1833–1838. [Google Scholar] [CrossRef]
- Harmel, J.; Ohms, D.; Guth, U.; Wiesener, K. Investigation of the heat balance of bipolar Ni-MH batteries. J. Power Sources 2006, 155, 88–93. [Google Scholar] [CrossRef]
- Chen, S.C.; Wan, C.C.; Wang, Y.Y. Thermal Analysis of Lithium-Ion Batteries. J. Power Sources 2005, 140, 111–124. [Google Scholar] [CrossRef]
- Nelson, P.; Dees, D.; Amine, K.; Henriksen, G. Modeling Thermal Management of Lithium-ion PNGV Batteries. J. Power Sources 2002, 110, 349–356. [Google Scholar] [CrossRef]
- Huo, Y.; Rao, Z. Investigation of power battery thermal management by using mini-channel cold plate. Energy Convers. Manag. 2015, 89, 387–395. [Google Scholar] [CrossRef]
- Jarrett, A.; Kim, I.Y. Design optimization of electric vehicle battery cooling plates for thermal performance. J. Power Sources 2011, 196, 10359–10368. [Google Scholar] [CrossRef]
- Ye, X.; Zhao, Y.; Quan, Z. Experimental study on heat dissipation for lithium-ion battery based on micro heat pipe array (MHPA). Appl. Therm. Eng. 2018, 130, 74–82. [Google Scholar] [CrossRef]
- Liang, J.; Gan, Y.; Li, Y. Investigation on the thermal performance of a battery thermal management system using heat pipe under different ambient temperatures. Energy Convers. Manag. 2018, 155, 1–9. [Google Scholar] [CrossRef]
- Putra, N.; Ariantara, B.; Pamungkas, R.A. Experimental investigation on performance of lithium-ion battery thermal management system using flat plate loop heat pipe for electric vehicle application. Appl. Therm. Eng. 2016, 99, 784–789. [Google Scholar] [CrossRef]
- Ibrahim, O.T.; Monroe, J.G.; Thompson, S.M.; Shamsaei, N.; Bilheux, H.; Elwany, A.; Bian, L. An investigation of a multi-layered oscillating heat pipe additively manufactured from Ti-6Al-4V powder. Int. J. Heat Mass Transf. 2017, 108, 1036–1047. [Google Scholar] [CrossRef] [Green Version]
- Yan, J.; Wang, Q.; Li, K.; Sun, J. Numerical study on the thermal performance of a composite board in battery thermal management system. Appl. Therm. Eng. 2016, 106, 131–140. [Google Scholar] [CrossRef]
- Li, W.; Qu, Z.; He, Y.; Tao, Y. Experimental study of a passive thermal management system for high-powered lithium ion batteries using porous metal foam saturated with phase change materials. J. Power Sources 2014, 255, 9–15. [Google Scholar] [CrossRef]
- Alrashdan, A.; Mayyas, A.T.; Al-Hallaj, S. Thermo-mechanical behaviors of the expanded graphite-phase change material matrix used for thermal management of Li-ion battery packs. J. Mater. Process. Technol. 2010, 210, 174–179. [Google Scholar] [CrossRef]
- Arora, S. Selection of thermal management system for modular battery packs of electric vehicles: A review of existing and emerging technologies. J. Power Sources 2018, 400, 621–640. [Google Scholar] [CrossRef]
- Ling, Z.; Wang, F.; Fang, X.; Gao, X.; Zhang, Z. A hybrid thermal management system for lithium ion batteries combining phase change materials with forced-air cooling. Appl. Energy 2015, 148, 403–409. [Google Scholar] [CrossRef] [Green Version]
- Huang, Q.; Li, X.; Zhang, G.; Zhang, J.; He, F.; Li, Y. Experimental investigation of the thermal performance of heat pipe assisted phase change material for battery thermal management system. Appl. Therm. Eng. 2018, 141, 1092–1100. [Google Scholar] [CrossRef]
- Wu, W.; Yang, X.; Zhang, G.; Chen, K.; Wang, S. Experimental investigation on the thermal performance of heat pipe-assisted phase change material based battery thermal management system. Energy Convers. Manag. 2017, 138, 486–492. [Google Scholar] [CrossRef]
- Suh, I.-S.; Cho, H.; Lee, M. Feasibility study on thermoelectric device to energy storage system of an electric vehicle. Energy 2014, 76, 436–444. [Google Scholar] [CrossRef]
- Tassou, S.A.; Lewis, J.S.; Ge, Y.T.; Hadawey, A.; Chaer, I. A review of emerging technologies for food refrigeration applications. Appl. Therm. Eng. 2010, 30, 263–276. [Google Scholar] [CrossRef] [Green Version]
- Kitanovski, A.; Tušek, J.; Tomc, U.; Plaznik, U.; Ožbolt, M.; Poredoš, A. Active Magnetic Regeneration. In Magnetocaloric Energy Conversion; Springer: Berlin, Germany, 2015; pp. 97–166. [Google Scholar]
- Bandhauer, T.M.; Garimella, S. Passive, Internal thermal management system for batteries using microscale liquid–vapor phase change. Appl. Therm. Eng. 2013, 61, 756–769. [Google Scholar] [CrossRef]
- Pinilla, L.S.; Rodríguez, R.L.; Gandarias, N.T. TRLs 5–7 Advanced Manufacturing Centres, Practical Model to Boost Technology Transfer in Manufacturing. Sustainability 2019, 11, 4890. [Google Scholar] [CrossRef] [Green Version]
- Qu, X.H. Study on Performance and Control Optimization of Electric Vehicle Thermal Management Systems. Ph.D. Thesis, Shanghai Jiaotong University, Shanghai, China, 2012. [Google Scholar]
- Saaty, T.L. Decision making with the analytic hierarchy process. Int. J. Serv. Sci. 2008, 1, 83–98. [Google Scholar] [CrossRef] [Green Version]
- Pesaran, A.; Keyser, M.; Burch, S. An Approach for Designing Thermal Management Systems for Electric and Hybrid Vehicle Battery Packs; NREL/CP-540-25992; NREL: Golden, CO, USA, 1999.
- Sato, N.; Yagi, K. Thermal behavior analysis of nickel metal hydride batteries for electric vehicles. Soc. Automot. Eng. Jpn. 2000, 21, 205–211. [Google Scholar] [CrossRef]
- Shah, R.K.; London, A.L. Laminar flow forced convection in ducts. In Advances in Heat Transfer, Supplement 1; Harenett, J.P., Irvine, T.F., Eds.; Academic Press Inc.: New York, NY, USA, 1978; pp. 78–384. [Google Scholar]
- Munson, B.R.; Okiishi, T.H. Fluid Mechanics, 4th ed.; John Wiley: Hoboken, NJ, USA, 2013; pp. 178–230. [Google Scholar]
- Qin, H.M. Problems on the local loss coefficient of three-way connectors in ventilation pipes. Heat. Vent. Air Cond. 1980, 03, 10–13. [Google Scholar]
- Lin, J.Z.; Ruan, X.D.; Chen, B.G.; Wang JP Zhou, J.; Ren, A.L. Fluid Mechanics, 2th ed.; Tsinghua University Press: Beijing, China, 2013; p. 243. [Google Scholar]
- Ji, W.T.; Jacobi, A.M.; He, Y.L.; Tao, W.Q. Summary and evaluation on single-phase heat transfer enhancement techniques of liquid laminar and turbulent pipe flow. Int. J. Heat Mass Transf. 2015, 88, 735–754. [Google Scholar] [CrossRef]
- Arora, S.; Kapoor, A. Mechanical Design and Packaging of Battery Packs for Electric Vehicles (Book Chapter). In Behaviour of Lithium-Ion Batteries in Electric Vehicles. Green Energy and Technology; Pistoia, G., Liaw, B., Eds.; Springer: Cham, Switzerland, 2018; pp. 175–200. [Google Scholar]
Figure 1.
Organization of the study.
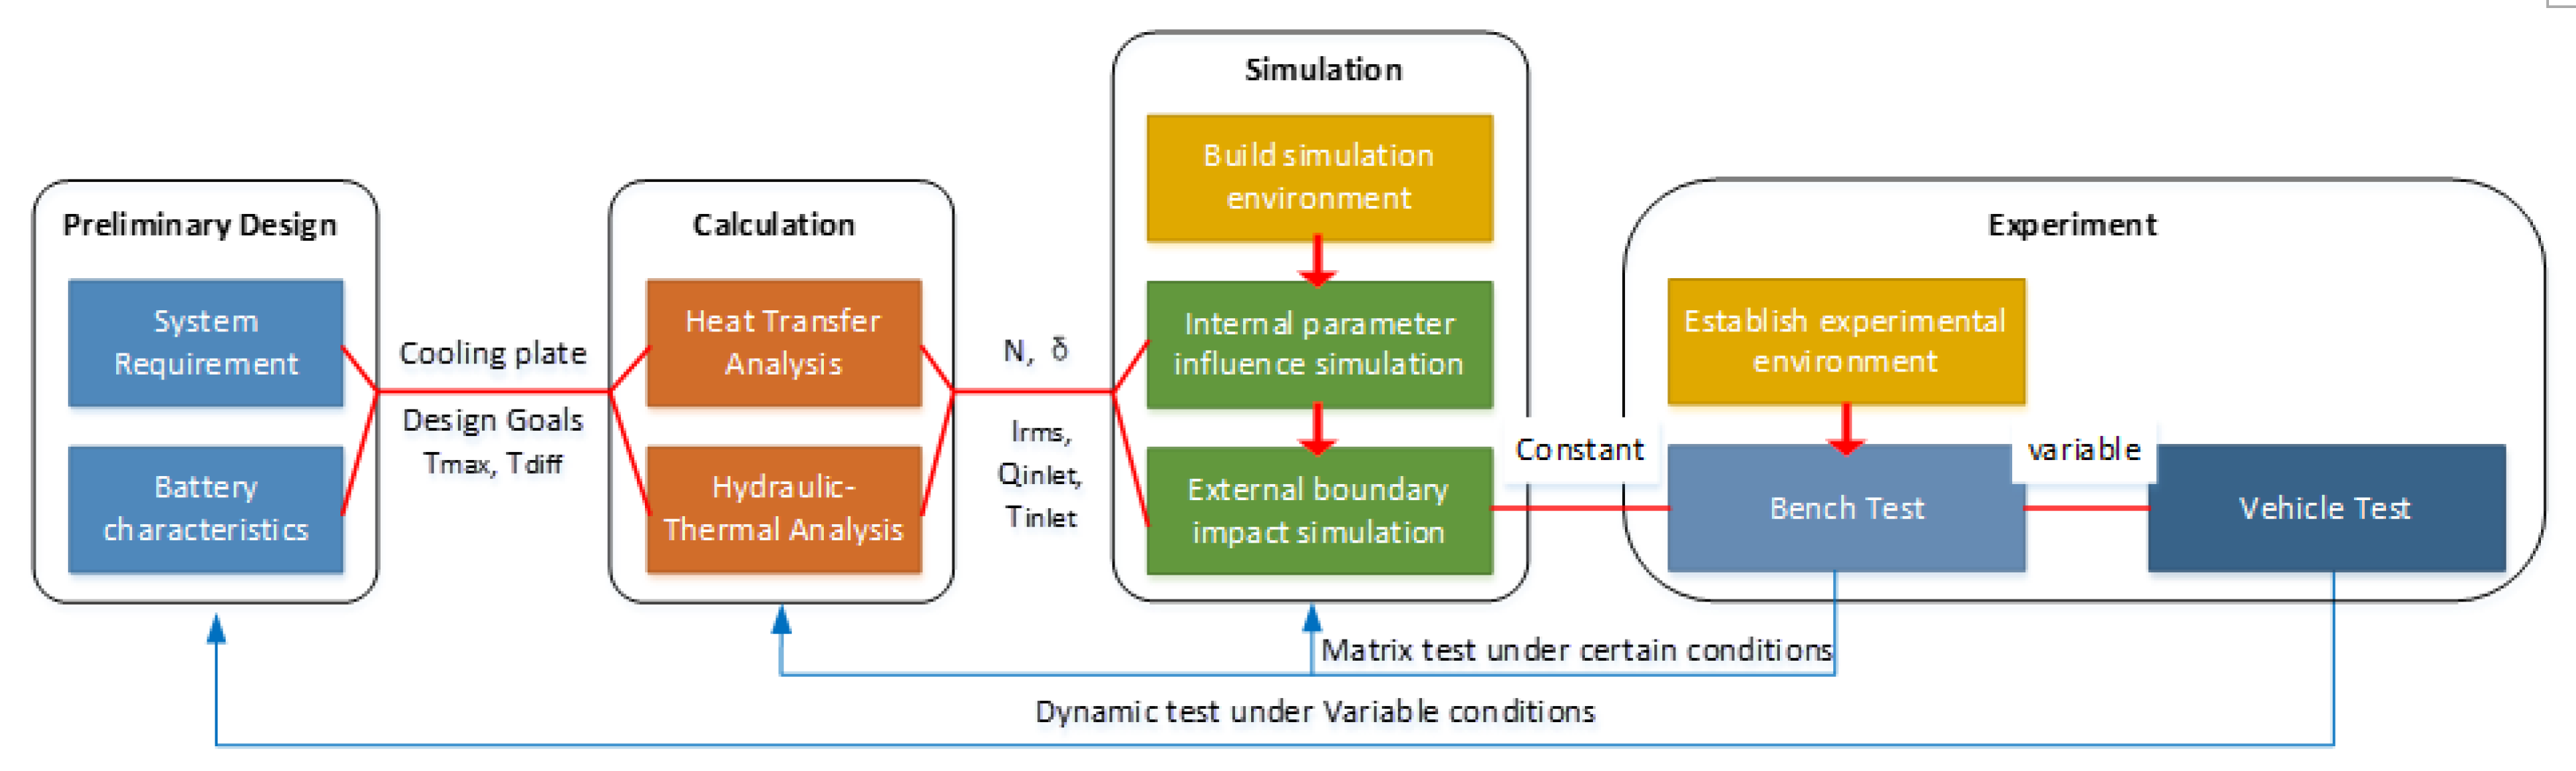
Figure 2.
The shape of the battery. (a) The battery cells; (b) the L5 battery module.
Figure 3.
Liquid-cooling system. (a) A 3D view of the two cooling modules, including the in/out rubber pipes connected in parallel; (b) schematic of the cooling module; (c) schematic side view of the cooling module and the battery cell; (d) cross-sectional view of the serpentine pipe (with internal walls).
Figure 4.
A single cell heat transfer model. (a) Schematic of the heat transfer pass of a single cell (b) presented as heat resistance.
Figure 4.
A single cell heat transfer model. (a) Schematic of the heat transfer pass of a single cell (b) presented as heat resistance.
Figure 5.
Schematic of the three-way connector. (a) Separate flow; (b) convergence flow.
Figure 6.
Schematic of the head loss for the ith branch.
Figure 7.
Geometry models: (a) battery cells with a cooling plate; (b) single-battery heat transfer model (grid level 1).
Figure 7.
Geometry models: (a) battery cells with a cooling plate; (b) single-battery heat transfer model (grid level 1).
Figure 8.
Sectional view of the grids at the mid-symmetry plane: (a) grid level 1; (b) grid level 4; (c) grid level 7.
Figure 8.
Sectional view of the grids at the mid-symmetry plane: (a) grid level 1; (b) grid level 4; (c) grid level 7.

Figure 9.
Grid independence. (a) Nusselt number, pressure loss, and maximum temperature calculated by different grid systems; (b) comparison of the Nusselt number and pressure loss of the theoretical and numerical results.
Figure 9.
Grid independence. (a) Nusselt number, pressure loss, and maximum temperature calculated by different grid systems; (b) comparison of the Nusselt number and pressure loss of the theoretical and numerical results.
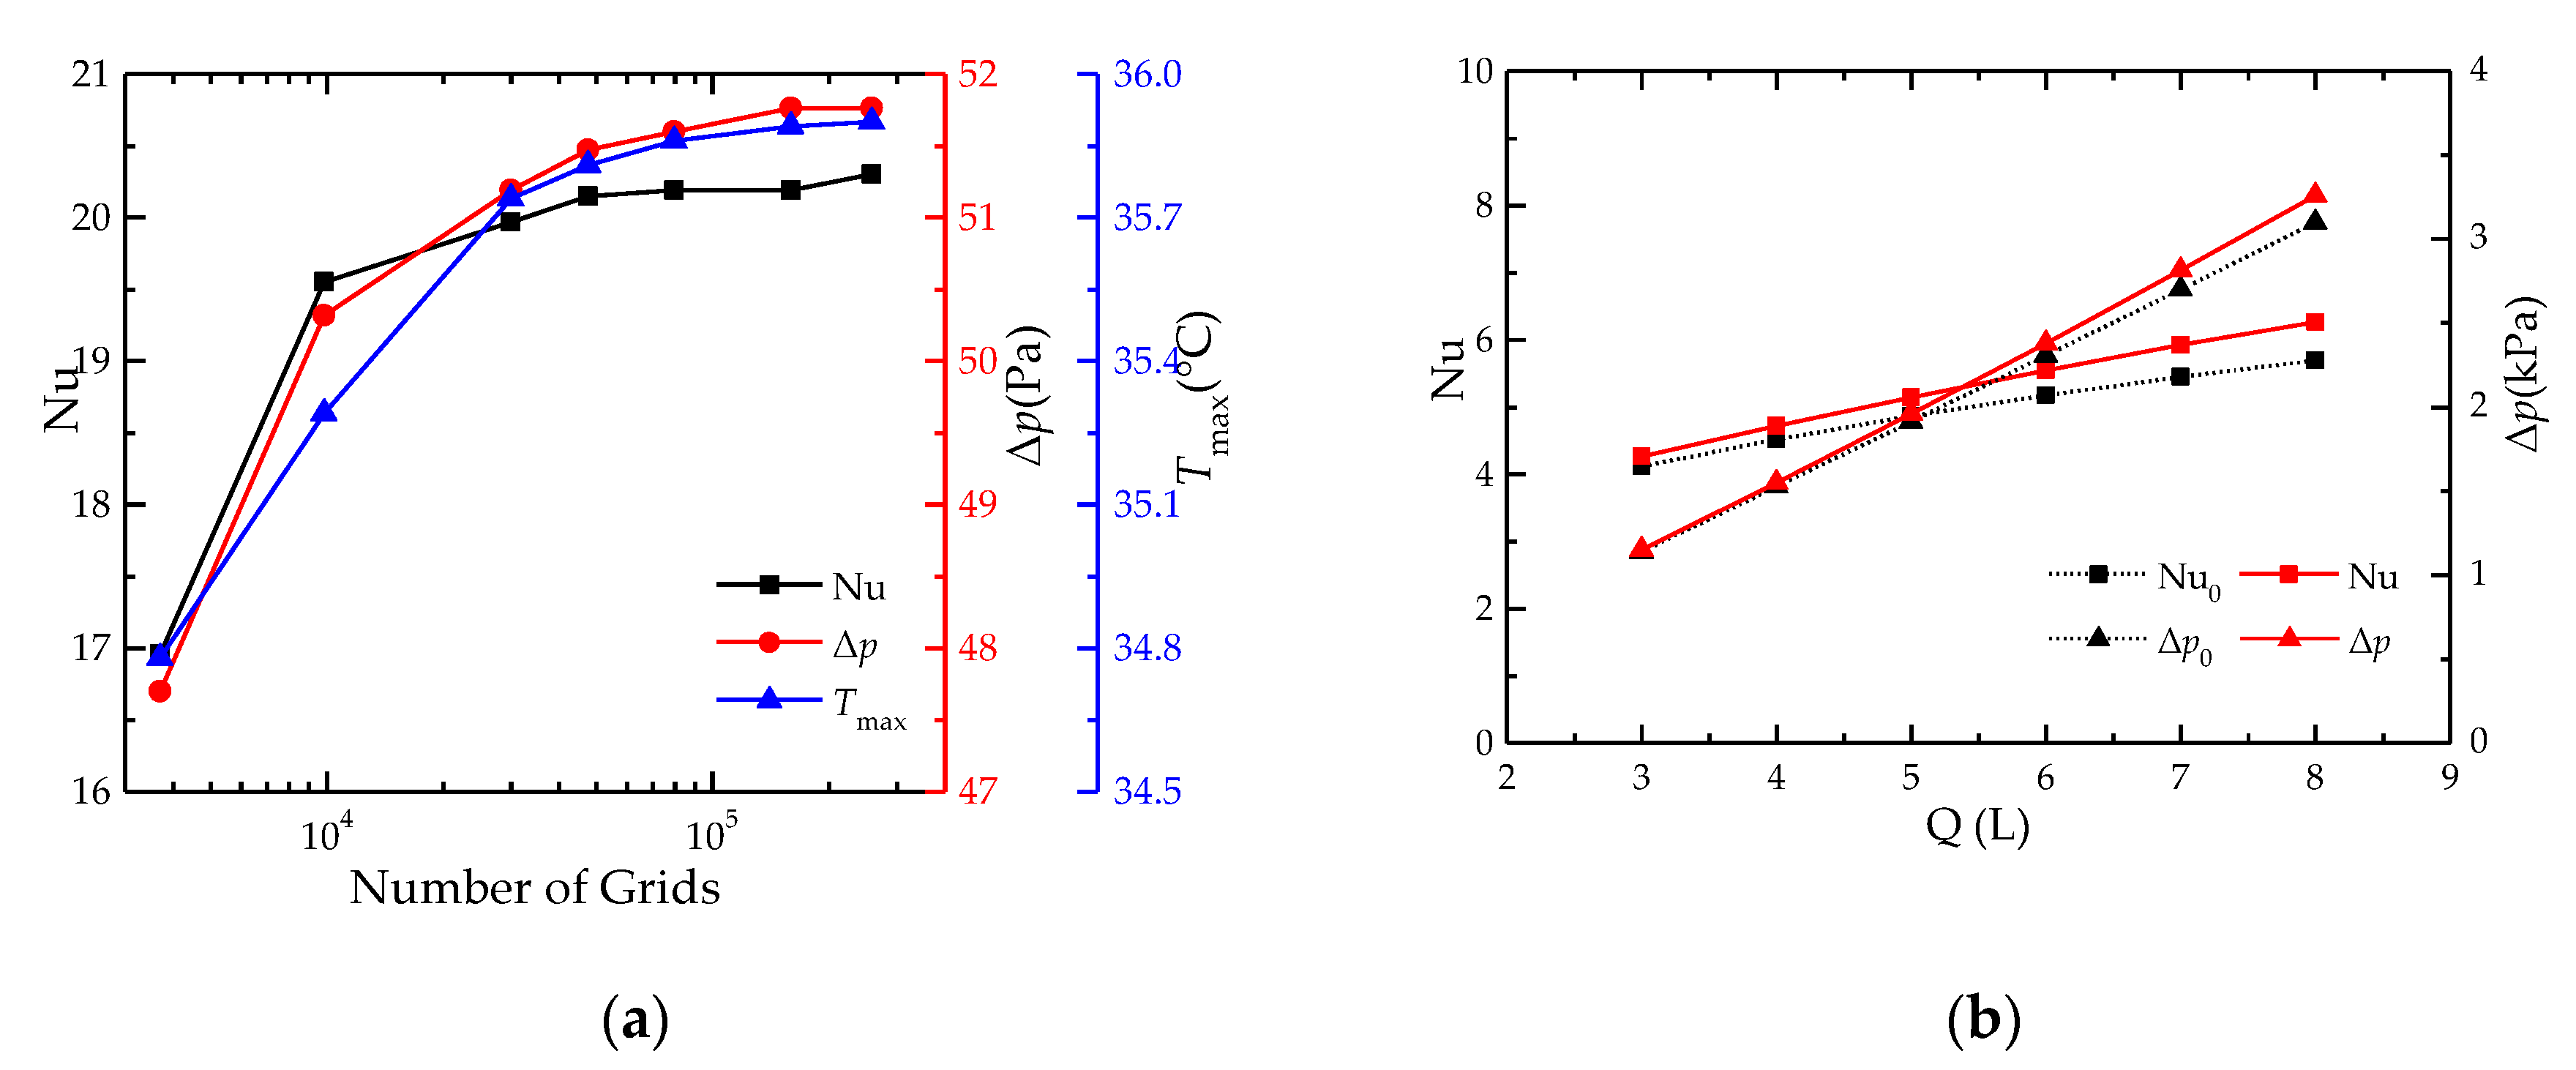
Figure 10.
The effect of δ on several parameters, at Q = 5 L/min, N = 0: (a) β and Δp; (b) Tmax and Tdiff.
Figure 10.
The effect of δ on several parameters, at Q = 5 L/min, N = 0: (a) β and Δp; (b) Tmax and Tdiff.
Figure 11.
The effect of N on several parameters at Q = 5 L/min, δ = 0.973: (a) β and Δp; (b) Tmax and Tdiff.
Figure 11.
The effect of N on several parameters at Q = 5 L/min, δ = 0.973: (a) β and Δp; (b) Tmax and Tdiff.
Figure 12.
The temperature field at the worst working condition with an effective current at 25 A and δ = 0.973, Q = 5 L/min, and N = 6: (a) batteries; (b) coolant.
Figure 12.
The temperature field at the worst working condition with an effective current at 25 A and δ = 0.973, Q = 5 L/min, and N = 6: (a) batteries; (b) coolant.

Figure 13.
Battery pack with a cooling plate under a test: (a) the battery pack’s internal structure and the cooling plate in details; (b) the thermocouple placement and fixing method.
Figure 13.
Battery pack with a cooling plate under a test: (a) the battery pack’s internal structure and the cooling plate in details; (b) the thermocouple placement and fixing method.
Figure 14.
Schematic of the battery pack temperature test platform.
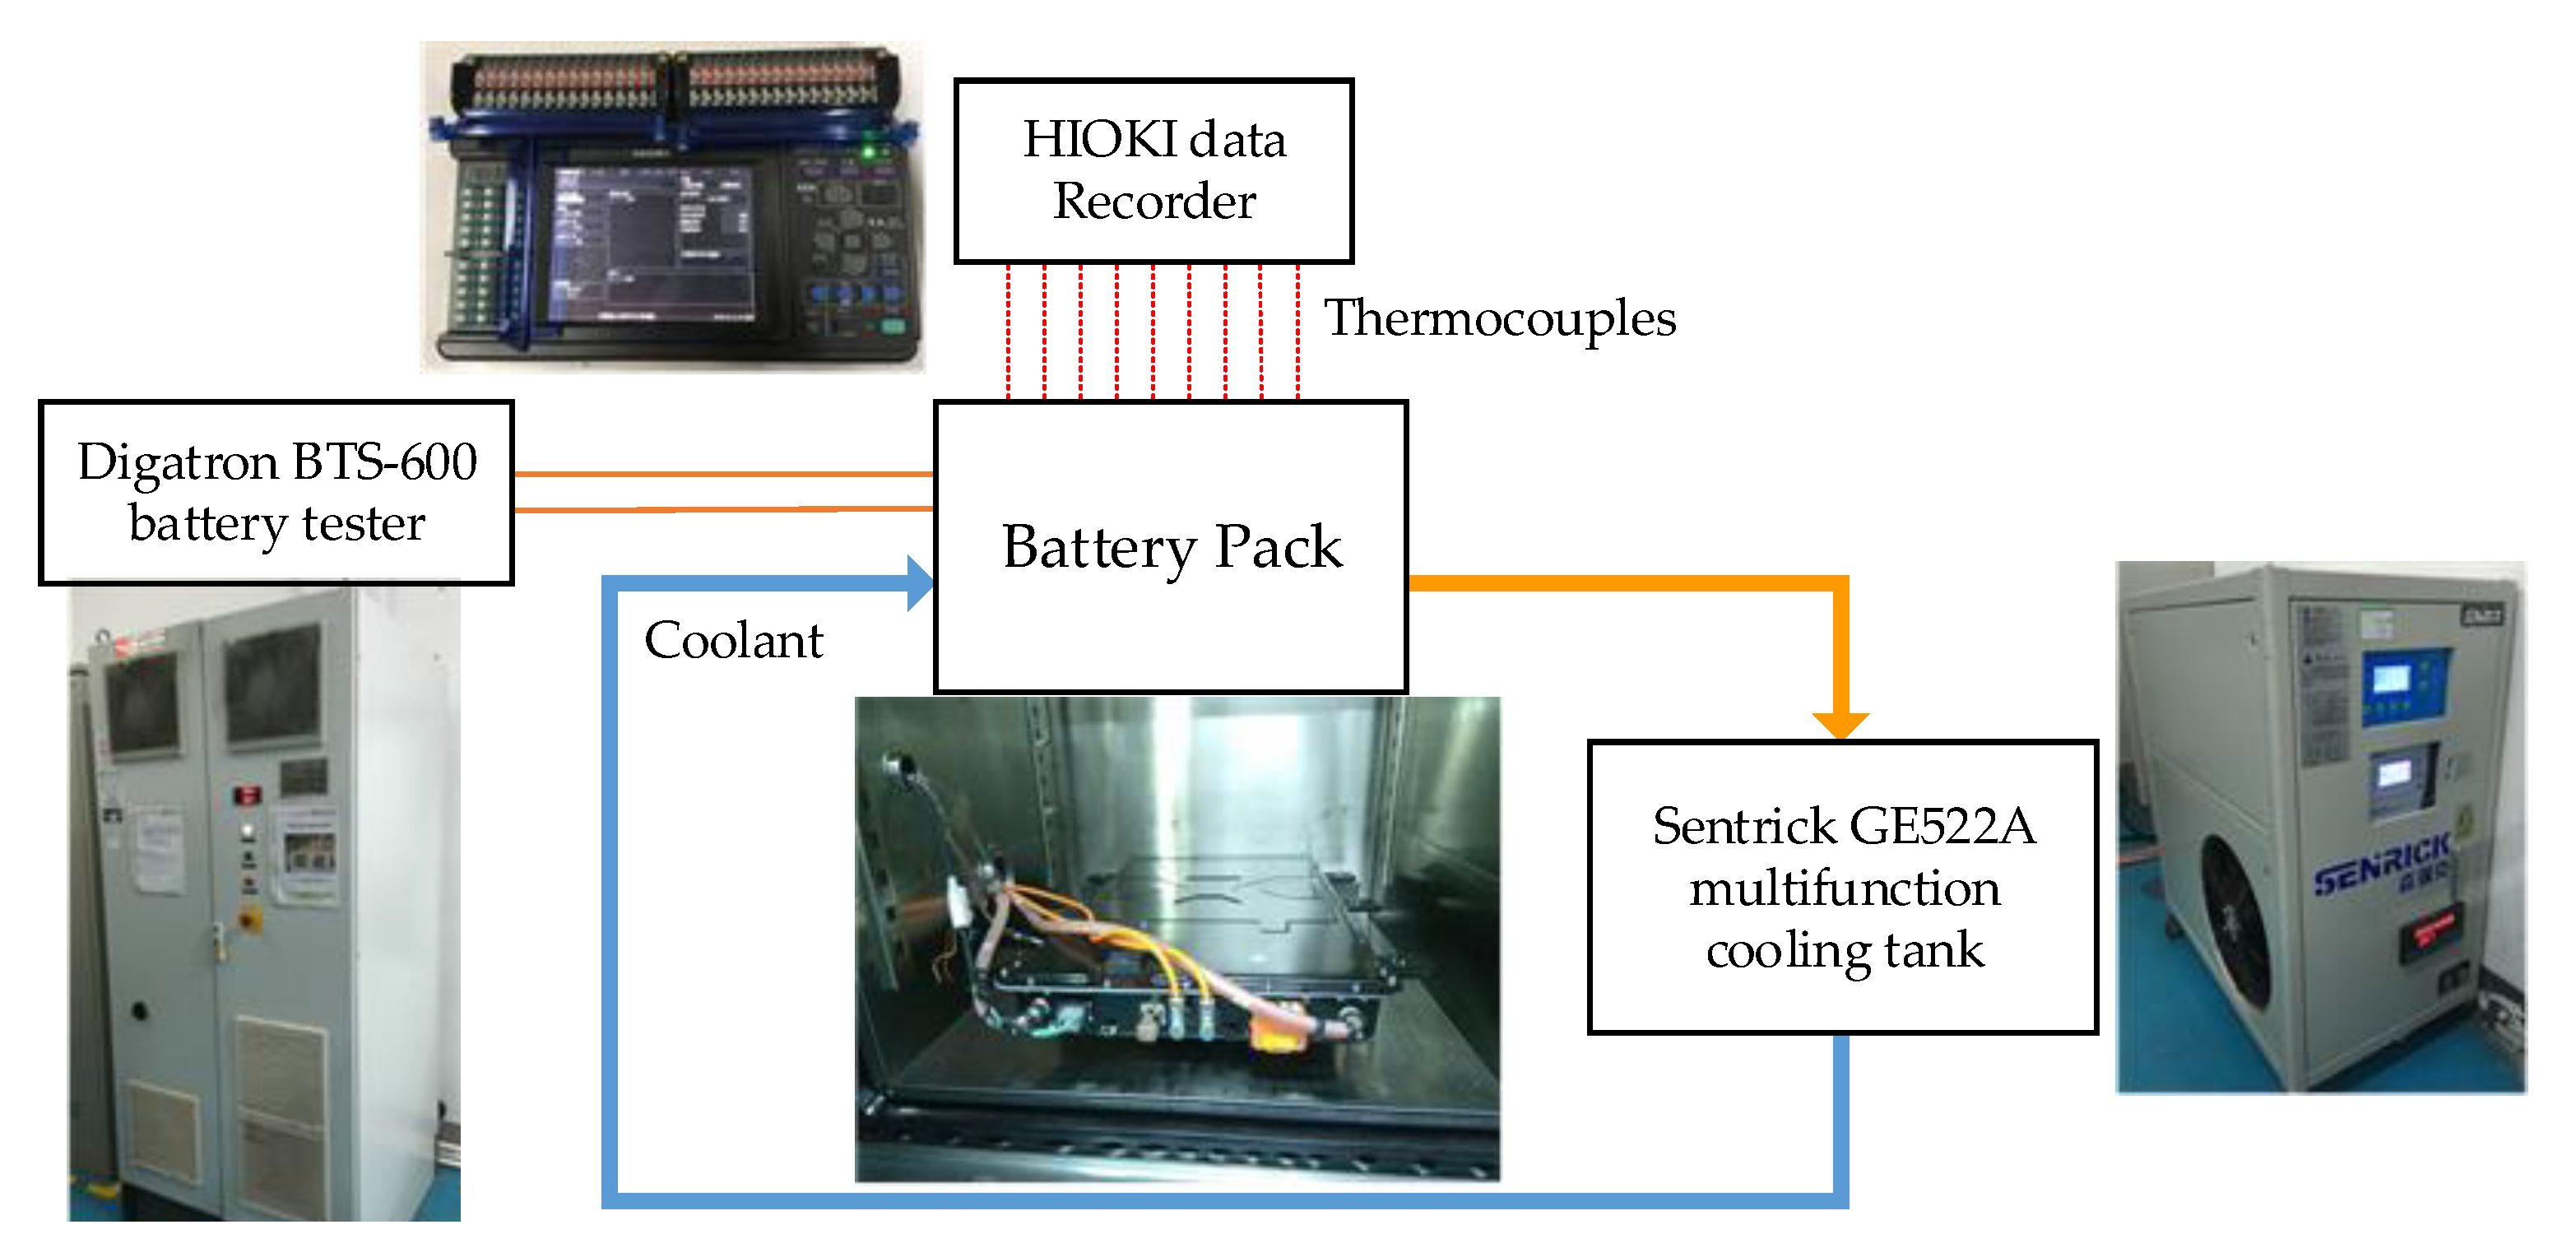
Figure 15.
Temperature test result on a vehicle: (a) temperature curve during the complete test process; (b) temperature histogram of 20 thermocouples after temperature equilibration.
Figure 15.
Temperature test result on a vehicle: (a) temperature curve during the complete test process; (b) temperature histogram of 20 thermocouples after temperature equilibration.
Figure 16.
Test conditions and test results of the temperature on vehicles: (a) road spectrum, transient current spectrum, and RMS current over ten minutes; (b) ambient temperature inside the battery pack temperature trends from six sensors, and temperature difference curves.
Figure 16.
Test conditions and test results of the temperature on vehicles: (a) road spectrum, transient current spectrum, and RMS current over ten minutes; (b) ambient temperature inside the battery pack temperature trends from six sensors, and temperature difference curves.

Table 1.
Technology readiness level (TRL) of battery thermal management system (BTMS) in vehicles.
| Technology Readiness Level | Air | Liquid | PCM | HP | Emerging |
|---|---|---|---|---|---|
| TRL 9—Complete industrialization | Ο | Ο | |||
| TRL 8—Optimization | Ο | Ο | |||
| TRL 7—Entry into production | Ο | Ο | |||
| TRL 6—Application development in product | Ο | Ο | Ο | Ο | |
| TRL 5—Verification in production equipment | Ο | Ο | Ο | Ο | |
| TRL 4—Verification in representative prototype | Ο | Ο | Ο | Ο | |
| TRL 3—Verification in the laboratory | Ο | Ο | Ο | Ο | Ο |
| TRL 2—Feasibility and profitability analysis | Ο | Ο | Ο | Ο | Ο |
| TRL 1—Investigation of the fundamentals of technology | Ο | Ο | Ο | Ο | Ο |
Table 2.
Basic performance parameters of the NI-MH cells and pack.
| Items | Cell | L5 Module | Pack |
|---|---|---|---|
| Number of cells | 1 | 5 | 240 |
| Normal Voltage (V) | 1.2 | 6 | 288 |
| Capacity (Ah) | 6 | 6 | 6 |
| Energy (Wh) | 7.2 | 36 | 1728 |
| DC-IR (mΩ) | 2.5 | 12.5 | 600 |
| Discharge power 1 (W) | 185 | 925 | 40,000 2 |
1 25 °C, 50% SOC, 10 s. 2 The total power of the battery pack is smaller than the theoretical value because of the consistency of the battery cells.
Table 3.
Physical properties of the materials.
| Material | Density kg/m3 | Specific Heat Capacity J/(kg·K) | Thermal Conductivity W/(m·K) |
|---|---|---|---|
| 50% ethylene glycol | 1082 | 3300 | 0.4 |
| Cell material | 3270 | 1537 | 15.1(Axial)/1(Radial) |
| Surface steel | 7870 | 448 | 80 |
| Polyvinyl chloride film | 1140 | 1670 | 0.2 |
| Thermal silica gel pad | 2600 | 2190 | 1.5 |
| Aluminum alloy cooling plate | 2700 | 903 | 237 |
Table 4.
Grid.
| Grid level No. | 1 | 2 | 3 | 4 | 5 | 6 | 7 |
|---|---|---|---|---|---|---|---|
| Number of grids | 3698 | 9850 | 29,978 | 47,426 | 79,335 | 159,777 | 258,299 |
| Number of prism layers | 1 | 2 | 3 | 4 | 5 | 6 | 7 |
Table 5.
Matrix list with variable boundary conditions.
| Group | 1 1 | 2 | 3 | 4 | 5 | 6 | 7 | 8 | 9 | 10 | |
|---|---|---|---|---|---|---|---|---|---|---|---|
| Heat | Irms (A) | 25 | 25 | 25 | 25 | 30 | 30 | 30 | 30 | 35 | 35 |
| Power (W) | 375 | 375 | 375 | 375 | 540 | 540 | 540 | 540 | 735 | 735 | |
| Rate (W/m3) | 30,791 | 30,791 | 307,91 | 30,791 | 44,339 | 44,339 | 44,339 | 44,339 | 60,350 | 60,350 | |
| Coolant | Tinlet (°C) | 25 | 25 | 30 | 30 | 25 | 25 | 30 | 30 | 25 | 30 |
| Q (L/min) | 5 | 10 | 5 | 10 | 5 | 10 | 5 | 10 | 10 | 10 | |
1 Group NO.1 was described in detail as an example.
Table 6.
Comparison of the experimental results and numerical results.
| Test Order | Boundary Conditions | Simulation | Experiment | Judgment | ||||
|---|---|---|---|---|---|---|---|---|
| Irms (A) | Tinlet (°C) | Q (L/min) | Tmax (°C) | Tdiff (°C) | Tmax (°C) | Tdiff (°C) | ||
| 1 1 | 25 | 25 | 5 | 37.6 | 3.0 | 38.7 | 3.0 | Pass |
| 2 | 25 | 10 | 36.8 | 2.8 | 38.3 | 2.9 | Pass | |
| 3 | 30 | 5 | 41.1 | 2.7 | 42.3 | 2.6 | Pass | |
| 4 | 30 | 10 | 40.2 | 2.1 | 41.3 | 2.4 | Pass | |
| 5 | 30 | 25 | 5 | 40.4 | 3.5 | 41.3 | 3.2 | Pass |
| 6 | 25 | 10 | 40.2 | 2.9 | 41.1 | 2.8 | Pass | |
| 7 | 30 | 5 | 43.9 | 3.1 | 45.1 | 2.9 | Pass | |
| 8 | 30 | 10 | 43.2 | 2.5 | 44.8 | 2.7 | Pass | |
| 9 | 35 | 25 | 10 | 45.3 | 3.9 | 46.3 | 4.1 | Fail |
| 10 | 30 | 10 | 48.6 | 4.0 | 49.7 | 3.8 | Fail | |
1 The process and results of the NO.1 experiments are described in detail as examples.
© 2020 by the authors. Licensee MDPI, Basel, Switzerland. This article is an open access article distributed under the terms and conditions of the Creative Commons Attribution (CC BY) license (http://creativecommons.org/licenses/by/4.0/).
Share and Cite
MDPI and ACS Style
Chu, A.; Yuan, Y.; Zhu, J.; Lu, X.; Zhou, C. The Design and Investigation of a Cooling System for a High Power Ni-MH Battery Pack in Hybrid Electric Vehicles. Appl. Sci. 2020, 10, 1660. https://doi.org/10.3390/app10051660
AMA Style
Chu A, Yuan Y, Zhu J, Lu X, Zhou C. The Design and Investigation of a Cooling System for a High Power Ni-MH Battery Pack in Hybrid Electric Vehicles. Applied Sciences. 2020; 10(5):1660. https://doi.org/10.3390/app10051660
Chicago/Turabian StyleChu, Aihua, Yinnan Yuan, Jianxin Zhu, Xiao Lu, and Chenquan Zhou. 2020. "The Design and Investigation of a Cooling System for a High Power Ni-MH Battery Pack in Hybrid Electric Vehicles" Applied Sciences 10, no. 5: 1660. https://doi.org/10.3390/app10051660
Note that from the first issue of 2016, this journal uses article numbers instead of page numbers. See further details here.