Article

Hardware in the Loop Platform for Testing Photovoltaic System Control

by
Víctor Samano-Ortega
1,
Alfredo Padilla-Medina
2,
Micael Bravo-Sanchez
1,
Elías Rodriguez-Segura
2,
Alonso Jimenez-Garibay
3 and
Juan Martinez-Nolasco
3,*
1
Doctorado en Ciencias de la Ingeniería, Tecnológico Nacional de México/IT de Celaya, Celaya 38010, Mexico
2
Departamento de Ingeniería Electrónica, Tecnológico Nacional de México/IT de Celaya, Celaya 38010, Mexico
3
Departamento de Ingeniería Mecatrónica, Tecnológico Nacional de México/IT de Celaya, Celaya 38010, Mexico
*
Author to whom correspondence should be addressed.
Appl. Sci. 2020, 10(23), 8690; https://doi.org/10.3390/app10238690
Submission received: 5 November 2020 / Revised: 26 November 2020 / Accepted: 30 November 2020 / Published: 4 December 2020
(This article belongs to the Special Issue Simulation-Based Validation and Design of Smart Grids)

Abstract

:
The hardware in the loop (HIL) technique allows you to reproduce the behavior of a dynamic system or part of it in real time. This quality makes HIL a useful tool in the controller validation process and is widely used in multiple areas including photovoltaic systems (PVSs). This study presents the development of an HIL system to emulate the behavior of a PVS that includes a photovoltaic panel (PVP) and a DC-DC boost converter connected in series. The emulator was embedded into an NI-myRIO development board that operates with an integration time of 10 µs and reproduces the behavior of the real system with a mean percent error of 2.0478%, compared to simulation results. The implemented emulator is proposed as a platform for the validation of control systems. With it, the experimental stage is carried out on two controllers connected to the PVS without having the real system and allowing to emulate different operating conditions. The first controller is based on the Hill Climbing algorithm for the maximum power point tracking (MPPT), the second is a proportional integral (PI) controller for voltage control. Both controllers generate settling times of less than 3 s; the MPPT controller generates variations in the output in steady state inherent to the algorithm used. For both cases, the comparison of the experimental results with those obtained through software simulation show that the platform fulfills its usefulness when evaluating control systems.

1. Introduction

In recent years, the consequences of global warming have motivated the adoption of international policies to try to mitigate climate change [1]; consequently, it is necessary to move from current energy systems related to greenhouse gas emissions [2] to new systems based on renewable energies (REs) [3] denoted as clean generation sources, which are currently a priority theme in research. An alternative of this type of system frequently used is the use of solar energy through photovoltaic panels (PVPs) [4]. Research related to photovoltaic systems (PVSs) is basically focused on increasing the efficiency in handling the electrical energy generated; a technique used for this purpose is the application of control algorithms for maximum power point tracking (MPPT), which are responsible for taking advantage of the greatest amount of energy generated by the PVPs [5]. Some of the most used algorithms are: perturb and observe (P&O) [6,7], machine learning [8], improved pattern search method [9], genetic algorithms [10], fuzzy control [11,12,13], periodic power hunt [14] and stochastic algorithms [5].
The typical structure of a PVS consists of an arrangement of PVPs connected in cascade with a power electronic converter (PEC) in its topology such as DC-DC boost and a load variable; the algorithms for the MPPT are in charge of modifying the boost duty cycle so that the greatest amount of energy is extracted as possible, even in the presence of changes in environmental [7]. However, testing the performance of systems with this structure represents a high manufacturing cost, a large area is required for the disposal of PVPs, environmental conditions are discontinuous, and the system needs to be experimented with different PEC configurations [15]. An alternative to carry out experiments without the need for the physical PVS is the use of an emulator, this behaves as a non-linear source that reproduces the current-voltage characteristic curve of the PVP; in addition, it allows for control and reproduction of environmental conditions at any moment of the day and without depending on external phenomena; in this way, the design and experimentation of PVS is facilitated, making it possible to obtain results in less time and more efficient systems. However, the use of commercial emulators that can reproduce the behavior of PVP is an alternative with a very high economic cost; for this reason; in recent years, alternatives have been studied for the design of emulators that reduce the economic cost [15,16]. Among the designs studied are: emulation of the system with an industrial computer [9], the use of a linear controlled voltage regulator [17], a controlled PEC buck connected to a voltage source [18,19,20,21], the use of a programmable power source [22,23] or a current generator and a mosfet [24].
Another option for conducting experimentation under controllable, real and reproducible conditions using hardware is the hardware in the loop (HIL) real time simulation (RTS) [25] which has the advantages of predicting errors and failures in the control systems without the risk of damaging the real plant. Due to its advantages, this technique is considered an important stage before the experimentation stage in a system [26]. HIL technique consists of the implementation of the model of a system in embedded hardware that will represent the real system. The HIL simulations can be classified into two different sections, these depend on the type of embedded elements and the number of research infrastructures (RIs) used. When only one IR is used, the simulation is classified as monolithic simulation (MS), while if more than one IR is used and they are connected to each other via internet, the simulation is classified as geographically distributed simulations. Within these categories, three types of simulations are defined: RTS, power hardware in the loop (PHIL) and controller hardware in the loop (CHIL). If the power elements and their associated controllers are emulated, the simulation is classified as RTS. When only a portion of the power elements is emulated and the rest are made up of real elements, it is a PHIL simulation. Finally, if the power elements are emulated while their controller or part of it is embedded in an external device, it is a CHIL simulation [27]. In this study an MS CHIL is proposed. With a CHIL simulation it is possible to test real controllers, with algorithms and parameters similar to those used in the field, providing a wide range of operating conditions in the experimental stage without the risk of damaging real equipment [28].
Commercial hardware exists dedicated to the development of this technique, but its use may represent a disadvantage due to its high cost, as an alternative the development of this technique using low-cost hardware is being sought. Ref. [29,30] uses hardware from National Instruments (NI-cRIO 9082) to emulate the model of a tractor used in agriculture. Ref. [31] uses hardware from National Instruments (cRIO-9033) to emulate the transient electromagnetic behavior of electronic power devices. The platform was tested emulating a three-phase inverter and network. In this application, the model requires six FPGA cycles for its solution, which taking into account the frequency of its clock, translates into an integration time of 150 ns. Finally, [32] uses Texas Instruments hardware (EK-TM4CI294XL) to develop a platform for educational purposes, in which the user defines a plant and carries out experiments using HIL, this application presented end-to-end latency between 1.1 and 19.9 ms, for two case studies analyzed. These alternatives provide accurate emulation results, facilitate the rapid verification of different controllers, helping the user to define their own design and experimentation, methodology, as well as representing platforms that can be replicated by educators and researchers.
Other HIL applications are autonomous vehicles [33,34,35], motor control [36,37,38] and the traction system of a railway [39]. In addition, it is used in the design of PVSs. In [40], the development of a three-level coordinated control method for PV inverters is presented. This study is validated through a PHIL simulation using a real time digital simulator (RTDS) that includes a 7-bus distribution network. In the RTDS, the distribution network model was emulated at a time step of 50 µs. In [41], a distributed control for remote islanded microgrids (MGs) via cloud server was presented, in this research, a multiagent system was developed where the physical entity of islanded MGs was emulated at 50 μs time step on OPAL-RT. In [42], a platform of a PVS composed of a PVP, a DC-DC PEC and a P&O controller was implemented using an NI myRIO 1900 development board programmed in Matlab’s Simulink using NI Veristand—this platform works 1 ms integration time. Study [43] uses HIL based on the RT-Lab platform to emulate a virtual synchronous photovoltaic generator, the platform used in this research can reproduce a simulation step every 20 µs. Ref. [44] tests the operation of a cascade H-bridge inverter used for interconnection of the PVS with the AC main grid, in this platform an OP4510 simulator was implemented and it performed a simulation step every 10 µs. Ref. [45] uses a TM32F103 ARM microcontroller to design a test bench for the analysis of a photovoltaic energy storage system using batteries. Ref. [46] uses an arrangement with cRIO, FPGAs and a processor to simulate a MG that includes a PVS, achieving simulation steps of around 5 µs. Ref. [47] uses the HIL methodology to validate the management system in a MG where the PVS represents the only source of energy. In this research, an OP5700 simulator was used. This platform has a Xilinx Virtex 7 FPGA and generates steps simulation between 200 ns and 2 µs. The most important aspect in a HIL simulation is that the behavior of the embedded physical system is reproduced in real time. This characteristic proved satisfactory in the research presented given the integration time with which they operate. These studies demonstrate that it is possible to develop a HIL platform using generic software, resulting in integration times similar to those obtained with commercial platforms dedicated to HIL. The HIL platform presented in this investigation uses an integration time of 10 µs that is similar to those reported in [40,41,43,44,45,46,47] and less than the one reported in [42], allowing the system output to resemble a continuous curve calculating up to 99 values for each time constant of the system response. Furthermore, when comparing the proposed platform with [41,43,44,47], there is the advantage of being a more economic option when reproducing similar results.
This investigation proposes the design and implementation of a HIL platform based on National Instruments technology (myRIO 1900) in order to obtain a tool for the design and evaluation of control techniques applied in PVSs. The PVS contains a section that reproduces the current-voltage characteristic curve of a PVP with four input parameters (open-circuit voltage, voltage in the maximum power point, short-circuit current, and current in the maximum power point), an input voltage signal that represents the PVP current and an output signal that represents the PVP voltage. The HIL platform of the PVP has an option for modifying the four parameters that define the behavior of the PVP thus allowing to emulate PVPs of different powers in real time, with this it is possible to test controllers for different PVP configurations. In addition, the different IV curves can be used to emulate changes in atmospheric conditions that affect the behavior of the PVP. This characteristic offers a wide range of conditions in the experimental stage and represents an advantage compared to applications where the emulated IV curve is unique [45]. The platform also includes a DC-DC boost converter, with the load resistance as a parameter, an input voltage signal that represents the duty cycle of the power switch and an output signal that represents the voltage at the output of the PEC, both embedded and interconnected on an NI myRIO-1900 development board. The development board is programmed in its own environment with a high-level graphic language, which reduces the time spent on design and allows non-expert users to reproduce and reconfigure the proposed platform. In addition, two controllers are embedded: a controller for the MPPT and a voltage controller; both implemented independently in NI myRIO boards that communicate with the PVS through analog voltage signals, this configuration provides versatility to the photovoltaic system emulator (PVSE), which can be reconfigured without the need to carry out modifications in the systems of classic control and vice versa. The results show that the proposed platform can solve the PVS model with an integration period of 10 µs, achieving a mean relative error of 2.0478% and a mean absolute error of 1.0930 V at the DC bus voltage. Also, the platform was found to be useful in the process of evaluating controllers designed for PVSs, becoming a useful platform to carry out CHIL simulations.
This article is structured as follows: in Section 2, the PVS scheme and the equations that represent the models of the elements that compose it are presented; in Section 3, the implementation of the embedded system using LabVIEW virtual instrumentation software is shown, as well as the considerations for digitizing the system; in Section 4, tests performed on the PVSE and the controller emulator are presented and finally, in Section 5, the most relevant conclusions derived from the design and implementation of the proposed platform are presented.

2. Structure of the Photovoltaic System

The typical structure of a PVS has a PVP, a DC-DC boost converter and a load [7]. In Figure 1, the general scheme of the PVS is shown. The PEC is composed of an inductor L, a capacitor C, a fast recovery diode S and a power switch Q, r represents the inductor resistance and RL the load resistor, the variables inductor current iL and PEC output voltage Vout represent the state variables that model the behavior of the PEC. An NI myRIO-1900 development board was used to develop the PVSE. Devices such as field programmable gate arrays (FPGAs) and digital signal processing (DSP) are common in the development of RTDS [16], and this board, in particular, integrates both technologies in a single system (system on chip) [48]. In addition, the inherent parallel processing of the FPGA allows the rapid resolution of multiple equations simultaneously with integration intervals in the order of tens of microseconds. Another advantage of this system is that its programming can be carried out using a high-level graphic language, this results in the development of applications more easily and quickly compared to other techniques [29].
For the control of the PVSE, two control systems were embedded. Figure 2 shows the block diagram of the PVSE and the controller. The PVSE and the controller communicate with each other through analog voltage signals, this configuration has the advantage of allowing the controller to be reconfigured without the need to modify the PVSE and vice versa.

2.1. Photovoltaic Panel Emulator

For the design and implementation of the photovoltaic panel emulator (PVPE), the PVPs Keysight E4360A emulator was used as a reference. This device is widely used in research to substitute real PVPs presenting behaviors similar to real PVPs [49,50,51,52,53,54]. It operates in three different modes: the first, it generates fixed voltages and currents; in the second, the device generates voltage and current signals of various magnitudes from a reference table; in the third mode, the emulator reproduces the panel’s characteristic current-voltage curve, based on an exponential model defined by four parameters: open-circuit voltage Voc, voltage in the maximum power point Vmpp, short-circuit current Isc and current in the maximum power point Impp [55] and two variables Rs and N, which in turn depend on these four parameters. The third mode was used for the design and implementation of the PVPE, the Equation (1) defines the relationship between the panel voltage V and its current I.
V = V o c l n [ 2 ( I I s c ) N ] l n ( 2 ) R s ( I I s c ) 1 + R s I s c V o c
Equations (2)–(4) are used to calculate the model variables Rs and N based on the input parameters (Voc, Vmpp, Isc and Impp) and the variable a defined in Equation (3).
R s = V o c V m p p I m p p
a = V m p p ( 1 + R s I s c V o c ) + R s ( I m p p I s c ) V o c
N = l n ( 2 2 a ) l n ( I m p p I s c )

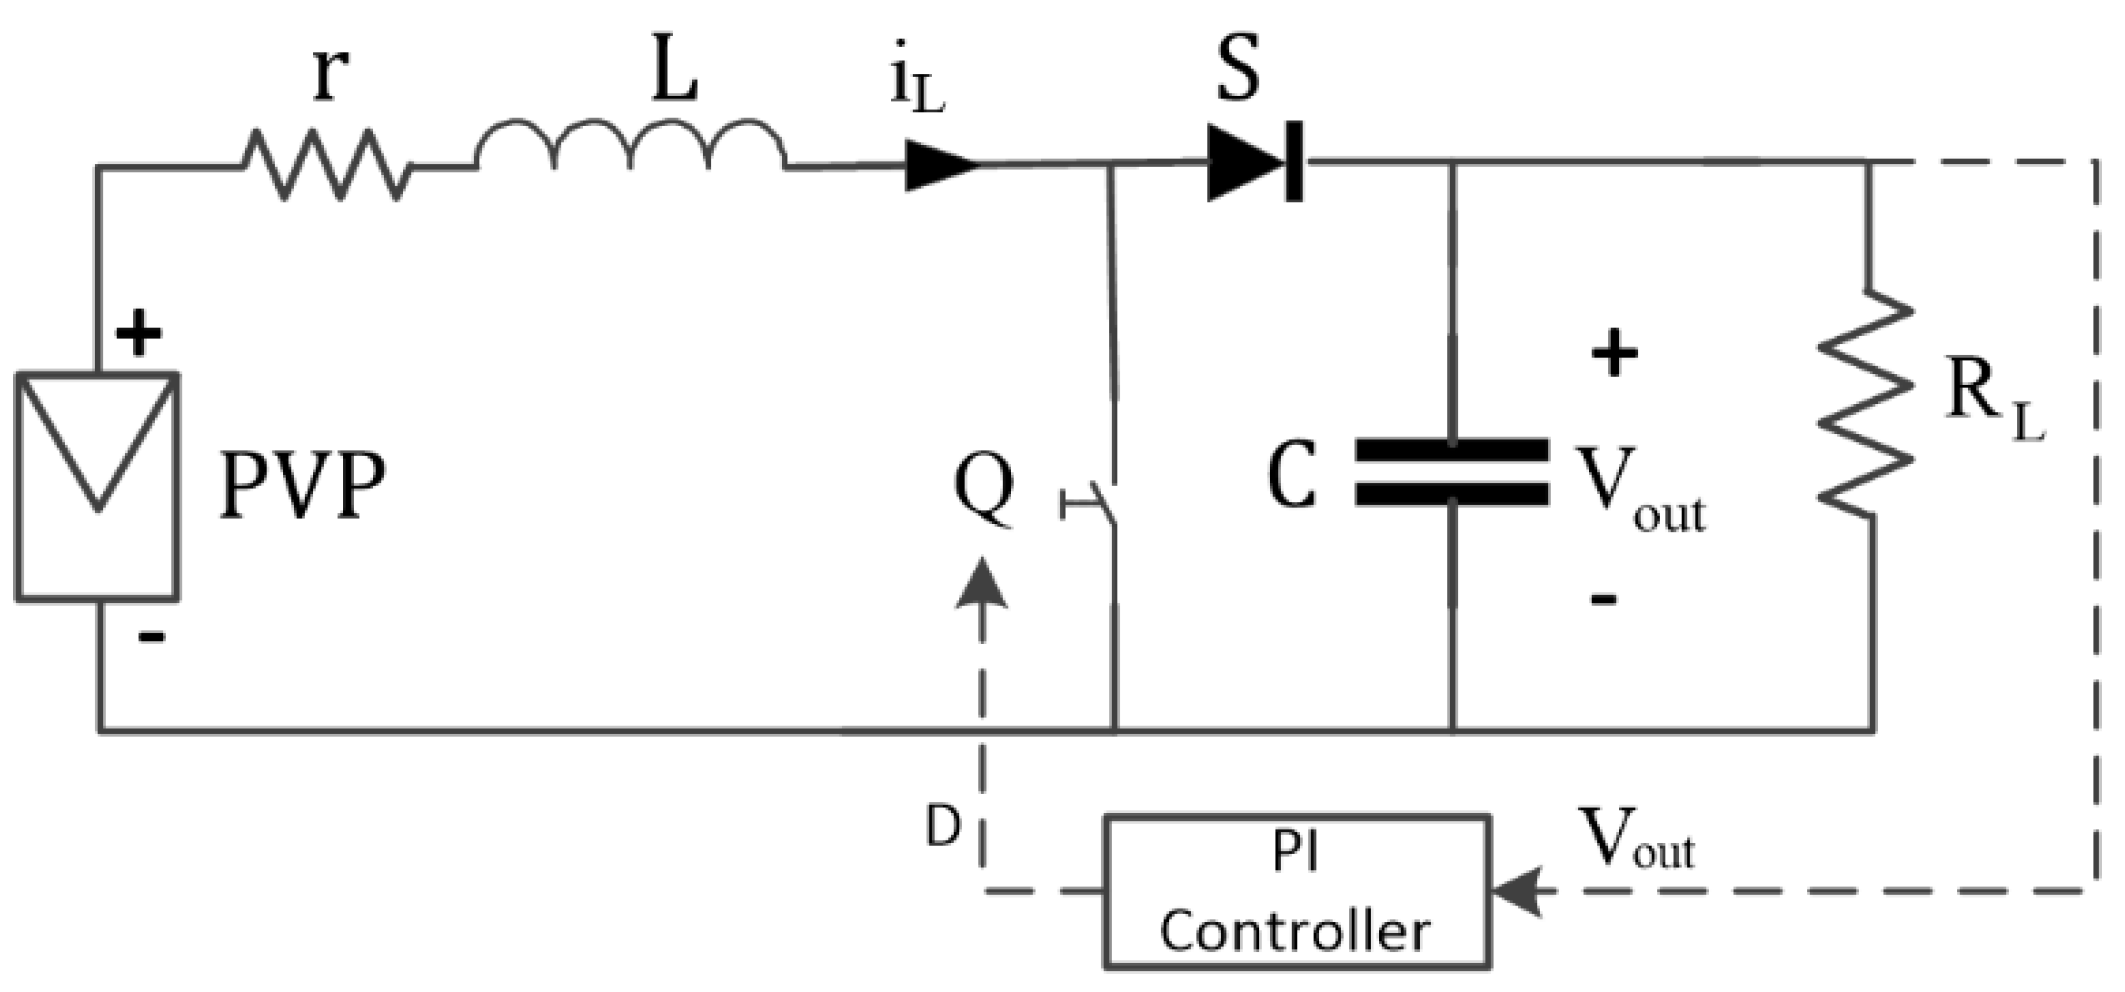
2.2. DC-DC Boost Power Electronic Converter

The DC-DC boost PEC transfers energy from the PVP to the load, its objective is to generate a voltage at the output Vout, greater than the voltage of the PVP Vin, which is related to the duty cycle D of the power switch Q. The converter diagram shown in Figure 3, comprises the input and output voltages (Vin and Vout), an inductor L, a resistor inductor r, a capacitor C, a fast recovery diode S, a power switch Q and a load resistor RL. The mathematical model of this converter [56] is presented in Equation (5).
[ d i L ( t ) d t d V o u t ( t ) d t ] = [ r L 1 D L 1 D C 1 R C ] [ i L ( t ) V o u t ( t ) ] + [ 1 L 0 ] V i n ( t )

2.3. Maximum Power Point Tracking Controller

In the MPPT mode of operation the PEC extracts maximum power from the PVP using the P&O algorithm illustrated in Figure 4. The controller modifies the D of the power switch and monitors the changes in the voltage and power of the PVP always seeking an increase in the power extracted from the PVP [57]. The controller for MPPT is based on the Hill Climbing algorithm: if the power delivered by the PVP [P(k)] increases with a variation in D, the controller verifies changes in the PVP voltage level [V(k)], if it decreases D increases, and if it increases D decreases. If, on the other hand, P(k) decreases, a decrease in V(k) represents a decrease in D and an increase causes an increase in D. In Figure 5 the diagram of the PVS with the controller for the MPPT is presented. A similar system is used in [42].

2.4. Voltage Controller

In voltage control (VC) mode, a classic proportional integral (PI) controller is in charge of maintaining the DC-DC PEC output voltage Vout at a user-defined level [58]. Figure 6 illustrates the PVS diagram with the PI controller, this controller monitors the converter output voltage level (Vout) performing control actions to eliminate the effects generated by system disturbances (connection and disconnection of loads to the output). The PI controller model that defines the control action u(t) in terms of the error e(t), is shown in Equation (6).
u ( t ) = k p e ( t ) + k i 0 t e ( τ ) d τ

3. Design and Implementation of Emulators in Hardware in the Loop

The most important aspect in the design of FPGA-based applications is performance, this is defined based on throughput, timing control, FPGA resource use and numerical precision; the factor with the greatest impact on performance is the number of bits used in representing a value, this is known as data-type width. In order to increase performance, use must be made of fixed-point data type, so that the word length and the number of bits destined to the fractional part are defined when the range and precision required to represent a value is known [59].

3.1. Photovoltaic Panel

For the design and implementation of the PVPE, an analysis was carried out on the operations and variables involved in the PVP model. For the analysis of the variables Voc, Vmpp, Isc and Impp, the technical characteristics of 43 commercial PVPs with powers between 100 and 440 W, offered by five different suppliers (Coradir, Jinko Solar, Solar Energy, Techno Sun and Topsun) were considered as a reference. The results obtained for these variables and the weights assigned to their data types are summarized in Table 1, in this table five characteristics are presented for each of the parameters: column two shows the maximum value observed in the data sheets of suppliers; column three shows the minimum value; column four shows the configuration of the fixed point data type selected for the numerical representation of the parameter, the plus sign means that it is an unsigned numerical representation, the number preceding the sign represents the word length of the data and the last number represents the number of bits used to represent the integer part; the column five shows the maximum value that can be represented with the selected data type; finally, column six shows the resolution of the parameter, which is a function of the selected data type. With the weight of the data type assigned to the input variables, it is possible to introduce values within the range observed in the analysis of the commercial PVPs. For example, for the variable Voc that operates in a range from 22.42 to 61.97 V, 6 bits were selected to represent the integer values, this allows for working in a range from 0 to 63 V. The number of bits destined for the fractional part is obtained from the difference between the word size and the bits used for the integer part, continuing with the example of the variable Voc, this difference is 3 bits, which allows dividing the integer into 8 values and having variations of 0.125 V. To obtain this resolution, minimization of the number of resources used in the FPGA was sought generating a model of PVPs that behaves similar to commercial PVPs. A reduction in the number of bits used for their representation has a significant impact on the consumption of resources in the FPGA. Voc, Vmpp, Isc and Impp were taken because all the operations included in the PVP model depend on them.
With the information obtained on the behavior of the variables Voc, Vmpp, Isc and Impp, of the 43 commercial PVPs, the operating ranges of the variables Rs, a and N (Equations (2)–(4)) were evaluated. Figure 7 shows the graphs of the values obtained for these variables considering all possible values. When analyzing these values, the following operating ranges are defined: the variable Rs works between 0.43 and 1.44, the variable a between the values 0.955 and 0.975, while the variable N operates between 28.85 and 56.58. In the three graphs, it was observed that the variables take similar values for each of the PVPs. This trend allows defining the weight of the data type assigned to each one. To define the number of bits used in the integer part, the largest value obtained in the calculations was taken as a reference. When comparing the decimal part of each set of values, variations of the order of 0.01 were observed. One byte was allocated to the fractional part of each variable, in this way the resolution is less than the observed variations. Table 2 shows the weights assigned to these variables.
The model used for the design of the embedded PVPE system described by Equations (1)–(4) contains operations of the type nx and ln(x), to implement these functions it was necessary to carry out the following considerations: the operation nx used the base change shown in Equation (7). Since the ex function only admits input values between −1 and 1, the following methodology was followed for the calculation of the exponential function greater than 1 or less than −1. If x > 1 and is denoted by int(x) to the integer part of x and by fra(x) to the fractional part, the exponential function is calculated as shown in Equation (8). In this way, the term eint(x) can be calculated in a for loop, successively multiplying the value of the number e by itself int(x)-times. While efra(x) can be calculated with the available function, this because of fra(x) < 1; this algorithm is shown in Figure 8.
n x = e ln ( n ) x
e x = e i n t ( x ) + f r a ( x ) = e i n t ( x ) e f r a ( x ) = ( 1 i n t ( x ) e ) e f r a ( x )
Subsequently, if x < −1 then −x > 1, and if the integer part of −x is denoted with int(−x) and with fra(−x) to the fractional part, the exponential function is calculated as shown by Equation (9). In this way, the term eint(-x) can be calculated in a for loop as in the previous case, while efra(−x) can be calculated with the available function because fra(−x) < 1. The algorithm used to describe this expression is shown in Figure 9.
e x = e ( x ) = 1 e x = 1 e i n t ( x ) + f r a ( x ) = 1 e i n t ( x ) e f r a ( x )
The available ln(x) function only admits values between 1 e and 1, in this case the scaling of the argument of the logarithm is proposed as shown in Equation (10). In this way, what is sought is that the product x*c is in a valid range for the function and since the constant is known, its logarithm will also be known. Figure 10 shows the code to calculate the logarithm of a variable x that takes values between the reciprocal of the square of e and the unit. With the proposed algorithms it is possible to calculate the functions nx and ln(x) using a high-level language, this allows the development of complex applications for non-expert users [29].
ln ( x ) = ln ( x c c ) = ln ( x c ) ln ( c )     ;         c = c t e

3.2. Boost Converter

For the calculation of the design parameters of the DC-DC boost PEC, a PVP of 430 W from the supplier Topsun Co., Ltd., Jeonnam, South Korea [60] was considered, taking as the operating point, the maximum power point, with this, the input voltage of the converter will be the maximum power voltage. In addition, a voltage ripple, vr, of 5%, a switching frequency, f, of 10 kHz and an inductor resistance, r of 0.09375 Ω were defined.
To calculate the load resistance RL, the Vout in steady state was considered, with a duty cycle D of 50% and with the iL equal to the Impp; this condition satisfies Equations (11) and (12).
( 1 D ) i L ( t ) 1 R V o u t ( t ) = 0
V o u t = V i n 1 D
On the other hand, for the calculation of the minimum values of L and C, Equations (13) and (14) were used. The design parameters obtained with this process are presented in Table 3.
L m i n = ( 1 D ) 2 ( D ) ( R L ) 2 f
C m i n = D ( R L ) ( f ) ( v r )
In Equation (15), the PEC model used for the design of the boost converter emulator (BCE) is presented. This model was proposed with a pair of integrals for the state variables iL(t) and Vout(t).
i L ( t ) = 1 L   [ r i L ( t ) ( 1 D ) V o u t ( t ) + V i n ( t ) ] d t V o u t ( t ) = 1 C   [ ( 1 D ) i L ( t ) 1 R L V o u t ( t ) ] d t
For the implementation of the integrals in the FPGA, the trapezoidal integration method was used, in this way, if the state variables are denoted with x, the integral can be calculated according to Equation (16). Figure 11 shows the algorithm used for the implementation of Equation (16) in the FPGA with a period of 10 µsec.
x ( t ) = T K T ( K + n ) d x ( t ) d t d t T 2 j = 1 n [ x ( T ( K + j 1 ) ) + x ( T ( K + j ) ) ]
Applying Equation (15) and the algorithm proposed for the integral, the code to obtain iL(t) was developed as shown in Figure 12. While the code to model the output voltage Vout(t) is illustrated in Figure 13.
To define the weight of the type of data at the output of each operation through the data flow in this virtual instrument (VI), a series of experiments were carried out in which the behavior of the open-loop system was observed. The number of bits allocated was gradually reduced until reaching a break-even point; wherein the numerical precision provides a suitable approximation without using more bits than is necessary for this purpose. The methodology used to define these weights is based on [59] p. 63.
To define the integration period, a similar procedure was carried out. Initially a period was assigned and an experiment was carried out, observing the behavior of the output of the open-loop system. Subsequently, the period was reduced and the weight of the selected data type was modified in the constant that represents this data (T/2 in Figure 11, Figure 12 and Figure 13). As the data type weights change, the time required to run a simulation step also changes. The process described is carried out interactively until the programmed period corresponds to the actual execution period. Another aspect that must be considered is that the algorithm for calculating the integrals depends on the voltage value calculated in the PVPE, so that the integration period must be greater than the time that the PVPE takes to execute a step. Taking these considerations into account, the period in loop containing the structures shown in Figure 12 and Figure 13 was 10 µs.

3.3. Photovoltaic System

For the design of the PVSE, the VIs from the PVPE and BCE models were integrated as subVIs (a subVI is similar to a subroutine in text-based programming languages) in a general VI. This interface has Voc, Vmpp, Isc, Impp and the resistance load RL of the converter as inputs. The PVPE subVI has the PVPE current as its input and the PVPE voltage as its output. The BCE’s subVI has duty cycle and voltage Vin(t) as inputs, and iL(t) and Vout(t) as outputs. For the connection between the PVPE and the BCE, the current in the inductor of the converter was used as the input to the PVPE, and the voltage of the PVPE was used as the input voltage in the converter. The PVSE VI has a voltage input that represents the duty cycle of the converter and three voltage outputs that represent the PVP voltage, the PVP current and the voltage at the converter output Vout(t). The algorithm used for the PVSE is illustrated in Figure 14.
The PVSE has as an input signal a DC value between 0 and 5 V that represents the duty cycle (0 to 100%), the emulator generates signals from 0 to 5 V that represent ranges from 0 to 65 V, from 0 to 16 A and 0 to 204 V for the voltage variables in the PVP, PVP current and converter output voltage, correspondingly.

3.4. P&O Controller

The algorithm used for the hardware implementation of the P&O controller is shown in Figure 4. This emulator has two controls, the time between perturbance (tp) and the magnitude of the variation (Mp) of the duty cycle (D). In addition, the control system emulator (CSE) has two voltage inputs for monitoring the voltage and current in the PVP, and a voltage output representing the duty cycle; the implementation of this controller is illustrated in Figure 15. The CSE input and output signals take values between 0 and 5 V representing ranges from 0 to 65 V, 0 to 16 A and 0 to 100% for the voltage variables PVP, PVP current and duty cycle, respectively.

3.5. PI Controller

The VI of the PI CSE has two controls for proportional (kp) and integral (ki) gains; in addition, another control for the set point. The comprehensive control action was implemented with the trapezoidal integration method using the same methodology described above for the BCE. The PI CSE has a voltage input to monitor the converter output voltage and a voltage output that represents the duty cycle; the implementation of this controller is illustrated in Figure 16. The input and output signals of the PI CSE take values between 0 and 5 V representing ranges from 0 to 204 V and 0 to 100% for the inverter output voltage variables and duty cycle, respectively.

3.6. Experimental Platform

The experimental platform for HIL systems has two development boards, one for the PVSE and the other for the CSEs. Figure 17 shows the interconnection of these subsystems. The boards communicate with each other using analog voltage signals and it is possible to select between each of the CSEs.

4. Results

The most important aspect that the HIL technique must satisfy is that the simulation is carried out in real time; furthermore, the emulator must have a numerical precision such that it is capable of reproducing the behavior of the emulated system without much margin for error. To evaluate the execution time of each integration cycle, the fidelity of the implemented PVSE and its usefulness in the control system validation process, the operation of each independent emulator was tested to later integrate all the subsystems. In addition, each of these experiments were compared to software simulations using Matlab’s Simulink. In the software simulation, Equations (1) and (15) were implemented to model the PVP and the DC-DC PEC, correspondingly. The integrals were solved using continuous integrators in Matlab’s Simulink. The solver of the block diagram was configured with a Dorman–Prince method with variable step.

4.1. Photovoltaic Panel Emulator

When working with the PVPE, the VI needs the configuration values of the Voc, Vmpp, Isc and Impp parameters; for the PVPE to operate at maximum power, these parameters were configured as Voc = 61.25 V, Vmpp = 49.25 V, Isc = 9.25 A and Impp = 8.75 A. This configuration was used for all the experiments presented below. Figure 18 and Figure 19 show the I-V and P-V characteristic curves of the PVPE in green, while the behavior of PVP in simulation is shown in blue. This subsystem is resolved in cycles with periods of 4 µs maximum. The loop that this VI resolves to is not timed. The PVP model expresses a static relationship between the input current and the output voltage. Without timing the loop, the PVPE subsystem works as a producer that calculates the input voltage for the loop in which the PEC model is resolved. The duration of the period is the result of the execution time of the internal operations (Figure 8, Figure 9 and Figure 10).

4.2. Boost Converter Emulator

To validate the behavior of the BCE, an open loop test was carried out, changing the duty cycle from 0 to 50% with a constant input voltage of 49.25 V, which corresponds to the maximum power voltage of the emulated PVP and a load resistance 25 Ω (this value was obtained in the converter design phase and was kept constant in the rest of the experiments presented in this section). Figure 20 shows the current behavior of the inductor iL (signal in green color) of the BCE; furthermore, the same signal is illustrated using simulation (blue line). On the other hand, Figure 21 shows the behavior of the BCE output voltage signal Vout (green line) and the signal obtained in simulation (blue line).

4.3. Open Loop Photovoltaic System Emulator

Once the PVSE shown in the Figure was integrated, its behavior in open loop was tested with a step input of 50% in the duty cycle. Figure 22 shows the behavior of the voltage supplied to the load connected to the BCE output.
This response is essentially the response of the PVSE, so at this point the error obtained was calculated when comparing the results of the software simulation with the hardware simulation. Figure 23 shows the results obtained for the PVSE output absolute error.
To calculate the absolute error, 1001 samples were taken every 10 µs during the entire interval of the system response, presented in Figure 22. On the other hand, Figure 24 shows the relative error calculated for these same samples, expressed as a percentage. In Table 4, a summary of the results obtained for both errors is presented.

4.4. Maximum Power Point Tracking Controller Emulator

The control algorithm for the MPPT has two important parameters, the perturbance time and the variation in the duty cycle that generates said perturbance. In the experiment, values of 50 ms and 1% were defined for these parameters. Figure 25 shows the response of the power generated by the PVPE, the behavior of the PVPE is shown in green and the behavior obtained by simulation in blue, the power of the PVPE reaches its maximum value in 2.15 s and presents variations of approximately 1.17%, regarding the maximum when it is in a steady state, these variations are a characteristic of the algorithm for the MPPT used. On the other hand, Figure 26 shows the voltage response in the load Vout(t), the PVSE response is shown in green and the simulated behavior in blue; this variable reaches its maximum value in 2.15 s and presents variations of approximately 0.62% in a steady stable. Finally, Figure 27 and Figure 28 show the current and voltage responses of the PVPE, these variables reach the steady state in 2.2 and 2.1 s, and present variations of approximately 3.45 and 4.26% regarding the maximum value.

4.5. PI Classic Controller Emulator

For the PI CSE experiment, a sampling period of 10 ms was set up (configured), a proportional gain of 0.006, an integral gain of 0.03 and a set point of 98.5 V. A small value selected in the proportional gain reduces the variations at the output while a moderate value in the integral gain results in a settling time similar to that observed with the P&O controller, allowing a comparison between these two responses, the one obtained with the P&O controller and the one obtained with the PI controller. Finally, the given value at the set point is equal to twice the maximum power voltage of the emulated PVP, this allows comparing the controlled response with that obtained in open loop with a duty cycle of 50% since they reach similar steady state values. Figure 29 shows the voltage response in the load Vout(t) using the PI CSE, the response of the PVSE is illustrated in green and the response obtained with simulation in blue. Considering a criterion of 2% of the final value, the converter voltage has a settling time of 1.36 s and does not present significant variations in steady state.
Figure 30 shows the response of the power delivered by the PVPE with the PVSE operating with the PI CSE. The PVSE response is illustrated in green while the response obtained by simulation is shown in blue. Considering the criterion of 2% of the final value, this variable has a settling time of 1.68 s with insignificant variations in steady state, however, the value that this variable takes is not controlled. This algorithm has the purpose of establishing a voltage value at the output of the BCE and there is no control over the power extracted from the PVPE, this aspect has disadvantages because by not having control over the power if the load demands more power than the PVPE can supply, the duty cycle at the BCE’s output will increase uncontrollably, leading the BCE to operate at a point very far from the one it was designed for, therefore causing instability in the system. Finally, in Figure 31 and Figure 32 the responses of the PVPE current and voltage are presented. These variables present settling times of 1.79 and 1.03 s, respectively.

5. Discussion and Conclusions

The HIL system developed in this study simulates the PVS with integration times of 10 µs, this timing, although turning out to be longer compared to the studies developed in commercial platforms, is similar to the results obtained in research reported in the literature; [32] obtains simulation periods between 1.1 and 19.9 ms, [43] reports periods of 20 µs, the platform developed by [46] presents periods of 5 µs, in the study by [44] results for this 10 µs variable are reported, [47] reports periods between 200 ns and 2 µs, in [42] a period of 1 ms is used and finally [40,41] report periods of 50 µs. On the other hand, if the response of the PVSE presented in Figure 22 is analyzed as a first order system, it would have a time constant of approximately 990 microseconds, which means that with the integration time of the PVS around 99 values are calculated for the output for each time constant, allowing to emulate a continuous signal. The proposed investigation was developed using generic software, obtaining integration times similar to dedicated platforms, but at a lower cost.
The HIL platform of the PVPE allows the generation of different I-V curves for PVPs by manipulating the values of the desired power in real time, giving the user the option to check the behavior of the controllers reproducing diverse climatic changes, offering advantages in the experimental stage compared to real systems, in which the climatic conditions cannot be manipulated, or in proposals where the I-V curve emulated by the platform is unique [45]. The proposed HIL platform is programmed in an environment with high-level graphic language that allows researchers and educators to reproduce and reconfigure the proposed emulator in a faster and easier way compared to methodologies that propose the use of multiple software, for example [42] that proposes the use of VHDL as a programming language.
Concerning the accuracy of the system, when comparing the results obtained with the software simulation, the emulator presented a mean absolute error of 1.0930 V and a mean percent error of −2.0478%. These values tend to be large in the samples taken at the start of the converter output voltage response. The period in which the error obtained is greater corresponds to the time in which the output takes small values, close to zero at the beginning of this period, so that, although the error is significant for that section of the response, this does not imply a higher variation. Taking this into account, the result obtained when reproducing the behavior of the PVS is satisfactory.
The system, in conjunction with the PI controller presents a settling time of 1.36 s without variations in the steady state in its response. The P&O controller on the other hand generates a settling time of 2.15 s with variations of approximately 0.62% in steady state, these variations are inherent in the algorithm used and the parameters with which the controller was configured. When comparing the results obtained through software simulation with those obtained from the implementation of the controllers, it is concluded that the PVSE is useful as a tool in the process of evaluation and validation of control systems.
With the platform at the level of development that is presented in this study, its correct operation depends largely on the balance between the power of the PVP and that of the load being kept constant, being the power demanded by the load at all times less than the PVP. To counteract this disadvantage, as a future investigation, a battery bank and interconnection with the AC main grid will be integrated into the system, both elements emulated in HIL, in addition to an embedded global energy management system for the control of the complete system. Furthermore, for future investigation, comparison of the HIL models presented with their corresponding experimental prototypes is being contemplated.

Author Contributions

Investigation, A.P.-M. and E.R.-S.; methodology, V.S.-O. and M.B.-S.; project administration, J.M.-N.; validation, A.J.-G. All authors have read and agreed to the published version of the manuscript.

Funding

This research received no external funding.

Conflicts of Interest

The authors declare no conflict of interest.

References

  1. UNFCCC. Adoption of the Paris Agreement, Conference of the Parties, Twenty-First Session FCCC/CP/2015/L.9; United Nations Framework Convention on Climate Change: Paris, France, 2015. [Google Scholar]
  2. IPCC. Global Warming of 1.5 °C. In Special Report of the Intergovernmental Panel on Climate Change; IPCC: Bangkok, Thailand, 2016. [Google Scholar]
  3. International Renewable Energy Agency. Global Energy Transformation: A Roadmap to 2050; International Renewable Energy Agency: Abu Dhabi, UAE, 2018; Available online: www.irena.org/publications (accessed on 19 September 2020).
  4. Kang, J.-N.; Wei, Y.; Liu, L.-C.; Han, R.; Yu, B.; Wang, J.-W. Energy systems for climate change mitigation: A systematic review. Appl. Energy 2020, 263, 114602. [Google Scholar] [CrossRef]
  5. Pilakkat, D.; Kanthalakshmi, S. An improved P&O algorithm integrated with artificial bee colony for photovoltaic systems under partial shading conditions. Sol. Energy 2019, 178, 37–47. [Google Scholar] [CrossRef]
  6. Loukriz, A.; Messalti, S.; Harrag, A. Design, simulation, and hardware implementation of novel optimum operating point tracker of PV system using adaptive step size. Int. J. Adv. Manuf. Technol. 2018, 101, 1671–1680. [Google Scholar] [CrossRef]
  7. Ram, J.P.; Pillai, D.S.; Ghias, A.M.; Rajasekar, N. Performance enhancement of solar PV systems applying P&O assisted Flower Pollination Algorithm (FPA). Sol. Energy 2020, 199, 214–229. [Google Scholar] [CrossRef]
  8. Takruri, M.; Farhat, M.; Barambones, O.; Ramos-Hernanz, J.A.; Turkieh, M.J.; Badawi, M.; Alzoubi, H.; Sakur, M.A. Maximum Power Point Tracking of PV System Based on Machine Learning. Energies 2020, 13, 692. [Google Scholar] [CrossRef] [Green Version]
  9. Tobón, A.; Peláez-Restrepo, J.; Montano, J.; Florez, M.D.; Herrera, J.; Ibeas, A. MPPT of a Photovoltaic Panels Array with Partial Shading Using the IPSM with Implementation Both in Simulation as in Hardware. Energies 2020, 13, 815. [Google Scholar] [CrossRef] [Green Version]
  10. Hadji, S.; Gaubert, J.-P.; Krim, F. Real-Time Genetic Algorithms-Based MPPT: Study and Comparison (Theoretical an Experimental) with Conventional Methods. Energies 2018, 11, 459. [Google Scholar] [CrossRef] [Green Version]
  11. Macaulay, J.; Zhou, Z. A Fuzzy Logical-Based Variable Step Size P&O MPPT Algorithm for Photovoltaic System. Energies 2018, 11, 1340. [Google Scholar] [CrossRef] [Green Version]
  12. Loukil, K.; Abbes, H.; Abid, H.; Abid, M.; Toumi, A. Design and implementation of reconfigurable MPPT fuzzy controller for photovoltaic systems. Ain Shams Eng. J. 2020, 11, 319–328. [Google Scholar] [CrossRef]
  13. Farajdadian, S.; Hosseini, S.M.H. Optimization of fuzzy-based MPPT controller via metaheuristic techniques for stand-alone PV systems. Int. J. Hydrogen Energy 2019, 44, 25457–25472. [Google Scholar] [CrossRef]
  14. Senthilvel, A.; Vijeyakumar, K.; Vinothkumar, B. FPGA based implementation of MPPT algorithms for photovoltaic system under partial shading conditions. Microprocess. Microsyst. 2020, 77, 103011. [Google Scholar] [CrossRef]
  15. Ram, J.P.; Manghani, H.; Pillai, D.S.; Babu, T.S.; Miyatake, M.; Rajasekar, N. Analysis on solar PV emulators: A review. Renew. Sustain. Energy Rev. 2018, 81, 149–160. [Google Scholar] [CrossRef]
  16. Ayop, R.; Tan, C.W. A comprehensive review on photovoltaic emulator. Renew. Sustain. Energy Rev. 2017, 80, 430–452. [Google Scholar] [CrossRef]
  17. Moussa, I.; Khedher, A.; Bouallegue, A. Design of a Low-Cost PV Emulator Applied for PVECS. Electronics 2019, 8, 232. [Google Scholar] [CrossRef] [Green Version]
  18. Ullah, N.; Nisar, F.; Al-Ahmadi, A.A. Closed Loop Control of Photo Voltaic Emulator Using Fractional Calculus. IEEE Access 2020, 8, 28880–28887. [Google Scholar] [CrossRef]
  19. Joshi, D.; Sharma, S. PV Emulator Modeling and Design Using Buck Converter. In En Applications of Computing, Automation and Wireless Systems in Electrical Engineering; Springer: Singapore, 2019; pp. 639–648. [Google Scholar] [CrossRef]
  20. Moussa, I.; Khedher, A. Photovoltaic emulator based on PV simulator RT implementation using XSG tools for an FPGA control: Theory and experimentation. Int. Trans. Electr. Energy Syst. 2019, 29, e12024. [Google Scholar] [CrossRef]
  21. Ayop, R.; Tan, C.W. A novel photovoltaic emulator based on current-resistor model using binary search computation. Sol. Energy 2018, 160, 186–199. [Google Scholar] [CrossRef]
  22. Ulaganathan, M.; Devaraj, D. Programmable DC Power Supply based Solar PV Module Emulator using LabVIEW and Multisim. Int. J. Renew. Energy Res. (IJRER) 2019, 9, 1892–1900. [Google Scholar]
  23. Ulaganathan, M.; Devaraj, D. Hardware and Software Co-emulation Technique based Solar Photovoltaic Sources Emulator. In Proceedings of the 2019 IEEE International Conference on Intelligent Techniques in Control, Optimization and Signal Processing (INCOS), Tamilnadu, India, 11–13 April 2019; pp. 1–6. [Google Scholar] [CrossRef]
  24. Merenda, M.; Iero, D.; Carotenuto, R.; Della Corte, F.G. Simple and Low-Cost Photovoltaic Module Emulator. Electronics 2019, 8, 1445. [Google Scholar] [CrossRef] [Green Version]
  25. Ebe, F.; Idlbi, B.; Stakic, D.; Chen, S.; Kondzialka, C.; Casel, M.; Heilscher, G.; Seitl, C.; Bründlinger, R.; Strasser, T.I. Comparison of Power Hardware-in-the-Loop Approaches for the Testing of Smart Grid Controls. Energies 2018, 11, 3381. [Google Scholar] [CrossRef] [Green Version]
  26. De Farias, A.B.C.; Rodrigues, R.S.; Murilo, A.; Lopes, R.V.; Avila, S. Low-Cost Hardware-in-the-Loop Platform for Embedded Control Strategies Simulation. IEEE Access 2019, 7, 111499–111512. [Google Scholar] [CrossRef]
  27. Syed, M.H.; Guillo-Sansano, E.; Wang, Y.; Vogel, S.; Palensky, P.; Burt, G.M.; Xu, Y.; Monti, A.; Hovsapian, R. Real-Time Coupling of Geographically Distributed Research Infrastructures: Taxonomy, Overview and Real-World Smart Grid Applications. IEEE Trans. Smart Grid 2020, 1. [Google Scholar] [CrossRef]
  28. Salcedo, R.; Corbett, E.; Smith, C.; Limpaecher, E.; Rekha, R.; Nowocin, J.; Lauss, G.; Fonkwe, E.; Almeida, M.; Gartner, P.; et al. Banshee distribution network benchmark and prototyping platform for hardware-in-the-loop integration of microgrid and device controllers. J. Eng. 2019, 2019, 5365–5373. [Google Scholar] [CrossRef]
  29. Estrada, L.; Vázquez, N.; Vaquero, J.; De Castro, A.; Arau, J. Real-Time Hardware in the Loop Simulation Methodology for Power Converters Using LabVIEW FPGA. Energies 2020, 13, 373. [Google Scholar] [CrossRef] [Green Version]
  30. Raikwar, S.; Wani, L.J.; Kumar, S.A.; Rao, M.S. Hardware-in-the-Loop test automation of embedded systems for agricultural tractors. Measurement 2019, 133, 271–280. [Google Scholar] [CrossRef]
  31. Razzaghi, R.; Mitjans, M.; Rachidi, F.; Paolone, M. An automated FPGA real-time simulator for power electronics and power systems electromagnetic transient applications. Electr. Power Syst. Res. 2016, 141, 147–156. [Google Scholar] [CrossRef]
  32. Renaux, P.B.; Linhares, R.R.; Renaux, D.P.B. Douglas Paulo Bertrand. Hardware-in-the-Loop Simulation Low-Cost Platform. In Proceedings of the 2017 VII Brazilian Symposium on Computing Systems Engineering (SBESC), Curitiba, Brazil, 6–10 November 2017; pp. 173–180. [Google Scholar] [CrossRef]
  33. Shao, Y.; Zulkefli, M.A.M.; Sun, Z.; Huang, P. Evaluating connected and autonomous vehicles using a hardware-in-the-loop testbed and a living lab. Transp. Res. Part C Emerg. Technol. 2019, 102, 121–135. [Google Scholar] [CrossRef]
  34. Dang, D.; Gao, F.; Hu, Q. Motion Planning for Autonomous Vehicles Considering Longitudinal and Lateral Dynamics Coupling. Appl. Sci. 2020, 10, 3180. [Google Scholar] [CrossRef]
  35. Zhao, K.; Wang, C.; Xiao, G.; Li, H.; Ye, J.; Liu, Y. Research for Nonlinear Model Predictive Controls to Laterally Control Unmanned Vehicle Trajectory Tracking. Appl. Sci. 2020, 10, 6034. [Google Scholar] [CrossRef]
  36. Amin, M.M.; Aziz, G.A.A. A Hardware-in-the-Loop Realization of a Robust Discrete-Time Current Control of PMa-SynRM for Aerospace Vehicle Applications. IEEE J. Emerg. Sel. Top. Power Electron. 2019, 7, 936–945. [Google Scholar] [CrossRef]
  37. Zhang, Y.; Huang, P.; Yang, H. Hardware-in-the-Loop Real-time Simulation for Speed-Sensorless Vector Control of High-Power Induction Motor. In Proceedings of the 2019 22nd International Conference on Electrical Machines and Systems (ICEMS), Harbin, China, 11–14 August 2019; pp. 1–5. [Google Scholar] [CrossRef]
  38. Hsieh, M.-F.; Weng, Y.-C. A Low Torque Ripple Direct Torque Control Method for Interior Permanent Magnet Motor. Appl. Sci. 2020, 10, 1723. [Google Scholar] [CrossRef] [Green Version]
  39. Garramiola, F.; Poza, J.; Del Olmo, J.; Nieva, T. Hardware-in-the-loop performance analysis of a railway traction system under sensor faults. J. Eng. 2019, 2019, 3797–3801. [Google Scholar] [CrossRef]
  40. Wang, Y.; Syed, M.H.; Guillo-Sansano, E.; Xu, Y.; Burt, G.M. Inverter-Based Voltage Control of Distribution Networks: A Three-Level Coordinated Method and Power Hardware-in-the-Loop Validation. IEEE Trans. Sustain. Energy 2019, 11, 2380–2391. [Google Scholar] [CrossRef] [Green Version]
  41. Wang, Y.; Nguyen, T.L.; Syed, M.H.; Xu, Y.; Guillo-Sansano, E.; Nguyen, V.-H.; Burt, G.M.; Tran, Q.-T.; Caire, R. A Distributed Control Scheme of Microgrids in Energy Internet Paradigm and Its Multisite Implementation. IEEE Trans. Ind. Inform. 2020, 17, 1141–1153. [Google Scholar] [CrossRef] [Green Version]
  42. Palahalli, H.; Huo, Y.; Gruosso, G. Real Time Simulation of Photovoltaic System Using Fpga. In Proceedings of the 2018 International Symposium on Power Electronics, Electrical Drives, Automation and Motion (SPEEDAM), Amalfi, Italy, 20–22 June 2018; pp. 865–870. [Google Scholar] [CrossRef]
  43. Zhang, X.; Dong, W.; Gan, J.; Yao, G. Hardware in Loop Simulation Test of Photovoltaic Virtual Synchronous Generator. In Proceedings of the 2018 2nd IEEE Conference on Energy Internet and Energy System Integration (EI2), Beijing, China, 20–22 October 2018; pp. 1–4. [Google Scholar] [CrossRef]
  44. Iman-Eini, H.; Tennakoon, S.B. Investigation of a cascaded H-bridge photovoltaic inverter under non-uniform insolation conditions by hardware-in-the-loop test. Int. J. Electr. Power Energy Syst. 2019, 105, 330–340. [Google Scholar] [CrossRef]
  45. Doosthosseini, M.; Mishra, P.P.; Fathy, H.K. Hardware-in-the-Loop Testbed Development for Validating Novel Photovoltaic Battery Energy Storage System Concepts. In Proceedings of the 2019 American Control Conference (ACC), Philadelphia, PA, USA, 10–12 July 2019; pp. 1587–1592. [Google Scholar] [CrossRef]
  46. Palahalli, H.; Ragaini, E.; Gruosso, G. Smart Grid Simulation Including Communication Network: A Hardware in the Loop Approach. IEEE Access 2019, 7, 90171–90179. [Google Scholar] [CrossRef]
  47. Kumar, G.V.B.; Kaliannan, P.; Padmanaban, S.; Holm-Nielsen, J.B.; Blaabjerg, F. Effective Management System for Solar PV Using Real-Time Data with Hybrid Energy Storage System. Appl. Sci. 2020, 10, 1108. [Google Scholar] [CrossRef] [Green Version]
  48. User Guide and Specifications NI myRIO-1900. Available online: https://www.ni.com/pdf/manuals/376047c.pdf (accessed on 19 November 2020).
  49. Pan, Y.; Yang, Y.; Blaabjerg, F. Distributed Control of Islanded Series PV-Battery-Hybrid Systems with Low Communication Burden. In Proceedings of the 2020 IEEE 11th International Symposium on Power Electronics for Distributed Generation Systems (PEDG), Dubrovnik, Croatia, 28 September–1 October 2020; pp. 315–321. [Google Scholar] [CrossRef]
  50. Kanathipan, K.; Emamalipour, R.; Lam, J. A Single-Switch High-Gain PV Microconverter with Low-Switch-Voltage-to-High-Voltage-Bus Ratio. IEEE Trans. Power Electron. 2020, 35, 9530–9540. [Google Scholar] [CrossRef]
  51. Pan, Y.; Sangwongwanich, A.; Yang, Y.; Blaabjerg, F. A Series Interharmonic Filter for Cascaded H-bridge PV Inverters. In Proceedings of the 2020 IEEE Energy Conversion Congress and Exposition (ECCE), Detroit, MI, USA, 11–15 October 2020; pp. 341–346. [Google Scholar] [CrossRef]
  52. Upadhyay, P.; Pulipaka, S.; Sharma, M.; Kumar, R. A proposed maximum power point operating strategy for photovoltaic applications using monthly irradiance estimates. Sol. Energy 2017, 141, 266–277. [Google Scholar] [CrossRef]
  53. Lin, Z.; Xie, W.; Dong, M.; Lan, J. Research of S 3 MPR Engineering Application on Space Power Sources. In Proceedings of the 2020 IEEE 4th Information Technology, Networking, Electronic and Automation Control Conference (ITNEC), Chongqing, China, 12–14 June 2020; pp. 817–823. [Google Scholar] [CrossRef]
  54. Fernandes, D.; Almeida, R.; Guedes, T.; Filho, A.S.; Costa, F. State feedback control for DC-photovoltaic systems. Electr. Power Syst. Res. 2017, 143, 794–801. [Google Scholar] [CrossRef]
  55. Keysight Technologies, Inc. Keysight Technologies Series E4360 Modular Solar Array Simulator. 2018. Available online: http://literature.cdn.keysight.com/litweb/pdf/E4360-90001.pdf (accessed on 19 October 2020).
  56. Shen, Y.; Qin, Z.; Wang, H. Modeling and Control of DC-DC Converters. In En Control of Power Electronic Converters and Systems; Academic Press: Cambridge, MA, USA, 2018; pp. 69–92. [Google Scholar] [CrossRef]
  57. Bahari, M.I.; Tarassodi, P.; Naeini, Y.M.; Khalilabad, A.K.; Shirazi, P. Modeling and simulation of hill climbing MPPT algorithm for photovoltaic application. In Proceedings of the 2016 International Symposium on Power Electronics, Electrical Drives, Automation and Motion (SPEEDAM), Anacapri, Italy, 22–24 June 2016; pp. 1041–1044. [Google Scholar] [CrossRef]
  58. Bhattacharyya, S.; Samanta, S. DC Link Voltage Control based Power Management Scheme for Standalone PV Systems. In Proceedings of the 2018 IEEE International Conference on Power Electronics, Drives and Energy Systems (PEDES), Chennai, India, 18–21 December 2018; pp. 1–5. [Google Scholar] [CrossRef]
  59. NI LabVIEW High-Performance FPGA Developer’s Guide. Available online: https://www.ni.com/es-mx/support/documentation/supplemental/13/the-ni-labview-high-performance-fpga-developer-s-guide.html (accessed on 25 April 2020).
  60. ENF Solar. Directorio de Productos, Mono 415–450W Topsun Co., Ltd. Available online: https://es.enfsolar.com/pv/panel-datasheet/crystalline/10499 (accessed on 15 May 2020).
Figure 1. Schematic diagram of the photovoltaic systems (PVS).
Applsci 10 08690 g001
Figure 2. Block diagram of the photovoltaic system emulator (PVSE) and the controller.
Applsci 10 08690 g002
Figure 3. DC-DC boost power electronic convertor (PEC) diagram.
Applsci 10 08690 g003
Figure 4. Perturb and Observe (P&O) control algorithm.
Applsci 10 08690 g004
Figure 5. Diagram of the PVS with the maximum power point tracking (MPPT) controller.
Applsci 10 08690 g005
Figure 6. DC-DC PEC with a proportional integral (PI) controller.
Applsci 10 08690 g006
Figure 7. Behavior of the values Rs, a and N.
Applsci 10 08690 g007
Figure 8. Algorithm to calculate power of e less than −1.
Applsci 10 08690 g008
Figure 9. Algorithm to calculate powers of e less than −1.
Applsci 10 08690 g009
Figure 10. Algorithm used to calculate the natural logarithm.
Applsci 10 08690 g010
Figure 11. Algorithm for calculating the integral.
Applsci 10 08690 g011
Figure 12. Code for the calculation of iL(k).
Applsci 10 08690 g012
Figure 13. Code for the calculation of Vout(k).
Applsci 10 08690 g013
Figure 14. PVSE implementation.
Applsci 10 08690 g014
Figure 15. Implementation of the P&O control system emulator (CSE).
Applsci 10 08690 g015
Figure 16. PI CSE implementation.
Applsci 10 08690 g016
Figure 17. Connection between development boards.
Applsci 10 08690 g017
Figure 18. I-V curve of the photovoltaic panel emulator (PVPE).
Applsci 10 08690 g018
Figure 19. P-V curve of the PVPE.
Applsci 10 08690 g019
Figure 20. Current response from the boost convertor emulator (BCE).
Applsci 10 08690 g020
Figure 21. BCE voltage response.
Applsci 10 08690 g021
Figure 22. Voltage at the BCE output in open loop in the PVSE.
Applsci 10 08690 g022
Figure 23. PVSE output absolute error.
Applsci 10 08690 g023
Figure 24. PVSE output percentage error.
Applsci 10 08690 g024
Figure 25. Response of the PVPE power with the MPPT controller emulator.
Applsci 10 08690 g025
Figure 26. Voltage response of the converter with the MPPT controller emulator.
Applsci 10 08690 g026
Figure 27. PVPE current response with the MPPT controller emulator.
Applsci 10 08690 g027
Figure 28. PVPE voltage response with the MPPT controller emulator.
Applsci 10 08690 g028
Figure 29. PVPE voltage response with PI CSE.
Applsci 10 08690 g029
Figure 30. PVPE power response with PI CSE.
Applsci 10 08690 g030
Figure 31. PVPE current response with PI CSE.
Applsci 10 08690 g031
Figure 32. PVPE voltage response with the PI CSE.
Applsci 10 08690 g032
Table 1. Data obtained from the analysis of the photovoltaic panels (PVPs) for the model parameters.
ParameterMaximum ObservedMinimum ObservedType of Data SelectedMaximum According to the Type of Data SelectedResolution According to the Data
Voc61.97 V22.42 V+9,663.875 V0.125 V
Vmpp49.67 V17.69 V+9,663.875 V0.125 V
Isc9.35 A0.29 A+7,415.875 A0.125 A
Impp8.86 A0.27 A+7,415.875 A0.125 A
Table 2. Weights assigned to the variables Rs, a and N.
VariableData Type SelectedMaximum According to the Type of DataResolution
According to the Type of Data
Rs+10,23.9960940.00390625
a+8,00.9960940.00390625
N+15,763.9960940.00390625
Table 3. Parameters obtained from the converter design.
VariableData Type Selected
Vin49.25 V
Vout98.5 V
RL25 Ω
f10 kHz
vr5%
r0.09375 Ω
C45.8 µF
L400.5 µH
Table 4. Summary of the errors obtained.
Absolute Error (V)Percent Error (%)
Maximum Value4.6043100
Minimum Value00
Mean Value1.09302.0478
Publisher’s Note: MDPI stays neutral with regard to jurisdictional claims in published maps and institutional affiliations.

