Long-Term Effects of Mercury on Biofilms Grown in Contaminated Microcosms: A Pilot Study


Faculty of Sciences, Section of Earth and Environmental Sciences, Department F.-A. Forel for Environmental and Aquatic Sciences, Environmental Biogeochemistry and Ecotoxicology group, University of Geneva, Uni Carl Vogt, 66 Blvd Carl-Vogt, CH 1211 Geneva, Switzerland
*
Author to whom correspondence should be addressed.
Environments 2019, 6(3), 28; https://doi.org/10.3390/environments6030028
Submission received: 14 December 2018
/
Revised: 1 February 2019
/
Accepted: 19 February 2019
/
Published: 26 February 2019
(This article belongs to the Special Issue Aquatic Microbial Ecotoxicology)
Abstract
:Biofilms are important components of the mercury (Hg) biogeochemical cycle. However, Hg effects on biofilm communities are overlooked. Here, we present results of a pilot study on the chronic effects of Hg on biofilms, notably on the potential change of their taxonomic composition. Biofilms were cultivated in microcosms enriched with three different Hg concentrations (11 ± 2 pM, 121 ± 9 pM and 1454 ± 54 pM) for 55 days and examined for their accumulated Hg concentrations and composition. Bioaccumulated Hg concentrations were representative of those encountered in natural environments. Despite the lack of influence on the ash free dry weight and chlorophyll content, the surface coverage of the substrata of biofilms grown in Hg decreased. Algal community were strongly affected by Hg, with a decrease in their richness with Ochrophyta found as the most sensitive phyla. The diversity and richness of bacterial communities did not change upon cultivation in Hg but the presence of Proteobacteria increased with Hg, whereas Bacteroidetes, Actinobacteria, Verrumicrobia, and Cyanobacteria were negatively impacted. Overall, the above findings suggest that the examination of the algal community composition might be used as a potential biomonitoring tool to assess the impacts of environmental Hg concentrations on aquatic systems, which would merit further investigation.
1. Introduction
Freshwater biofilms are communities of microorganisms living in the substrata (rocks, plants, sediments), which play an important role in the ecology and biochemistry of streams [1]. Microalgae composing biofilms are the main primary producers of running and shallow waters, with a biomass representing between 42 to 97% of the total annual productivity of shallow lakes [2,3]. The biotic fraction of biofilms is also composed of heterotroph organisms (fungi and bacteria), which live in symbiosis with microalgae and interlocked in a matrix of extracellular polymeric substances (EPS). As such, that natural assemblage of organisms is an important component of both microbial and phototrophic aquatic food webs [4]. In ecotoxicology, biofilms are considered as good bioindicators of water quality impairment. Indeed, they can be found in several types of ecosystems (lakes, rivers, wetlands, flood plain etc.,), whereas they possess interesting features, such as a short generation time and a diversity in their microbial composition, which quickly responds and integrates changes of environmental conditions [5,6].
Anthropogenic mercury (Hg) emissions have long been identified as highly disruptive for its natural biogeochemical cycle [7,8]. Furthermore, Hg is a global pollutant and priority hazardous substance due to its high toxicity and the biomagnification of its methylated forms (MeHg), a potent neurotoxin, along the food chains. The numerous interactions between Hg compounds and biofilms have been recently comprehensively reviewed, with a specific emphasis on Hg availability, transformations and effects towards freshwater biofilms [9]. Biofilm organisms are also known to be one of the pathway entries of inorganic Hg (IHg) and MeHg into aquatic food webs [10,11]. They are recognized to participate in the transformations of Hg in natural waters. Indeed, bioaccumulated IHg has been demonstrated to be reduced into its elemental Hg0 form by biofilms [12] as well as methylated by inhabiting sulfate-reducing bacteria, iron-reducing bacteria, and methanogens whereas demethylation of MeHg has been also shown to occur [13,14,15].
In turn, the functionality and structure of biofilms have been described to be the target of contaminants [5]. In the case of Hg, exposure studies performed with environmental biofilms under controlled conditions are scarce. The density of diatoms harbored in biofilms exposed for 34 days to 2.3 nM and 9 nM of MeHg was measured to be 2.5 and 6 times lower than the one of non-exposed biofilms, respectively [16]. That phenomenon was accompanied by a decrease of the microalgae cell size whereas a shift from sensitive to more tolerant species was also observed with the decrease of Navicula aquaedurae and with the increase of both Nitzschia palea and Fallacia pygmaea abundance. Three communities of biofilms collected at different sites along the Gallego River (Spain) and exposed to Hg in microcosms for a short period of time (1 h and 2 h) had EC50 values varying between 0.7 µM and 3.6 µM for the most sensitive population and between 100 µM and 200 µM for the least sensitive [17]. In agreement with these studies, a shift in bacterial and microalgal communities upon Hg exposure were also evidenced in the field. That change was observed in biofilms exposed to Hg in mine-impacted rivers with the increase of the abundance of mer A (a gene encoding for a protein able to reduce IHg, process involved in bacteria Hg tolerance) with the increase of bioaccumulated Hg [18]. A similar pattern was observed in biofilms collected in reservoirs contaminated by industrial Hg release [19]. Algal species shift was demonstrated in the Gallego River with the higher abundance of the filamentous algae Oedognium and Stigeoclonium in biofilms living at the most contaminated site (~70 pM Hg), suggesting that both species could be tolerant to Hg [17]. In the Olt River (Romania) under the influence of chlor-alkali plant effluents, the dominant species in the biofilm communities were the Cyanobacteria for algae, Bacillariophyta for algae, and Taphrinomycetes for fungi [20].
Nonetheless, in the above field studies, several environmental confounding factors such as current, light or the presence of other contaminants could modulate Hg accumulation in biofilms as well as their composition, limiting the possibility to accurately demonstrate the relationship between Hg contamination and impacts towards biofilm composition. The goal of the present study was thus to bring first insights on the long-term effects of Hg exposure on biofilm growth (biomass) and taxonomic composition.
2. Materials and Methods
2.1. Labware Cleaning
To avoid contamination of samples by Hg and microorganisms, microscopy glass slides and glass beakers were pyrolysed at 475 °C. All plastic ware, including exposure tanks, were cleaned using four successive baths containing soap, 10% nitric acid (two times) (HNO3 pro-analysis, Merck, Darmstad, Germany) and 10% hydrochloric acid (HCl pro-analysis, Merck, Darmstad, Germany). Proper rinsing with MilliQ water (<18 MΩ, Millipore, Darmstadt, Germany) was performed between each step.
2.2. Biofilm Culture in Hg-Enriched Microcosms
Biofilms were grown on glass microscope slides (7.6 cm × 2.6 cm) in four distinct plastic microcosms containing 7.5 L of Geneva Lake water (no pre-treatment) with and without Hg addition for 55 days. Three of the microcosms were enriched with Hg (stock solution concentration 1 g L−1 of Hg) to reach the final measured concentrations of 11 ± 2 pM, 121 ± 9 pM and 1454 ± 54 pM (n = 6) whereas one microcosm was not contaminated with Hg and kept as a control. One hundred slides (10 slides were placed vertically into 10 polypropylene (PP) baskets) were placed into each microcosm as growing supports. During the first 33 days, exposure media were renewed (7.5 L) twice a week to maintain stable Hg exposure concentrations and to amend microcosms with microorganisms. Indeed, the substrata were not colonized prior to the experiments, thus that biofilms were only cultivated in Hg. After that period, i.e., once substrata were colonized with a thin layer of biofilms, and up to the end (55 days), water was not entirely changed but a small quantity of water was added every 3.5 days to balance with the evaporation and Hg was additionally spiked into Hg enriched-microcosms. That 55 days-period allowed us to work with a sufficient amount of biofilms for bioaccumulation measurements while being able to perform microscopic measurements. Biofilms developed under 1000 lx of light with a light:dark cycle of 16:8 h and a temperature at 20 ± 2 °C. Water was continuously mixed with a submerged pump at 1 L min−1.
2.3. Determination of the Water Quality Variables
Water temperature and pH were measured with a pH-meter (780 Metrohm, Herisau, Switzerland). For the determination of the major anion and cation concentrations, 10 mL of water was filtered at 0.45 μm with Sterivex filters (poly(ether)sulfone, Millipore, Schaffhausen, Switzerland) in PP tubes and measured with ion chromatography (Dionex ICS-3000, Thermo Fisher Scientific Inc., Waltham, MA, USA). Another 10 mL of water was further filtered and acidified to 2% HNO3 (suprapur, Darmstadt, Germany) and analyzed for their dissolved trace metals (0.45 µm filterable, Cr, Ni, Cu, Zn, As, Mo, Cd, Pb, Se, and Co) concentrations by inductively coupled plasma mass spectrometry (ICP-MS; Agilent 7700, Morges, Switzerland). Additionally, 50 mL were collected in 550 °C burned glass bottles, after filtration on pre-pyrolysed 0.7 µm GF/F filters (GE Healthcare Life Sciences, Glattbrugg, Switzerland) and acidified to 2 M HCl (Ultrex, J.T. Baker, VWR, Nyon, Switzerland) to be analyzed for the dissolved organic carbon (DOC) concentrations with a Shimatzu TOC-5000 (Kyoto, Japan). The above measurements were all performed in triplicate. Water samples for the analysis of the dissolved Hg concentrations [THg] were collected at the beginning of the experiments (day 0), after 5 days exposure (before Hg spike), after 33 days exposure (after the Hg spike) and after 50 days exposure (at the end of exposure). For each sampling, 125 mL of water was filtered with 0.45 µm Sterivex filters, acidified to 1% (v/v final concentration) with HCl (Ultrex, J.T Baker®, VWR, Nyon, Switzerland) and stored in 475 °C-burned glass bottles. [THg] were analyzed by cold vapor atomic fluorescence spectrometry (CV-AFS) with a MERX Automated Analytical System (Brooks Rand Instruments, Seattle, WA, USA) following the USEPA 1631 method [21]. The detection limit of the technique was 1.8 pM (3 standard deviations of 10 blank measurements) and the certified reference material was the ORMS-5 (National Research Council Canada).
2.4. Measurements of Accumulated Hg in Biofilms
For each microcosm, six slides colonized by biofilms were sampled after 50 days of Hg exposure and analyzed for their total accumulated Hg {THg}, their non-extractable total Hg {THg}n-ext, inorganic Hg {IHg}n-ext and methyl Hg {MeHg}n-ext concentrations [19]. {THg} is the total accumulated Hg content (THg = IHg + MeHg), which represents the sum of Hg adsorbed onto organisms, particles and matrix plus Hg absorbed by microorganisms. To determine {THg}, slides were rinsed three times with 0.2 µm filtered Geneva Lake water, scraped and were collected in pre-cleaned PP tubes. For the determination of the non-extractable concentrations, colonized slides were rinsed with 100 mM cysteine (>97%, sigma-Aldrich, Busch, Switzerland) for 10 min, scraped, and stored in pre-cleaned PP tubes. The Hg content obtained with and without the cysteine-rinsing step were analyzed with an advanced Hg Analyzer (AMA) 254 (Altec s.r.l, Dvůr Králové nad Labem, Czech Republic), which has a detection limit of 0.03 ng (3 SD of 3 blanks). The TORT2 and MESS3 (National Research Council, Canada) were both used to verify the accuracy of the AMA measurements. The measurements were accepted only when their expected concentrations were in the range of the certified materials. {MeHg}n-ext was first extracted with dichloromethane from biofilms following the method previously described in reference [19] to be measured with a MERX-M Automated Methylmercury System (Brooks Rand, Seattle, WA, USA). The detection limit of the technique was measured at 4.4 nM and the certified reference material ERMCC5580 estuarine sediment was used to verify the accuracy of the extraction and measurements.
2.5. Biofilm Characterization
Biofilm biomass was assessed with the measurements of both the chlorophyll content (ng cm−2) and the ash free dry weight (AFDW—µg cm−2). For each treatment, six microscopy glass slides were scraped and stored in three Eppendorf tubes at −80 °C and lyophilized for 24 h. The chlorophyll was extracted using acetone to be further analyzed with a spectrophotometer HeLIOS g (Thermo Scientific, Reinach, Switzerland) [22]. The dry weight was measured after drying the samples at 60 °C for 48 h and AFDW was determined after an additional combustion step at 500 °C for 2 h using 3 × 6 slides.
The methods to determine the surface coverage of the substrata as well as the biotic and abiotic fractions of the biofilms have been described elsewhere [19]. Briefly, the biotic fraction was obtained after a staining of the biofilms with the probe 6-diamidino-2-phenylindodihydrochloride (DAPI) and their observation with a fluorescence microscope (Olympus BX61, Olympus, Volkestwil, Switzerland) using the DAPI channel. The percentage of the non-covered slide area (NCA) of the DAPI-stained biofilms was also determined using the DAPI channel, from which the percentage of the surface covered area was calculated by subtracting 100 to NCA. Biofilms without staining were observed in the channel DAPI to quantify the abiotic fractions (proxy of inorganic particles). Ten pictures were taken and analyzed with the software “ImageJ” to distinguish the fractions as a function of the hue, saturation, and brightness of the pictures [23].
Amplicon sequencing was performed to investigate the bacterial and microalgal composition. For each microcosm, biofilm (~10 mg) was collected and stored in Eppendorf tubes at −80 °C. The biofilm DNA were extracted using the Power Biofilm DNA kit (Mo-Bio, Carlsbad, CA, USA) and according to the provider instructions. Total DNA was quantified with a Qubit 2.0 fluorimeter (Invitrogen, Thermo Fisher Scientific, Waltham, MA, USA). The pair primers 1053F (5’- GCATGGCYGYCGTCAG-3’), 1319R (5’-CGACGCCATCTTCATTCACAT-3’) and D512F (5’-ATTCCAGCTCCAATAGCG -3’), D978R (5’- GACTACGATGGTATCTAATC-3’) were used as in our previous study [20]. These primers were selected to determine major bacterial and microalgal phyla [24,25]. Biofilms DNA were sent and analyzed with the Roche 454 FLX sequencer by “Research and testing laboratory” (Lubbock, TX, USA). For each condition, the OTU (Operational Taxonomic Unit) richness, the rarefied richness, the Simpson’s diversity index and the turnover of each biofilm were calculated to assess the richness and diversity of the bacterial and algal communities [20,26]. The obtained sequences of microalgae and bacteria were submitted in the GenBank database under the sequence read archive (SRA) section with the following numbers: SRP131223 [27].
2.6. Statistics
Statistical analyses were performed on the log values of the mean {THg} and {IHg}n-ext and on the mean values of {MeHg}n-ext, chlorophyll concentration and AFDM. The normality and homogeneity of their variances were tested with the Shapiro-Wilk and Bartlett tests, respectively. The significant differences between each treatment were assessed using a one-way ANOVA (Analysis of Variance) followed by the Tukey’s HSD (Honestly Significant Difference) test. Rarefaction curves, species and rarefied richness, and Simpson’s diversity index were obtained with the package Vegan [28]. The OTUs presence-absence were represented with Venn diagrams [29]. The software R was used to perform the statistical analyses [30].
3. Results and Discussion
3.1. Biofilm Culture Conditions
Culture media, which were composed of Geneva Lake water enriched with Hg, were characterized by a pH value of 8.2 ± 0.2, a DOC concentration of 1.4 ± 0.2 mg L−1 and a Ca2+ concentration of 1.14 ± 0.03 mM (Table S1). The measured trace metal concentrations were low, with a Cu and Zn concentrations of 8.09 ± 0.49 nM and 9.55 ± 0.78 nM, respectively. These levels of the nutrients are in accordance with the mesotrophic, with a low-eutrophic tendency, condition of the Lake Geneva [31] and was thus appropriate to serve as a culture media, in which the presence of high concentrations of pollutants was not expected. The addition of Hg into the microcosms allowed us to obtain three dissolved culture Hg concentrations, i.e., 11 ± 2 pM, 121 ± 9 pM, and 1454 ± 54 pM dissolved Hg. A factor of approximately 10 was used between each studied concentration, with the first two studied Hg concentrations representing those measured in freshwater lakes, 121 pM being found in rather highly contaminated systems [32]. After 5 days of cultivation, almost all Hg in solution was depleted (Figure S1). That phenomenon was possibly due to a combination of adsorption to microcosm walls and biofilm supports, volatilisation under Hg0 form, and bioaccumulation, which was overcome with the renewing of the culture media or with its Hg spiking.
3.2. Hg Accumulation by Biofilms
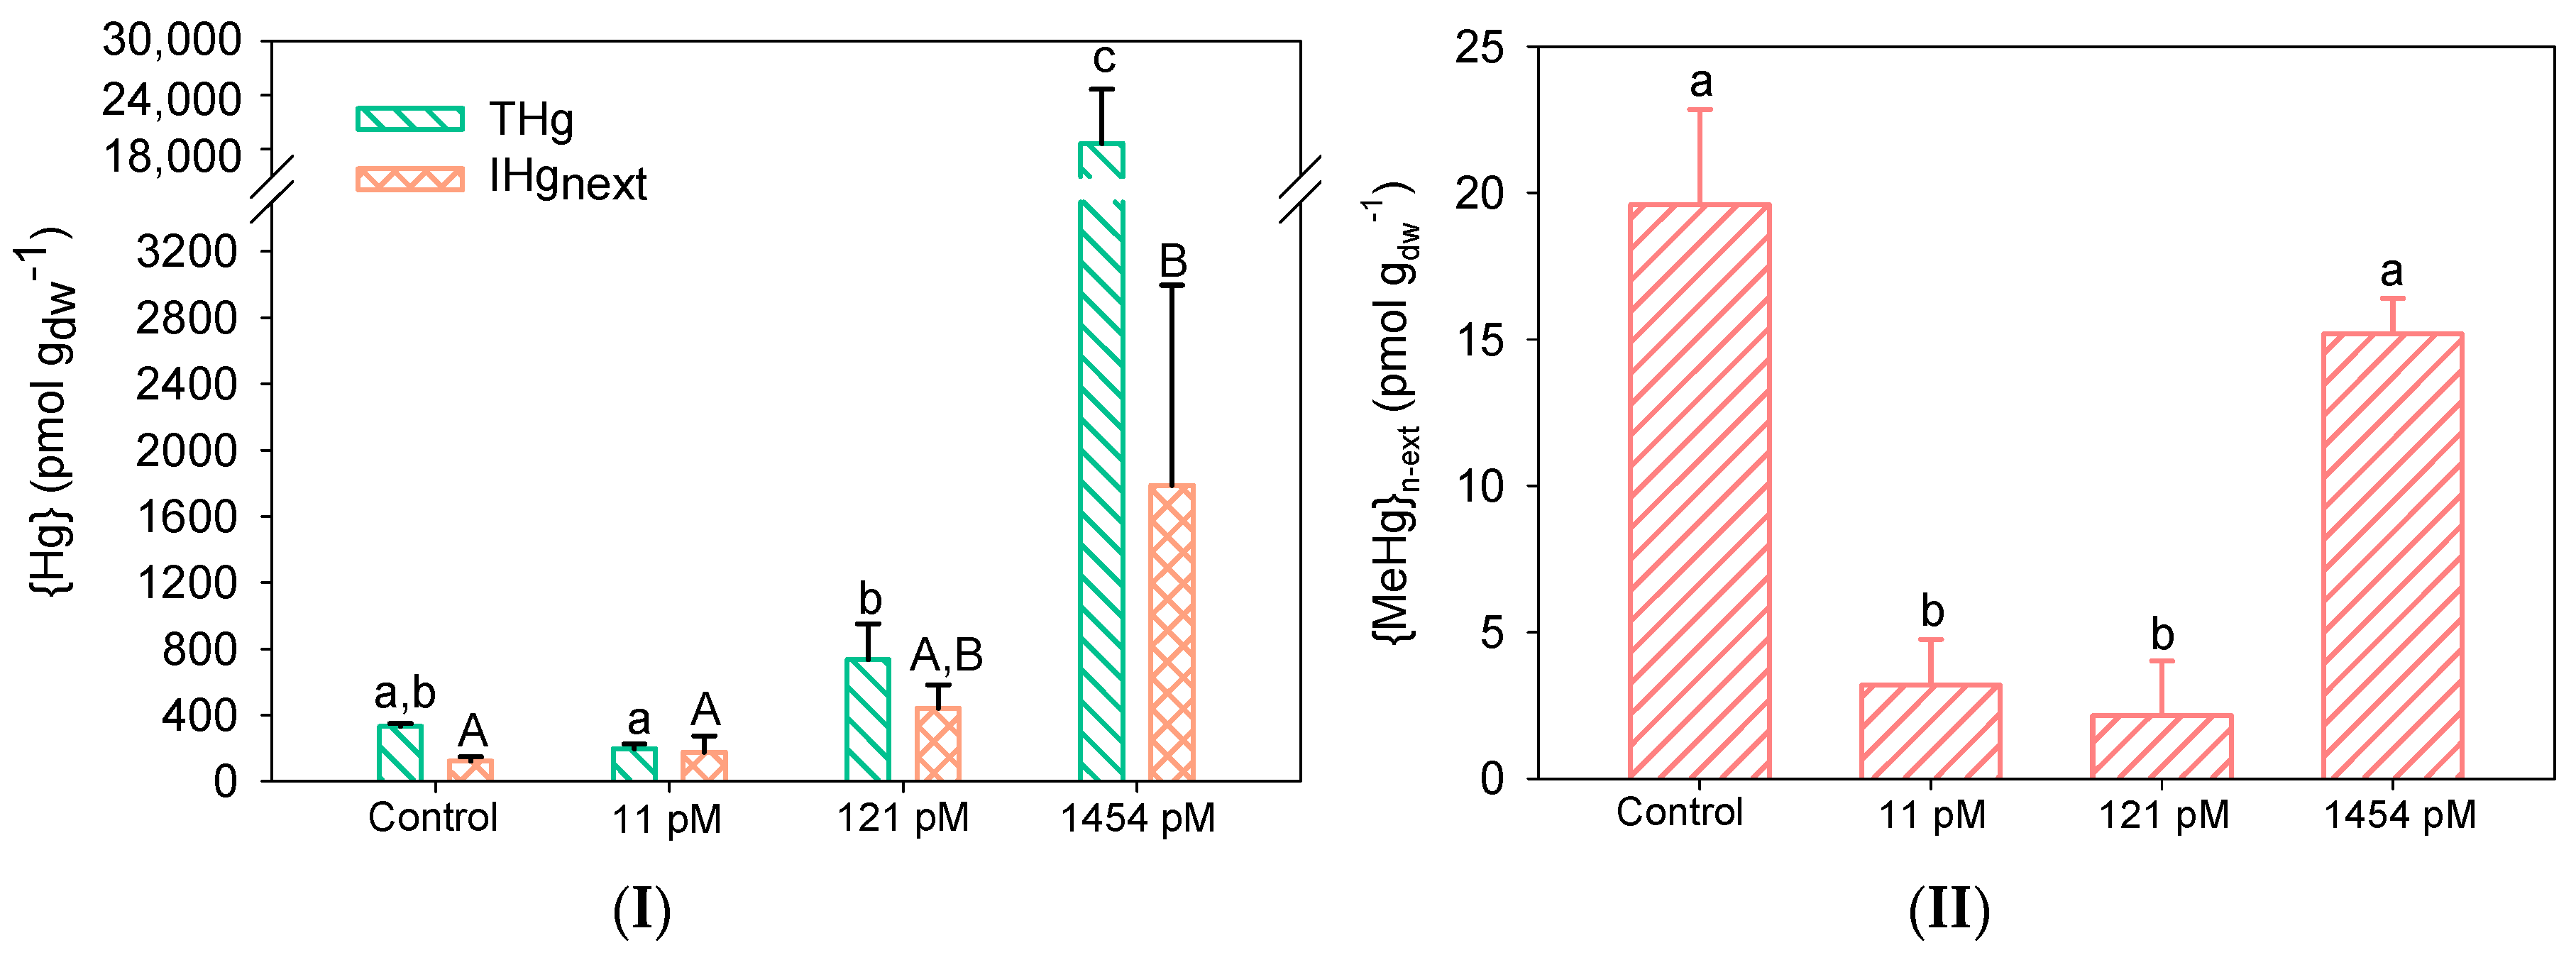
The cultivation of biofilms in Hg led to the increase of bioaccumulated Hg (Figure 1I) as compared with the unexposed control biofilm. Biofilms grown in the control microcosm already contained a natural background of 332 ± 17 pmol gdw−1 of {THg}. Comparable {THg} was found in biofilms grown in 11 pM Hg (p = 0.05; n = 3) whereas at 121 pM Hg and 1454 pM Hg, {THg} was 2.2-times and 25-times higher than the one measured in control biofilms, respectively. The natural {THg} background measured in the present study is in good agreement with those previously measured in biofilms grown in Geneva Lake, in which {THg} was found to vary between 86 and 214 pmol.gdw-1 depending on the biofilm age [22]. Measured {THg} in biofilms collected in various Hg-impacted rivers range in a wide range between 269 pmol to 1.7 µmol gdw−1 [9]. The extremely high concentration of 1.7 µmol gdw−1 of {THg} was measured in biofilms collected in the Idrijca River (Slovenia), close to a former Hg mine, where high concentrations of dissolved Hg (272 ng L−1) were measured [33]. The present studied biofilms are thus situated at the lower end of Hg bioaccumulation globally measured, suggesting that Hg is most probably not of concern for the water quality of the Geneva lake water surrounding our water sampling site, in agreement with the very low measured dissolved Hg concentrations.
Comparing Hg accumulation between biofilms to infer conclusions on the quality of their ambient water should, however, be taken with caution. Indeed, Hg accumulation is not only dependent on the concentration of Hg in the ambient water but also of their surrounding environmental parameters (substrata, light, current, temperature), water chemical variables (pH and DOC concentration), and composition [9]. Indeed, taxonomic composition and biofilm thickness were recently shown to modulate Hg uptake kinetics in freshwater biofilms [22]. Moreover, in contrast with other metals such as Cu, Zn, Pb or Cd, Hg could be further transformed by biofilms and be excreted under its methylated and elemental form. Such processes would decrease accumulated Hg and led to a misinterpretation of accumulated Hg values. Further studies are needed to identify and quantify the extent with which such processes take place in biofilms grown under our experimental conditions.
The measurement of the total accumulated Hg in biofilms included Hg adsorbed to particles and microorganisms, Hg bound to the EPS matrix and Hg intracellularly taken up by biofilms. Applying a rinsing-step with cysteine allowed us to remove the non-specifically bound Hg and to get closer to the actual Hg (intracellular) concentration that would impact the microbial communities. In the present study, {IHg}n-ext, proxy of the intracellular fraction, measured in the control biofilm represented 39% of {THg} (130 ± 27 pmol gdw−1). Similar {IHg}n-ext was observed upon cultivation in 11 pM Hg with the percentage of {IHg}n-ext being 89% (176 ± 98 pmol gdw−1). At 121 pM Hg and 1454 pM, {IHg}n-ext increased 3.9-times (non-significant) and 22.5-times (2.7 ± 1.2 nmol gdw−1), respectively. Interestingly, the fraction of {IHg}n-ext as compared to {THg} decreased up to 14% at the higher Hg concentration (that percentage is 65% for biofilms grown in 121 pM Hg). These measured {IHg}n-ext in control and Hg-cultivated biofilms were found to be comparable with those measured in biofilms grown in ~150 pM Hg for 24 h (between 886 pmol gdw−1 and 1.6 nmol gdw−1) [22] and collected in a chlor-alkali impacted river (between 167 pmol gdw−1 (control reservoir) and 1 nmol gdw−1 (highly affected reservoir) [19]. The decrease of {IHg}n-ext proportion as compared to {THg} with the increase of Hg in the culture media might be the result of the microbial community response to Hg exposure. Indeed, at the highest Hg concentration, microorganisms might have developed strategies to cope with higher ambient Hg concentration and thus accumulation. They might have regulated their metal transporters to limit Hg uptake [34]. They might also have formed larger amounts of EPS or modified their EPS synthetized structure to more efficiently sequestered Hg [35]. Finally, the culture conditions might have changed the microbial species communities with microbes less prone to accumulate Hg (see Section 3.3). Further research would be needed to better understand the role of each process in the increase of adsorbed Hg in Hg-exposed communities.
No direct relationship between {MeHg}n-ext and Hg concentrations in the culture media could be established and the maximal {MeHg}n-ext (19.60 pmol gdw−1) was found in the control biofilms, representing 5.9% of {THg} (Figure 1II). A decrease in the fraction of {MeHg}n-ext as compared to {THg} was observed with the increase of Hg cultivation concentration, with values of 1.6%, 0.29%, and 0.08% in biofilms exposed to 11 pM, 121 pM and 1454 pM, respectively, reflecting the large increase in {THg}. Such low percentage of {MeHg}n-ext was also found in biofilms grown in Hg-contaminated reservoirs [19]. That lack of {MeHg}n-ext increase found in the present study with the increase of culture Hg concentrations contrasts with the large body of evidence reporting methylation occurring in biofilms [15,36,37]. However, comparison is difficult to make since only the total bioaccumulated MeHg (adsorbed + absorbed) as well as the production of MeHg in the exposure media are usually measured.
Overall, our measured concentrations of bioaccumulated Hg were found to be representative of those encountered in natural environments, even at the highest dissolved Hg culture concentrations.
3.3. Hg Impacts on Biofilms
3.3.1. Biofilm Biomass
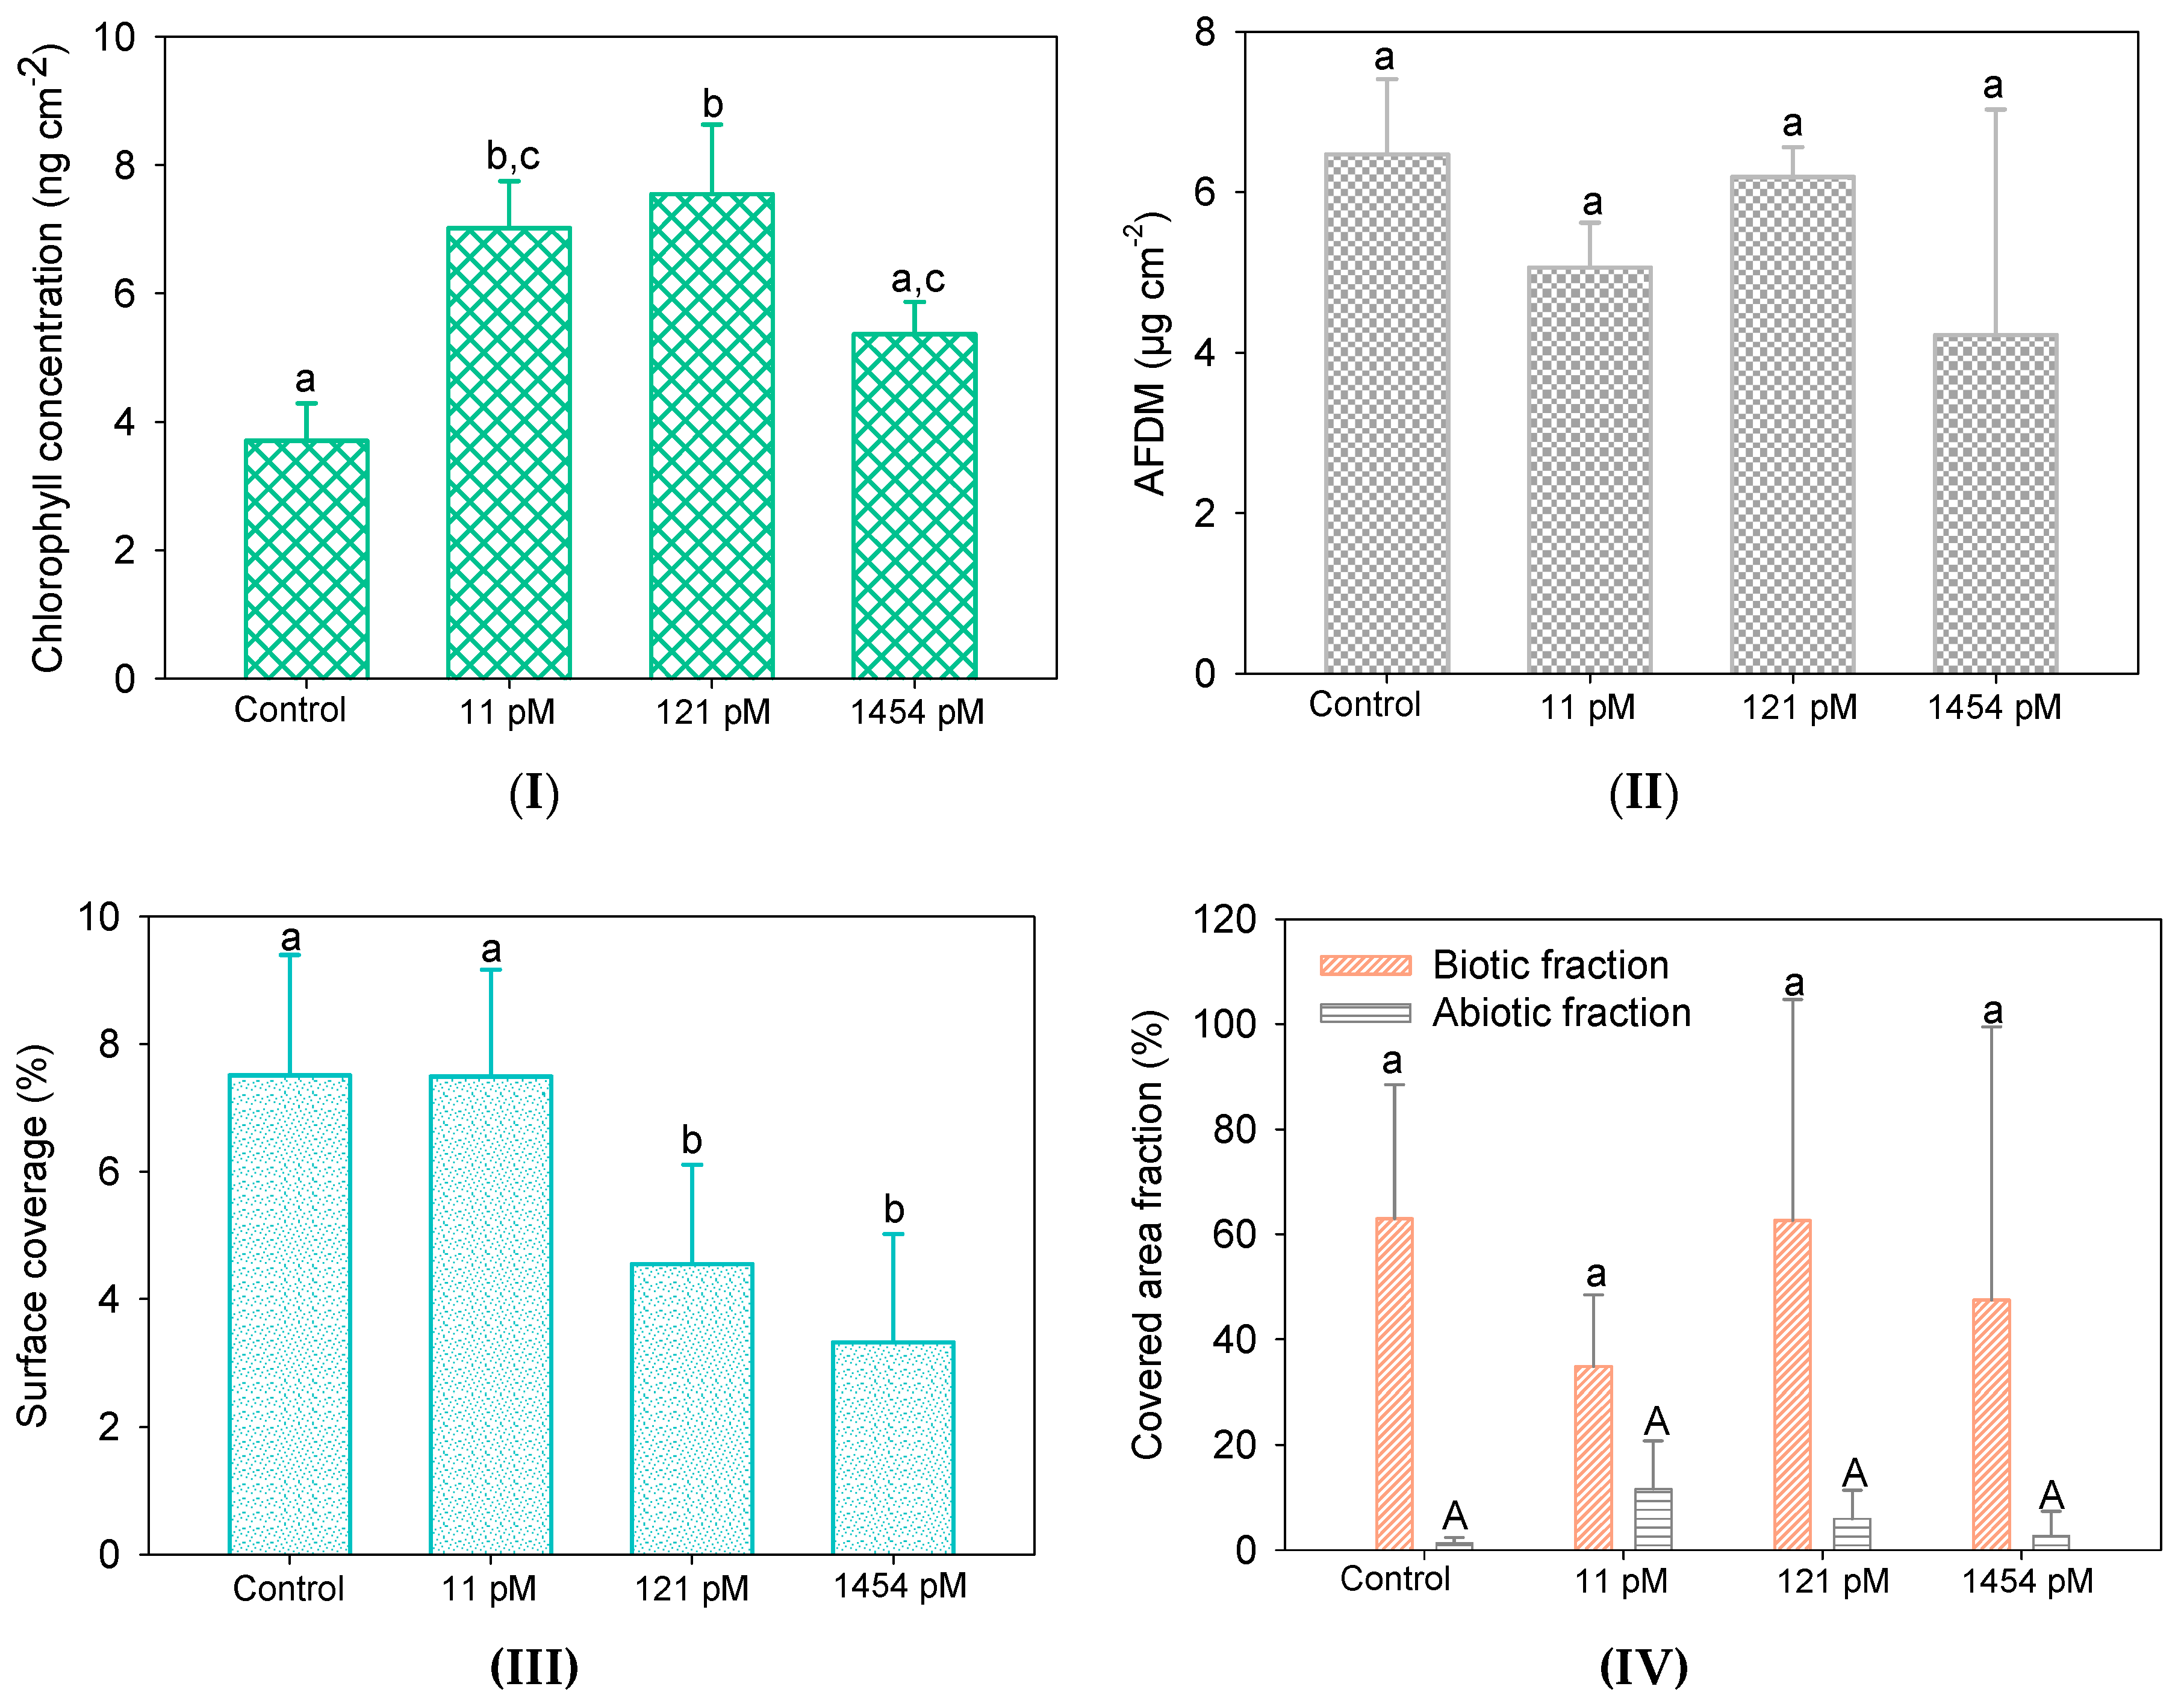
The effects of Hg on substrata colonisation by biofilms were firstly examined by determining the biofilm chlorophyll content, their biomass, and the surface coverage of the substrata (Figure 2). The chlorophyll content of the control biofilm was 3.7 ± 0.6 ng cm−2 and was observed to be significantly higher upon cultivation in 11 pM Hg (7.0 ± 0.7 ng cm−2) and 121 pM Hg (7.5 ± 1.1 ng cm−2). A decrease back to comparative levels (5.4 ± 0.5 ng cm−2) than the control was observed at 1454 pM Hg (Figure 2I). The photosynthetic system is a well-known target of Hg in phototrophic organisms, leading to a decrease of chlorophyll a concentration [38,39], but at much higher Hg concentrations (~µM) than those studied in the present study. Moreover, IHg has been shown to have beneficial properties as electron acceptors for photomixotrophs in limited CO2 conditions, suggesting that the photosynthetic system might not be impacted under certain conditions [40]. As such, the possible effects of Hg growing concentrations towards photosynthetic bacteria and microalgae may not detectable in the present study using the chlorophyll content. No significant difference was observed in the AFDM of the control and Hg-culture biofilms (Figure 2II). The surface coverage of the substrata for biofilms grown under control conditions (7.5 ± 2.5%) and in 11 pM Hg (7.5 ± 1.9%) were low (Figure 2III), which was accentuated at the two highest Hg concentrations with values at 4.6 ± 2.5% and 3.3 ± 2.6% for biofilms grown in 121 pM and 1454 pM, respectively. Lower surface coverage was also observed in biofilms growing in reservoirs contaminated with Hg as compared to biofilms collected in upstream site and in less-Hg contaminated reservoirs [19]. The biotic (including all organisms harbored in biofilms) and abiotic fractions (all inert particles within biofilm) were comparable among biofilms (Figure 2IV).
3.3.2. Bacterial Biofilm Composition
Bacterial community composition of the studied biofilms was determined by amplicon sequencing. Their OTUs richness was found to increase with Hg cultivation concentrations, from 209 in the control biofilms to 291 in biofilms exposed to the highest Hg concentration. That result can be partly explained by the increase of measured total sequences from 1269 to 45,251, also observed with Hg concentrations (Table 1). Indeed, standardization of the richness index with the calculation of the rarefied richness demonstrated that the bacterial species richness remained comparable to the control at the highest Hg concentration (rarefaction curves are presented in Figure S2I). Nevertheless, a decrease could be observed in the biofilms grown in 11 pM and 121 pM treatment. That observation is in line with our previous field study showing the higher richness of bacteria in the contaminant-affected reservoirs vs the uncontaminated reservoir [20]. The Simpson’s diversity index was found to be very high for all the bacterial communities (mean value of 0.96) and similar among microcosms, demonstrating that the studied bacterial communities were very diverse and that the most frequent taxa were equally distributed, without dominant OTUs. Moreover, their turnover indicated that their diversity remains insensitive to Hg concentrations.
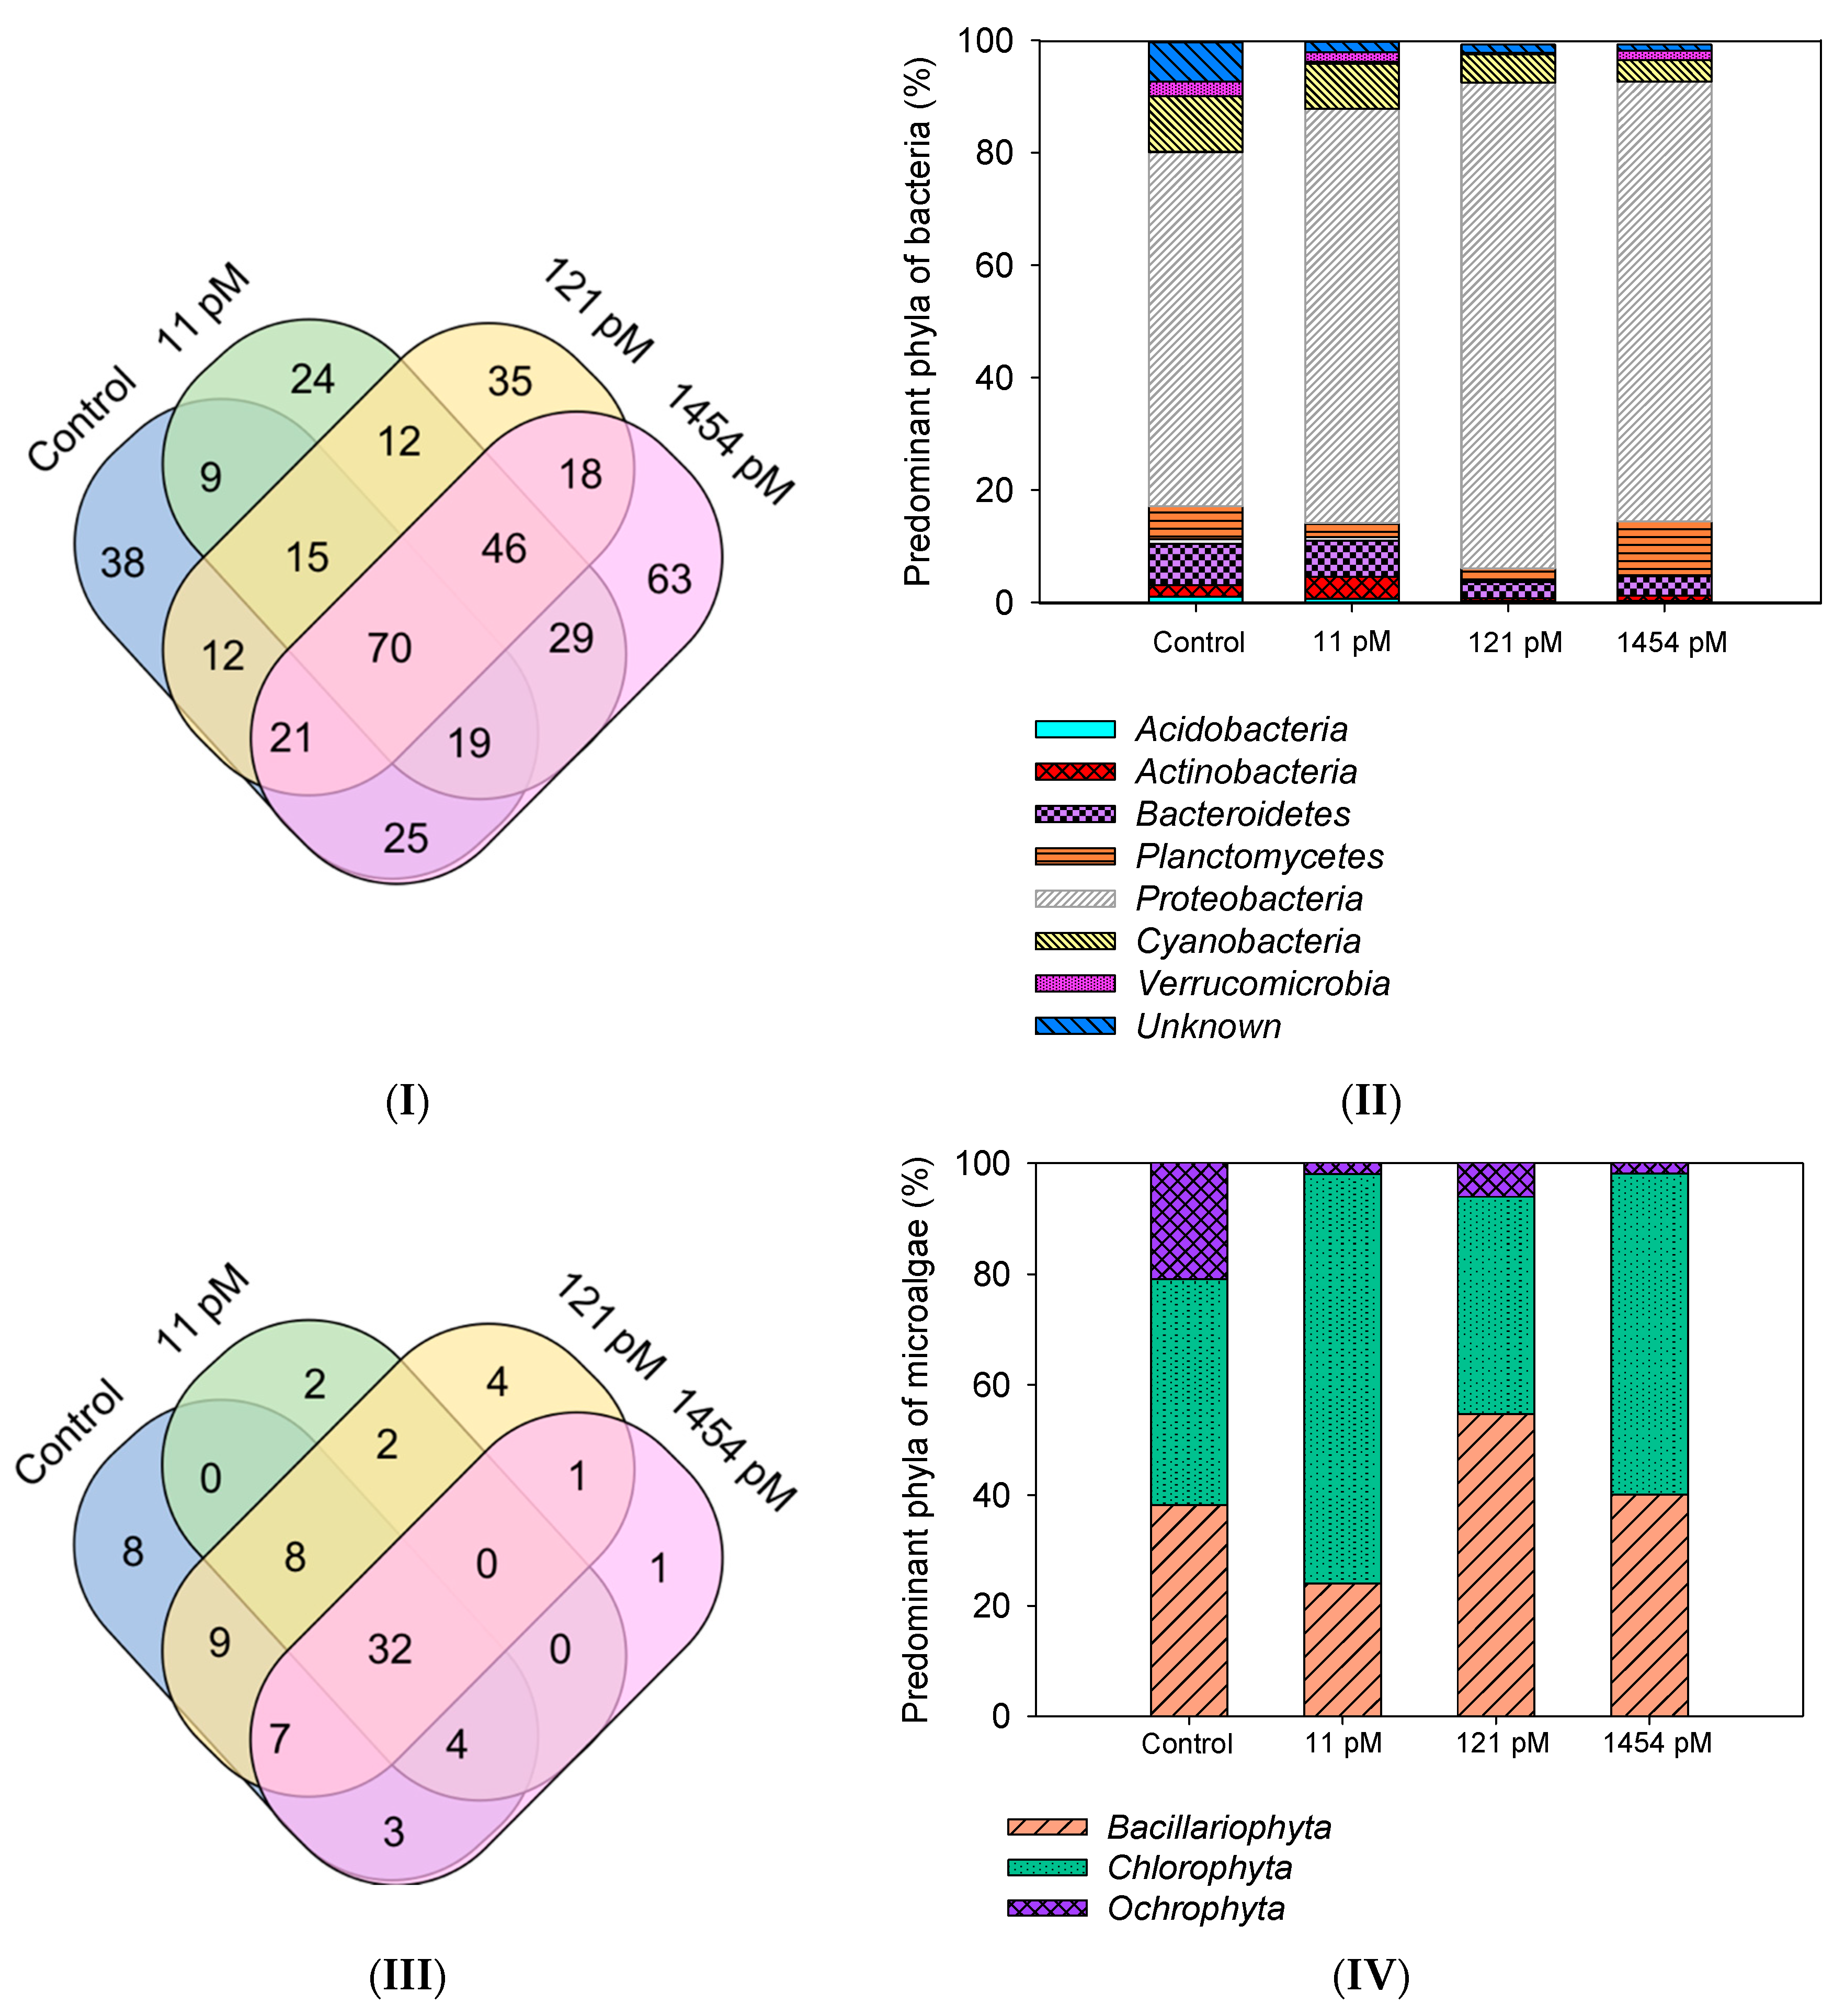
Thirty-eight OTUs were unique to the control biofilm, which represented 10% of the total bacteria abundance. That percentage of unique OTUs remained low in the Hg-exposed biofilms with values ranging between 3% and 5% (Figure 3I). As a consequence, the percentage of shared OTUs was high and represented 55% (control) to 71% (121 pM Hg) of the total abundance. The Proteobacteria were the most abundant phyla, with a proportion that increased upon Hg concentrations, e.g., from 68% in the control biofilms to a maximum of 86 % in biofilms exposed to 121 pM Hg (Figure 3II).
In that phylum, the Betaproteobacteria was the most abundant class, representing 19% of the total abundance in the control. That proportion increased with the increase of Hg culture concentration, representing 38%, 47% and 40%, of the total class in the biofilms grown in 11 pM, 121 pM, and 1454 pM Hg, respectively (Table S2I). The observed sensitivity of Proteobacteria to Hg is in agreement with a recent study showing that the largest variation observed among taxa in microbial communities exposed to 250 pM Hg concerned Proteobacteria [41]. Additionally, the percentage of Bacteroidetes, Actinobacteria, Verrucomicrobia, and Cyanobacteria decreased upon cultivation in Hg (Figure 3II). These results contrast with those findings suggesting that Cyanobacteria and Bacteroidetes were tolerant to Hg [20,42,43] and demonstrate that the species of Cyanobacteria and Bacteroidetes present in the studied biofilms were not tolerant to Hg.
3.3.3. Algal Biofilm Composition
The total sequences corresponding to algal communities decreased upon Hg exposure, which was accompanied by the decrease of the OTUs richness (Table 1). However, in contrast to the bacteria, the rarefied richness was also lower in Hg-grown biofilms than in control biofilms, suggesting that those low Hg concentrations impacted the algal community richness of our studied biofilms (the rarefaction curves are presented in Figure S2II). The studied algal communities were very diverse with an averaged Simpson’s diversity index of 0.85 and was not affected by the cultivation in Hg, except at 11 pM exposed biofilms, which had a calculated index of 0.77. This result suggests that the microalgal community grown at 11 pM was more heterogeneous. Finally, both biofilms grown in 11 pM and 1454 pM Hg had a higher turnover than those grown in 121 pM, making it difficult to conclude on Hg effects on the β-diversity of the studied algal communities. Note that the bacteria turnover values were higher than those of algae, suggesting that the bacteria reacted more rapidly to Hg exposure than algae.
Eight OTUs assigned to microalgae were specific to the control biofilm (0.6% of the total abundance) (Figure 3III). Again, that percentage remained low in Hg-grown biofilms with values of 0.4%, 4% and 0.2% in 11 pM, 121 pM, and 1454 pM Hg. In total, 32 OTUs were shared among the biofilms, representing 92%, 96%, 88%, and 92% of the total abundance in the control biofilm and those cultivated in 11 pM, 121 pM, and 1454 pM Hg, respectively. For each biofilm, microalgal communities were dominated by three phyla, i.e., Bacillariophyta, Chlorophyta, and Ochrophyta (Figure 3IV). However, the percentage of Ochrophyta decreased in each biofilm grown in Hg whereas Chlorophyta increased in microcosms containing 11 pM and 1454 pM, except in biofilms exposed to 121 pM (Table S2II). The disappearance of Ochrophyta was also observed in the field with the degradation of the water quality concomitant with an increase of Hg concentration [20].
4. Conclusions
The present study presents our first results on the influence of the long-term Hg exposure to bacterial and microalgal biofilm communities. The low Hg concentration increase in the biofilm culture media (up to 1454 pM) resulted in the enhancement of Hg accumulation in biofilms, and for both total and non-extractable fractions. That Hg bioaccumulation did not negatively affect the biofilm chlorophyll content, neither their AFDM, but a decrease of the surface coverage of the substrata (used as a proxy for biofilm growth) was measured. Additionally, the richness and diversity of the bacterial communities were not affected by Hg, whereas modification could be observed at the phyla level with an increase of Proteobacteria and a decrease of Bacteroidetes, Actinobacteria, Verrucomicrobia, and Cyanobacteria. A stronger impact was observed on algal communities with a decrease of their rarefied richness with Hg concentrations. The communities were dominated by Chlorophyta and Bacillariophyta under all treatments, while the Ochrophyta significantly decreased in the Hg-enriched microcosms. That algal sensitivity to Hg might be an asset to develop biomonitoring tools to assess the degradation of water quality by Hg in the field but will need to be confirmed through additional long-term experiments using complementary Hg treatment and replicates.
Supplementary Materials
The following are available online at https://www.mdpi.com/2076-3298/6/3/28/s1, Figure S1: Measured mercury concentration in microcosms at the beginning of the exposure (measured after Hg addition, Day 0) and after 5, 33 and 55 days of cultivation, Figure S2: Rarefaction curves from the amplicon sequencing of (I) bacteria and (II) microalgae in control biofilm and in biofilms grown in 11 ± 2 pM, 121 ± 9 pM and 1454 ± 54 pM Hg for 55 days, Table S1: Average pH, temperature and concentration of dissolved organic carbon, trace metals and major anions/cations of the Geneva Lake water (± SD, n = 3), Table S2: Taxonomic ranks of the major microorganisms living in biofilms as well as the number of sequences and their abundance (%) calculated with OTUs assigned to (I) bacteria and (II) microalgae after 50 days of exposure to IHg. The abundance was calculated by dividing the specific number of sequences assigned to an OTU to the total number of sequences, multiplied by 100.
Author Contributions
S.L.F. initiated the study; P.D., A.F. and S.L.F. designed the experiments; A.F. and P.D. carried out the experiments; A.F., P.D. and S.L.F. performed data analyses; P.D., S.L.F. and V.I.S. discussed the obtained results; P.D. wrote the first draft of the paper; S.L.F. wrote, reviewed and edited the final version; P.D. and V.I.S. reviewed the draft and final versions.
Funding
This research was funded by the Swiss National Science Foundation, grant number IZERZO-142228.
Acknowledgments
We gratefully thank Valérie Parietti for technical assistance and Dorothea Hug Peter for her help to interpret the ecological indexes.
Conflicts of Interest
The authors declare no conflict of interest.
References
- Battin, T.J.; Besemer, K.; Bengtsson, M.M.; Romani, A.M.; Packmann, A.I. The ecology and biogeochemistry of stream biofilms. Nat. Rev. Microbiol. 2016, 14, 251–263. [Google Scholar] [CrossRef] [PubMed]
- Vannote, R.L.; Minshall, G.W.; Cummins, K.W.; Sedell, J.R.; Cushing, C.E. River continuum concept. Can. J. Fish. Aquat. Sci. 1980, 37, 130–137. [Google Scholar] [CrossRef]
- Azim, M.E. Photosynthetic periphyton and surfaces. In Encyclopedia of Inland Waters; Likens, G.E., Ed.; Academic Press: Oxford, UK, 2009; pp. 184–191. [Google Scholar]
- Lear, G.; Dopheide, A.; Ancion, P.-Y.; Roberts, K.V.W.; Smith, J.G.; Lewis, G.D. Biofims in freshwater: Their importance for maintenance and monitoring of freshwater health. In Microbial Biofilms: Current Research and Applications; Lear, G., Lewis, G.D., Eds.; Caiser Academic Press: Norfolk, UK, 2012; pp. 129–152. [Google Scholar]
- Sabater, S.; Guasch, H.; Ricart, M.; Romani, A.; Vidal, G.; Kluender, C.; Schmitt-Jansen, M. Monitoring the effect of chemicals on biological communities. The biofilm as an interface. Anal. Bioanal. Chem. 2007, 387, 1425–1434. [Google Scholar] [CrossRef] [PubMed]
- Burns, A.; Ryder, D.S. Potential for biofilms as biological indicators in Australian riverine systems. Ecol. Manag. Restor. 2001, 2, 53–64. [Google Scholar] [CrossRef]
- Amos, H.M.; Jacob, D.J.; Streets, D.G.; Sunderland, E.M. Legacy impacts of all-time anthropogenic emissions on the global mercury cycle. Glob. Biogeochem. Cycles 2013, 27, 410–421. [Google Scholar] [CrossRef] [Green Version]
- Lamborg, C.H.; Hammerschmidt, C.R.; Bowman, K.L.; Swarr, G.J.; Munson, K.M.; Ohnemus, D.C.; Lam, P.J.; Heimburger, L.E.; Rijkenberg, M.J.A.; Saito, M.A. A global ocean inventory of anthropogenic mercury based on water column measurements. Nature 2014, 512, 65–67. [Google Scholar] [CrossRef] [PubMed]
- Dranguet, P.; Le Faucheur, S.; Slaveykova, V.I. Mercury bioavailability, transformations, and effects on freshwater biofilms. Environ. Toxicol. Chem. 2017, 36, 3194–3205. [Google Scholar] [CrossRef] [PubMed] [Green Version]
- Dominique, Y.; Maury-Brachet, R.; Muresan, B.; Vigouroux, R.; Richard, S.; Cossa, D.; Mariotti, A.; Boudou, A. Biofilm and mercury availability as key factors for mercury accumulation in fish (Curimata cyprinoides) from a disturbed Amazonian freshwater system. Environ. Toxicol. Chem. 2007, 26, 45–52. [Google Scholar] [CrossRef] [PubMed]
- Cremona, F.; Hamelin, S.; Planas, D.; Lucotte, M. Sources of organic matter and methylmercury in littoral macroinvertebrates: A stable isotope approach. Biogeochemistry 2009, 94, 81–94. [Google Scholar] [CrossRef]
- Cheng, J.P.; Zhao, W.C.; Liu, Y.Y.; Wu, C.; Liu, C.; Wang, W.H. Adsorption properties and gaseous mercury transformation rate of natural biofilm. Bull. Environ. Contam. Toxicol. 2008, 81, 516–520. [Google Scholar] [CrossRef] [PubMed]
- Hamelin, S.; Amyot, M.; Barkay, T.; Wang, Y.P.; Planas, D. Methanogens: Principal methylators of mercury in lake periphyton. Environ. Sci. Technol. 2011, 45, 7693–7700. [Google Scholar] [CrossRef] [PubMed]
- Correia, R.R.S.; Miranda, M.R.; Guimaraes, J.R.D. Mercury methylation and the microbial consortium in periphyton of tropical macrophytes: Effect of different inhibitors. Environ. Res. 2012, 112, 86–91. [Google Scholar] [CrossRef] [PubMed]
- Bouchet, S.; Goni-Urriza, M.; Monperrus, M.; Guyoneaud, R.; Fernandez, P.; Heredia, C.; Tessier, E.; Gassie, C.; Point, D.; Guedron, S.; et al. Linking microbial activities and low-molecular-weight thiols to Hg methylation in biofilms and periphyton from high-altitude tropical lakes in the Bolivian altiplano. Environ. Sci. Technol. 2018, 52, 9758–9767. [Google Scholar] [CrossRef] [PubMed]
- Peres, E.; Coste, M.; Ribeyre, F.; Ricard, M.; Boudou, A. Effects of methylmercury and inorganic mercury on periphytic diatom communities in freshwater indoor microcosms. J. Appl. Phycol. 1997, 9, 215–227. [Google Scholar] [CrossRef]
- Val, J.; Muniz, S.; Goma, J.; Navarro, E. Influence of global change-related impacts on the mercury toxicity of freshwater algal communities. Sci. Total Environ. 2016, 540, 53–62. [Google Scholar] [CrossRef] [PubMed] [Green Version]
- Kovac Virsek, M.; Hubad, B.; Lapanje, A. Mercury induced community tolerance in microbial biofilms is related to pollution gradients in a long-term polluted river. Aquat. Toxicol. 2013, 144–145C, 208–217. [Google Scholar] [CrossRef] [PubMed]
- Dranguet, P.; Le Faucheur, S.; Cosio, C.; Slaveykova, V.I. Influence of chemical speciation and biofilm composition on mercury accumulation by freshwater biofilms. Environ. Sci. Processes Impacts 2017, 19, 38–49. [Google Scholar] [CrossRef] [PubMed]
- Dranguet, P.; Cosio, C.; Le Faucheur, S.; Hug-Peter, D.; Loizeau, J.L.; Ungureanu, V.G.; Slaveykova, V.I. Biofilm composition in the Olt River (Romania) reservoirs impacted by a chlor-alkali production plant. Environ. Sci. Processes Impacts 2017, 19, 687–695. [Google Scholar] [CrossRef] [PubMed]
- USEPA. Method 1631, Revision E: Mercury in Water by Oxidation, Purge and Trap, and Cold Vapor Atomic Fluorescence Spectrometry; EPA: Washington, DC, USA, 2002; p. 38.
- Dranguet, P.; Slaveykova, V.I.; Le Faucheur, S. Kinetics of mercury accumulation by freshwater biofilms. Environ. Chem. 2018, 14, 458–467. [Google Scholar] [CrossRef]
- Rasband, W.S. ImageJ; U.S. National Institutes of Health: Bethesda, MD, USA, 1997–2018. Available online: https://imagej.nih.gov/ij/ (accessed on 21 February 2019).
- Zimmermann, J.; Jahn, R.; Gemeinholzer, B. Barcoding diatoms: Evaluation of the V4 subregion on the 18S rRNA gene; including new primers and protocols. Org. Divers. Evol. 2011, 11, 173–192. [Google Scholar] [CrossRef]
- Bricheux, G.; Morin, L.; Le Moal, G.; Coffe, G.; Ballestrino, D.; Charbonnel, N.; Bohatier, J.; Forestier, C. Pyrosequencing assessment of prokaryotic and eukaryotic diversity in biofilm communities from a French river. Microbiologyopen 2013, 2, 402–414. [Google Scholar] [CrossRef] [PubMed]
- Anderson, M.J.; Crist, T.O.; Chase, J.M.; Vellend, M.; Inouye, B.D.; Freestone, A.L.; Sanders, N.J.; Cornell, H.V.; Comita, L.S.; Davies, K.F.; et al. Navigating the multiple meanings of beta diversity: A roadmap for the practicing ecologist. Ecol. Lett. 2011, 14, 19–28. [Google Scholar] [CrossRef] [PubMed]
- Clark, K.; Karsch-Mizrachi, I.; Lipman, D.J.; Ostell, J.; Sayers, E.W. GenBank. Nucleic Acids Res. 2016, 44, D67–D72. [Google Scholar] [CrossRef] [PubMed]
- Oksanen, J.; Blanchet, F.G.; Kindt, R.; Legendre, P.; Minchin, P.R.; O’Hara, R.B.; Simpson, G.L.; Solymos, P.; Stevens, M.H.H.; Wagner, H. Vegan: Community Ecology Package. R Package Version 2.3-3. 2016. Available online: http://cran.r-project.org/package=vegan (accessed on 1 December 2018).
- Van de Peer Lab, Bioinformatics and Evolutionary Genome, 2018. Available online: http://bioinformatics.psb.ugent.be/beg/software?page=2 (accessed on 1 December 2018).
- R Core-Team. A Language and Environment for Statistical Computing; R Foundation for Statistical Computing: Vienna, Austria, 2015. [Google Scholar]
- CIPEL. Rapports de la Commission Internationale pour la Protection des eaux du Léman Contre la Pollution—Campagne 2013; CIPEL: Nyon, Switzerland, 2014. [Google Scholar]
- Brenda, K.; Lasorsa, G.A.G.; Horvat, M. Analytical methods for measuring mercury in water, sediment and Biota. In Mercury in the Environment; Bank, M.S., Ed.; University of California Press: Berkeley, CA, USA, 2012; pp. 27–54. [Google Scholar]
- Žižek, S.; Milacic, R.; Kovac, N.; Jacimovic, R.; Toman, M.J.; Horvat, M. Periphyton as a bioindicator of mercury pollution in a temperate torrential river ecosystem. Chemosphere 2011, 85, 883–891. [Google Scholar] [CrossRef] [PubMed]
- Osborn, A.M.; Bruce, K.D.; Strike, P.; Ritchie, D.A. Distribution, diversity and evolution of the bacterial mercury resistance (mer) operon. FEMS Microbiol. Rev. 1997, 19, 239–262. [Google Scholar] [CrossRef] [PubMed]
- Dash, H.R.; Das, S. Interaction between mercuric chloride and extracellular polymers of biofilm-forming mercury resistant marine bacterium Bacillus thuringiensis PW-05. RSC Adv. 2016, 6, 109793–109802. [Google Scholar] [CrossRef]
- Hamelin, S.; Planas, D.; Amyot, M. Mercury methylation and demethylation by periphyton biofilms and their host in a fluvial wetland of the St. Lawrence River (QC; Canada) Sci. Total Environ. 2015, 512–513, 464–471. [Google Scholar] [CrossRef] [PubMed]
- Olsen, T.A.; Brandt, C.C.; Brooks, S.C. Periphyton biofilms influence net methylmercury production in an industrially contaminated system. Environ. Sci. Technol. 2016, 50, 10843–10850. [Google Scholar] [CrossRef] [PubMed]
- Murthy, S.D.S.; Bukhov, N.G.; Mohanty, P. Mercury induced alterations of chlorophyll a fluorescence kinetics in Cyanobacteria—Multiple effects of mercury on electron transport. J. Photochem. Photobiol. Biol. 1990, 6, 373–380. [Google Scholar] [CrossRef]
- Kampnielsen, L. Effect of deleterious concentrations of mercury on photosynthesis and growth of Chlorella pyrenoidosa. Physiol. Plant. 1970, 24, 556–561. [Google Scholar] [CrossRef]
- Grégoire, D.S.; Poulain, A.J. A physiological role for Hg-II during phototrophic growth. Nat. Geosci. 2016, 9, 121–127. [Google Scholar] [CrossRef]
- Hiller-Bittrolff, K.; Foreman, K.; Bulseco-McKim, A.N.; Benoit, J.; Bowen, J.L. Effects of mercury addition on microbial community composition and nitrate removal inside permeable reactive barriers. Environ. Pollut. 2018, 242, 797–806. [Google Scholar] [CrossRef] [PubMed]
- Rasmussen, L.D.; Zawadsky, C.; Binnerup, S.J.; Oregaard, G.; Sorensen, S.J.; Kroer, N. Cultivation of hard-to-culture subsurface mercury-resistant bacteria and discovery of new merA gene sequences. Appl. Environ. Microbiol. 2008, 74, 3795–3803. [Google Scholar] [CrossRef] [PubMed]
- Lazaro, W.L.; Guimaraes, J.R.D.; Ignacio, A.R.A.; Da Silva, C.J.; Diez, S. Cyanobacteria enhance methylmercury production: A hypothesis tested in the periphyton of two lakes in the Pantanal floodplain, Brazil. Sci. Total Environ. 2013, 456–457, 231–238. [Google Scholar] [CrossRef] [PubMed]
Figure 1.
Concentrations of (I) total Hg and non-extractable IHg (n = 3), and (II) non-extractable MeHg (n = 3) as a function of the measured dissolved Hg concentrations. Letters (a, b, c and A, B) indicate significant differences between treatments for the studied characteristics (p < 0.05).
Figure 1.
Concentrations of (I) total Hg and non-extractable IHg (n = 3), and (II) non-extractable MeHg (n = 3) as a function of the measured dissolved Hg concentrations. Letters (a, b, c and A, B) indicate significant differences between treatments for the studied characteristics (p < 0.05).
Figure 2.
Composition of the control biofilm and biofilms grown in 11 ± 2 pM, 121 ± 9 pM and 1454 ± 54 pM Hg; (I) chlorophyll concentration (n = 3), (II) ash-free dry weight (AFDM) (n = 3), (III) surface coverage area (n = 10) and (IV) abiotic and biotic fractions (n = 10). Letters (a, b, c and A) indicate significant differences between treatments for the studied characteristics (p < 0.05).
Figure 3.
Venn diagram showing the shared and specific OTUs between control biofilm and biofilms grown in 11 ± 2 pM, 121 ± 9 pM, and 1454 ± 54 pM Hg and their composition at the phylum level; (I) and (II) bacteria, respectively, and (III) and (IV) microalgae, respectively.
Figure 3.
Venn diagram showing the shared and specific OTUs between control biofilm and biofilms grown in 11 ± 2 pM, 121 ± 9 pM, and 1454 ± 54 pM Hg and their composition at the phylum level; (I) and (II) bacteria, respectively, and (III) and (IV) microalgae, respectively.

Table 1.
Total sequences, OTUs and rarefied richness, Simpson’s diversity index and species turnover for bacteria and microalgae communities in biofilms grown without Hg addition (control), in 11 ± 2 pM, 121 ± 9 pM and 1454 ± 54 pM Hg.
Table 1.
Total sequences, OTUs and rarefied richness, Simpson’s diversity index and species turnover for bacteria and microalgae communities in biofilms grown without Hg addition (control), in 11 ± 2 pM, 121 ± 9 pM and 1454 ± 54 pM Hg.
| Taxa | Parameters | Control | 11 pM | 121 pM | 1454 pM |
|---|---|---|---|---|---|
| Bacteria | Total sequences | 1269 | 21,441 | 25,731 | 45,251 |
| OTUs richness | 209 | 224 | 229 | 291 | |
| Rarefied richness | 209 ± 1 | 191 ± 4 | 180 ± 5 | 210 ± 6 | |
| Simpson’s index | 0.97 | 0.96 | 0.94 | 0.97 | |
| Species turnover 1 | - | 0.65 | 0.63 | 0.63 | |
| Algae | Total sequences | 12023 | 2006 | 5624 | 1520 |
| OTUs richness | 71 | 48 | 63 | 48 | |
| Rarefied richness | 56 ± 2 | 46 ± 1 | 50 ± 5 | 48 ± 1 | |
| Simpson’s index | 0.87 | 0.77 | 0.92 | 0.85 | |
| Species turnover 1 | - | 0.41 | 0.28 | 0.37 |
1 Species turnover between control communities and those exposed to Hg.
© 2019 by the authors. Licensee MDPI, Basel, Switzerland. This article is an open access article distributed under the terms and conditions of the Creative Commons Attribution (CC BY) license (http://creativecommons.org/licenses/by/4.0/).
Share and Cite
MDPI and ACS Style
Dranguet, P.; Freiburghaus, A.; Slaveykova, V.I.; Le Faucheur, S. Long-Term Effects of Mercury on Biofilms Grown in Contaminated Microcosms: A Pilot Study. Environments 2019, 6, 28. https://doi.org/10.3390/environments6030028
AMA Style
Dranguet P, Freiburghaus A, Slaveykova VI, Le Faucheur S. Long-Term Effects of Mercury on Biofilms Grown in Contaminated Microcosms: A Pilot Study. Environments. 2019; 6(3):28. https://doi.org/10.3390/environments6030028
Chicago/Turabian StyleDranguet, Perrine, Aline Freiburghaus, Vera I. Slaveykova, and Séverine Le Faucheur. 2019. "Long-Term Effects of Mercury on Biofilms Grown in Contaminated Microcosms: A Pilot Study" Environments 6, no. 3: 28. https://doi.org/10.3390/environments6030028
Note that from the first issue of 2016, this journal uses article numbers instead of page numbers. See further details here.