Article

Assessment of Diatom Assemblages in Close Proximity to Mining Activities in Nunavik, Northern Quebec (Canada)

1
Institut national de la recherche scientifique, Centre Eau Terre Environnement; 490 rue de la Couronne, Québec, QC G1K 9A9, Canada
2
Irstea, UR EABX, 50 avenue de Verdun, 33612 Cestas CEDEX, France
*
Author to whom correspondence should be addressed.
Environments 2019, 6(6), 74; https://doi.org/10.3390/environments6060074
Submission received: 14 May 2019 / Revised: 12 June 2019 / Accepted: 14 June 2019 / Published: 21 June 2019
(This article belongs to the Special Issue Aquatic Microbial Ecotoxicology)

Abstract

:
Nunavik (Northern Quebec, Canada) is experiencing a mining boom. While several studies have been conducted in the region in relation to climate change, the effects of mining have received much less attention. In this study, we explored the use of biofilms in natural streams as an indicator of potential stress on living organisms caused by metal contamination from nickel mining activities. More specifically, we assessed diatom assemblages and the presence of teratologies (morphologic abnormalities) as a response to metals in streams located in close proximity to mining sites. Metal concentrations (as well as other cations), anions and pH values varied markedly among stations. Different diatom assemblage structures (four biotypes, i.e., groups of samples with similar diatom species composition) were observed depending on the level and the type of contamination. The frequency of diatom teratologies was higher in metal contaminated sites. The present study lays the foundation for bioassessment of metal contamination in low Arctic streams using diatom-based approaches, and will serve as a point in time reference for future evaluation of ecosystems degradation or recovery in Nunavik.

1. Introduction

Northern regions of Canada are generally undeveloped vast and pristine environments that have been so far minimally impacted by direct human activities. Located north of the 55° N latitude, Nunavik is a 444,000 km2 metal-rich area in the province of Quebec (Canada). The mining industry is the main economic activity in the region and an important employer of Inuit communities. Current and planned mining expansion in Nunavik may, however, pose a threat to the integrity of the region and its biota. In particular, aquatic environments may be subjected to environmental pressures related to wastewater mining effluents. Mining companies are nowadays obligated to comply with stricter environmental regulations under the Canadian Mining Act to ensure proper monitoring during operation activities as well as site rehabilitation after mine closure. Environmental monitoring is generally based on physico-chemical measurements and bioassays (single species or multi-species toxicity tests) performed on mining effluents to verify that wastewaters meet established water quality guidelines. Routine physico-chemical monitoring (surface waters and wastewater effluents) does not, however, provide information regarding the effect of contaminants on the biota and does not account for temporal variability, bioavailability of chemicals, and additive and synergistic effects of environmental stressors such as inorganic and organic contamination, increased salinity, eutrophication, warmer water temperature, etc. [1]. Toxicity tests also have their limitations as they are often performed on species that are not necessarily relevant to the region of interest and bioassays performed on wastewater effluents may not be representative of the conditions found in the receiving natural aquatic ecosystems.
In this study, we explored the use of biofilms in natural streams as an indicator of potential stress caused by metal contamination from nickel mining activities in Nunavik. More specifically, we assessed diatom assemblages and the presence of teratologies (morphologic abnormalities) as a response to metals in streams located in close proximity to mining sites. Diatoms are widely used in routine stream biomonitoring for overall water quality assessment (e.g., IPS: Indice de Polluosensibilité Spécifique [2]; IDEC: Indice Diatomées de l’Est du Canada [3,4]) and for identifying inorganic and organic contamination based on various descriptors such as the presence of teratologies, tolerant species, or other physiological and molecular responses (e.g., [5,6,7]). While these indicators and biomarkers have often been used in temperate and tropical regions, their use in low Arctic streams is scarce and information is lacking, for example, regarding tolerant diatom species. This remote northern region is ideal for assessing metal contamination on the biota as other anthropogenic stressors (e.g., eutrophication) are limited, which reduces confounding effects from several types of perturbations.

2. Materials and Methods
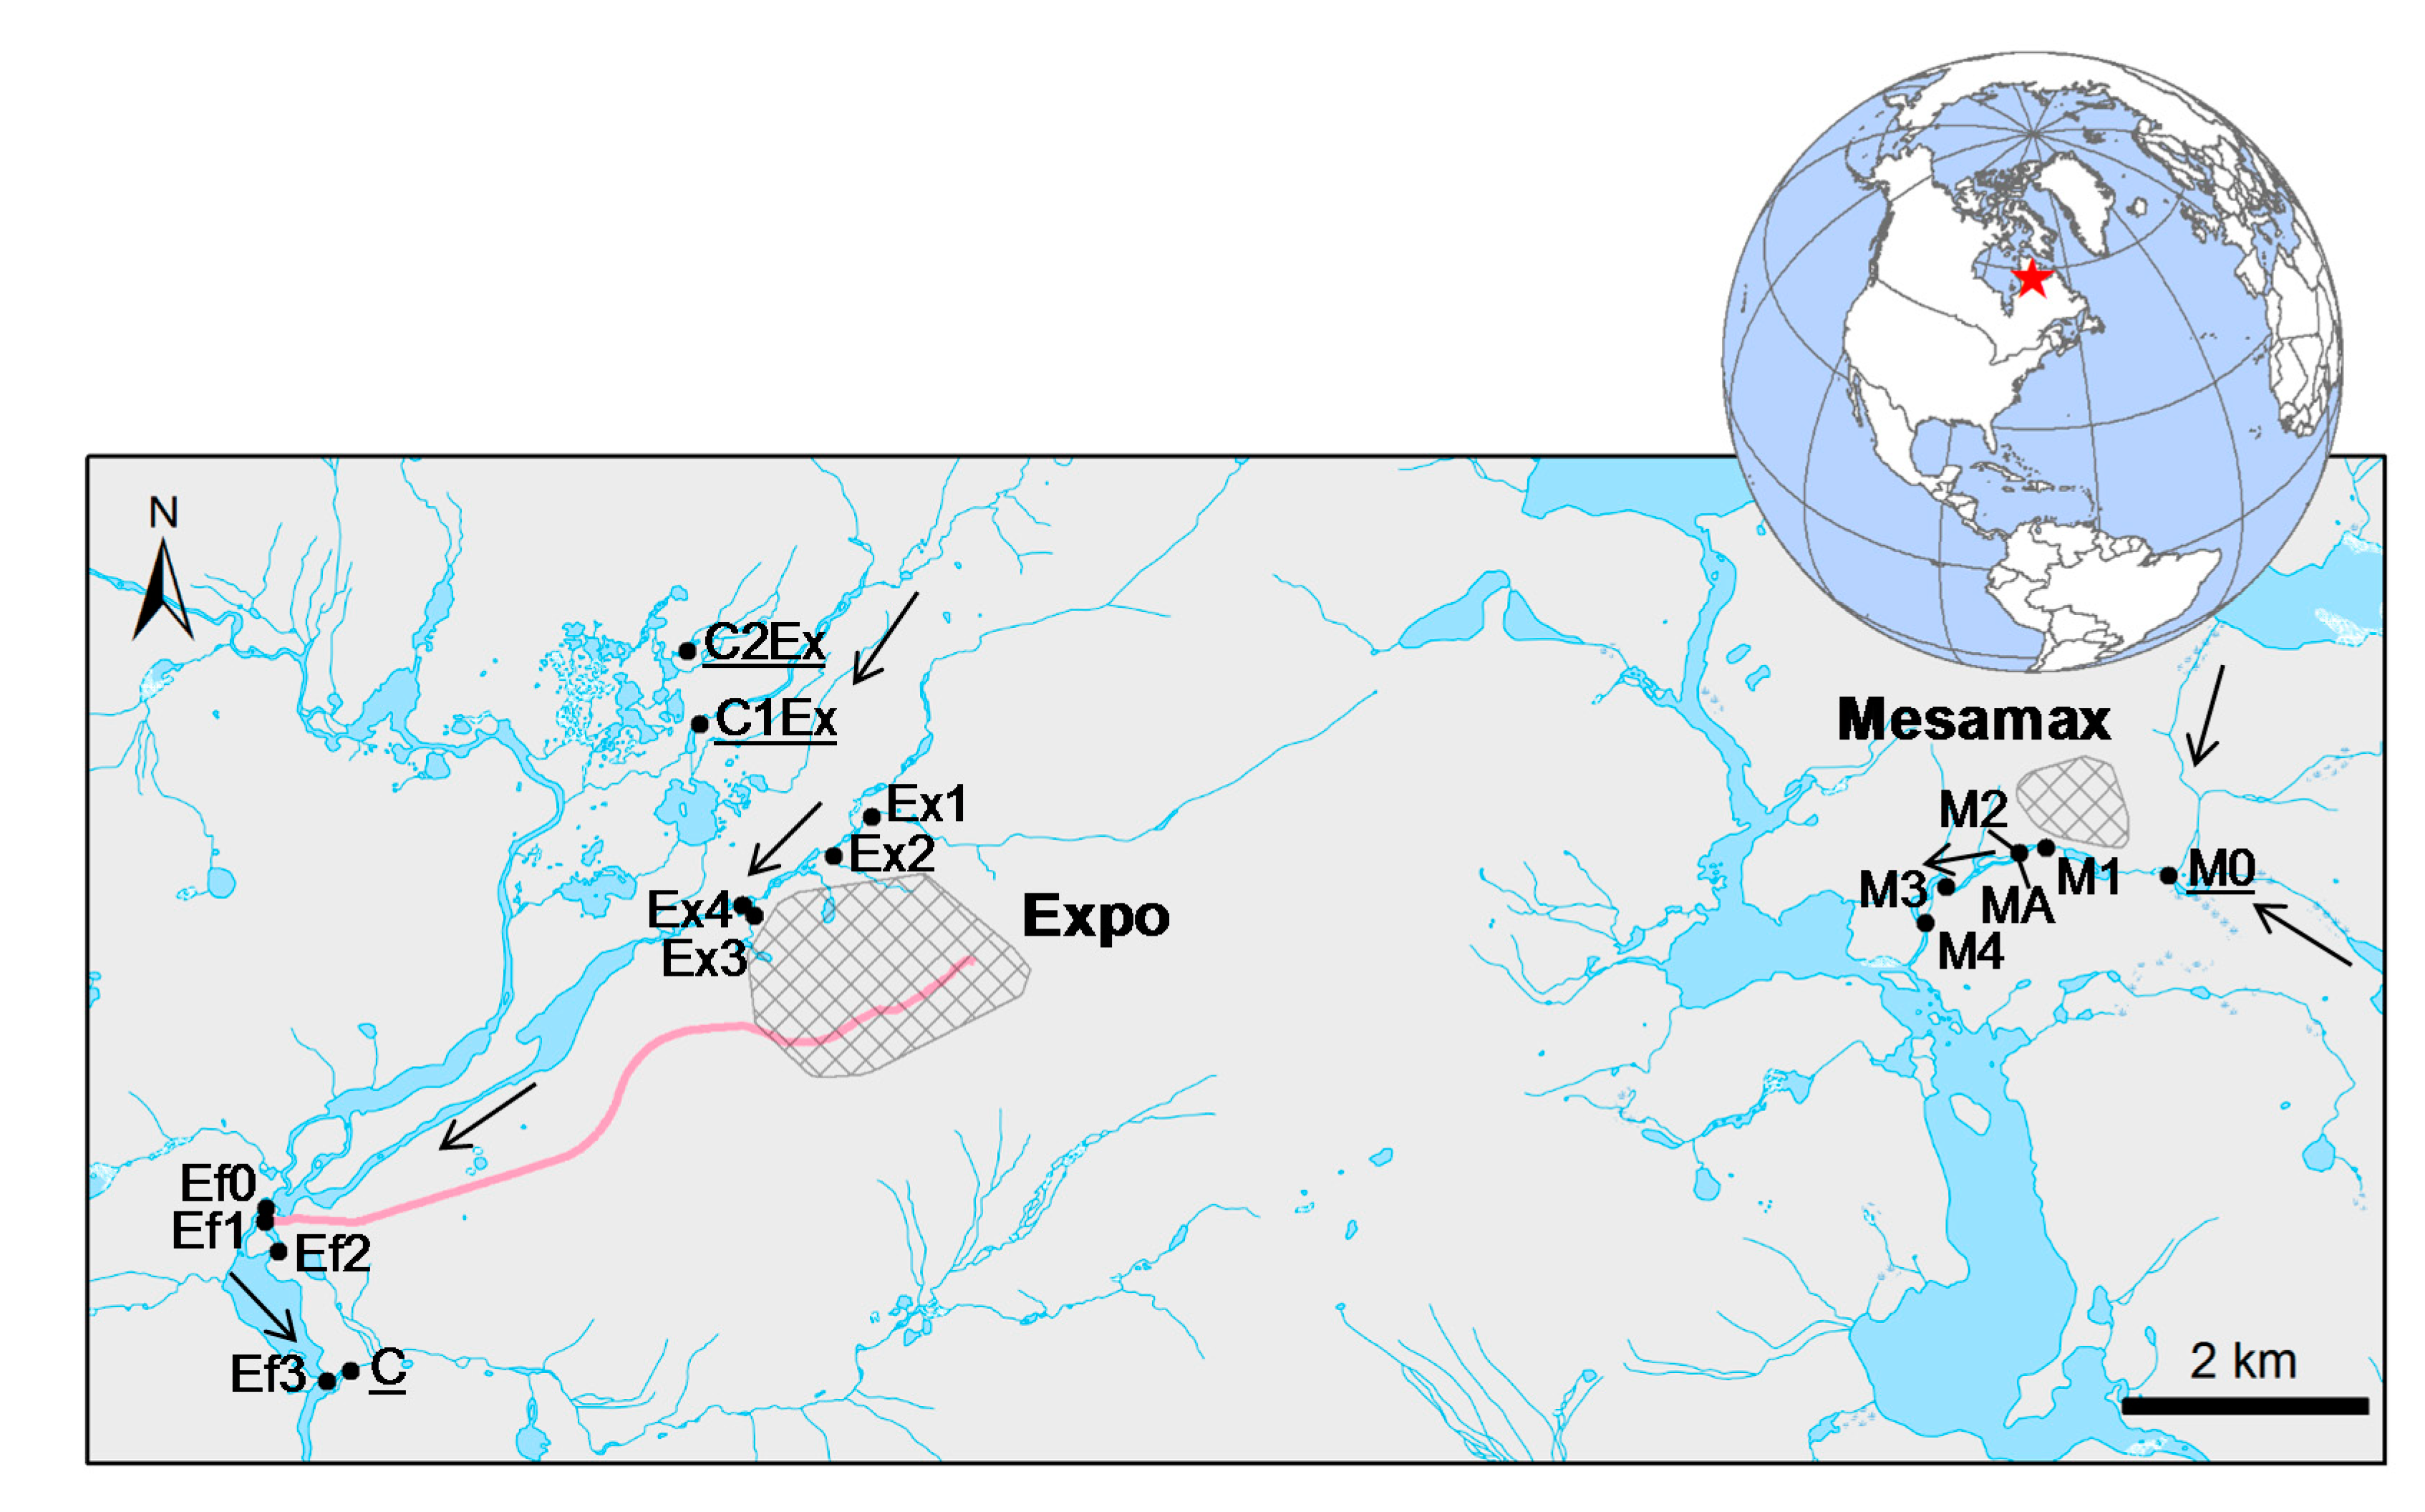
2.1. Study Area

The sites selected for this study were located on the Nunavik Nickel Inc. mining complex. The Nunavik Nickel mine is located in Northern Quebec, 82 km west of Kangiqsujuaq and 140 km south-east of Salluit. Mining activities started in 2012. Two sites (open pits; Mesamax and Expo) were in activity at the time of the study (2014–2016), each one discharging wastewater effluents (June to September) from independent treatment facilities into different tributaries of the Puvirnituq River (Figure 1). Sampling stations (16 or 17, depending on the sampling campaign) were selected along a metal concentration gradient, including reference stations (controls). The treated wastewater effluents from the Expo site were released about 5 km from the Expo site in a tributary of the Puvirnituq River, where three sampling stations were located along a 1.4 km gradient (stations Ef1 to Ef3). Station Ef0 was positioned upstream of the treated water effluent but may have been affected by nonpoint source contamination from the Expo site. A control station was sampled in a tributary located in close proximity (station C). Four sampling stations were selected in small watercourses near the Expo site tailing ponds to monitor potential nonpoint source contamination (Ex1 to Ex4). Two additional control stations were positioned in a river about 1.5 km north from mining activities (C1Ex and C2Ex). At the Mesamax site, five sampling stations were positioned along a potential gradient of metal contamination in another tributary of the Puvirnituq River, from the wastewater effluent to 1.2 km downstream (stations M1 to M4 and MA). Station M1 was located in close proximity to the Mesamax site but did not receive treated wastewater effluents. Station MA was added in 2015 (a few meters from M2) to be within the plume of the wastewater effluents from Mesamax. A control station was also sampled in this tributary, upstream of the mining effluent (station M0).

2.2. Water and Biofilm Collection

Water and biofilm samples were collected six times, in early July and in late August of 2014, 2015 and 2016 to assess seasonal and annual variability in metal concentrations and in diatom assemblages. We added a number to indicate the year of sampling (1 = 2014; 2 = 2015; 3 = 2016) and a letter for the period (early July = a; late August = b). Samples for water chemistry analyses were collected in triplicates at each site (along with field blanks) and were kept cold until they were processed. Material used for collecting cations analyses was previously soaked in nitric acid 10% (v/v) for 24 h, and rinsed eight times with ultrapure water. Material used for anions was rinsed eight times with ultrapure water. Water for anions, cations, and dissolved organic carbon (DOC) was collected in 20 mL polypropylene Nalgene bottles using syringes and polysulfonate filters (0.45 μm; VWR International, Radnor, PA, USA). Samples collected for cations analyses were acidified to 0.27% nitric acid (v/v) (trace metal grade; Fisher Scientific, Pittsburgh, PA, USA). Conductivity, temperature and pH were measured on-site using portable instruments (Conductivity/temperature meter, Mettler Toledo, Greifensee, Switzerland; SevenGo SG3; pH/mV-meter Denver Instrument Model 10, Bohemia, NY, USA). Biofilms were collected from the top surface of 5–10 rocks (composite samples) using a new toothbrush at each station.

2.3. Water Chemistry and Diatom Assemblage Analyses

Anions (Cl, SO42−, NO3, PO43−) were analysed by ion chromatography (Dionex AutoIon System DX300, Sunnyvale, CA, USA), and DOC was analyzed using a total organic carbon analyzer (TOC-500A; Shimadzu, Kyoto, Japan). Cations (Na+, Mg2+, Al3+, K+, Ca2+, Mn2+, Fe3+, Ni2+, Cu2+, Zn2+, Pb2+) were analyzed by inductively coupled plasma-atomic emission spectrometry (ICP-AES; Varian Vista AX CCD, Palo Altro, CA, USA). Copper, cadmium and lead were also analyzed by ICP-mass spectrometry (Thermo instrument model X7, Waltham, MA, USA). Certified controls (900Q30.100, SCP Science, Baie d’Urfé, QC, Canada; FP95-06, Environment Canada Proficiency Testing Program) were used with both ICP-MS and ICP-AES. Zinc and lead were excluded for data interpretation and discussion in this study because almost all field sample concentrations were inferior to the field blank for these metals.
Biofilms were digested to remove organic content and clean diatom frustules from cell content. Subsamples of lyophilized biofilms were placed in 800 μL of 100 % (v/v) nitric acid for 48 h, and 200 μL of hydrogen peroxide 100% (v/v) were added for another 48 h. After complete digestion of organic material, samples were rinsed several times to remove nitric acid and bring pH to a value above 6. Microscope slides were prepared for diatom observation using Naphrax® as the mounting medium. Diatom assemblages were observed under a ReichertJung Polyvar microscope equipped with differential interference contrast and a digital camera. A minimum of 400 diatom valves were identified on each slide and diatom assemblages were expressed as relative abundances. For the purpose of statistical analyses, taxa that did not reach 1% relative abundance in at least one sample were excluded. Abnormal diatom valves were counted only when clear deformities were observed, i.e., ambiguous specimens of small cell-size potentially showing subtle aberrations were not considered.
Spatio-temporal distribution of diatom assemblages was assessed by plotting biotypes (groups of samples with similar diatom composition) on a Principal Component Analysis (PCA). Biotypes were determined based on Self-Organizing Maps (SOM) conducted using the freeware R and the SOM package [8], while the PCA was conducted using Canoco 4.5 (Microcomputer Power, New York, NY, USA) [9]. Box-plots were created using R [10] and were used to visually represent the distribution of water chemistry values for each biotype.

3. Results and Discussion

3.1. Water Chemistry Values

Dissolved metal concentrations varied markedly among sites for Ni, Cu and Cd. Large differences were also observed for other cations, as well as for anions and pH values (Table 1). Measured concentrations of Ni, Cu and Cd were low at all control sites. Elevated concentrations were measured at Expo sites nearby the mining facilities (Ex2 to Ex4). The highest average concentrations were found at Ex3 (respectively 0.68 ± 0.48 mM Ni, 0.17 ± 0.13 mM Cu, and 0.21 ± 0.29 µM Cd). Ef0 was located a few meters upstream of the Expo site effluent discharge point and presented metal concentrations markedly higher than control stations. These elevated concentrations resulted from nonpoint source contamination from Ex2, Ex3 and Ex4 located ~6 km upstream. Metal concentrations at Expo effluent sites Ef1 to Ef3 reflected the combined inputs from the upstream Expo stations (Ex2 to Ex4) and the direct discharge of the wastewater effluent. Station Ef3 was located much further downstream from Ef2 and Ef1 and showed a significant decrease in metal concentrations. Station M1, located upstream of the wastewater effluent but in very close proximity to the Mesamax mining installation, presented concentrations similar to control sites. This result suggests that runoff inputs and the proximity of anthropic activity did not have marked impacts on metal concentrations at this station. Concentrations in Ni and Cu at the Mesamax stations M3 and M4 were higher than at the control stations, but were much less than the values observed in proximity of the Expo site.
The lowest pH values (below 5) were recorded at Ex2, Ex3 and Ex4 while the other stations generally showed values above 6. Certain structures at the Expo site were built with tailings, which could be a source of acid drainage partly explaining the low pH values at the stations located in close proximity. Major cations were at the lowest for control stations, and the highest concentrations were measured at Ex2, Ex3 and Ex4. Although lower than at the Expo stations (Ex_ and Ef_), major cations were still elevated at Ef0 which again suggests nonpoint source contamination from upstream. Chlorides were elevated at Ex3 and more particularly at Mesamax stations, even at M0 located upstream of the treated wastewater effluent. Nitrates were present in high concentrations at Ex2, Ex4, Ef1 and MA. High nitrate concentrations may result from explosive residues used for the pit construction and metal extraction. Low nitrate concentrations were observed at all control stations, except for M0 located in close proximity to the Mesamax site suggesting some nonpoint source input. Average phosphate concentrations were relatively comparable between the sampling stations, expect for Ex3 and Ex4C where slightly higher concentrations were observed (but still in the same order of magnitude).

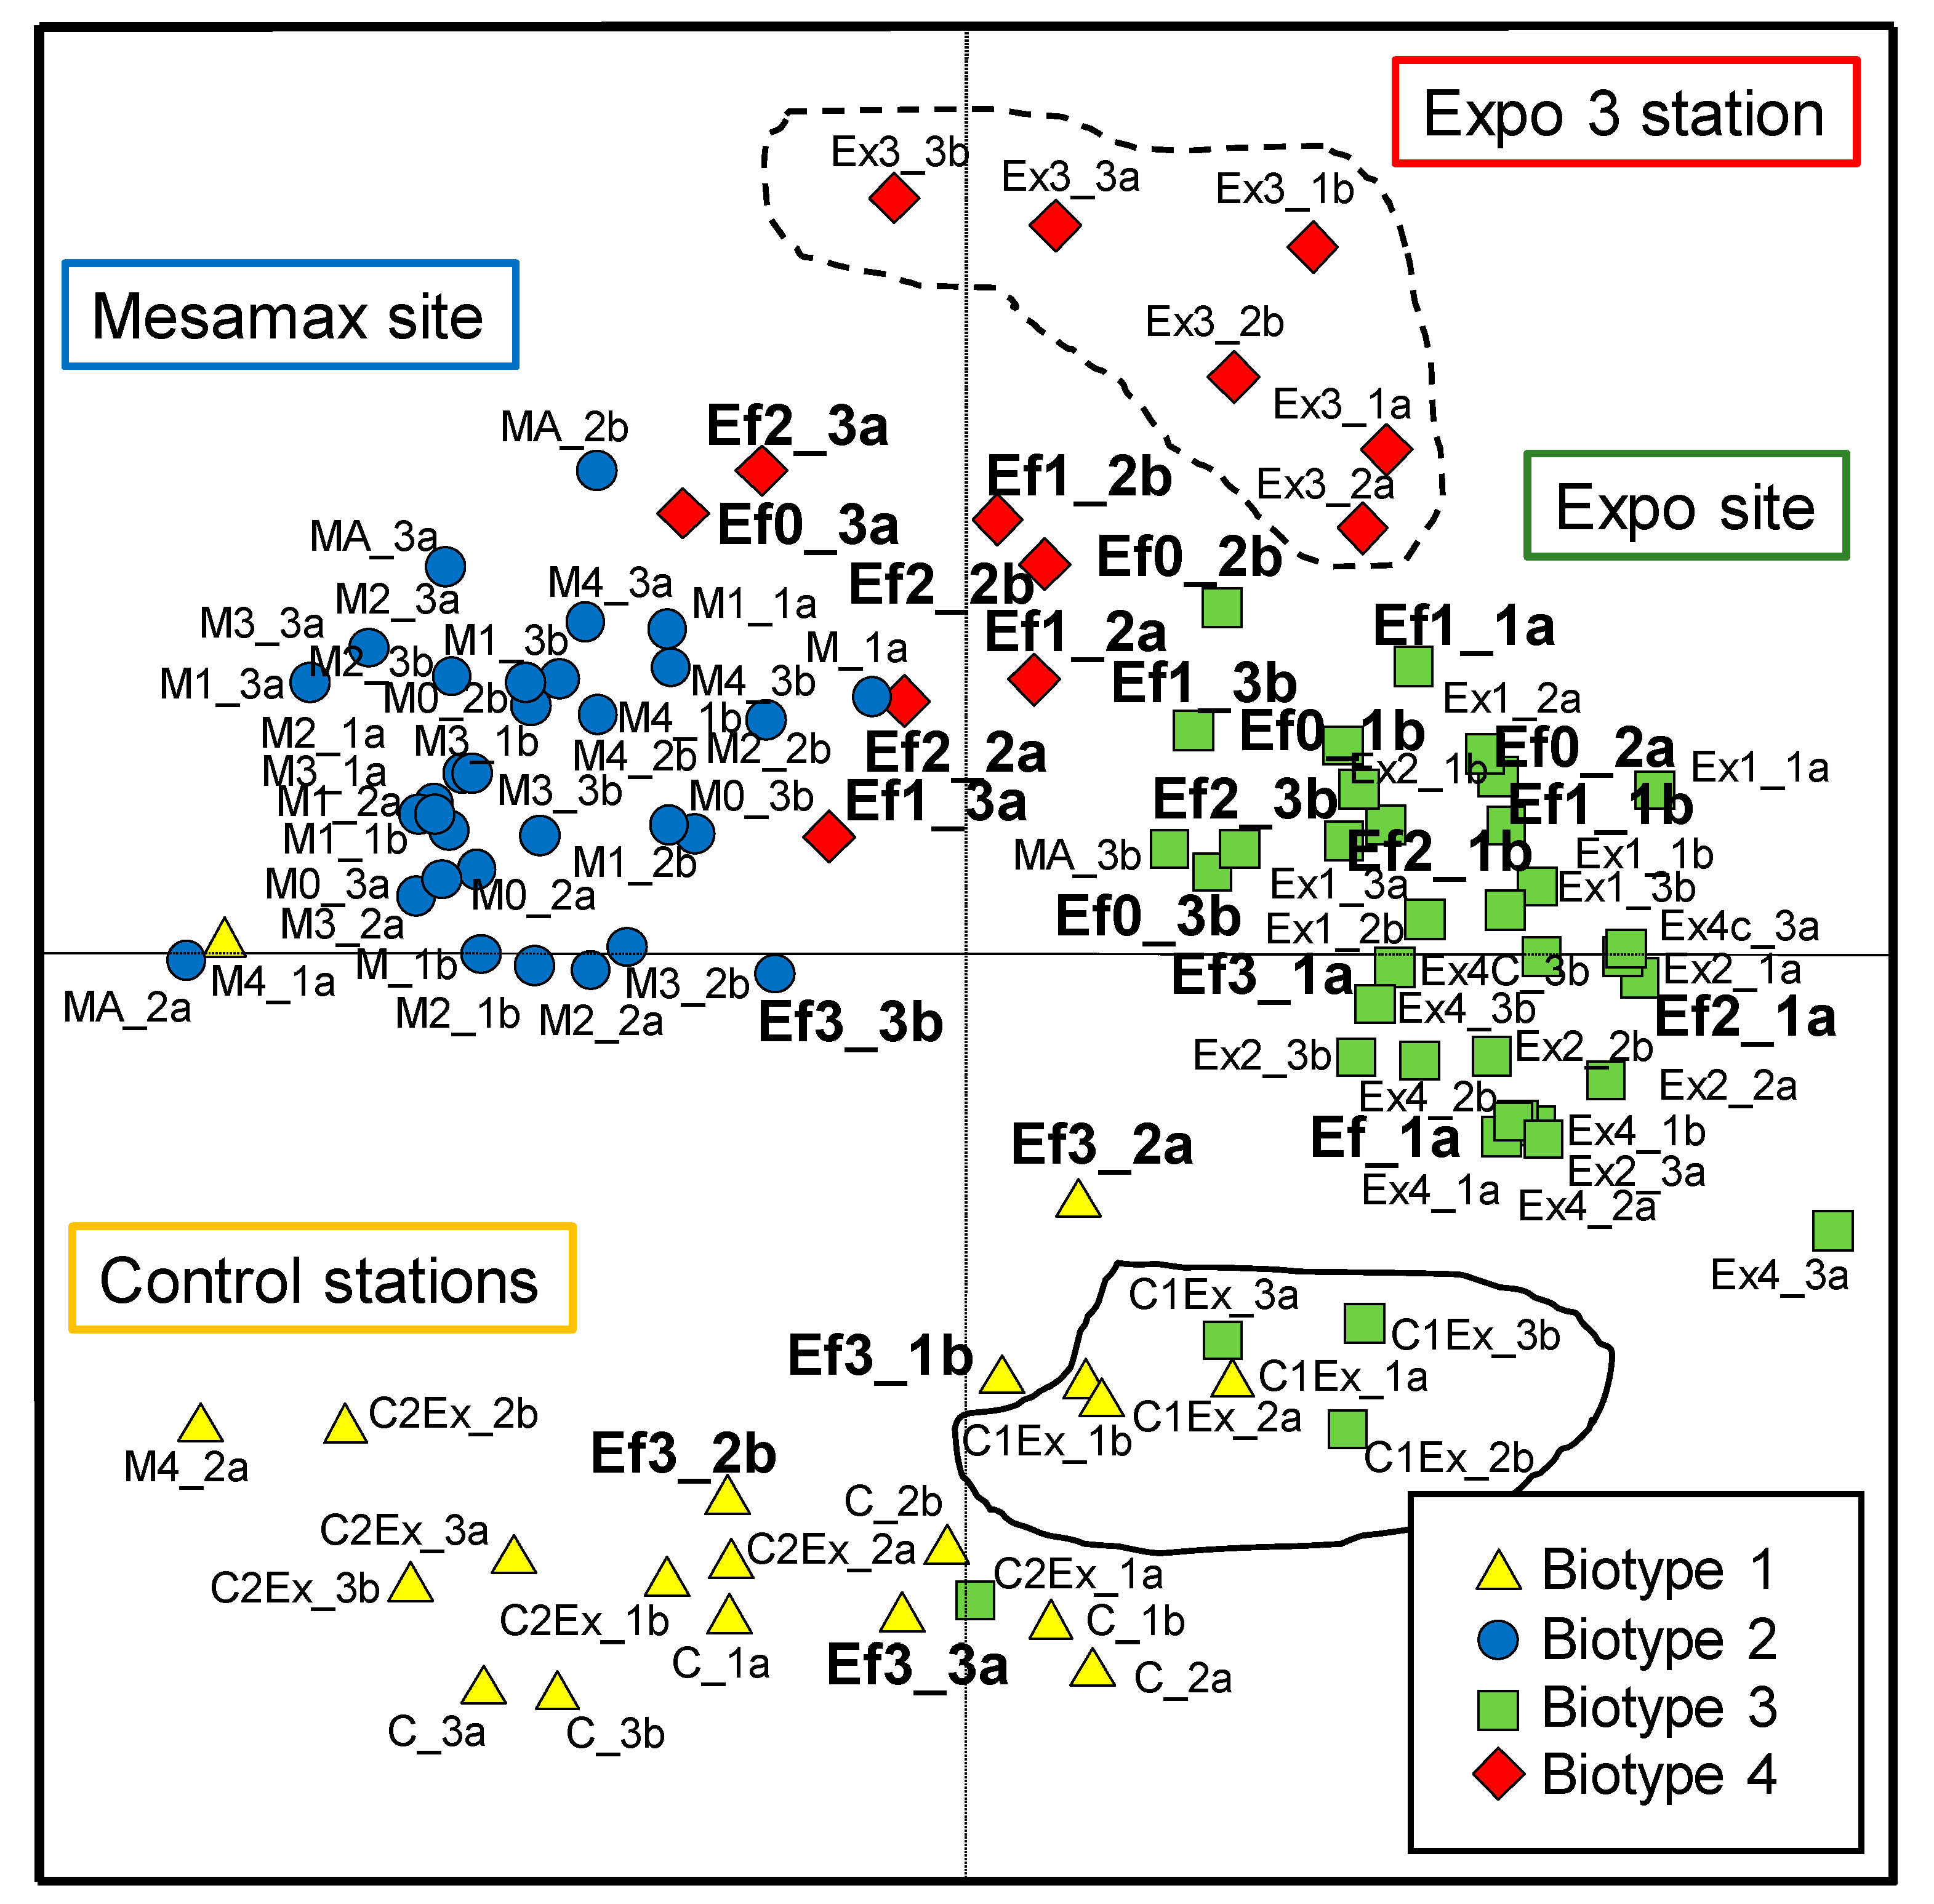
3.2. Diatom Assemblages and Biotypes

A total of 176 diatom taxa were identified among the 99 samples collected, with species identified as Achnanthidium minutissimum complex and Fragilaria capucina complex the most dominant and frequent taxa observed across the study area. After applying the 1% cut-off criterion to reduce the number of rare taxa included in the analyses, the diatom dataset was composed of 87 taxa including species identified to the species level as well as species complexes and certain identifications to the genus level.
Based on sample classification from the SOM, a total of four biotypes was selected as the most appropriate number of groups for this dataset (more biotypes resulted in low number of samples in each group). The four biotypes represent groups of samples that were similar in terms of diatom assemblages and mainly reflect water chemistry characteristics. In other words, variability associated with factors such as the spatial localisation of the sampling stations, stream order, water velocity, and sampling depth did not seem to be the main structuring components of the biotypes. In particular, the control stations were positioned in different watercourses and presented similar diatom assemblages (biotype 1) due to comparable water chemistry. Similarly, station Ex3 was positioned on a very small tributary while stations Ef0, Ef1 and Ef2 were located on a much larger watercourse; on several occasions their diatom assemblages still grouped together in biotype 4 as a result of comparable chemical characteristics.
The PCA presented in Figure 2 shows the spatial and temporal distribution of the diatom samples that were color-coded as a function of their belonging biotypes (created using SOMs). Biotype 1 (yellow triangles) included all samples collected at our control stations, biotype 2 (blue circles) mainly contained samples collected at stations located around the Mesamax site, biotype 3 (green squares) grouped most samples from Ex_ and Ef_, and finally biotype 4 (red diamonds) was a mixture of samples from Ex3, Ef1 and Ef2. As a general trend, a station belonged to the same biotype throughout the study, regardless of the sampling period (July versus August or the year of collection). For example, all six samples collected at Ex3 (Figure 2, circled with a dashed line) belonged to biotype 4 (red diamonds) and clustered together on the PCA, suggesting minimal change in diatom assemblage structure over time. The stations circled with the solid line belonged to biotypes 1 and 3, but the assemblages were still relatively similar as they clustered in close proximity on the PCA plot. This result reflects stability in diatom assemblage composition despite some fluctuating environmental conditions. This does not imply that diatom assemblage structure did not vary over time, but it suggests that this within-station variability (seasonal and annual variability) is generally less than the variability between biotypes. Only the sampling stations positioned to monitor the effects of the treated effluents from the Expo site (Ef0 to Ef3) were attributed to different biotypes depending on the location of the stations and the sampling period (Figure 2, samples in bold). This result was expected as stations selected to monitor the effects of the treated wastewaters from the Expo site are located either just upstream of the effluent, just after the effluents or at different distances further downstream. The gradient in metal concentrations was thus more important for the Ef stations which may explain that the diatom assemblages showed higher spatio-temporal variability. For example, station Ef3 is located further downstream from the mine effluent and had, depending on the sampling period, similar diatom assemblages as the control stations.

3.3. Diatom Assemblages versus Water Chemistry, Tolerant Taxa and Teratologies

Box-plots (Figure 3) show that biotype 4 (red diamonds) is characterized by the highest metal concentrations (Ni, Cu, Cd). This biotype also corresponded to higher Mg concentrations and lower pH. The diatom assemblages composing biotype 4 are thus characteristic of the most degraded conditions encountered in this study. Biotype 1 (yellow triangles) corresponded to water chemistry measurements with the lowest values for Cl, Mg, NO3 and metals and included diatom samples generally collected at our control stations.
Although distinct diatom assemblage structures were observed as shown by the sample distribution on the PCA and by the distinct biotypes, sample clustering was mainly due to changes in relative abundances of the taxa rather than marked changes in the taxa present in a sample. In other words, several taxa were observed in all samples, but their relative abundances varied. For this reason, it is difficult to identify metal tolerant taxa with certitude, but certain trends may still be suggested. For example, the ubiquitous complex Achnanthidium minutissimum was by far the most dominant taxa (abundance and occurrence) found in this study. However, A. minutissimum reached its highest abundances in samples belonging to biotypes 3 and 4, which were collected at the stations with the highest metal concentrations. Several studies on metal contamination reported the tolerance of this species to high metal concentrations [5,11,12] and it seems that the different varieties of A. minutissimum observed in these low Arctic streams also show similar tolerance. Hygropetra balfouriana was more abundant in the samples belonging to biotype 4 collected in the most severely degraded conditions (higher metal concentrations, lower pH). H. balfouriana is an acidophilic epiphytic species (often associated to mosses), which correspond to the lower pH values observed at the time samples composing biotype 4 were collected (Figure 3). We were not able to find information on the tolerance of H. balfouriana in the literature, but its presence in our most contaminated stations suggests that this species can tolerate metals. Rossithidium petersenii was abundant in biotype 2. According to previous findings, this species is mainly epiphytic (mosses) and can withstand periodic desiccation [13,14,15]. R. petersenii prefers low conductivity and low to circumneutral pH [16,17]. In addition, based on the results from the present study, this species seems to tolerate moderate to low concentrations of metals. The Fragilaria capucina complex was also found in high abundances in samples composing biotype 2. This taxon was often reported as tolerant to metals [5]. Most samples from Biotype 2 were collected at the Mesamax site, where concentrations in metals were lower than at the sampling stations from the Expo site. Tabellaria flocculosa, which was mainly abundant at control stations (biotype 1) and in samples collected at stations with low metal concentrations (biotype 2, Mesamax site), was previously reported as a species sensitive to metals [5,18], which is consistent with the fact that it was rarely found in samples from biotypes 3 and 4.
The presence of deformities did not show a clear trend among the different sampling stations along the metal contamination gradient. However, we observed a significantly higher (unilateral T-test; p < 0.05) proportion of teratologies at the contaminated stations versus the control stations (Figure 4). It is worth mentioning that the teratologies were also sometimes very difficult to assess (small taxa) and, therefore, certain subtle aberrations may have been missed [19] as we were conservative in our evaluation. A lack of relationship between % teratologies and a gradient in metal contamination was previously reported, but deformities were still observed in higher proportions in contaminated sites compared to reference (e.g., [11,20,21]). As a general trend, we tended to observe more teratologies at the Mesamax stations, which is surprising considering that the samples collected around the Expo site had higher metal concentrations. Because water samples were collected once in July and once in August of 2014, 2015 and 2016, it is possible that higher metal concentrations at the Mesamax stations were simply missed and that diatom assemblages integrated temporal fluctuations, resulting in more deformities than expected based on chemistry measurements. It is also possible that hardness (Mg and Ca cations) and protons (low pH) played a protective role on metal bioaccumulation by biofilms (by competing with metals for uptake sites), resulting in a lower frequency of teratologies observed at the most contaminated Expo stations compared with the less contaminated stations in proximity to the Mesamax site. Low metal toxicity and low frequencies of teratologies have been found in other studies in environments with low pH and elevated concentrations of protective cations such as Mg and Ca (e.g., [11,22,23]).

3.4. Diatom-Based Monitoring North of the 49th Parallel

Nunavik, as many of Canada’s Northern regions, is experiencing a mining boom. North of the 49° N latitude, through its “North Plan” (Plan Nord, launched in 2011), the Quebec government promotes a sustainable economic, social and environmental development of Northern Quebec, especially in the field of mining, which already represents a major component of the economy in the region. While great potential for mining development exists, the actions undertaken will have impacts on ecosystems, particularly waterbodies receiving mining effluents and nonpoint source contamination. It is thus important to adequately quantify environmental effects on the biota caused by the mining industry by developing reliable biomonitoring approaches and protocols. While numerous studies have been conducted in the region to assess environmental fluctuations in relation to climate change, there is a paucity of information on the effects of mining, and on stream biological integrity in general. The findings from this study suggest that diatoms from watercourses in the low Arctic respond to changes in water chemistry related to mining activities, which was also observed by numerous authors in different types of temperate, Mediterranean and tropical environments (e.g., [24,25,26,27,28]). One interesting aspect of our study is the fact that low Arctic freshwater ecosystems are mostly pristine and are not (or minimally) impacted by other human activities than mining. In this respect, diatom assemblages were not subjected to multiple stressors that may exacerbate the effects of metal contamination. The present study lays the foundation for bioassessment of metal contamination in low Arctic streams using diatom-based approaches, and will serve as a point in time reference for future evaluation of ecosystems degradation or recovery in Nunavik.

Author Contributions

Each author made substantial contributions to this paper. I.L. was involved in sampling, diatom assemblage analyses, data processing and writing. S.M. and C.F. were involved in the original project conception and the draft preparation, writing, review and editing. V.L. and L-E.P. were involved in sampling and sample processing for metal concentration measurements. C.F. was responsible for funding acquisition and for project administration.

Funding

Financial support from the Fonds de recherche du Québec–Nature et technologies (2014-MI-183237) is gratefully acknowledged. C.F. is supported by the Canada Research Chair Program (950-231107).

Acknowledgments

The authors would like to thank Nunavik Nickel for providing logistic support during sampling (air transportation to the mining site, accommodation, etc). Special thanks to Jimmy Poulin for creating the map, to Caroline Doose for putting together the box-plots and to Sandra Kim Tiam for her assistance during sampling.

Conflicts of Interest

The authors declare no conflict of interest.

References

  1. Wah Chu, K.; Chow, K.L. Synergistic toxicity of multiple heavy metals is revealed by a biological assay using a nematode and its transgenic derivative. Aquat. Toxicol. 2002, 61, 53–64. [Google Scholar] [CrossRef]
  2. Prygiel, J.; Coste, M. Mise au point de l’Indice Biologique Diatomée, un indice diatomique pratique applicable au réseau hydrographique français. Eau Ind. Nuis. 1998, 211, 40–45. [Google Scholar]
  3. Lavoie, I.; Campeau, S.; Grenier, M.; Dillon, P.J. A diatom-based index for the biological assessment of eastern Canadian rivers: An application of correspondence analysis (CA). Can. J. Fish. Aquat. Sci. 2006, 63, 1793–1811. [Google Scholar] [CrossRef]
  4. Lavoie, I.; Campeau, S.; Zugic-Drakulic, N.; Winter, J.G.; Fortin, C. Using diatoms to monitor stream biological integrity in Eastern Canada: An overview of 10 years of index development and ongoing challenges. Sci. Total Environ. 2014, 475, 187–200. [Google Scholar] [CrossRef] [PubMed]
  5. Morin, S.; Cordonier, A.; Lavoie, I.; Arini, A.; Blanco, S.; Duong, T.T.; Tornés, E.; Bonet, B.; Corcoll, N.; Faggiano, L.; et al. Consistency in diatom response to metal-contaminated environments. In Handbook of Environmental Chemistry; Guasch, H., Ginebreda, A., Geiszinger, A., Eds.; Springer: Heidelberg, Germany, 2012; Volume 19, pp. 117–146. [Google Scholar]
  6. Lavoie, I.; Hamilton, P.B.; Morin, S.; Kim Tiam, S.; Kahlert, M.; Gonçalves, S.; Falasco, E.; Fortin, C.; Gontero, B.; Heudre, D.; et al. Diatom teratologies as biomarkers of contamination: Are all deformities ecologically meaningful? Ecol. Indic. 2017, 82, 539–550. [Google Scholar] [CrossRef]
  7. Debenest, T.; Silvestre, J.; Coste, M.; Delmas, F.; Pinelli, E. Herbicide effects on freshwater benthic diatoms: Induction of nucleus alterations and silica cell wall abnormalities. Aquat. Toxicol. 2008, 88, 88–94. [Google Scholar] [CrossRef] [Green Version]
  8. Bottin, M.; Giraudel, J.-L.; Lek, S.; Tison-Rosebery, J. diatSOM: A R-package for diatom biotypology using self-organizing maps. Diatom Res. 2014, 29, 5–9. [Google Scholar] [CrossRef]
  9. Ter Braak, C.J.F.; Smilauer, P. CANOCO Reference Manual and CanoDraw for Windows User’s Guide: Software for Canonical Community Ordination (Version 4.5); Biometris: Wageningen, The Netherlands, 2002. [Google Scholar]
  10. Team, R.C. R: A Language and Environment for Statistical Computing; R Foundation for Statistical Computing: Vienna, Austria, 2015. [Google Scholar]
  11. Leguay, S.; Lavoie, I.; Levy, J.L.; Fortin, C. Using biofilms for monitoring metal contamination in lotic ecosystems: The protective effects of hardness and pH on metal bioaccumulation. Environ. Toxicol. Chem. 2016, 35, 1489–1501. [Google Scholar] [CrossRef] [PubMed]
  12. Cantonati, M.; Angeli, N.; Virtanen, L.; Wojtal, A.Z.; Gabriell, J.; Falasco, E.; Lavoie, I.; Morin, S.; Marchetoo, A.; Fortin, C.; et al. Achnanthidium minutissimum (Bacillariophyta) valve deformities as indicators of metal enrichment in diverse widely-distributed freshwater habitats. Sci. Total Environ. 2014, 75, 201–215. [Google Scholar] [CrossRef]
  13. Antoniades, D.; Douglas, M.S.V. Characterization of High Arctic stream diatom assemblages from Cornwallis Island, Nunavut, Canada. Can. J. Bot. 2002, 80, 50–58. [Google Scholar] [CrossRef]
  14. Michelutti, N.; Holtham, A.J.; Douglas, M.S.V.; Smol, J.P. Periphytic diatom assemblages from ultra-oligotrophic and UV transparent lakes and ponds on Victoria Island and comparisons with other diatom surveys in the Canadian Arctic. J. Phycol. 2003, 39, 465–480. [Google Scholar] [CrossRef]
  15. Van De Vijver, B.; Van Kerckvoorde, A.; Beyens, L. Freshwater and terrestrial moss diatom assemblages of the Cambridge Bay area, Victoria Island (Nunavut, Canada). Nova Hedwigia. 2003, 76, 225–243. [Google Scholar] [CrossRef]
  16. Van Dam, H.; Merten, S.A.; Sinkeldam, J. A coded checklist and ecological indicator values of freshwater diatoms from the Netherlands. Neth. J. Aquat. Ecol. 1994, 28, 117–133. [Google Scholar]
  17. Keatley, B.E.; Douglas, M.S.V.; Smol, J.P. Evaluating the influence of environmental and spatial variables on diatom species distributions from Melville Island (Canadian High Arctic) lakes and ponds. Botany 2008, 86, 76–90. [Google Scholar] [CrossRef]
  18. Cattaneo, A.; Couillard, Y.; Wunsam, S.; Courcelles, M. Diatom taxonomic and morphological changes as indicators of metal pollution and recovery in Lac Dufault (Québec, Canada). J. Paleolimnol. 2004, 32, 163–175. [Google Scholar] [CrossRef]
  19. Morin, S.; Coste, M.; Hamilton, P.B. Scanning electron microscopy observations of deformities in small pennate diatoms exposed to high cadmium concentrations. J. Phycol. 2008, 44, 1512–1518. [Google Scholar] [CrossRef] [PubMed]
  20. Lavoie, I.; Lavoie, M.; Fortin, C. A mine of information: Benthic algal communities as biomonitors of metal contamination from abandoned tailings. Sci. Total Environ. 2012, 425, 231–241. [Google Scholar] [CrossRef]
  21. Lavoie, I.; Morin, S.; Laderriere, V.; Fortin, C. Freshwater diatoms as indicators of combined long-term mining and urban stressors in Junction creek (Ontario, Canada). Environments 2018, 5, 30. [Google Scholar] [CrossRef]
  22. Di Toro, D.M.; Allen, H.E.; Bergman, H.L.; Meyer, J.S.; Paquin, P.R.; Santore, R.C. Biotic ligand model of the acute toxicity of metals. 1. Technical basis. Environ. Toxicol. Chem. 2001, 20, 2383–2396. [Google Scholar] [CrossRef]
  23. Fortin, C.; Denison, F.H.; Garnier-Laplace, J. Metal-phytoplankton interactions: Modeling the effect of competing ions (H+, Ca2+, and Mg2+) on uranium uptake. Environ. Toxicol. Chem. 2007, 26, 242–248. [Google Scholar] [CrossRef]
  24. Tudesque, L.; Grenouillet, G.; Gevrey, M.; Khazraie, K.; Brosse, S. Influence of small-scale gold mining on French Guiana streams: Are diatom assemblages valid disturbance sensors? Ecol. Indic. 2012, 14, 100–106. [Google Scholar] [CrossRef]
  25. Luís, A.T.; Teixeira, P.; Alexander, A.C.; Almeida, S.F.P.; da Silva, E.F.; Culp, J.M. Benthic diatom communities in streams from zinc mining areas in continental (Canada) and Mediterranean climates (Portugal). Water Qual. Res. J. Can. 2013, 48, 180–191. [Google Scholar] [CrossRef] [Green Version]
  26. Luís, A.T.; Teixeira, P.; Almeida, S.F.P.; Matos, J.X.; da Silva, E.F. Environmental impact of mining activities in the Lousal area (Portugal): Chemical and diatom characterization of metal-contaminated stream sediments and surface water of Corona stream. Sci. Total Environ. 2011, 409, 4312–4325. [Google Scholar] [CrossRef] [PubMed]
  27. Zalack, J.T.; Smucker, N.; Vis, M. Development of a diatom index of biotic integrity for acid mine drainage impacted streams. Ecol. Indic. 2010, 10, 287–295. [Google Scholar] [CrossRef]
  28. Morin, S.; Duong, T.T.; Dabrin, A.; Coynel, A.; Herlory, O.; Baudrimont, M.; Delmas, F.; Durrieu, G.; Schäfer, J.; Winterton, P.; et al. Long term survey of heavy metal pollution, biofilm contamination and diatom community structure in the Riou-Mort watershed, South West France. Environ. Pollut. 2008, 151, 532–542. [Google Scholar] [CrossRef] [PubMed]
Figure 1. Sampling stations around the Expo and Mesamax mining sites (shaded areas). The treated wastewater effluents from the Expo site are discharged a few km downstream (pink line representing treated sewage pipe). Control stations are underlined.
Environments 06 00074 g001
Figure 2. Principal Component Analyses (axes 1 and 2) showing station distribution based on diatom assemblages collected in July (a) and August (b) of 2014–2016 (1 = 2014, 2 = 2015, 3 = 2016). Samples are color-coded according to the biotype they belong to. The dashed line groups the samples from Ex3 where all six diatom assemblages collected belong to biotype 4. The solid line groups the samples from the control station C1Ex where diatom assemblages belong to biotypes 1 and 3 depending on the sampling date. Samples in bold showed variability in diatom assemblages throughout the study.
Environments 06 00074 g002
Figure 3. Box-plots showing the distribution of water chemistry data for each biotype. Data (except pH) are presented on a log10 scale.
Environments 06 00074 g003
Figure 4. Box-plot showing the distribution of teratology (percentages) between control stations and stations receiving treated mine effluents or nonpoint source contamination from mining activities.
Environments 06 00074 g004
Table 1. Physico-chemical characteristics (mean and standard errors in brackets) for the 17 sampling stations.
StationspHNiCuCdMgCaClNO3SO4CODPO4
µMµMnMmMmMµMµMmMmg/LnM
EX16.9(0.3)0.29(0.05)0.04(0.04)0.47(0.51)0.17(0.05)0.15(0.05)65(38)13.0(6.0)0.23(0.10)0.64(0.17)50(47)
EX24.9(0.6)56(26)6.1(4.7)16(17)1.18(0.24)0.30(0.07)51.0(9.7)59(14)1.67(0.34)0.78(0.35)96(58)
EX34.3(1.4)680(480)170(140)210(290)5.7(2.3)1.52(0.71)440(340)540(330)9.7(5.4)1.03(0.29)170(120)
EX46.3(0.9)42(66)10(13)15(24)0.55(0.40)0.23(0.10)77(48)38(26)0.78(0.55)0.83(0.23)61(38)
EX4C4.1(0.7)400(260)61(51)33(32)3.6(2.3)1.00(0.55)180(89)390(280)6.3(4.0)1.05(0.33)160(100)
EF06.6(0.7)19(24)3.4(4.7)3.8(3.0)0.35(0.14)0.19(0.07)40(11)22(13)0.53(0.28)1.16(0.21)82(35)
EF16.9(1.0)16(18)2.3(3.3)6.8(8.3)0.90(0.46)0.93(0.61)160(100)180(190)4.7(4.7)1.00(0.48)64(52)
EF26.6(0.5)12(11)1.9(2.1)3.3(2.2)0.68(0.22)0.72(0.27)72(17)53(31)1.47(0.64)1.22(0.19)64(44)
EF36.7(0.4)6.6(9.4)1.0(1.7)1.7(1.7)0.25(0.17)0.25(0.22)39(19)22(20)0.51(0.49)2.03(0.97)73(53)
M0*6.5(0.2)0.16(0.11)0.04(0.01)0.62(0.26)0.09(0.07)0.38(0.40)780(930)87(110)0.05(0.03)1.07(0.31)40(15)
M16.5(0.2)0.21(0.16)0.04(0.01)0.43(0.31)0.08(0.06)0.34(0.30)680(720)85(84)0.05(0.02)1.14(0.33)55(11)
M26.6(0.2)0.24(0.20)0.06(0.05)0.43(0.32)0.08(0.06)0.33(0.30)670(720)70(82)0.05(0.02)1.12(0.35)54(18)
M36.7(0.2)2.0(1.6)0.09(0.05)1.5(1.6)0.17(0.13)0.46(0.39)620(620)85(72)0.46(0.41)1.12(0.30)51(13)
M46.7(0.2)2.6(2.1)0.10(0.07)1.6(1.7)0.19(0.12)0.48(0.37)590(590)80(67)0.48(0.39)1.21(0.45)58.2(9.5)
MA6.7(0.2)0.86(0.71)0.07(0.06)0.54(0.27)0.24(0.18)0.74(0.32)1100(630)157(59)0.7(1.1)1.15(0.46)71(29)
C *6.8(0.6)0.09(0.07)0.03(0.02)0.08(0.17)0.06(0.02)0.03(0.01)21(123)2.5(2.6)0.01(0.00)2.62(0.91)60(26)
C1EX *6.6(0.4)0.11(0.03)0.03(0.02)0.21(0.26)0.22(0.11)0.12(0.05)18.8(8.5)6.2(3.8)0.31(0.15)1.23(0.35)44(21)
C2EX *6.3(0.4)0.04(0.01)0.02(0.01)0.07(0.10)0.02(0.01)0.03(0.01)17.0(9.9)3.2(2.1)0.02(0.01)1.63(0.53)71(22)
* Control stations.

